Downloaded 75 times
![How to use it?
Usage: splot [-o PNGFILE] [-w WIDTH] [-h HEIGHT] [-bh BARHEIGHT] [-tf TIMEFORMAT]
[-tickInterval TICKINTERVAL]
-o PNGFILE - filename to which the output will be written in PNG format.
If omitted, it will be shown in a window.
-w, -h - width and height of the resulting picture. Default 640x480.
-bh - height of the bar depicting each individual process. Default 5 pixels.
Use 1 or so if you have a lot of them.
-tf - time format, as in http://linux.die.net/man/3/strptime but with
fractional seconds supported via %OS - will parse 12.4039 or 12,4039
-tickInterval - ticks on the X axis will be this often (in millis).
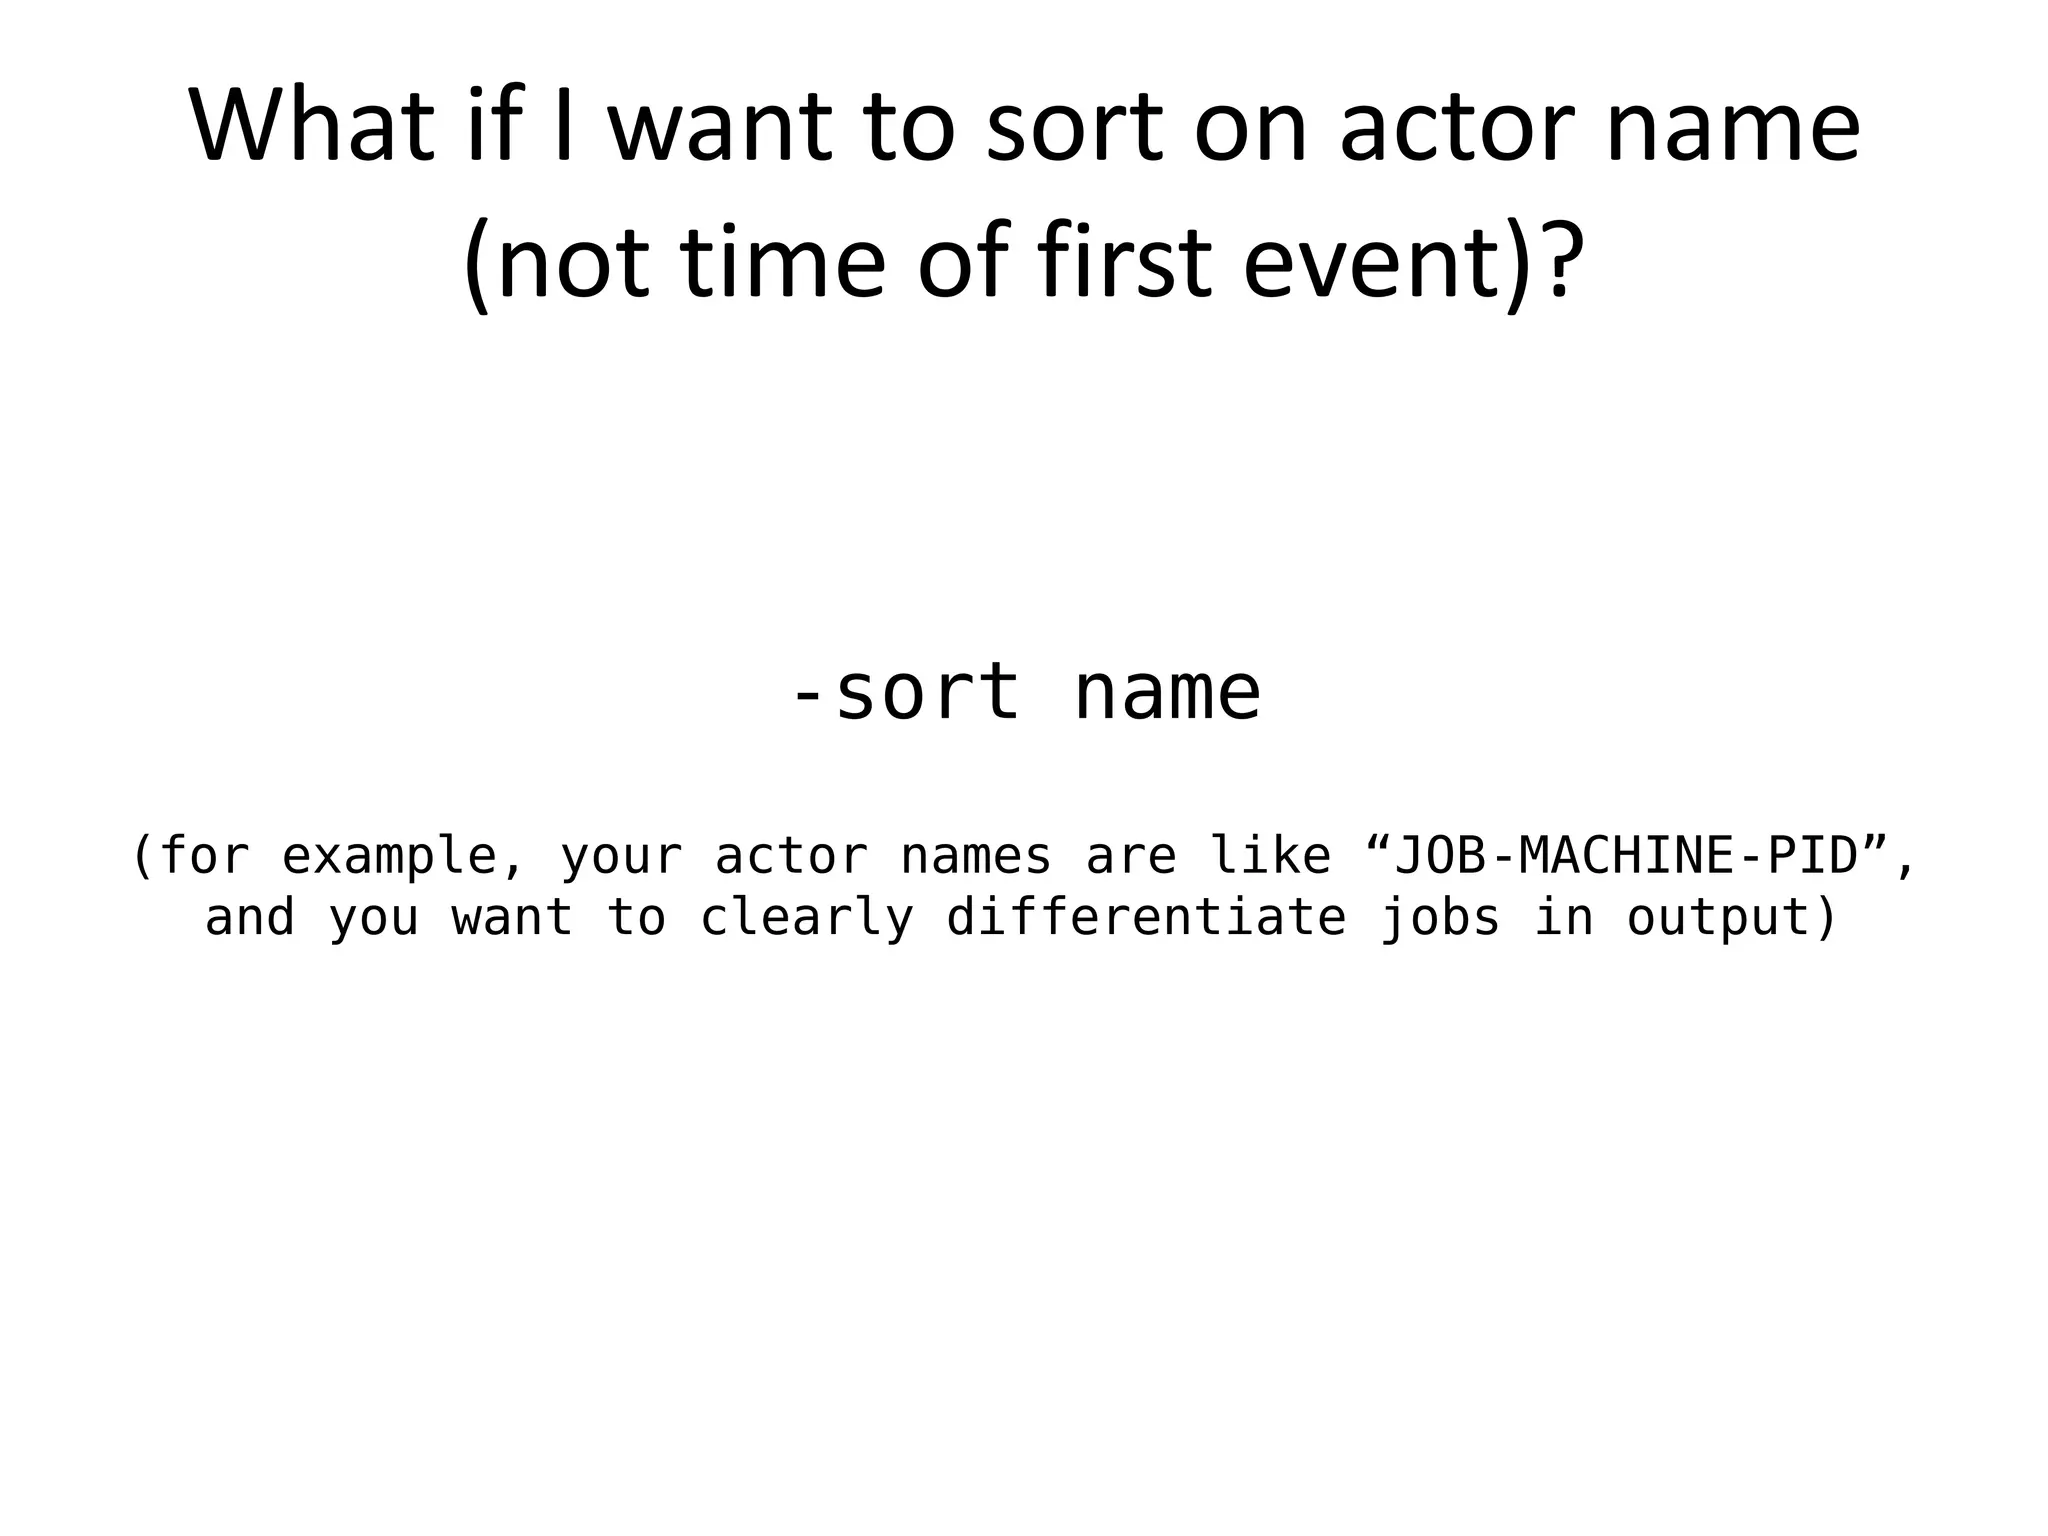
-sort SORT - sort tracks by SORT, where: 'time' - sort by time of first event,
'name' - sort by track name
Input is read from stdin. Example input (speaks for itself):
2010-10-21 16:45:09,431 >foo green
2010-10-21 16:45:09,541 >bar green
2010-10-21 16:45:10,631 >foo yellow
2010-10-21 16:45:10,725 >foo red
2010-10-21 16:45:10,930 >bar blue
2010-10-21 16:45:11,322 <foo
2010-10-21 16:45:12,508 <bar
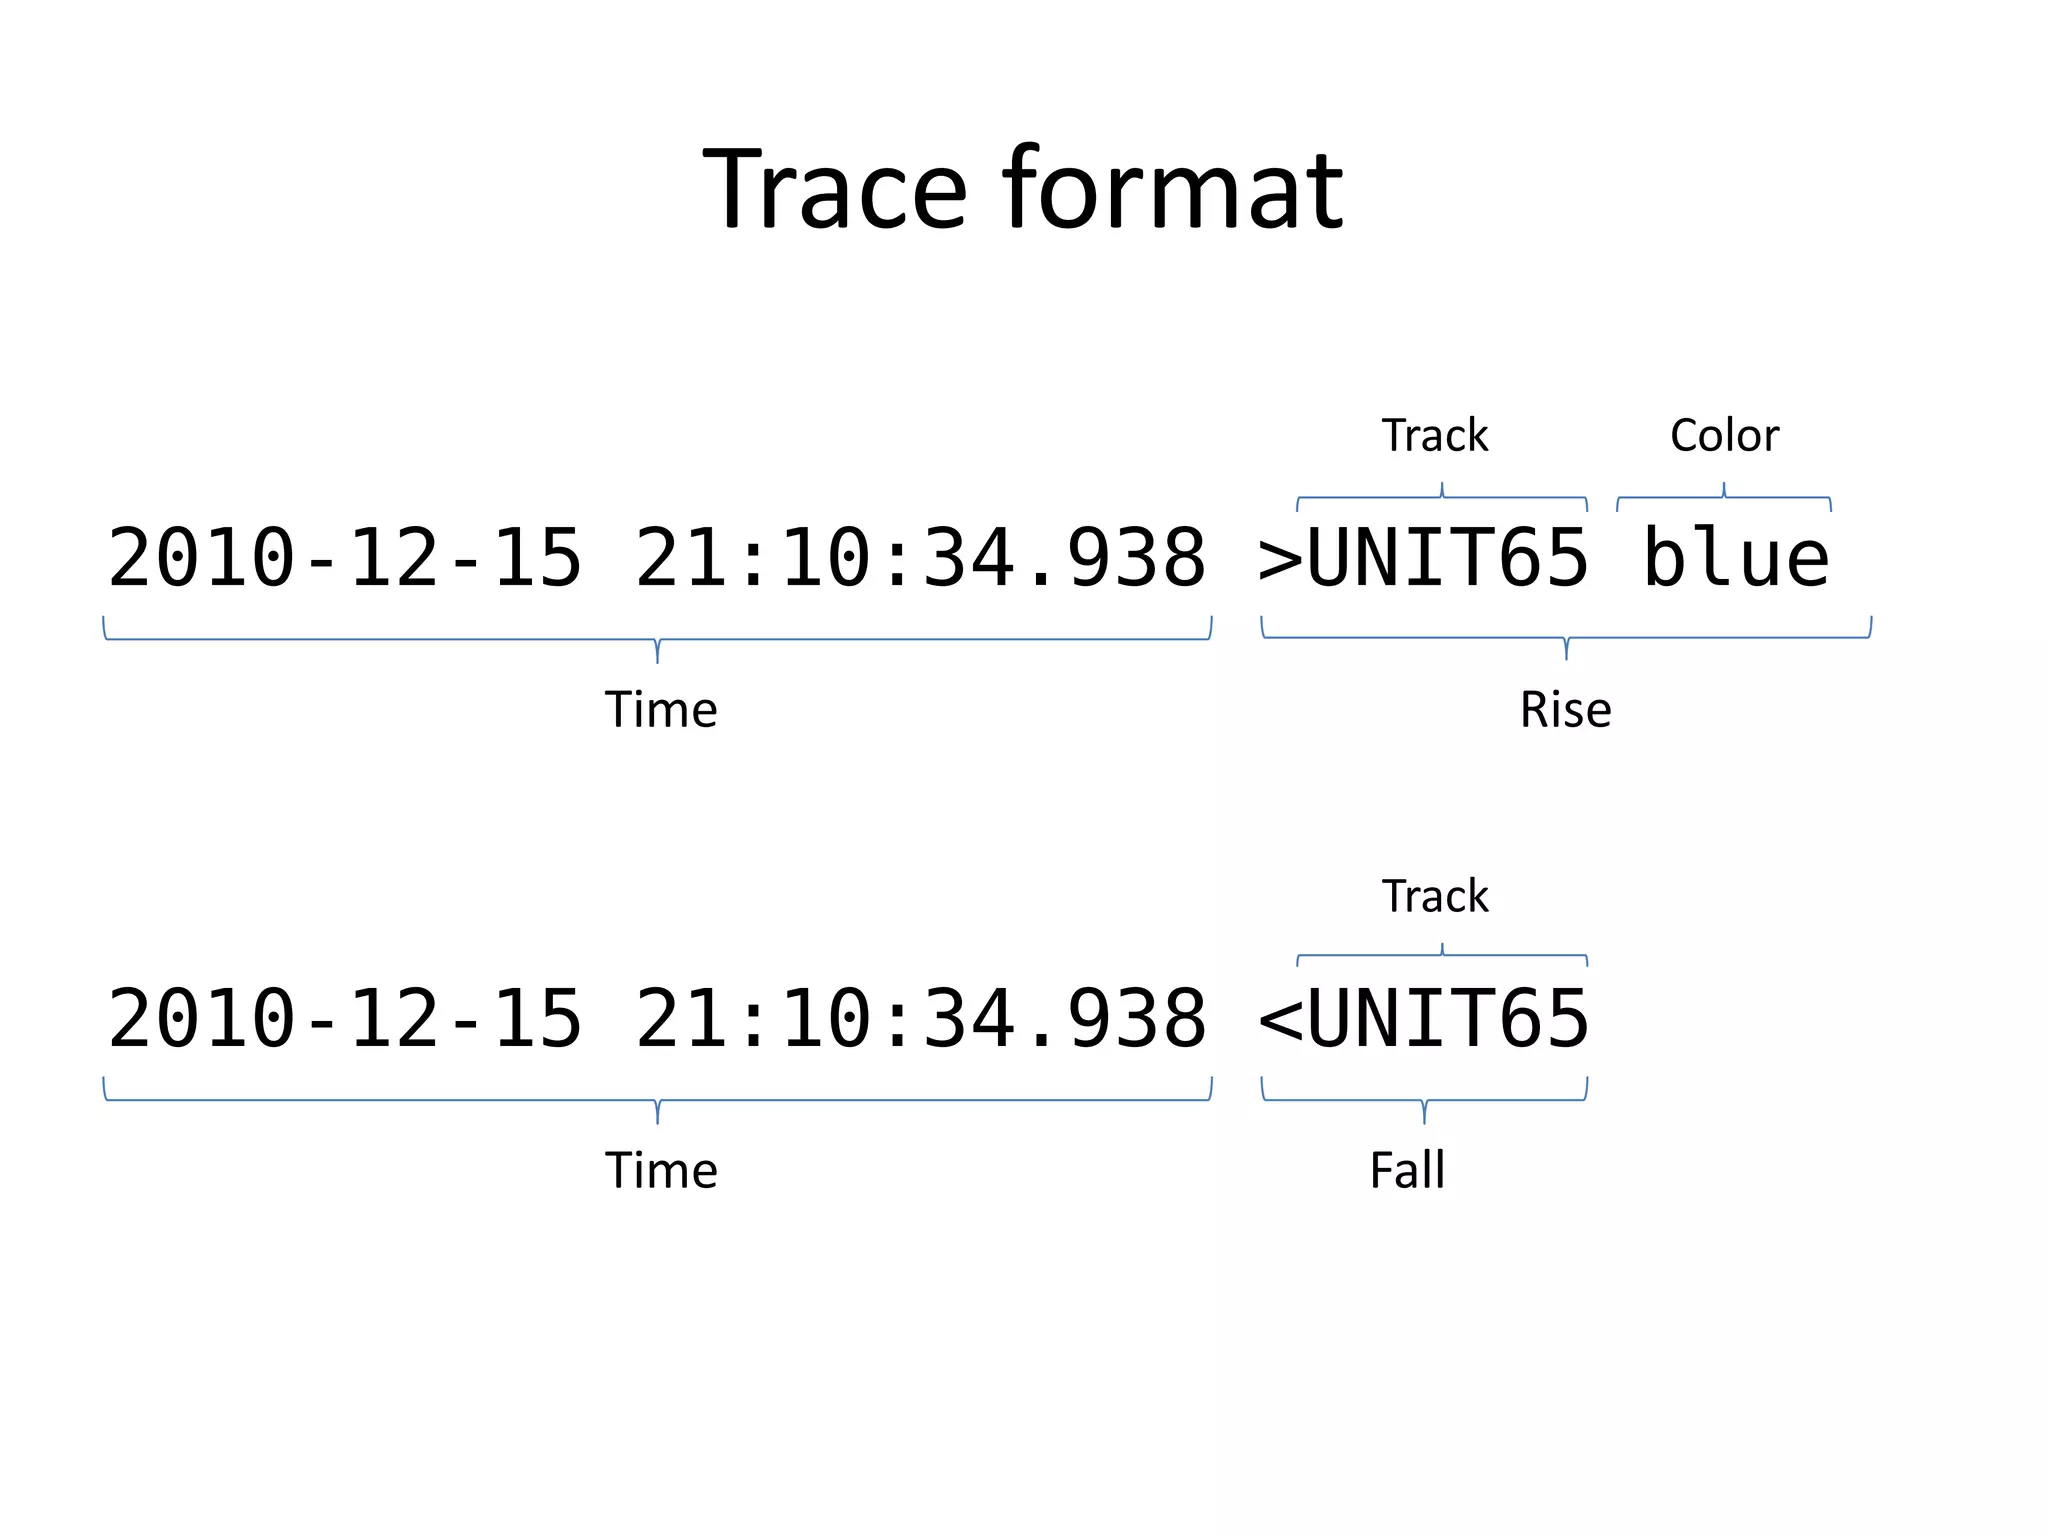
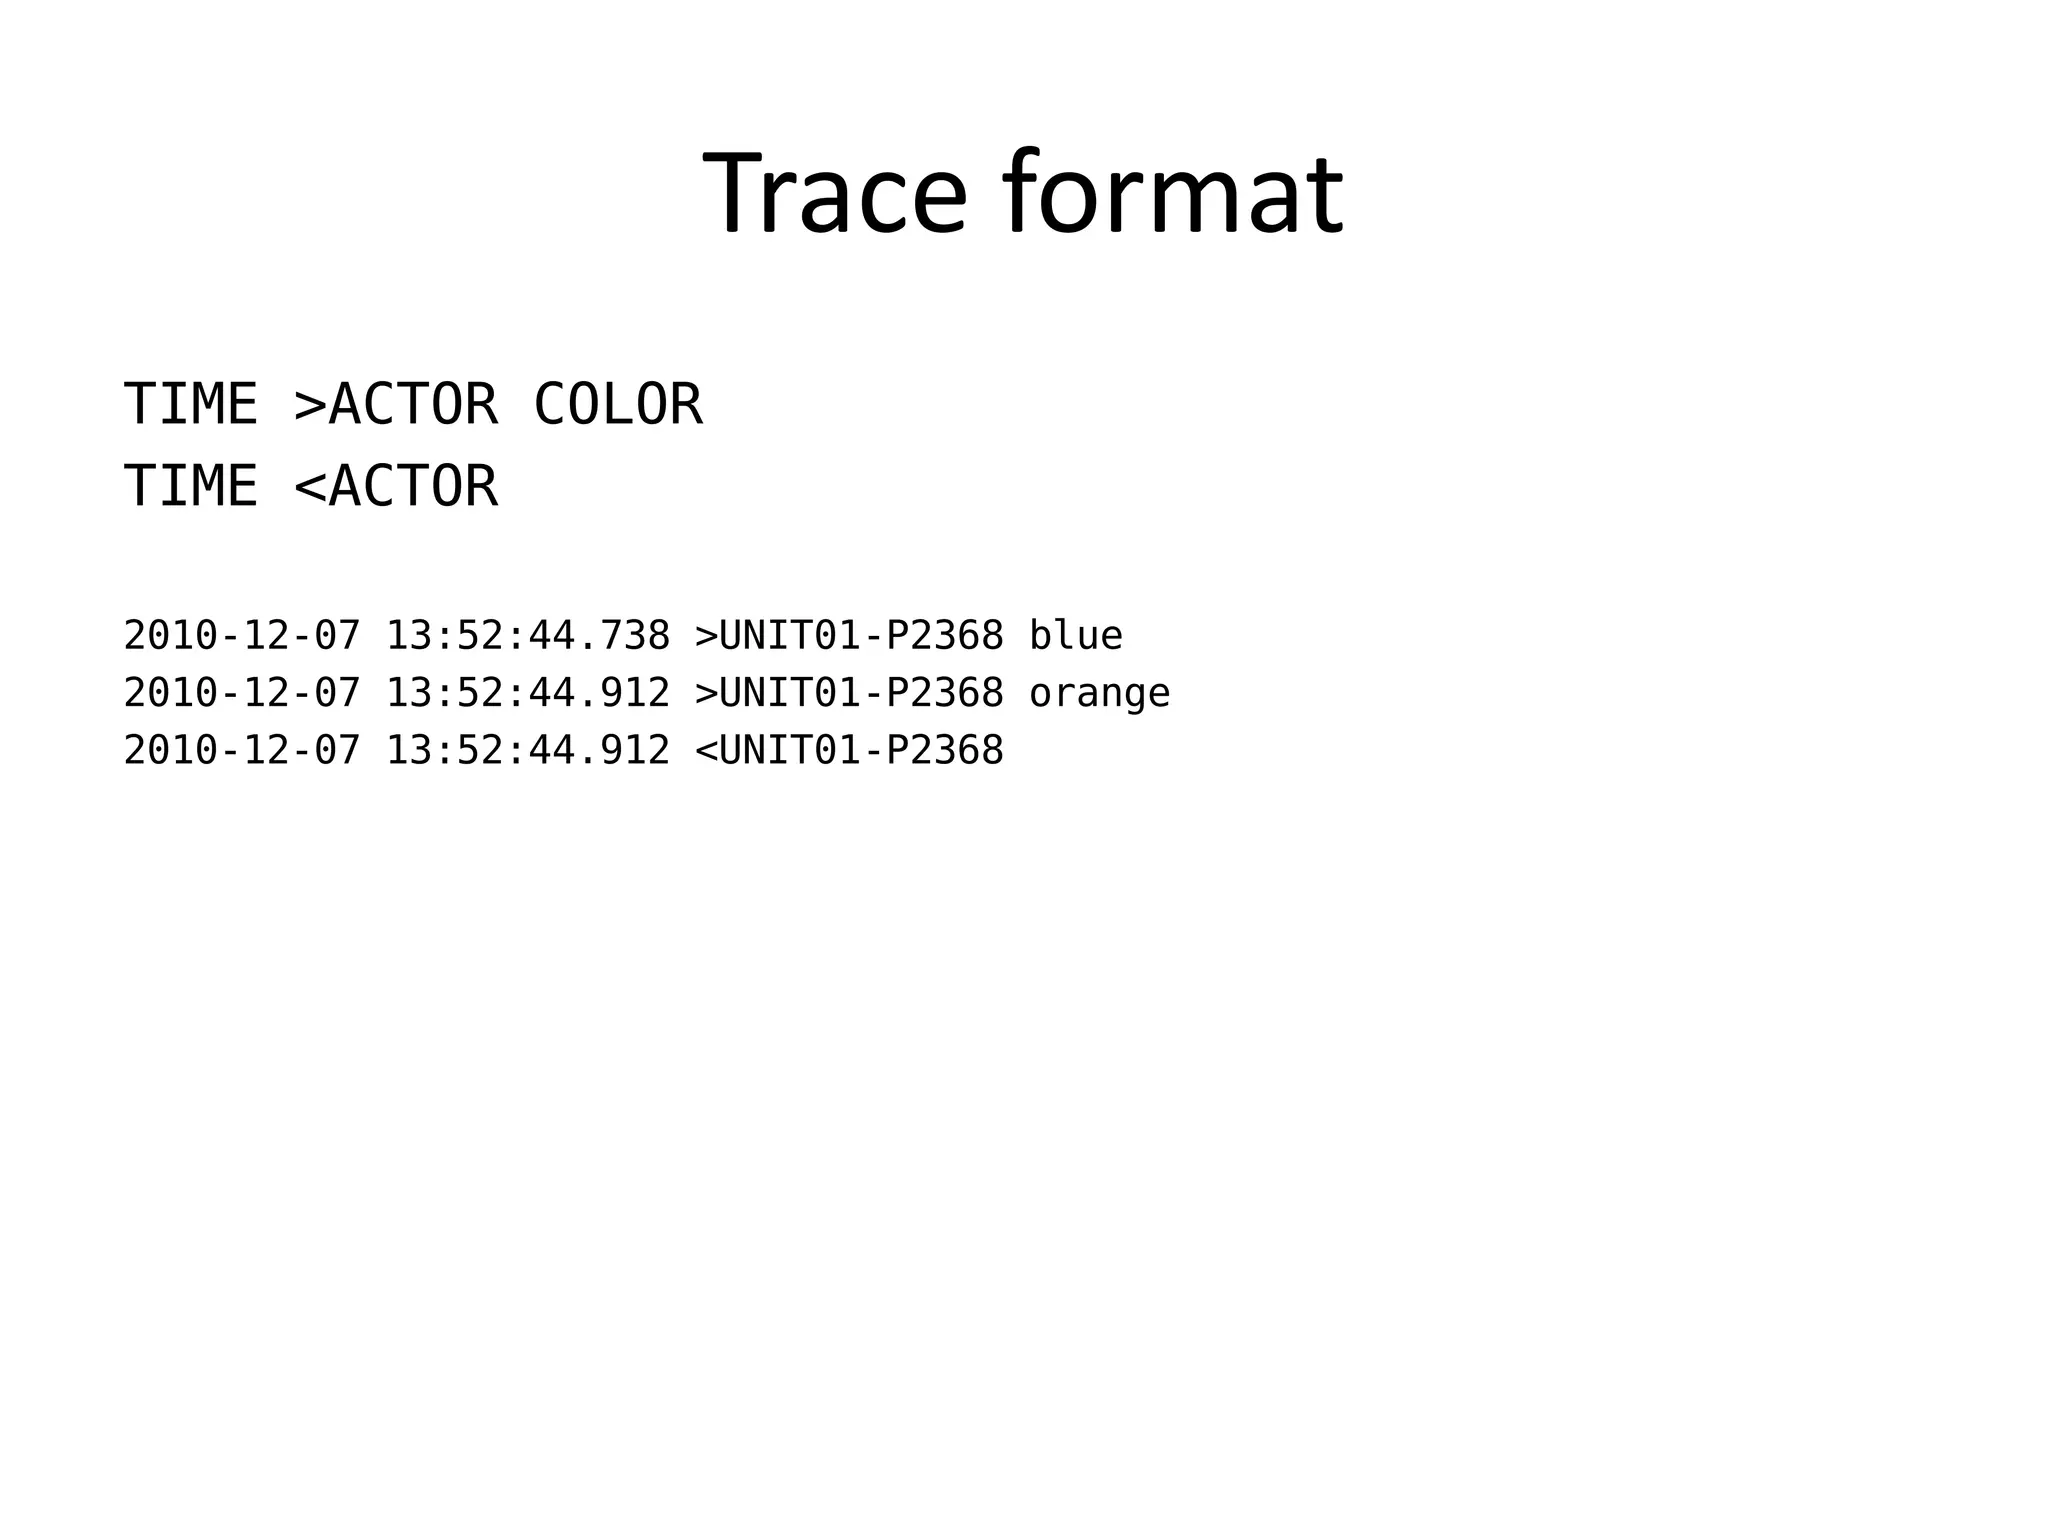
'>FOO COLOR' means 'start a bar of color COLOR on track FOO',
'<FOO' means 'end the current bar for FOO'.](https://image.slidesharecdn.com/twovisualizationtools-101216081249-phpapp01/75/Two-visualization-tools-15-2048.jpg)

![What if the time format is not
%Y-%m-%d %H:%M:%OS?
-tf ‘[%H-%M-%OS %Y/%m/%d]’
(man strptime)
(%OS for fractional seconds)](https://image.slidesharecdn.com/twovisualizationtools-101216081249-phpapp01/75/Two-visualization-tools-26-2048.jpg)
![Guidelines
How to differentiate between actor groups?
– Make them of different colour
Log: …. Deliver JOBID.TASKID
BEGIN {color[0]="green"; color[1]="orange"}
{time=$3 " " $4; core=$1 "-" $9}
/Deliver/{id=$NF; sub(/..*/,"",id); job[core]=id;
print time " >" job[core] "-" core " " color[id%2]}
/End / {print time " <" job[core] "-" core}](https://image.slidesharecdn.com/twovisualizationtools-101216081249-phpapp01/75/Two-visualization-tools-41-2048.jpg)
![Example
awk 'BEGIN{color[0]="green"; color[1]="orange"}
{time=$3 " " $4; core=$1 "-" $9}
/Deliver/{id=$NF; sub(/..*/,"",id); job[core]=id;
print time " >" job[core] "-" core " " color[id%2]}
/End / {print time " <" job[core] "-" core}‘
"$f"
| splot -bh 1 -w 1400 -h 800 -tickInterval 30000 -o "$f.utilization.png“
-sort time -expire 15000](https://image.slidesharecdn.com/twovisualizationtools-101216081249-phpapp01/75/Two-visualization-tools-43-2048.jpg)
![It has slightly more options than splot
Usage: tplot [-o OFILE] [-of {png|pdf|ps|svg|x}] [-or 640x480] -if IFILE [-tf TF]
[-k Pat1 Kind1 -k Pat2 Kind2 ...] [-dk KindN] [-fromTime TIME] [-toTime TIME]
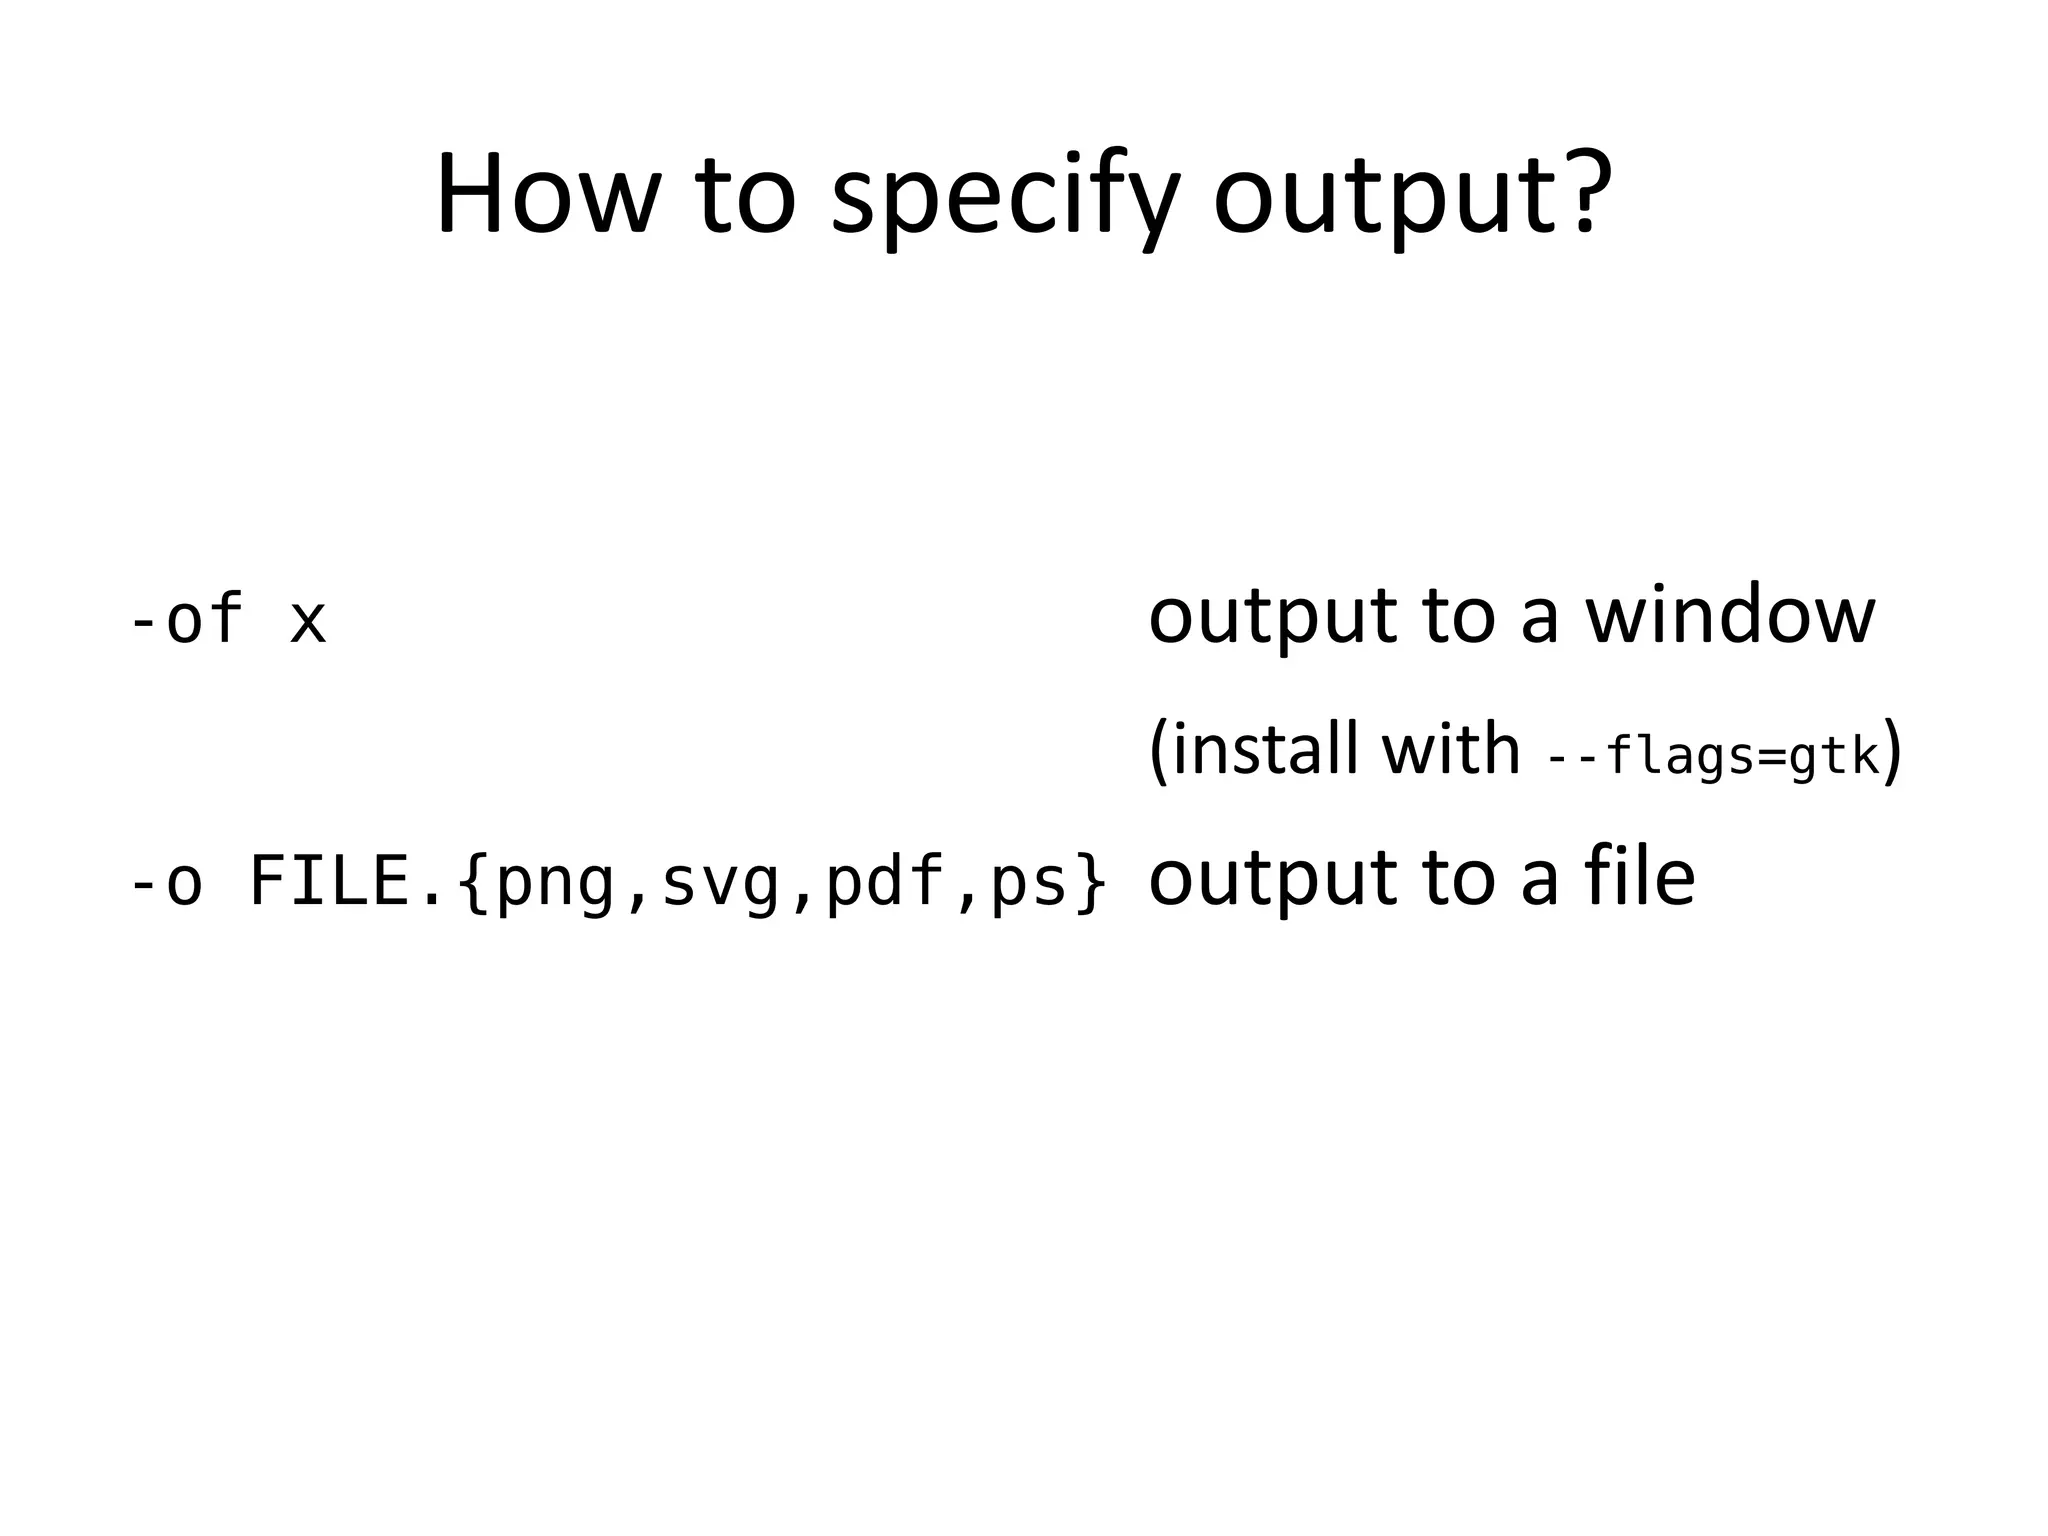
-o OFILE - output file (required if -of is not x)
-of - output format (x means draw result in a window, default: extension of -o)
x is only available if you installed timeplot with --flags=gtk
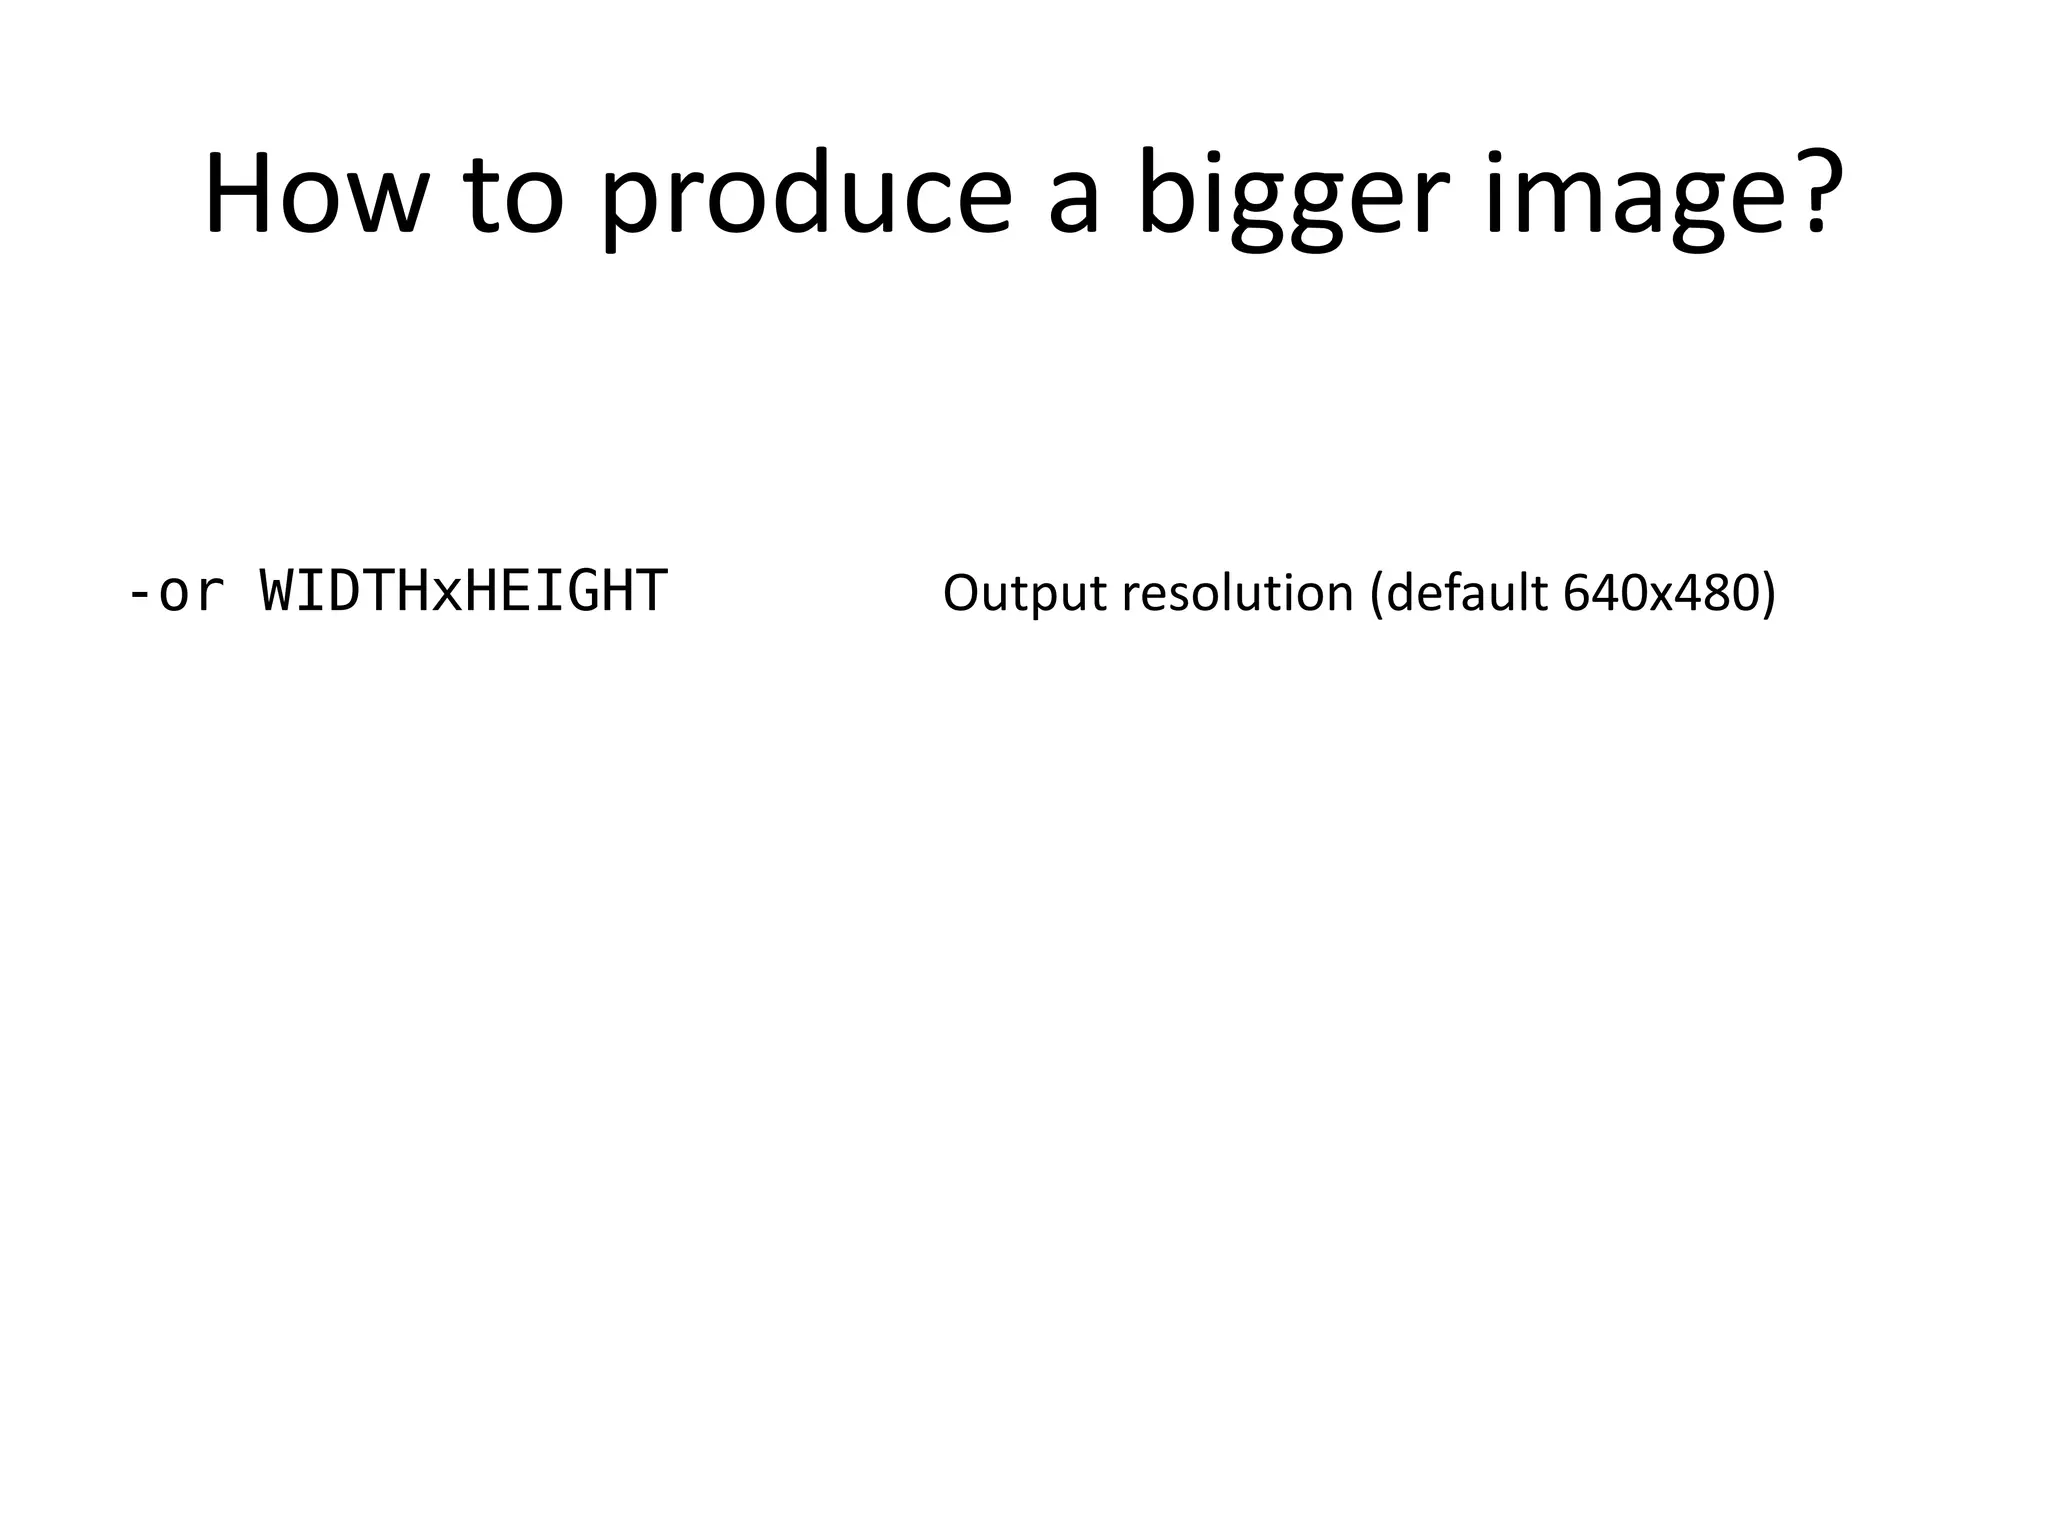
-or - output resolution (default 640x480)
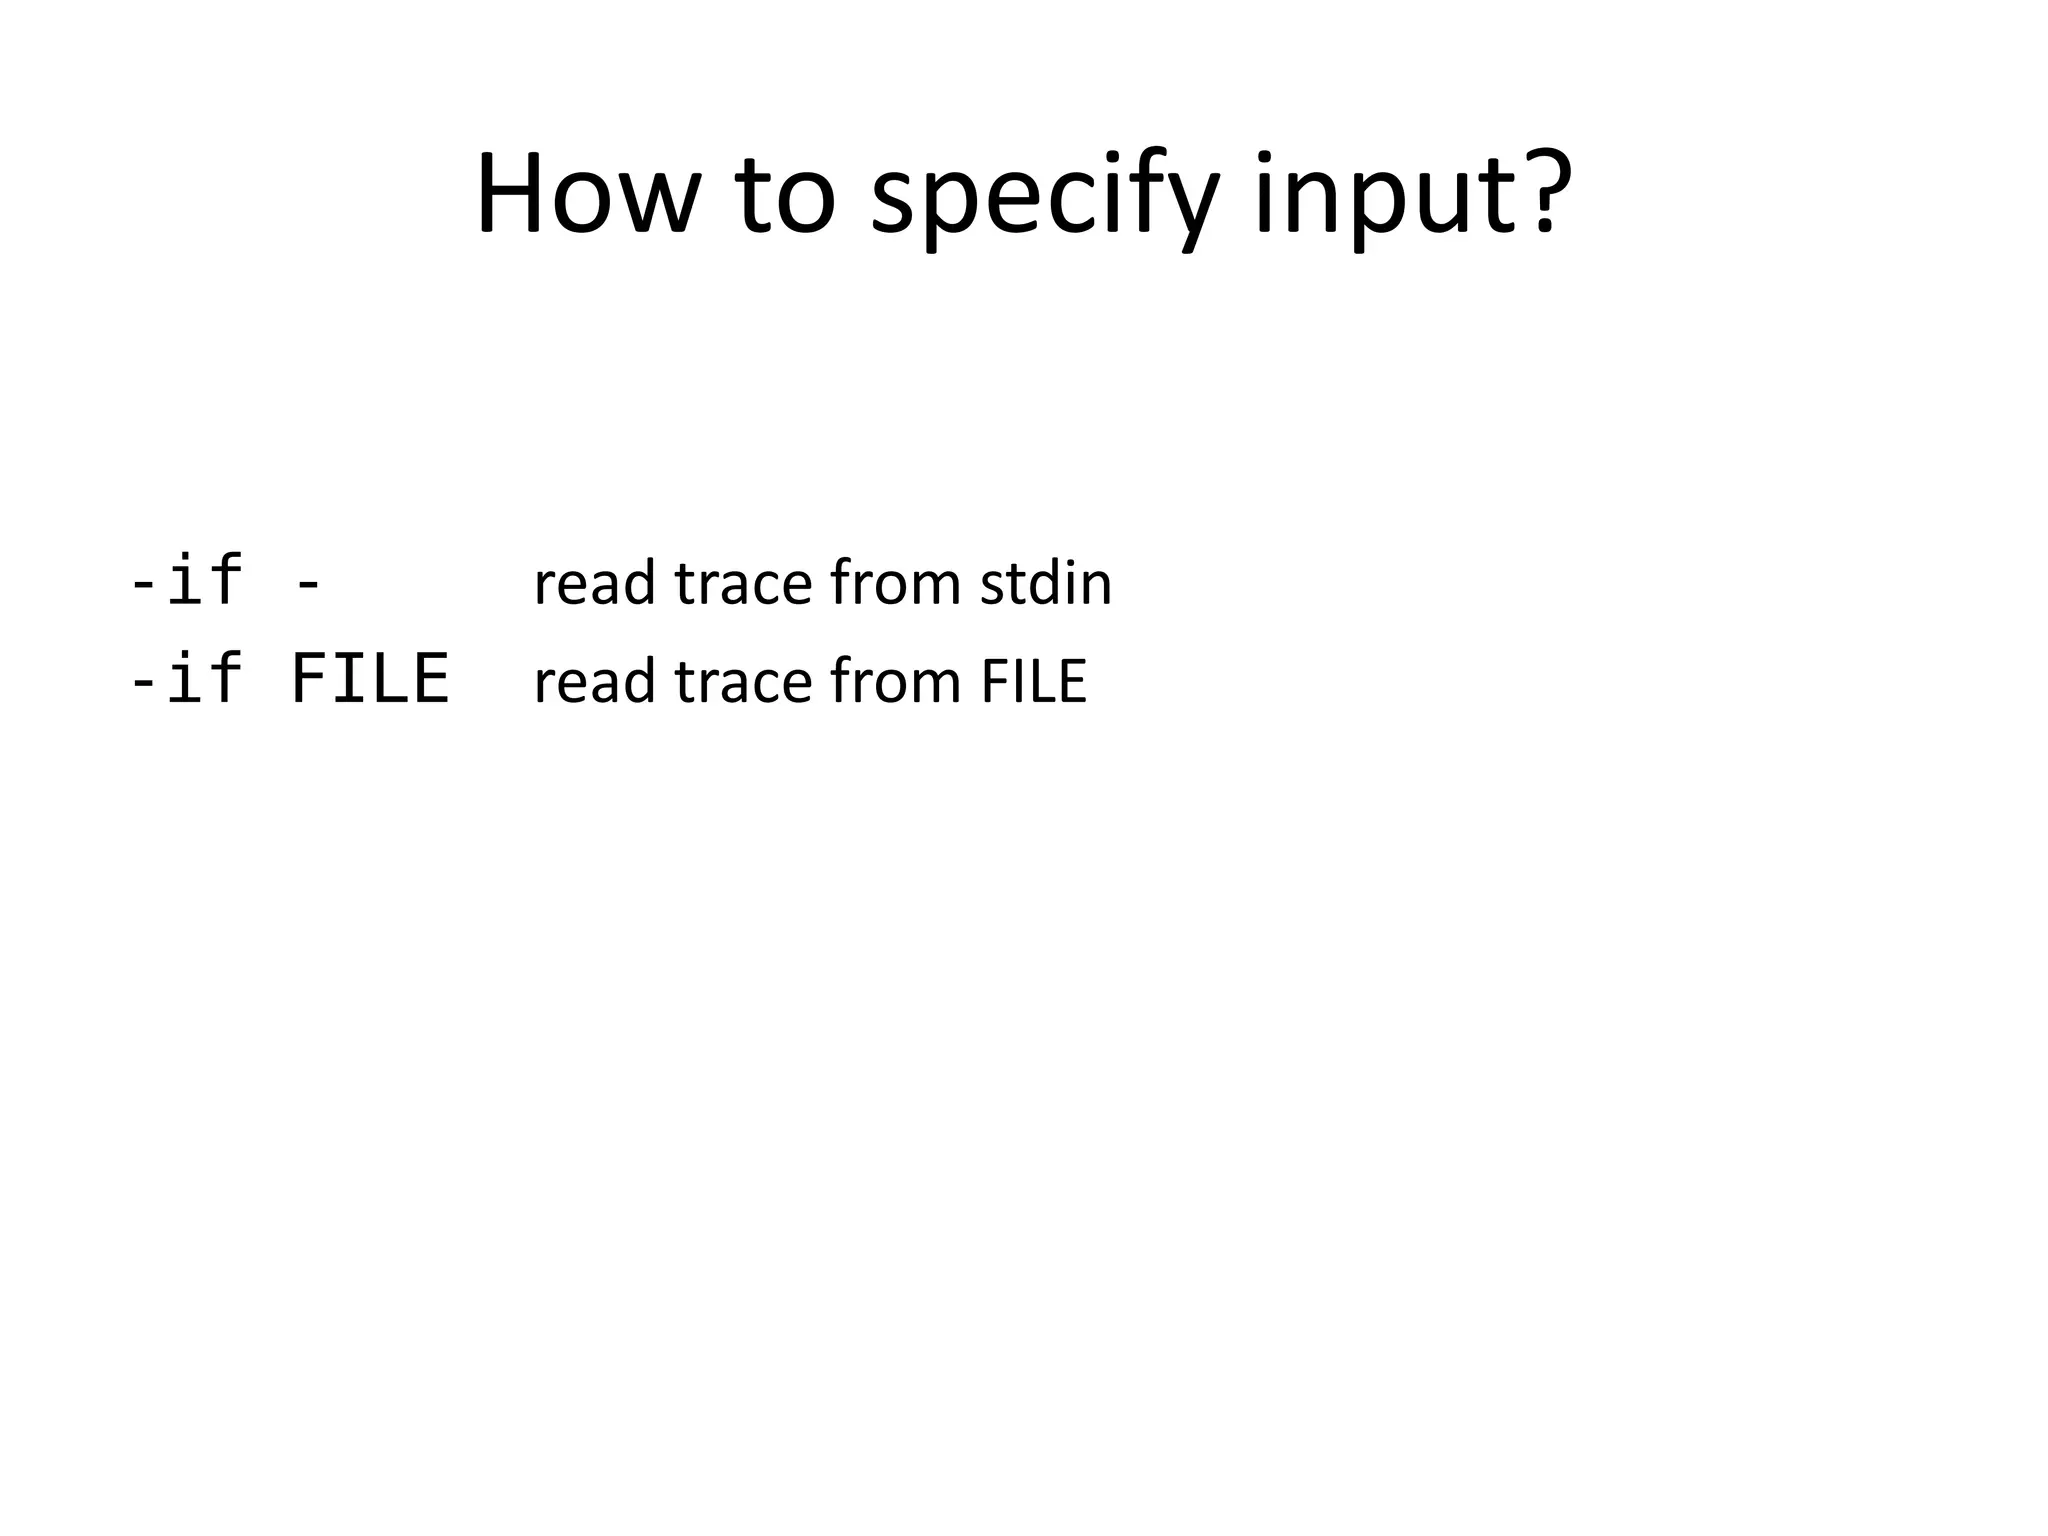
-if IFILE - input file; '-' means 'read from stdin'
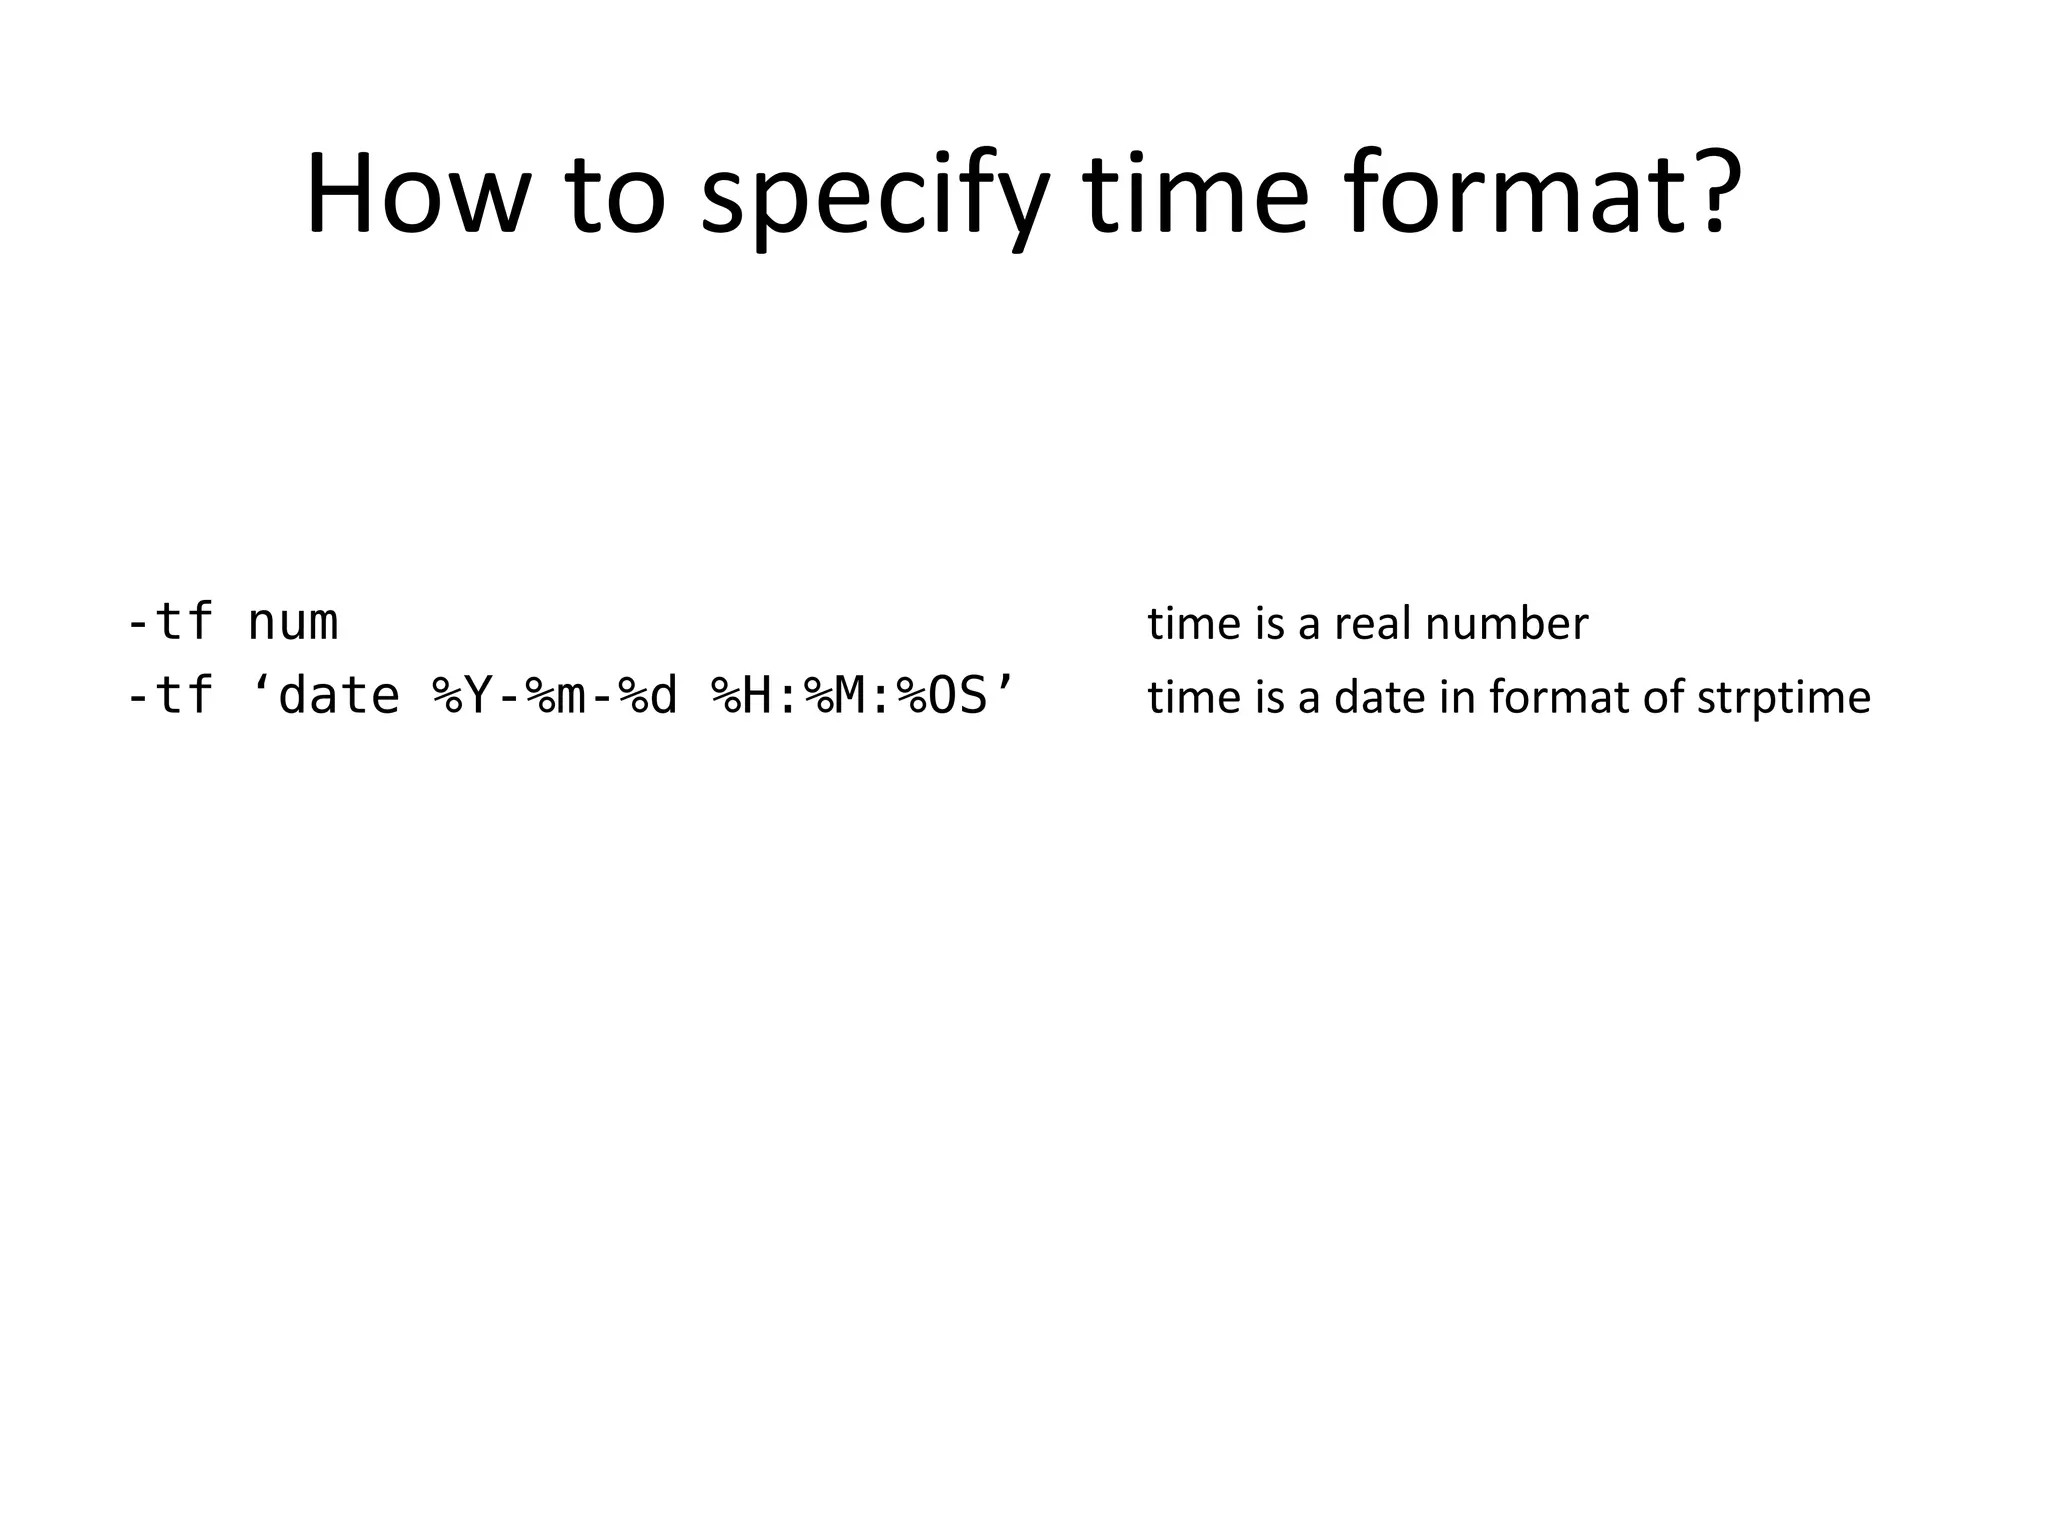
-tf TF - time format: 'num' means that times are floating-point numbers
(for instance, seconds elapsed since an event); 'date PATTERN' means that times are dates
in the format specified by PATTERN - see http://linux.die.net/man/3/strptime,
for example, [%Y-%m-%d %H:%M:%S] parses dates like [2009-10-20 16:52:43].
We also support %OS for fractional seconds (i.e. %OS will parse 12.4039 or 12,4039).
Default: 'date %Y-%m-%d %H:%M:%OS'
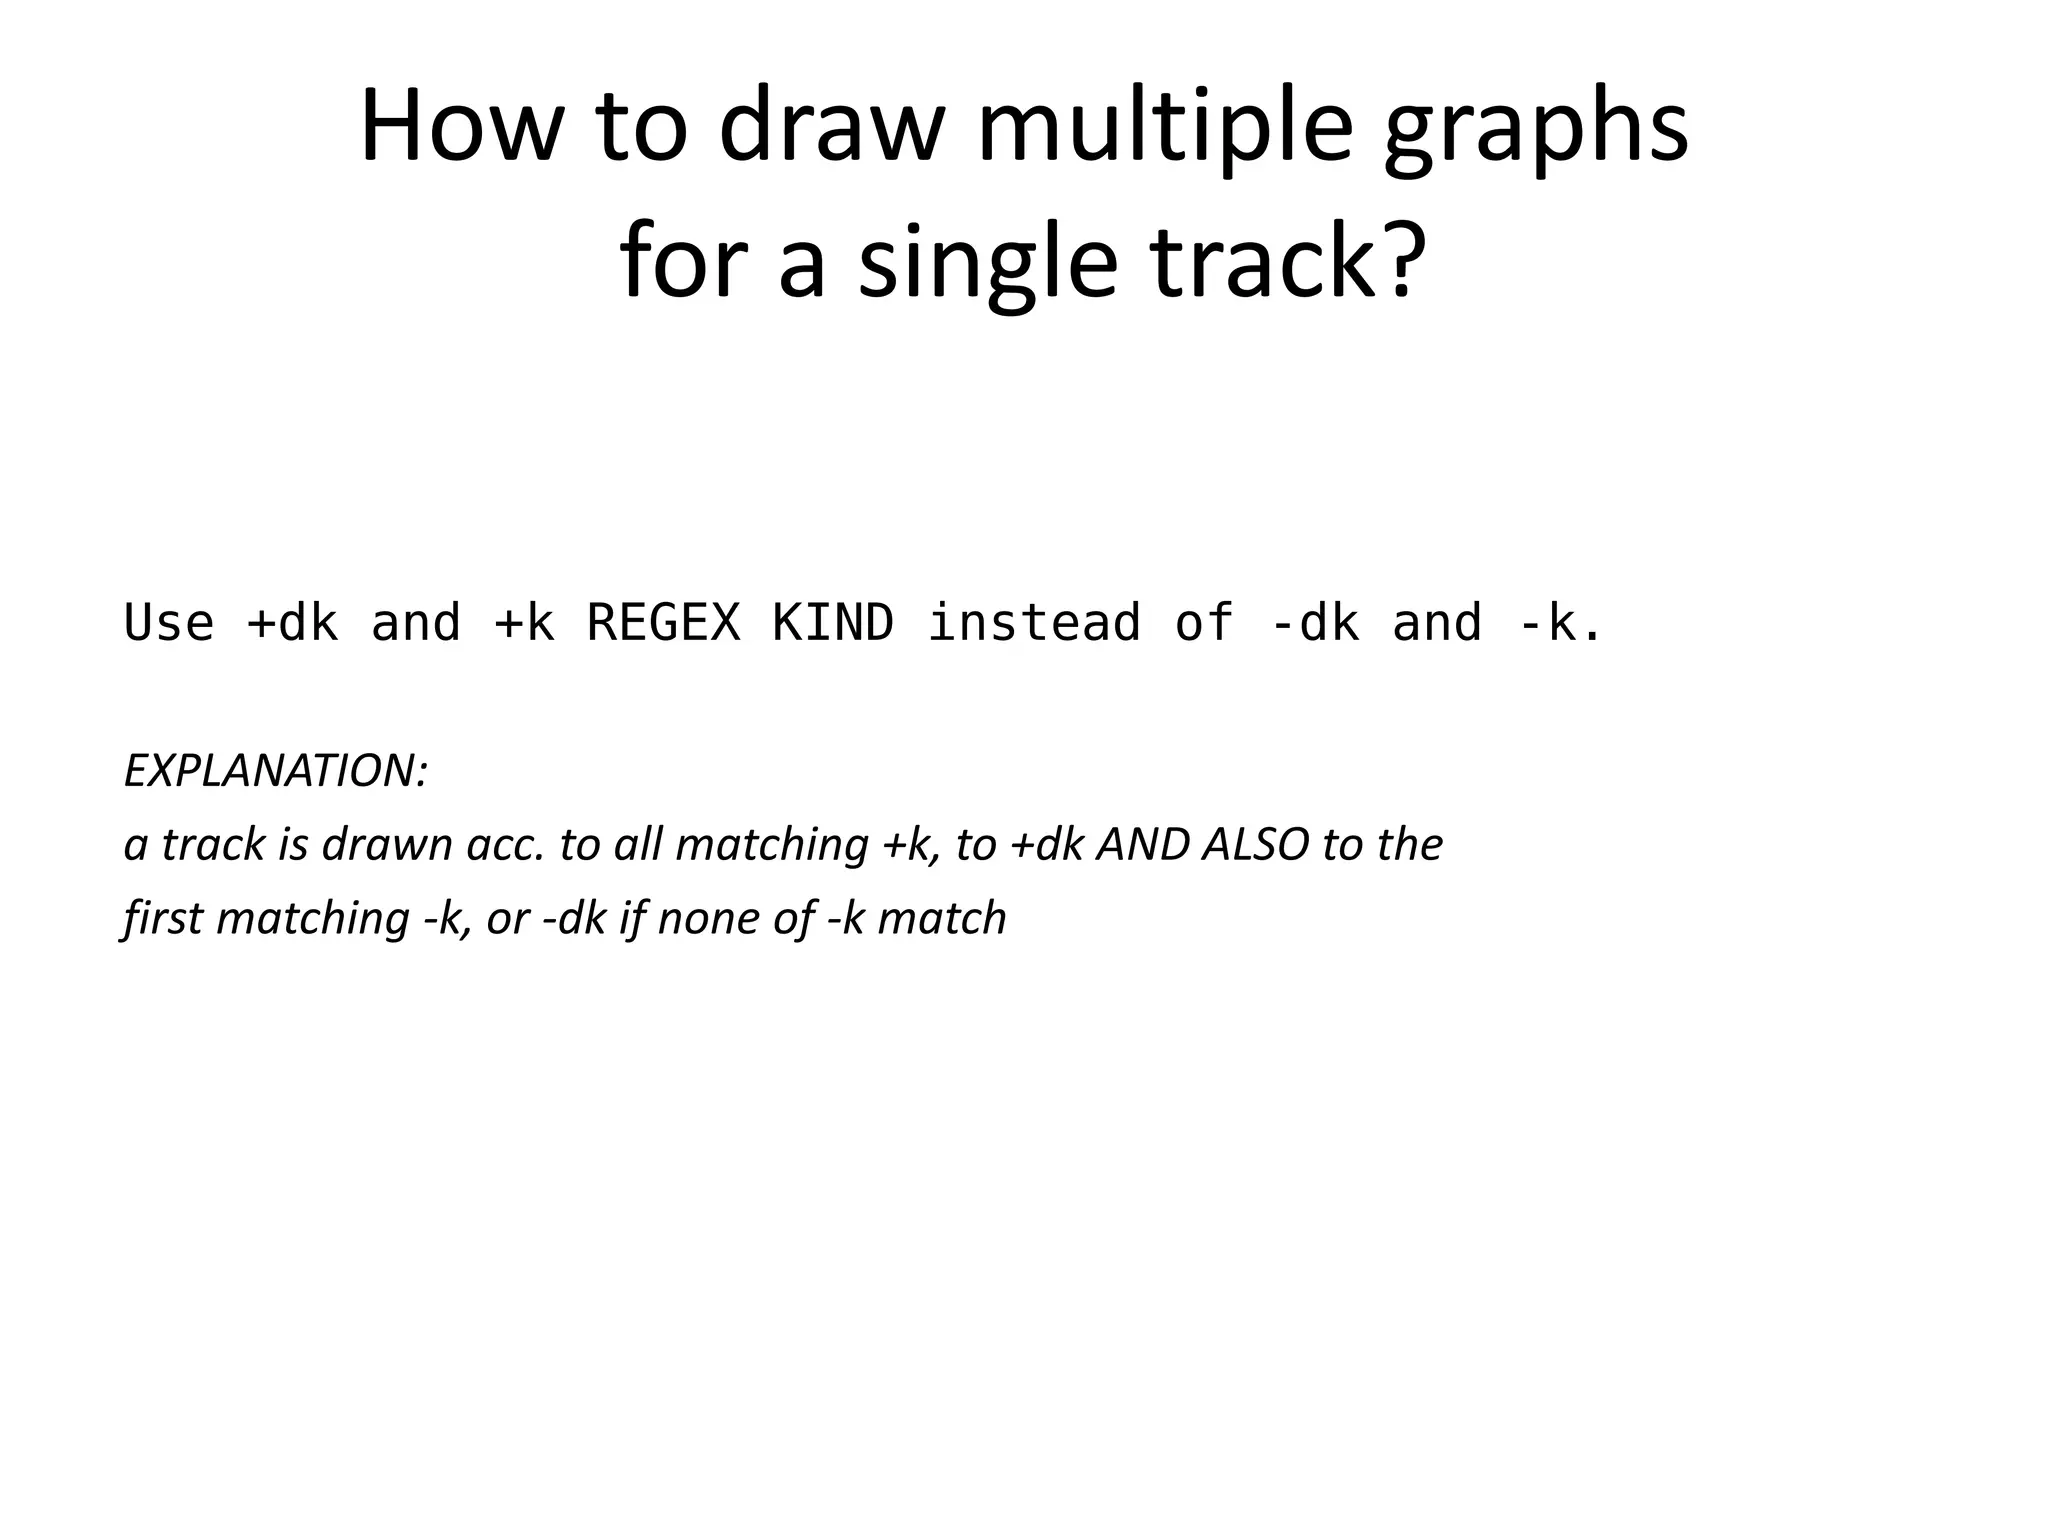
-k P K - set diagram kind for tracks matching regex P (in the format of regex-tdfa, which
is at least POSIX-compliant and supports some GNU extensions) to K
(-k clauses are matched till first success)
-dk - set default diagram kind
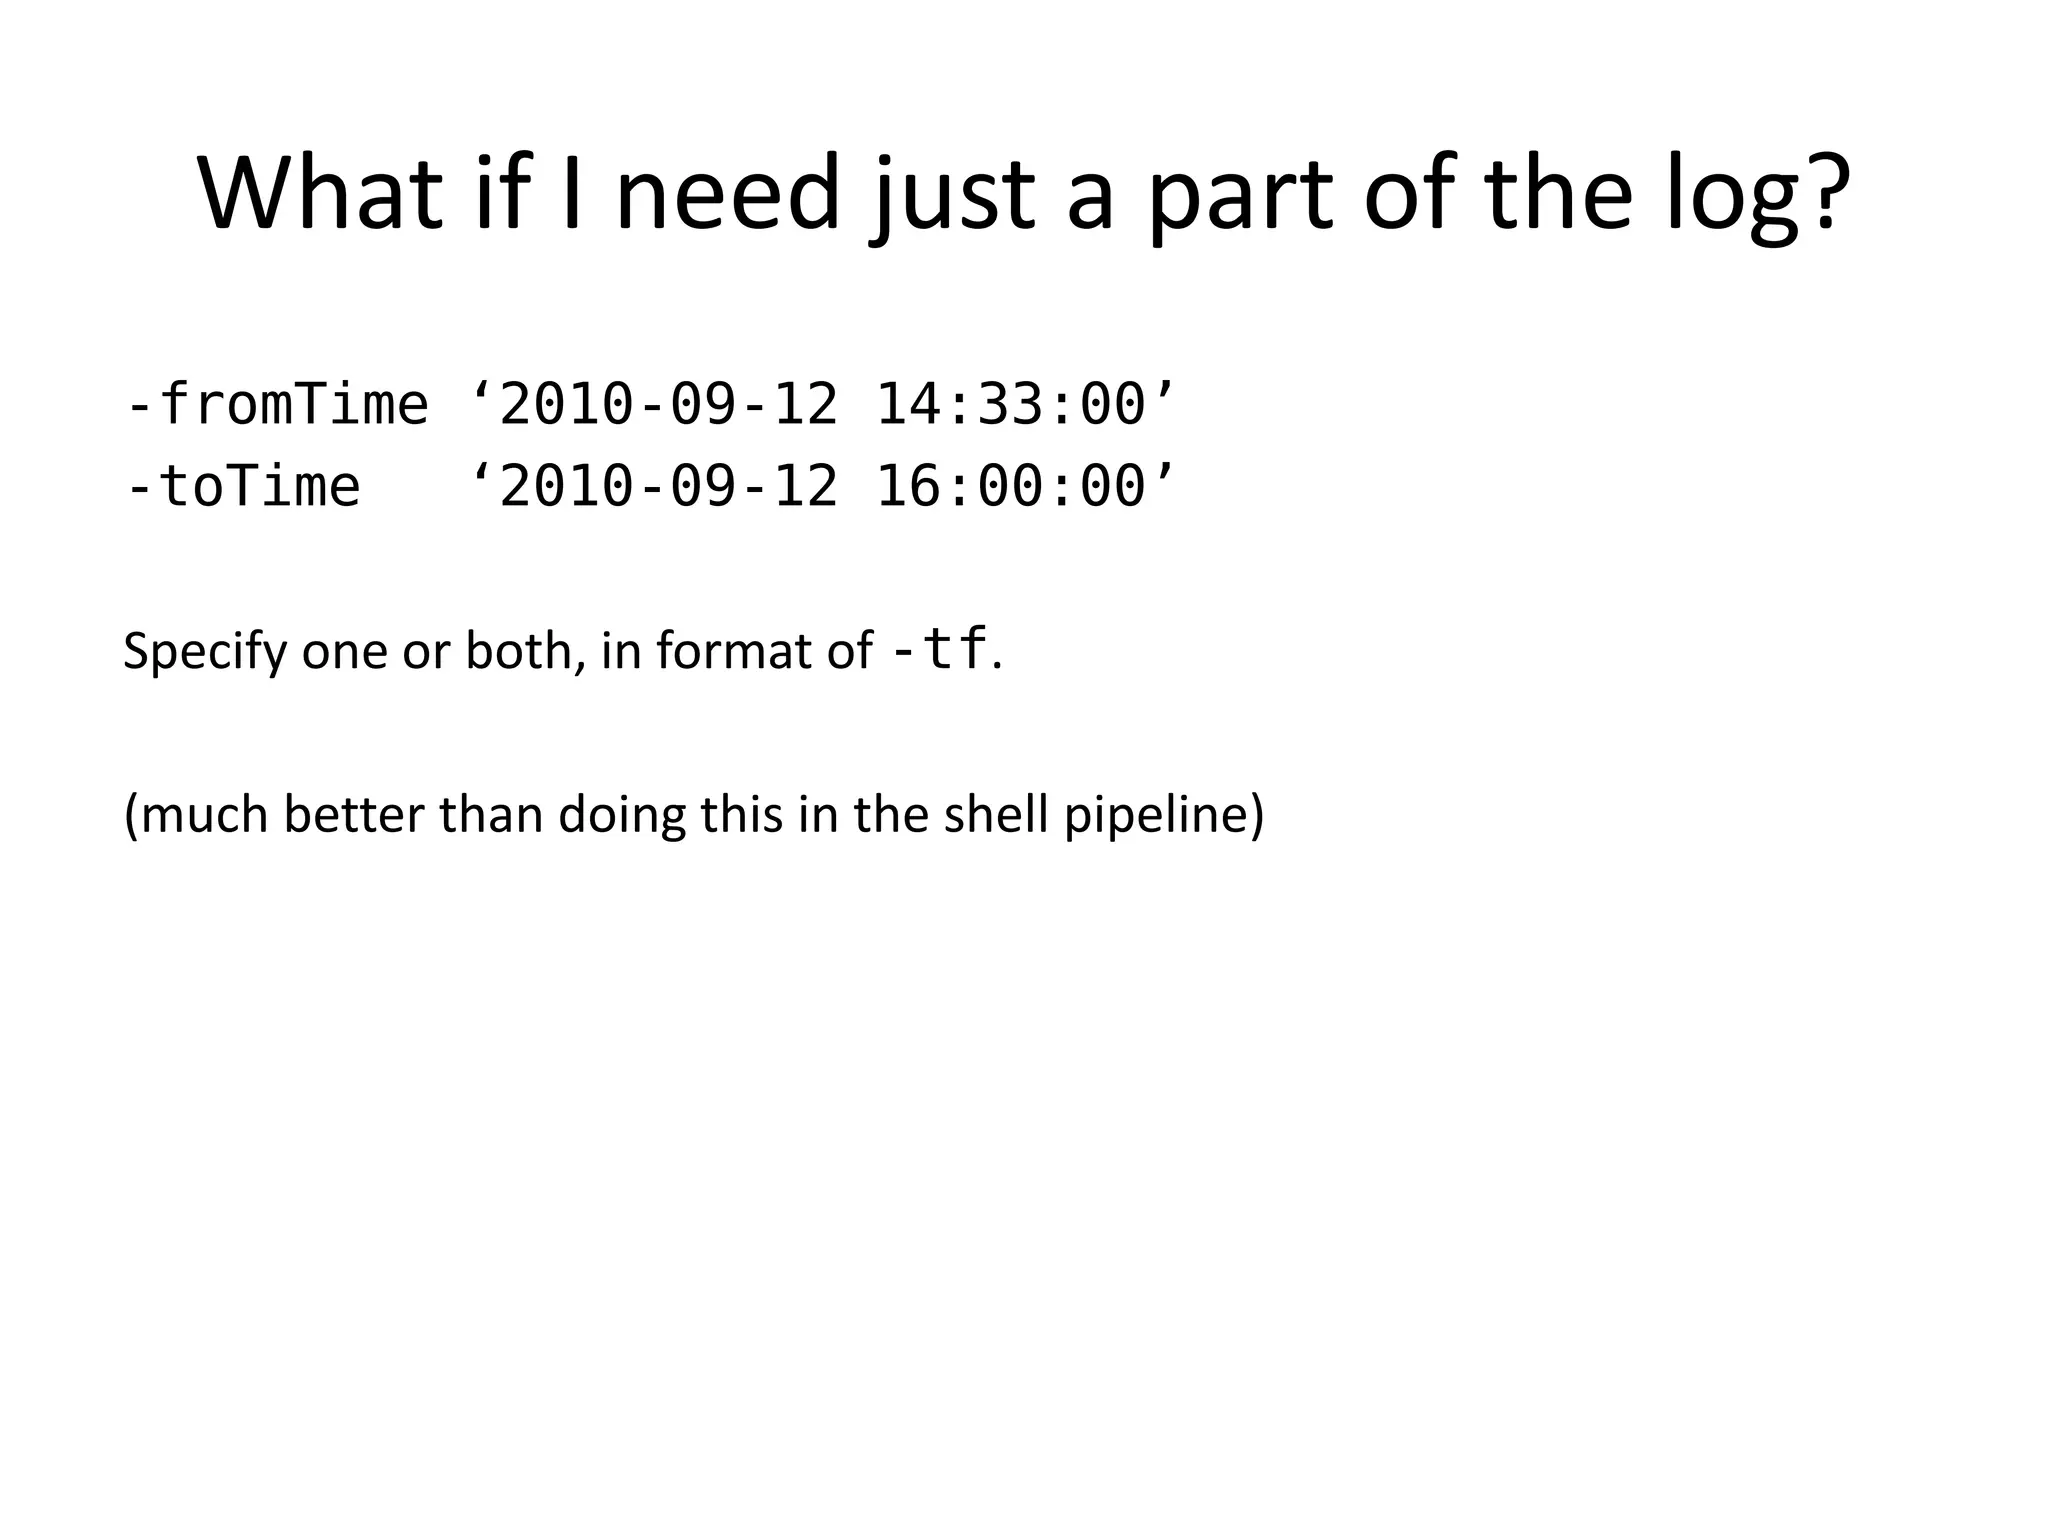
-fromTime - filter records whose time is >= this time (formatted according to -tf)
-toTime - filter records whose time is < this time (formatted according to -tf)
Input format: lines of the following form:
1234 >A - at time 1234, activity A has begun
1234 <A - at time 1234, activity A has ended
1234 !B - at time 1234, pulse event B has occured
1234 @B COLOR - at time 1234, the status of B became such that it is appropriate to draw it with color COLOR :)
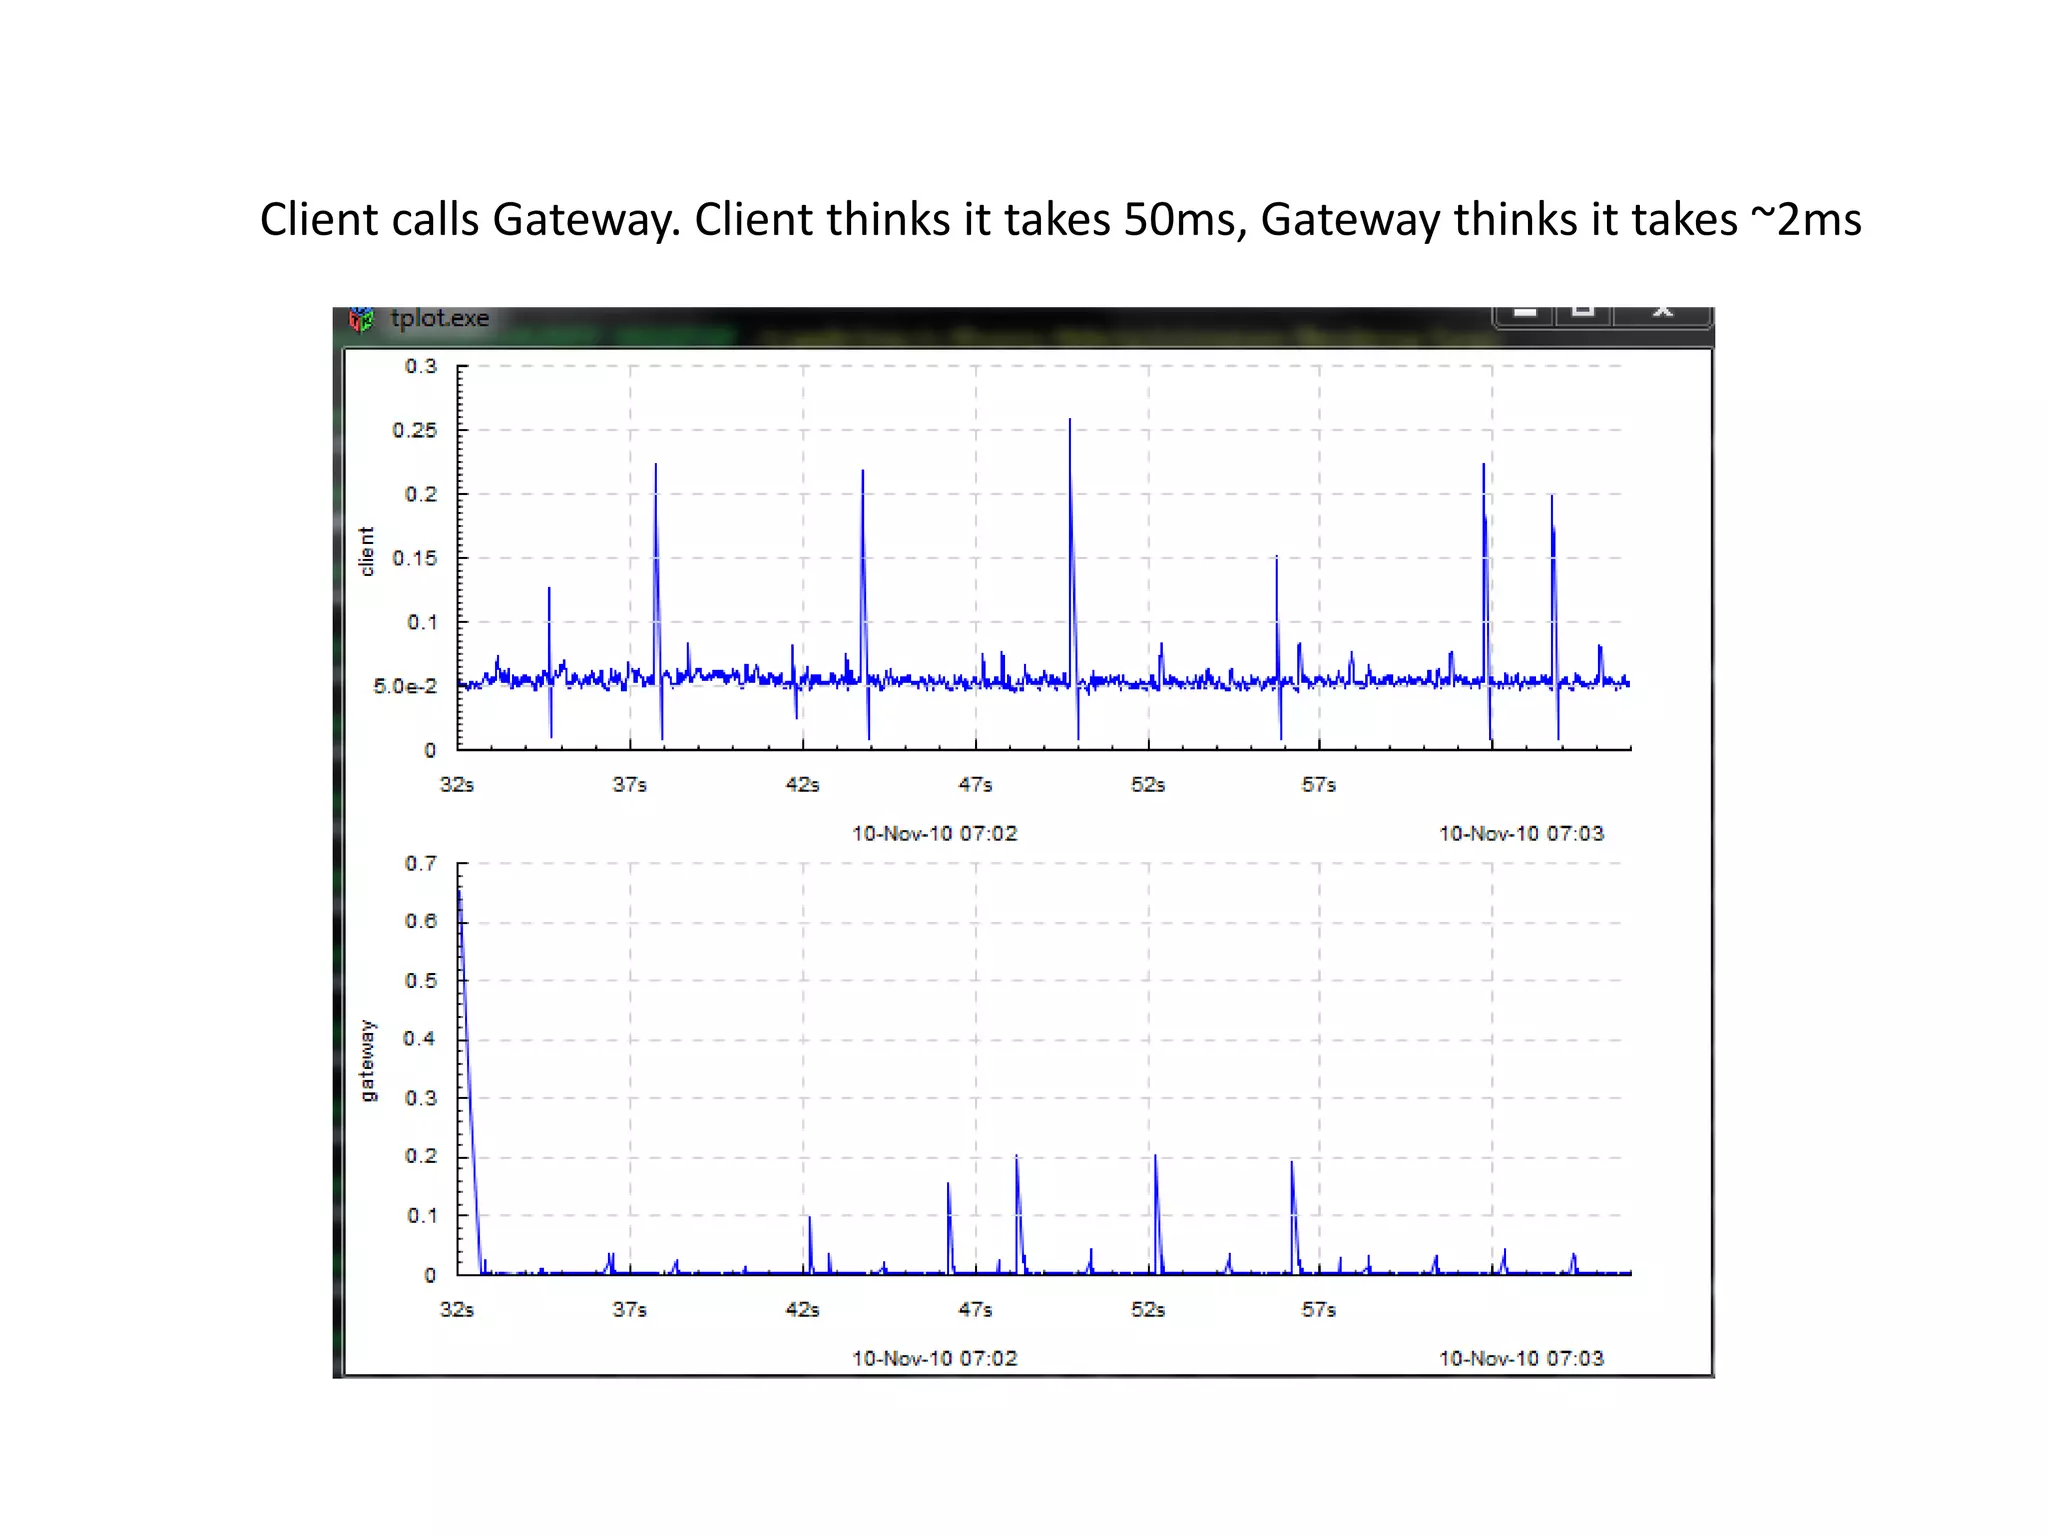
1234 =C VAL - at time 1234, parameter C had numeric value VAL (for example, HTTP response time)
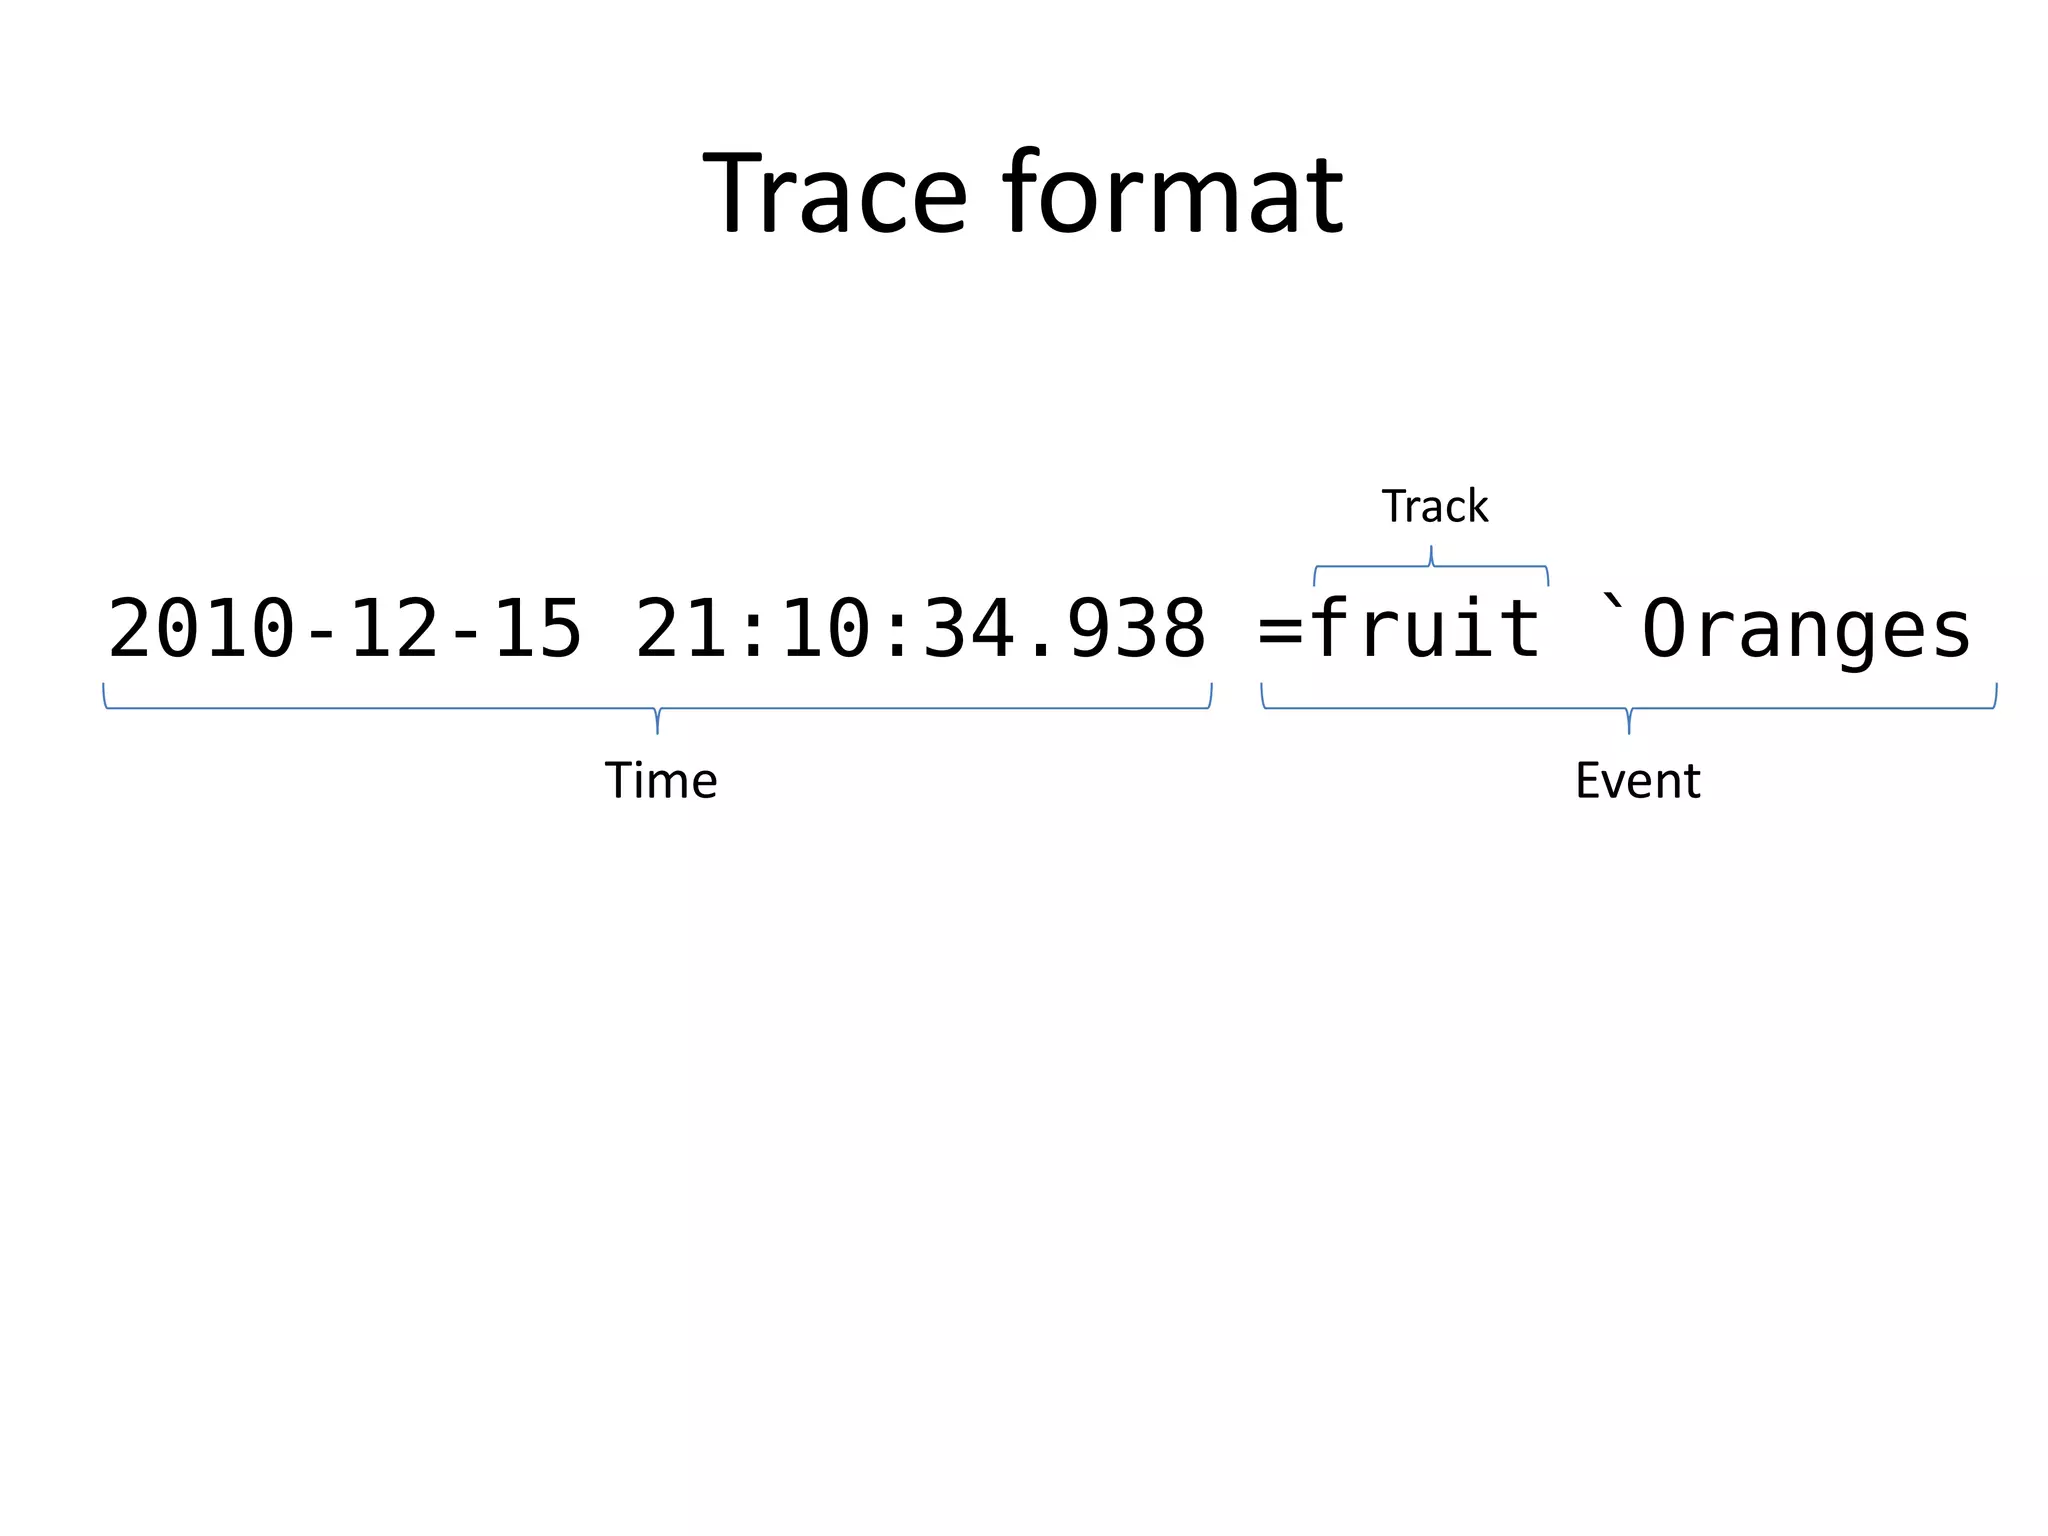
1234 =D `EVENT - at time 1234, event EVENT occured in process D (for example, HTTP response code)
It is assumed that many events of the same kind may occur at once.
Diagram kinds:
‘none’ - do not plot this track
'event' is for event diagrams: activities are drawn like --[===]--- , pulse events like --|--
'duration XXXX' - plot any kind of diagram over the *durations* of events on a track (delimited by > ... <)
for example 'duration quantile 300 0.25,0.5,0.75' will plot these quantiles of durations of the events.
This is useful where your log looks like 'Started processing' ... 'Finished processing': you can plot
processing durations without computing them yourself.
'duration[C] XXXX' - same as 'duration', but of a track's name we only take the part before character C.
For example, if you have processes named 'MACHINE-PID' (i.e. UNIT027-8532) say 'begin something' /
'end something' and you're interested in the properties of per-machine durations, use duration[-].
'count N' is for activity counts: a 'histogram' is drawn with granularity of N time units, where
the bin corresponding to [t..t+N) has value 'what was the maximal number of active events
in that interval', or 'what was the number of impulses in that interval'.
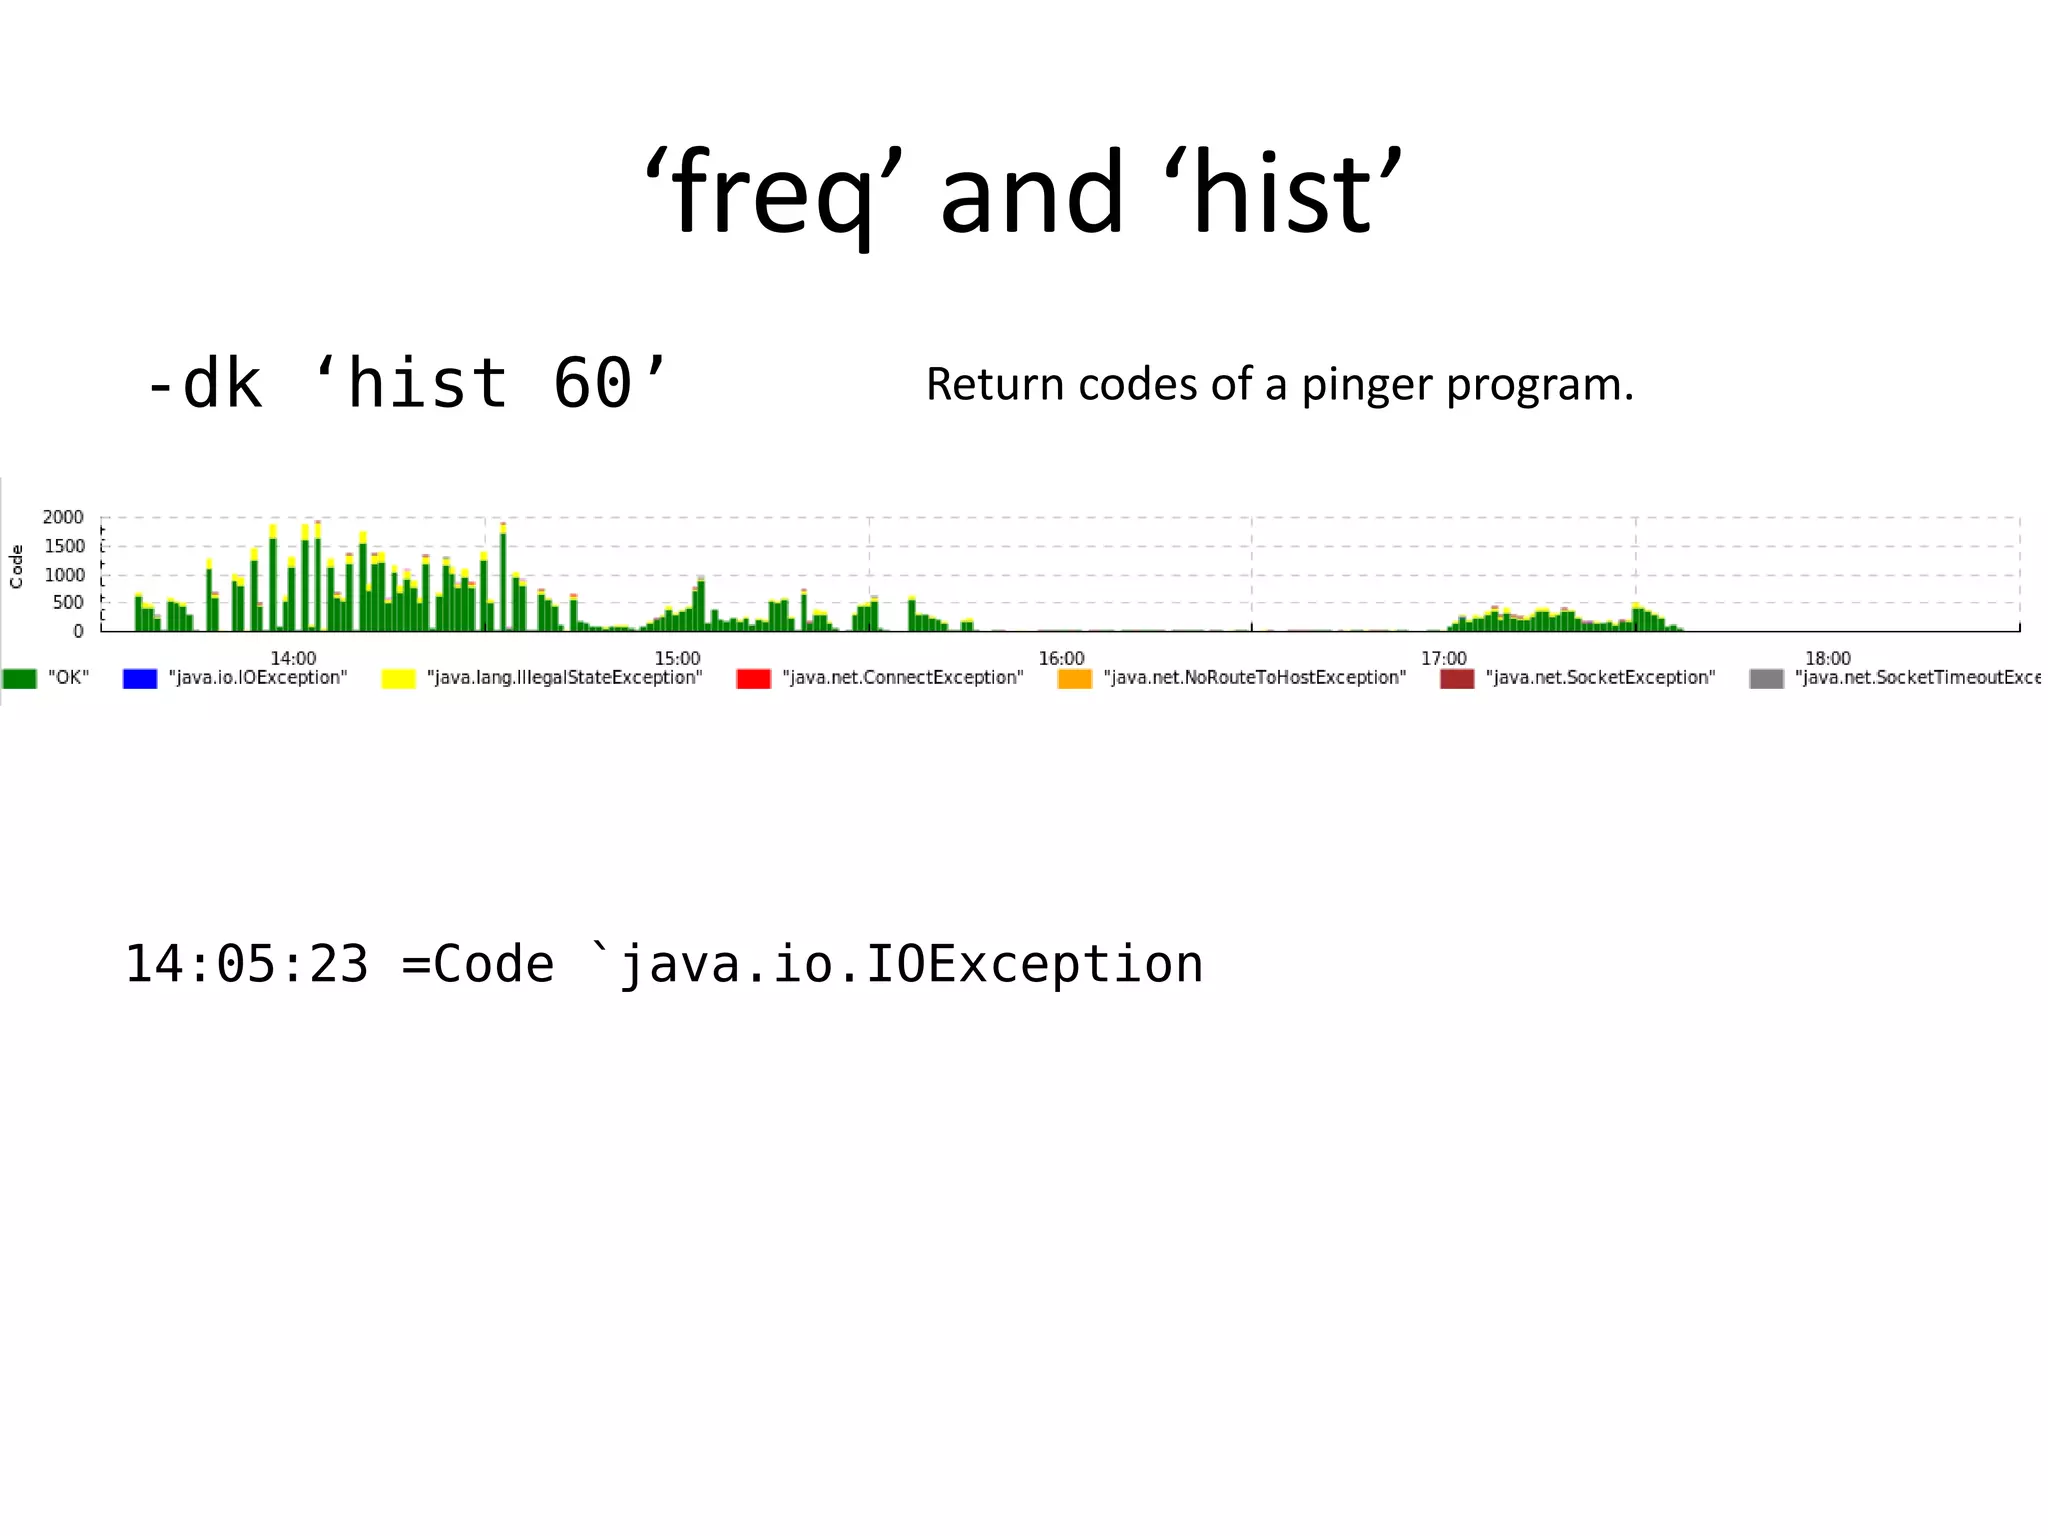
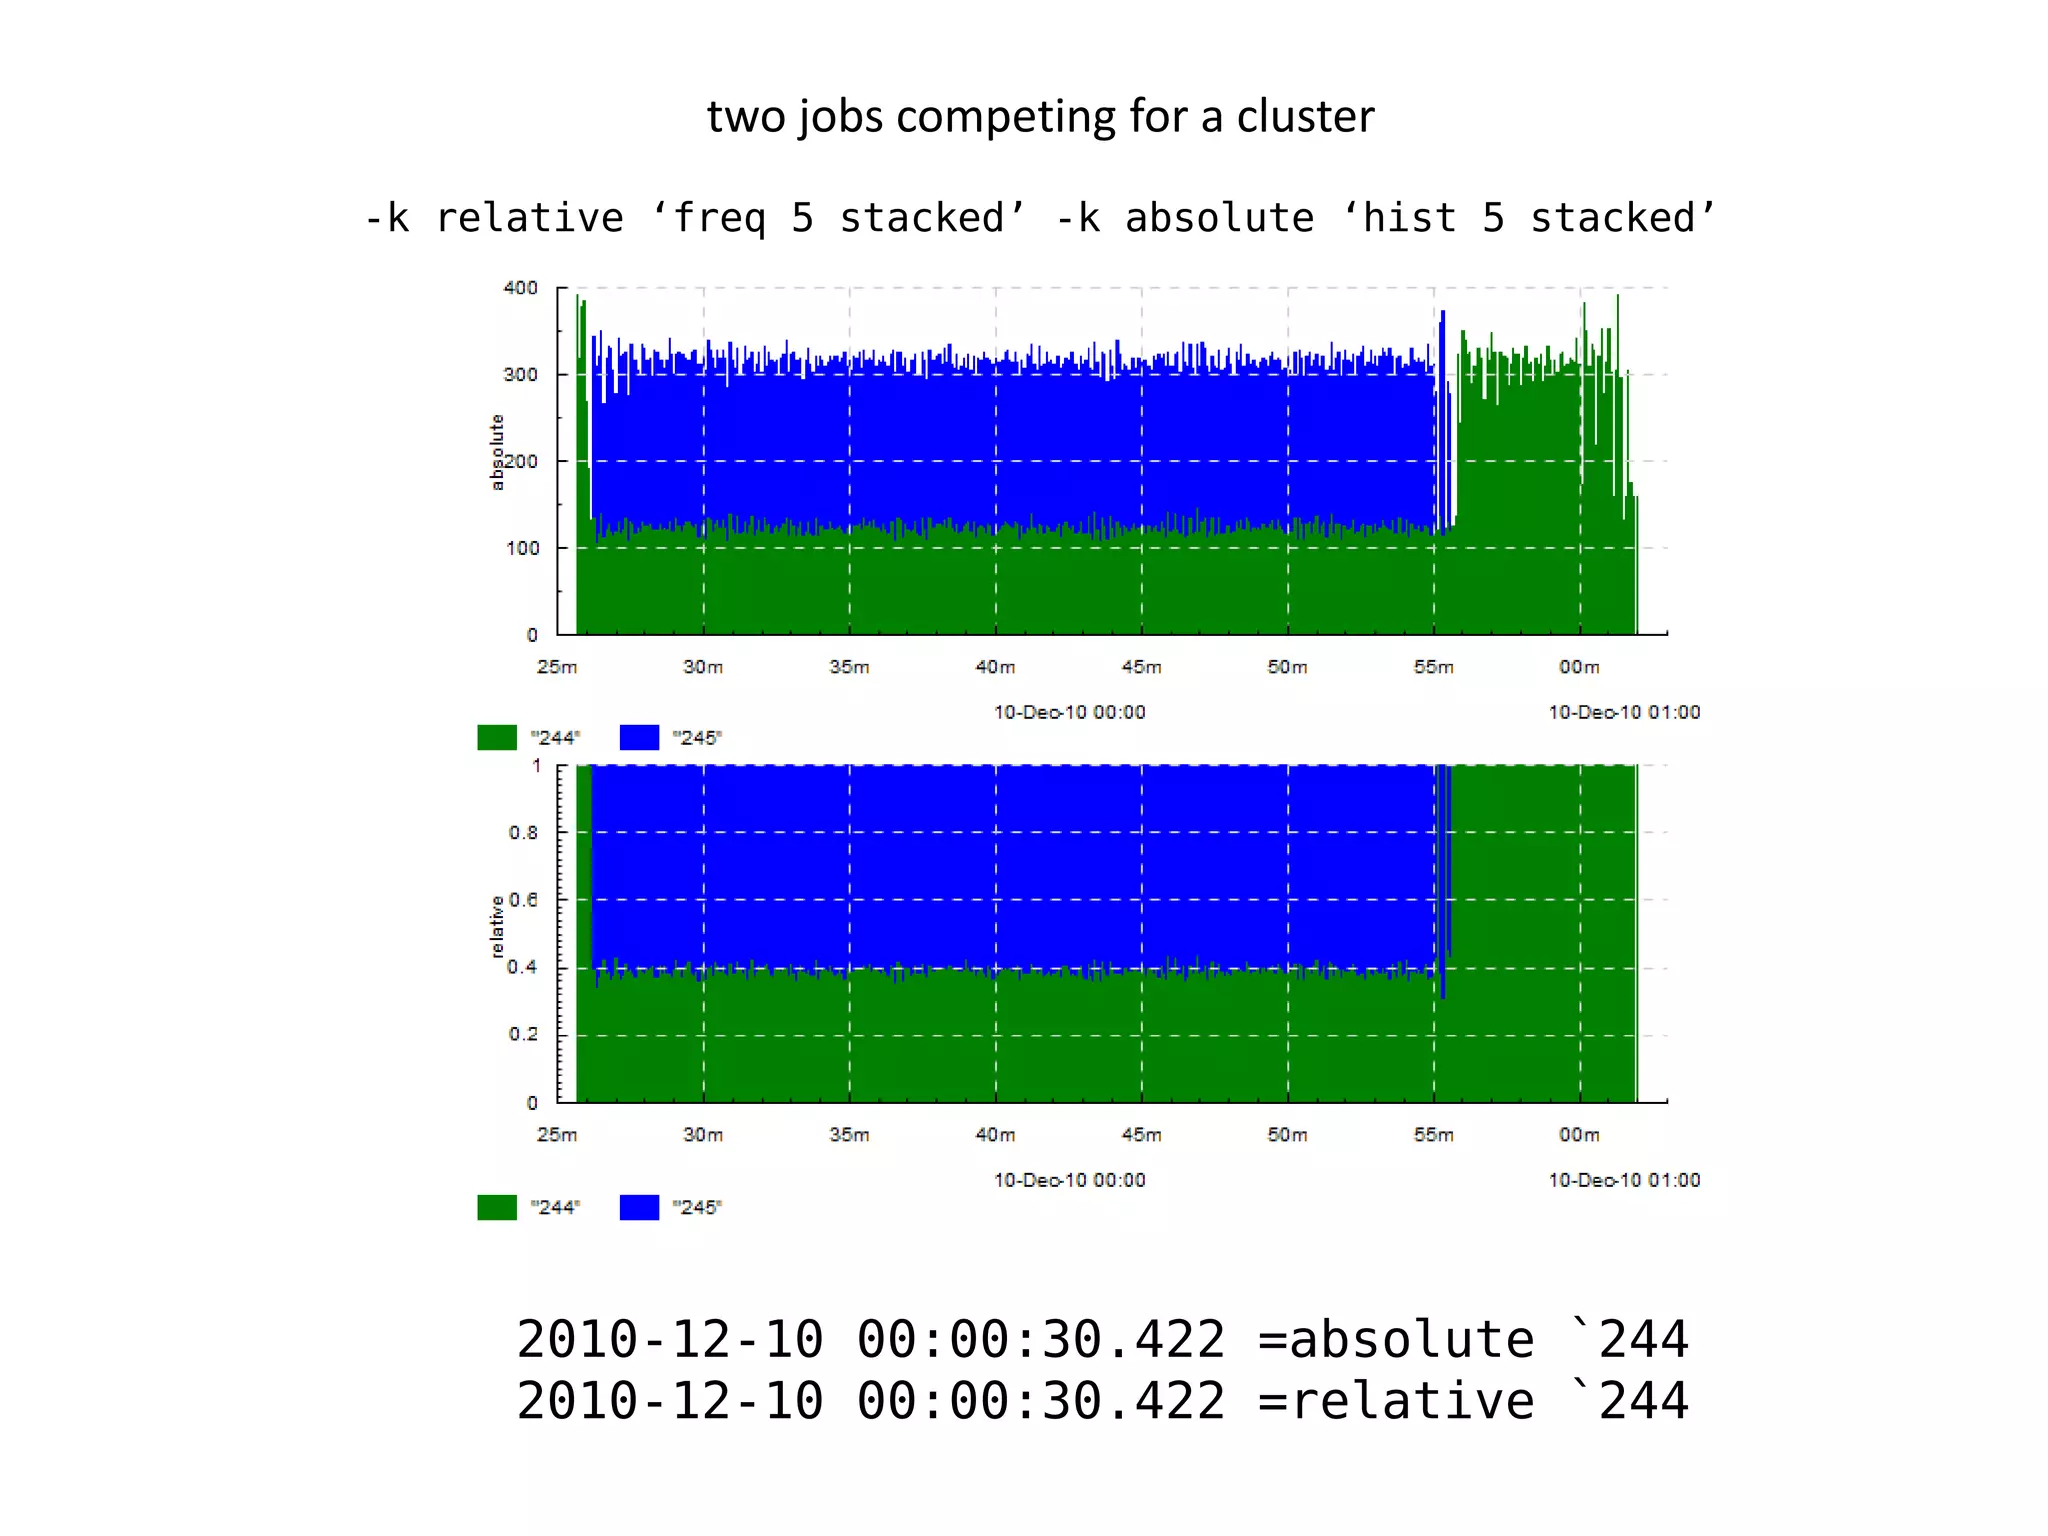
'freq N [TYPE]' is for event frequency histograms: a histogram of type TYPE (stacked or
clustered, default clustered) is drawn for each time bin of size N, about the distribution
of various ` events
'hist N [TYPE]' is for event frequency histograms: a histogram of type TYPE (stacked or
clustered, default clustered) is drawn for each time bin of size N, about the counts of
various ` events
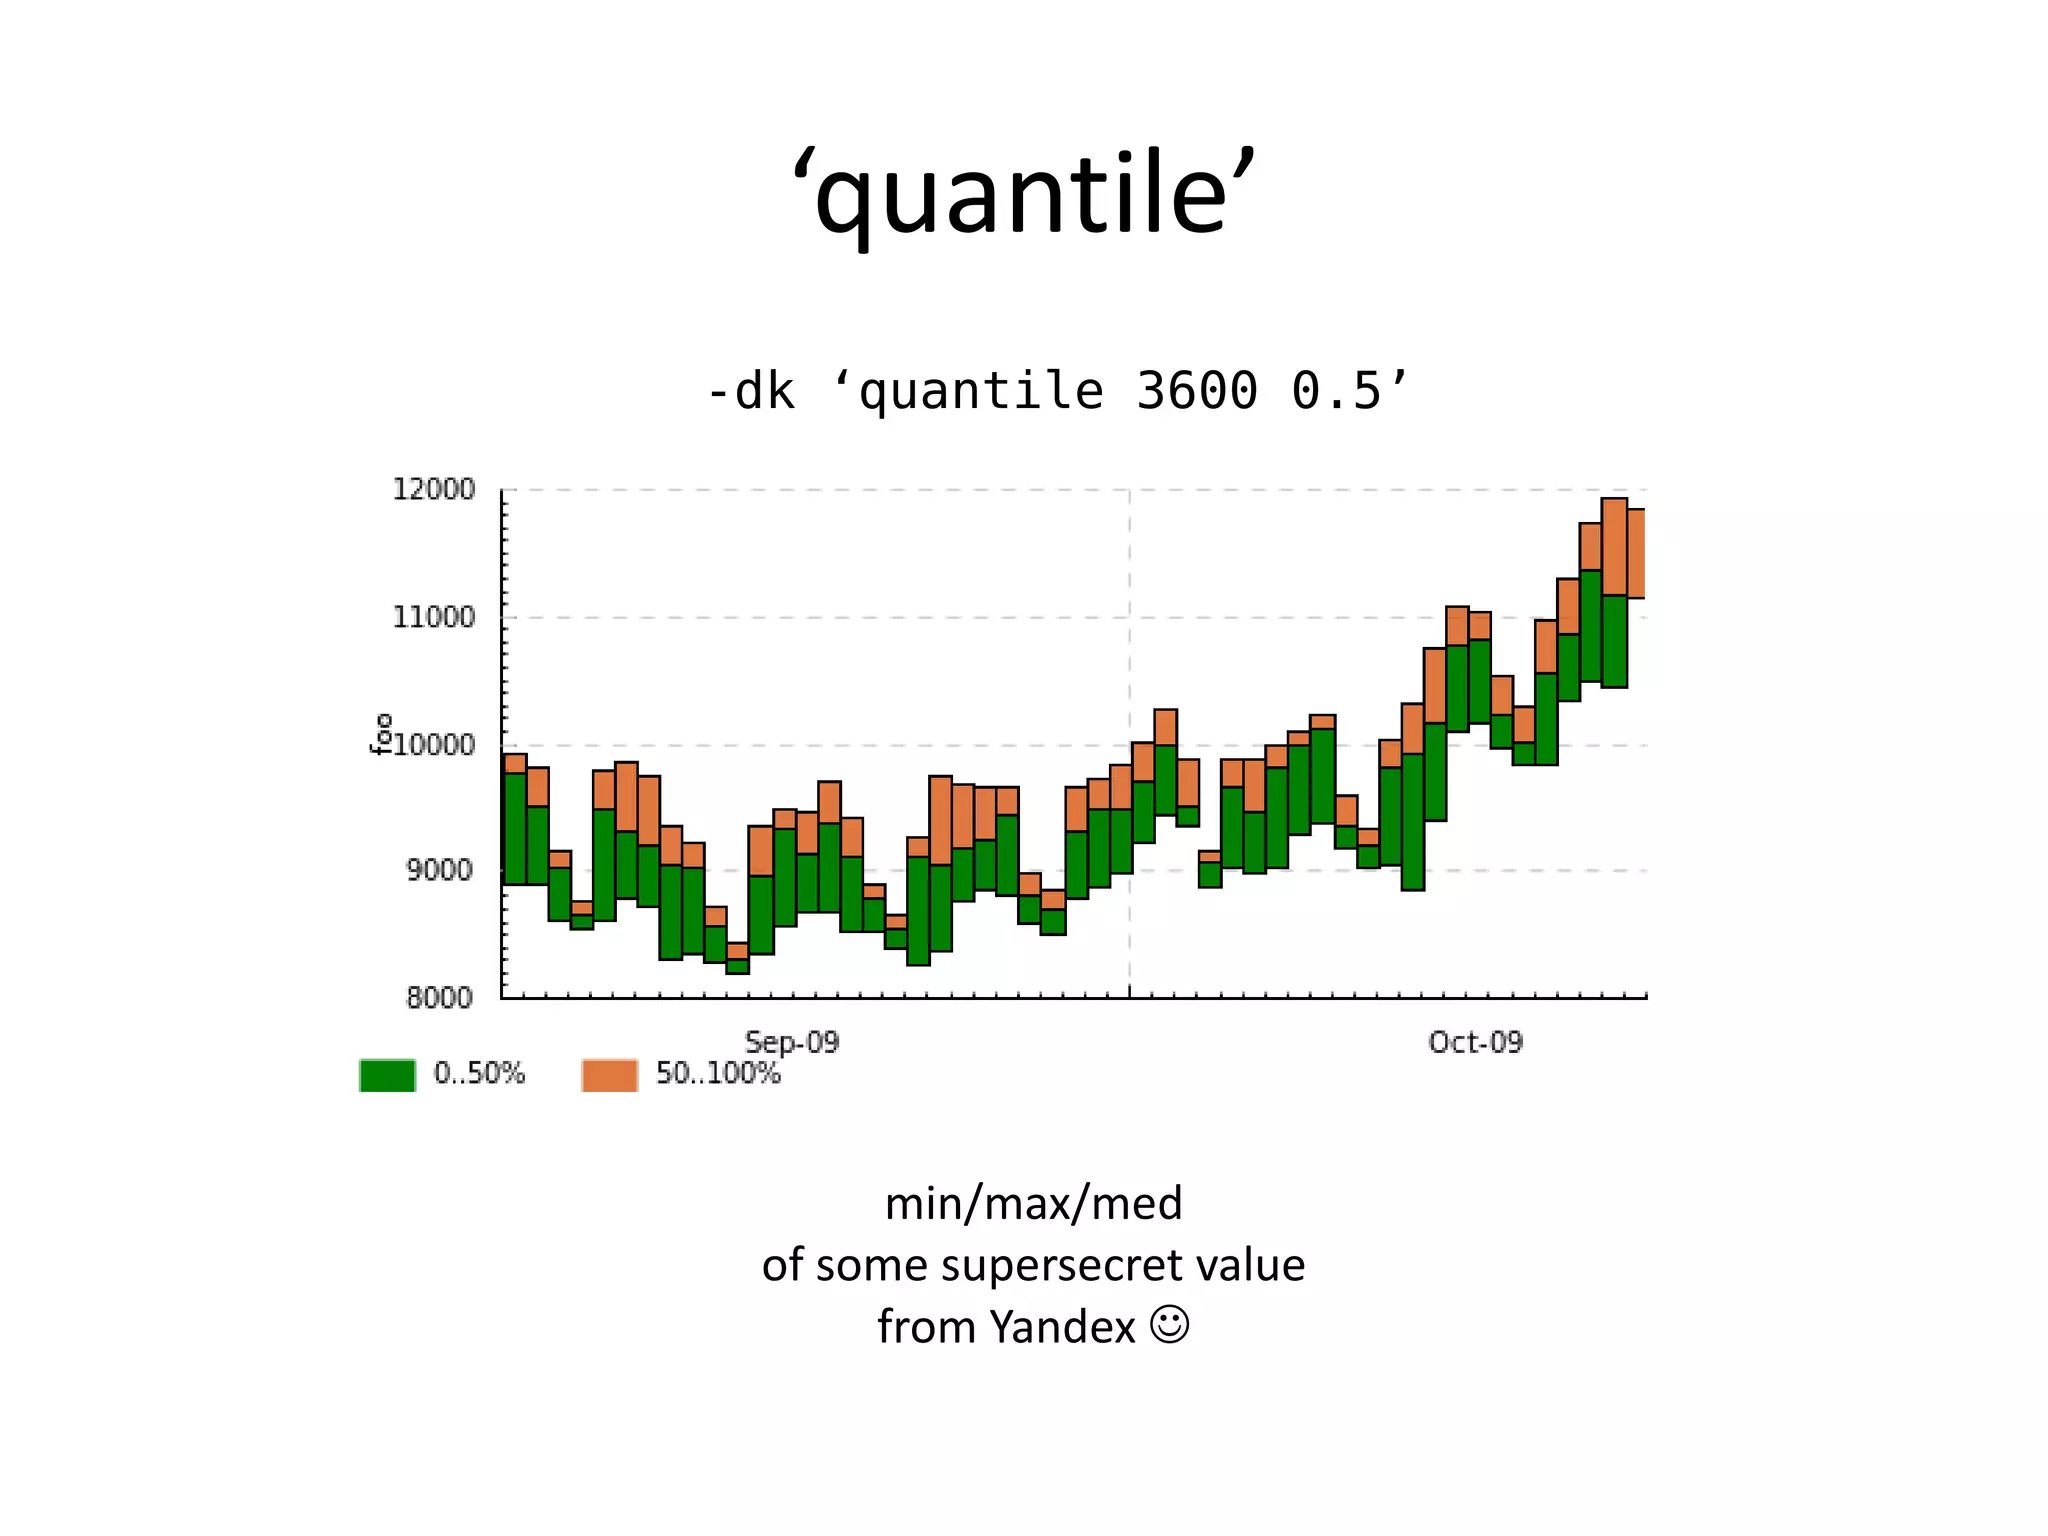
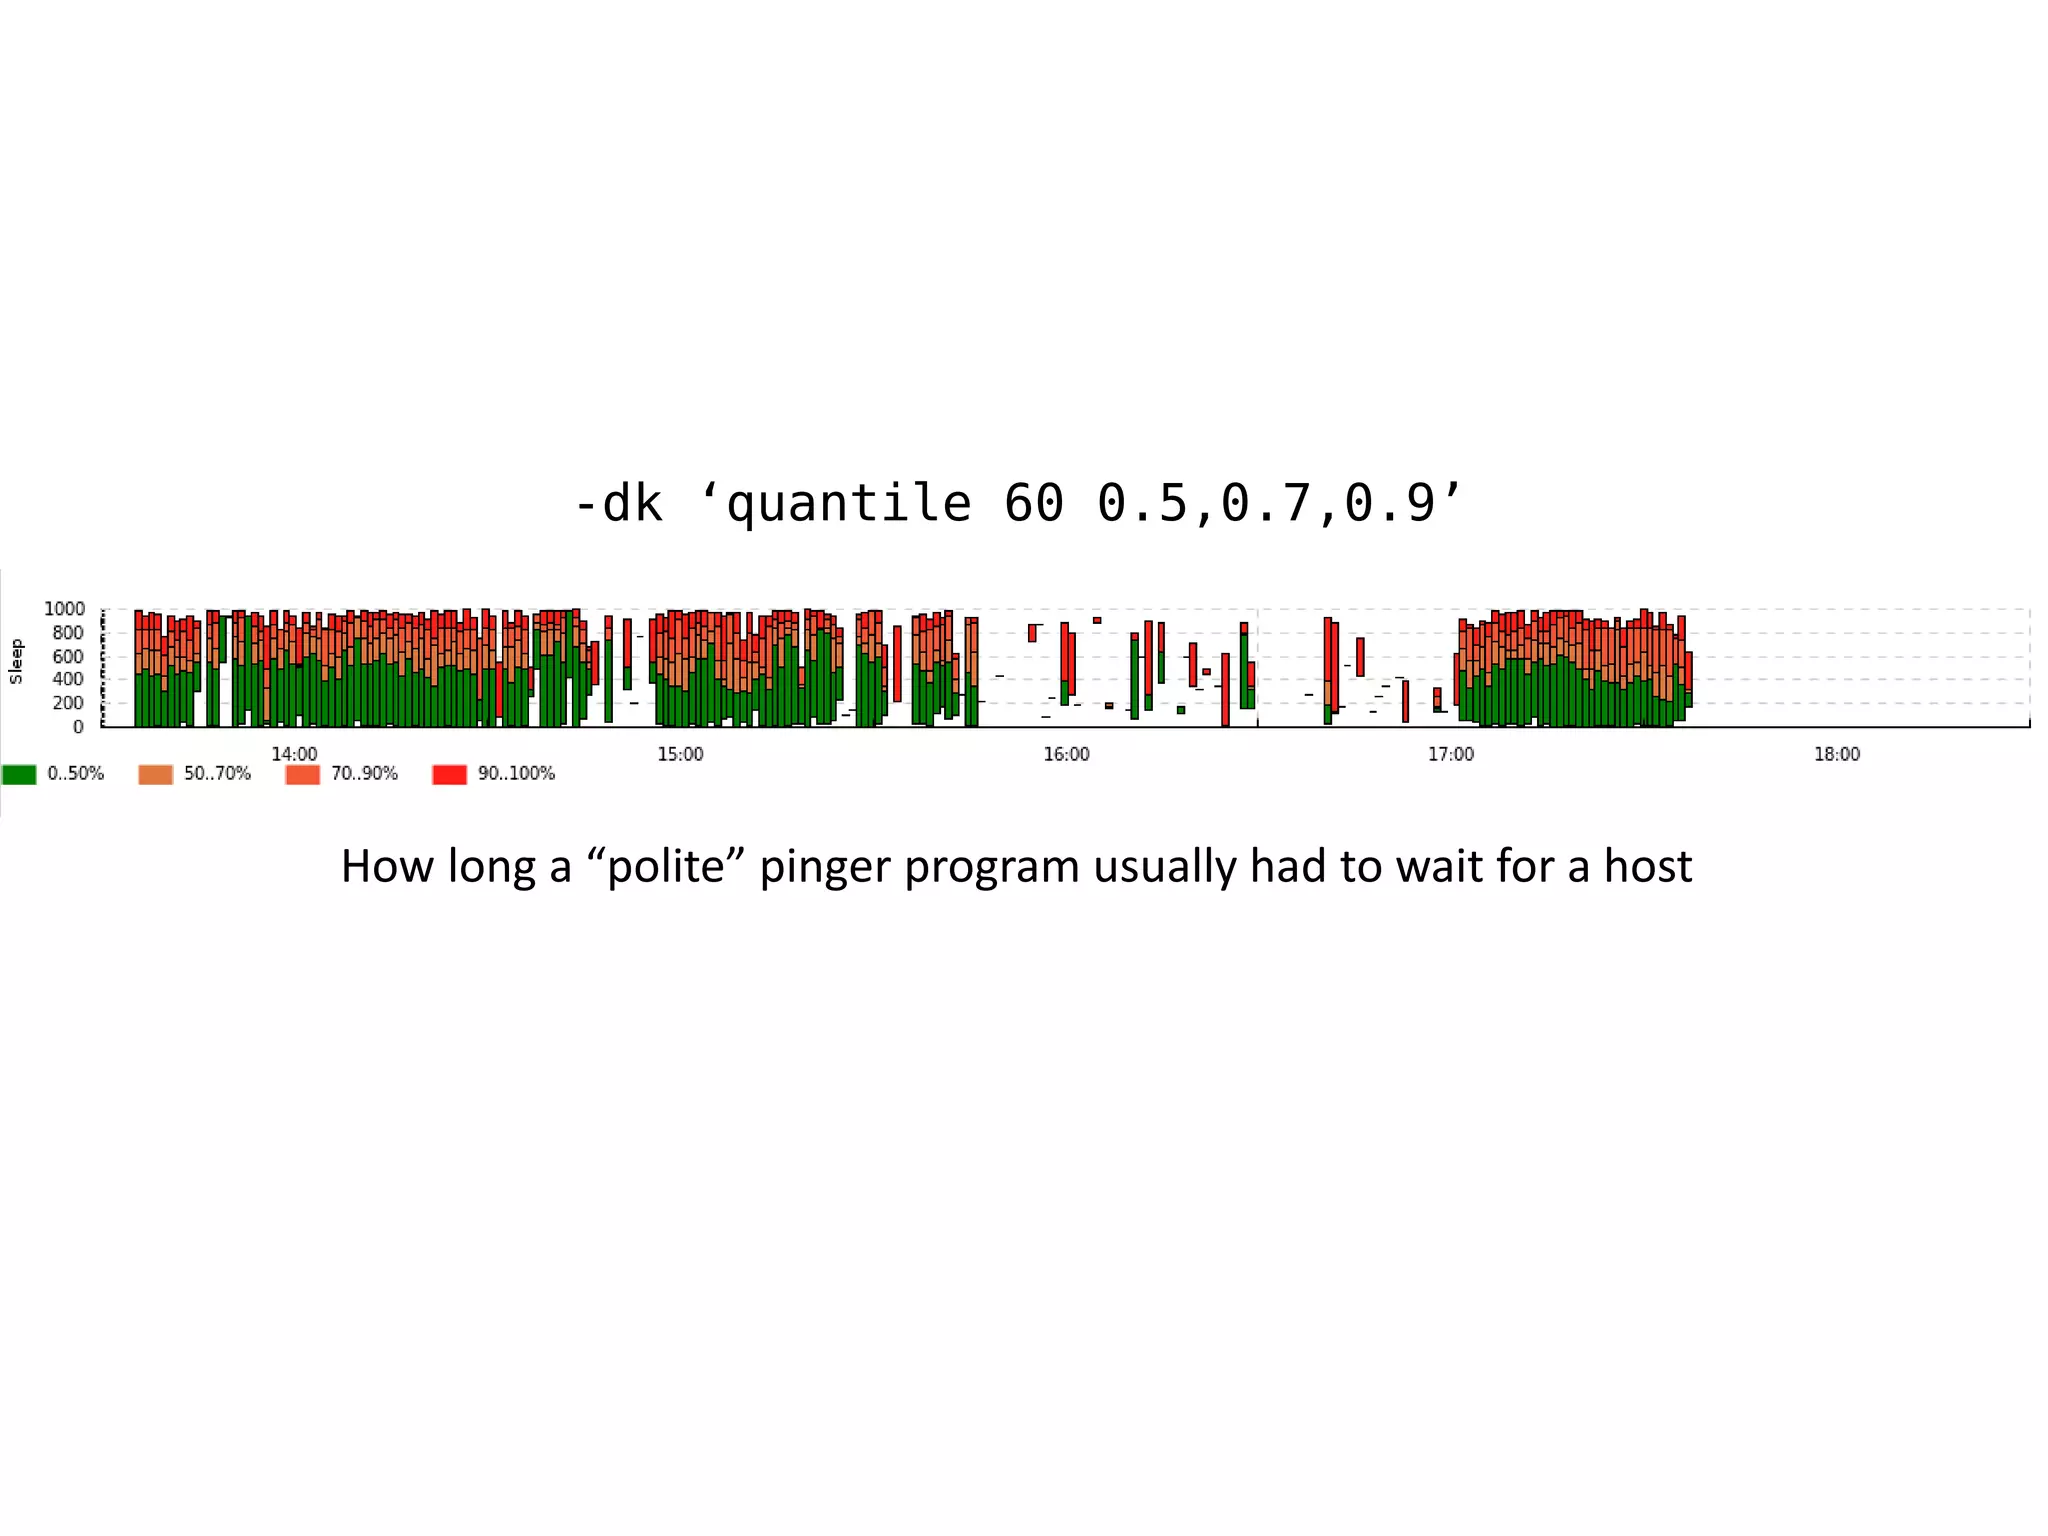
'quantile N q1,q2,..' (example: quantile 100 0.25,0.5,0.75) - a bar chart of corresponding
quantiles in time bins of size N
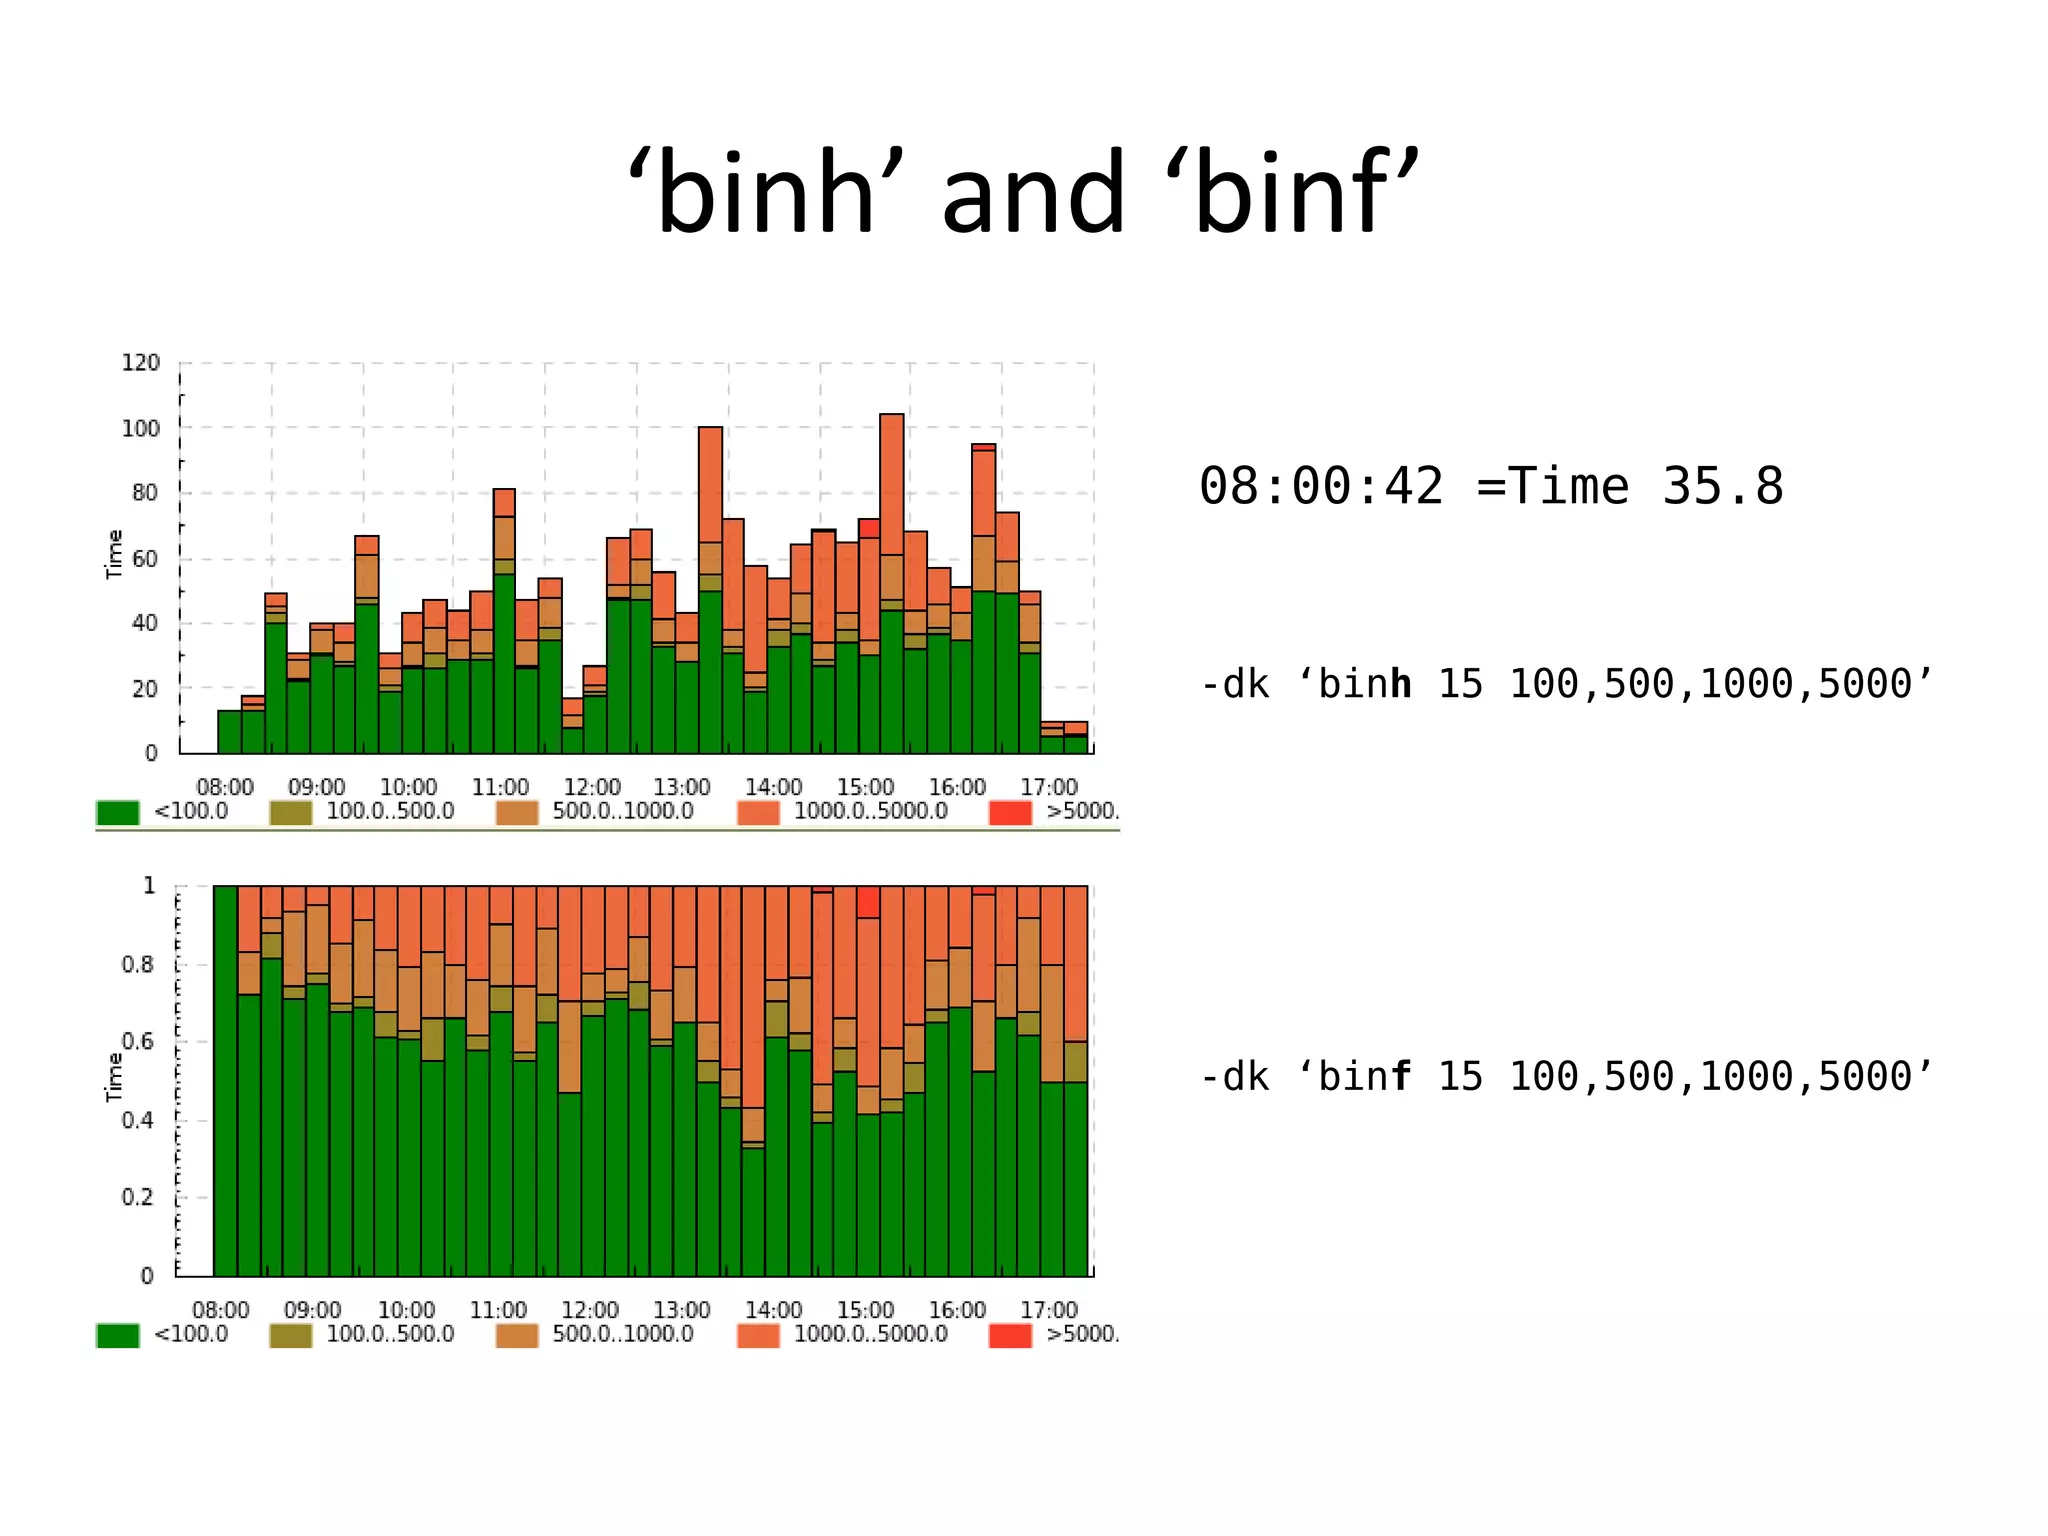
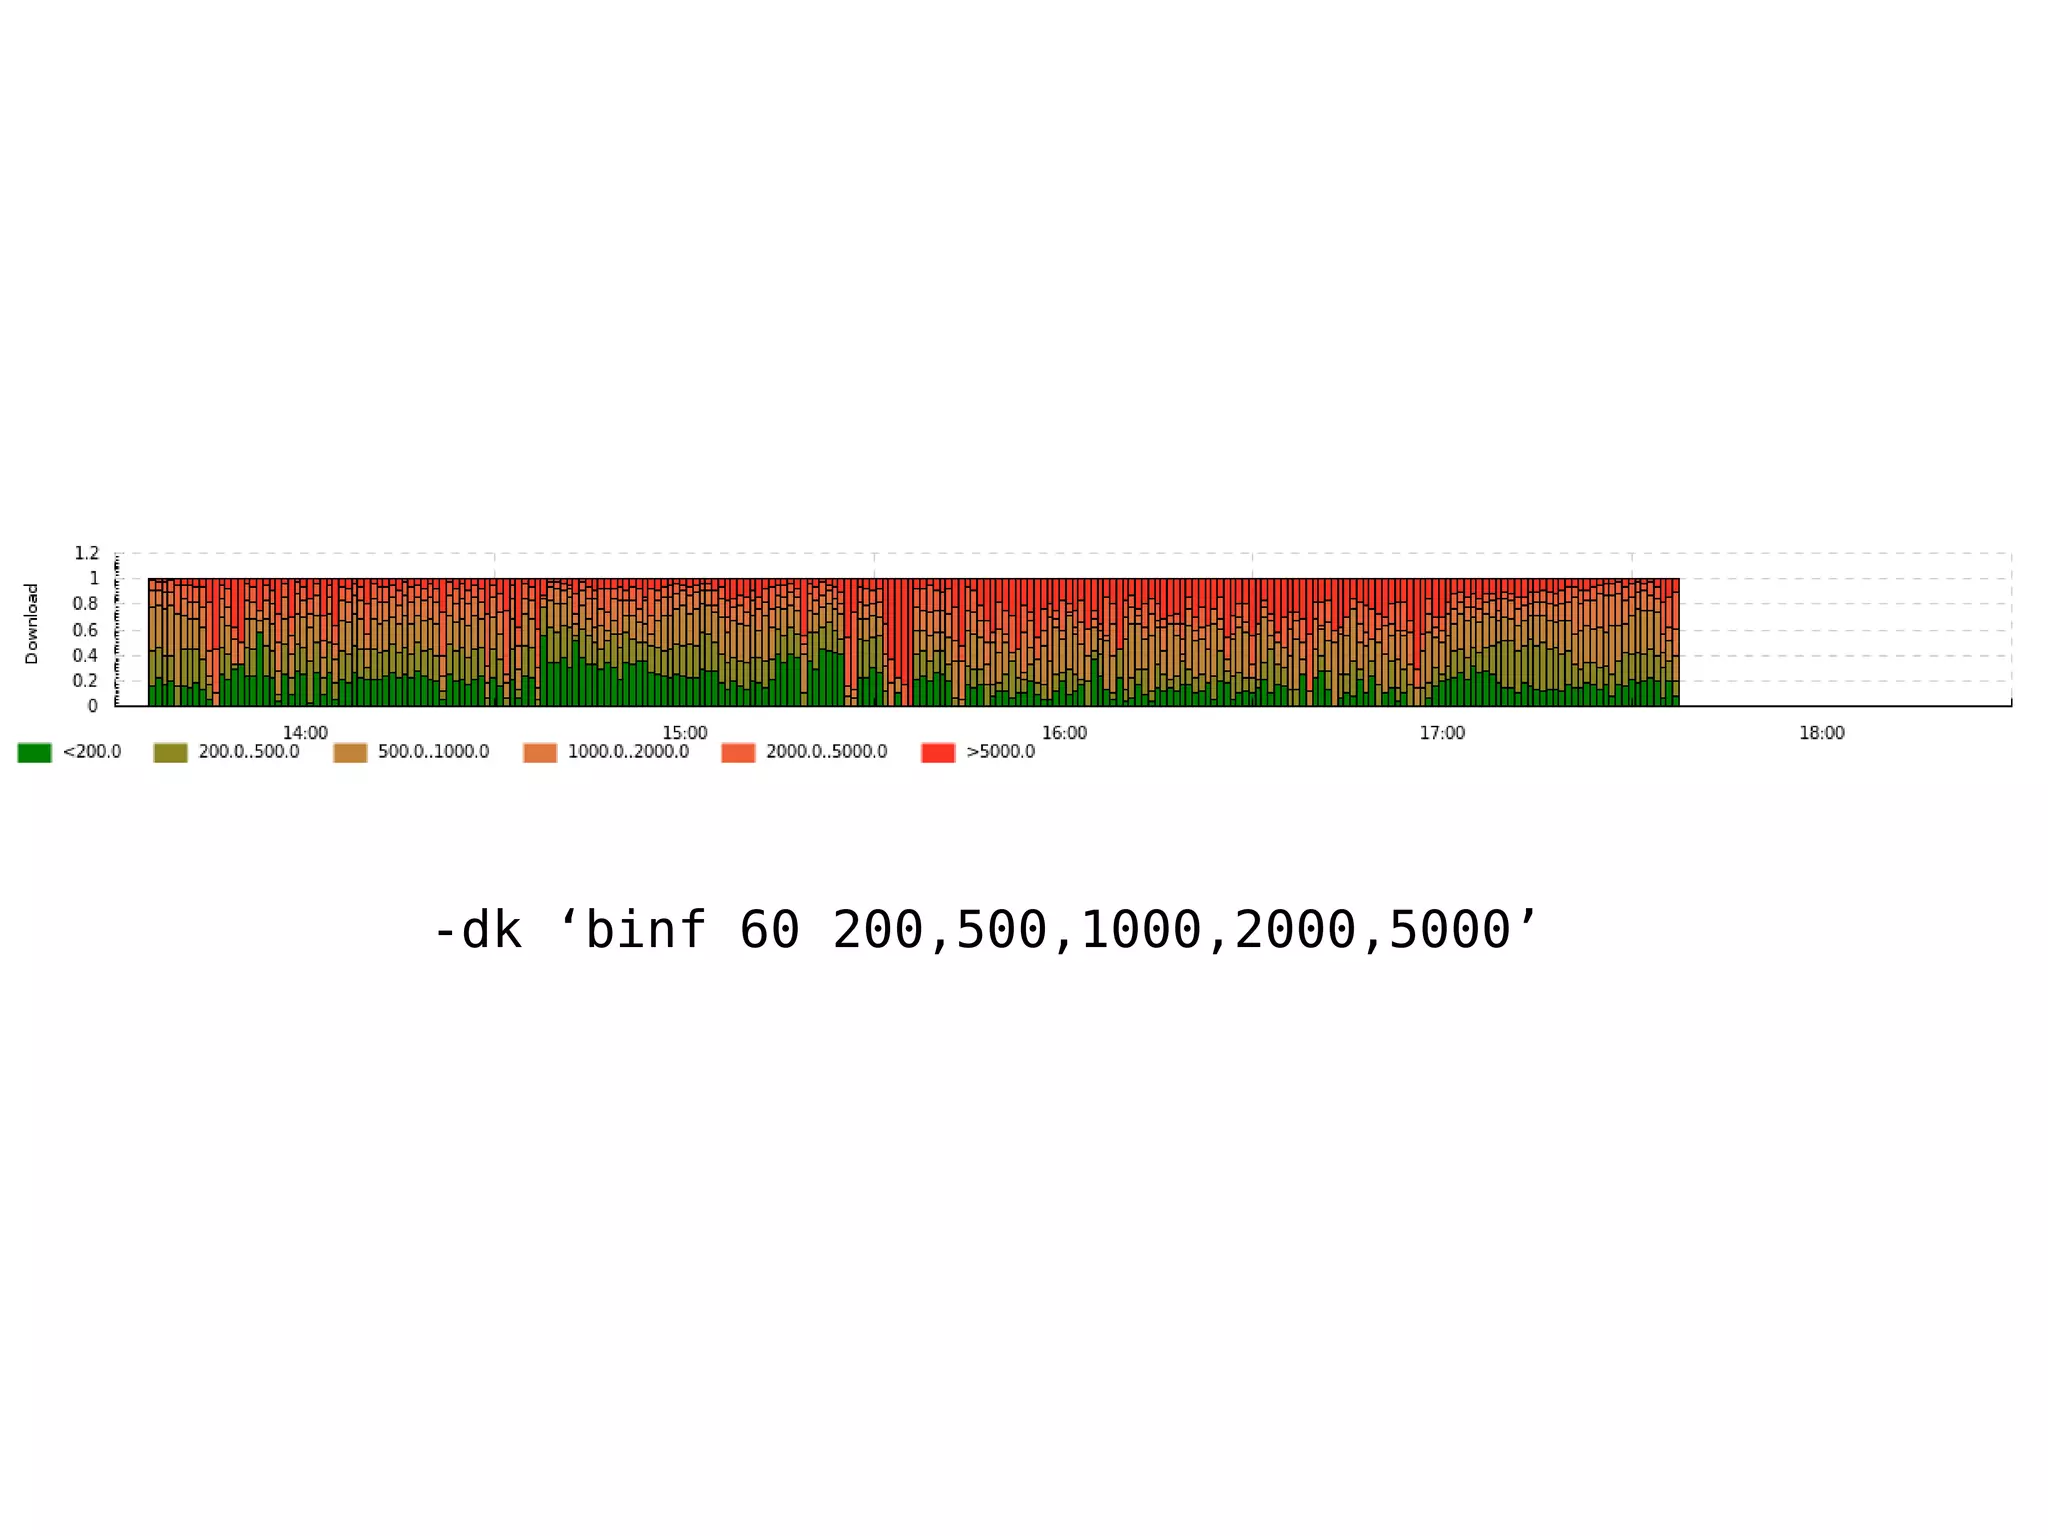
'binf N v1,v2,..' (example: binf 100 1,2,5,10) - a bar chart of frequency of values falling
into bins min..v1, v1..v2, .., v2..max in time bins of size N
'binh N v1,v2,..' (example: binf 100 1,2,5,10) - a bar chart of counts of values falling
into bins min..v1, v1..v2, .., v2..max in time bins of size N
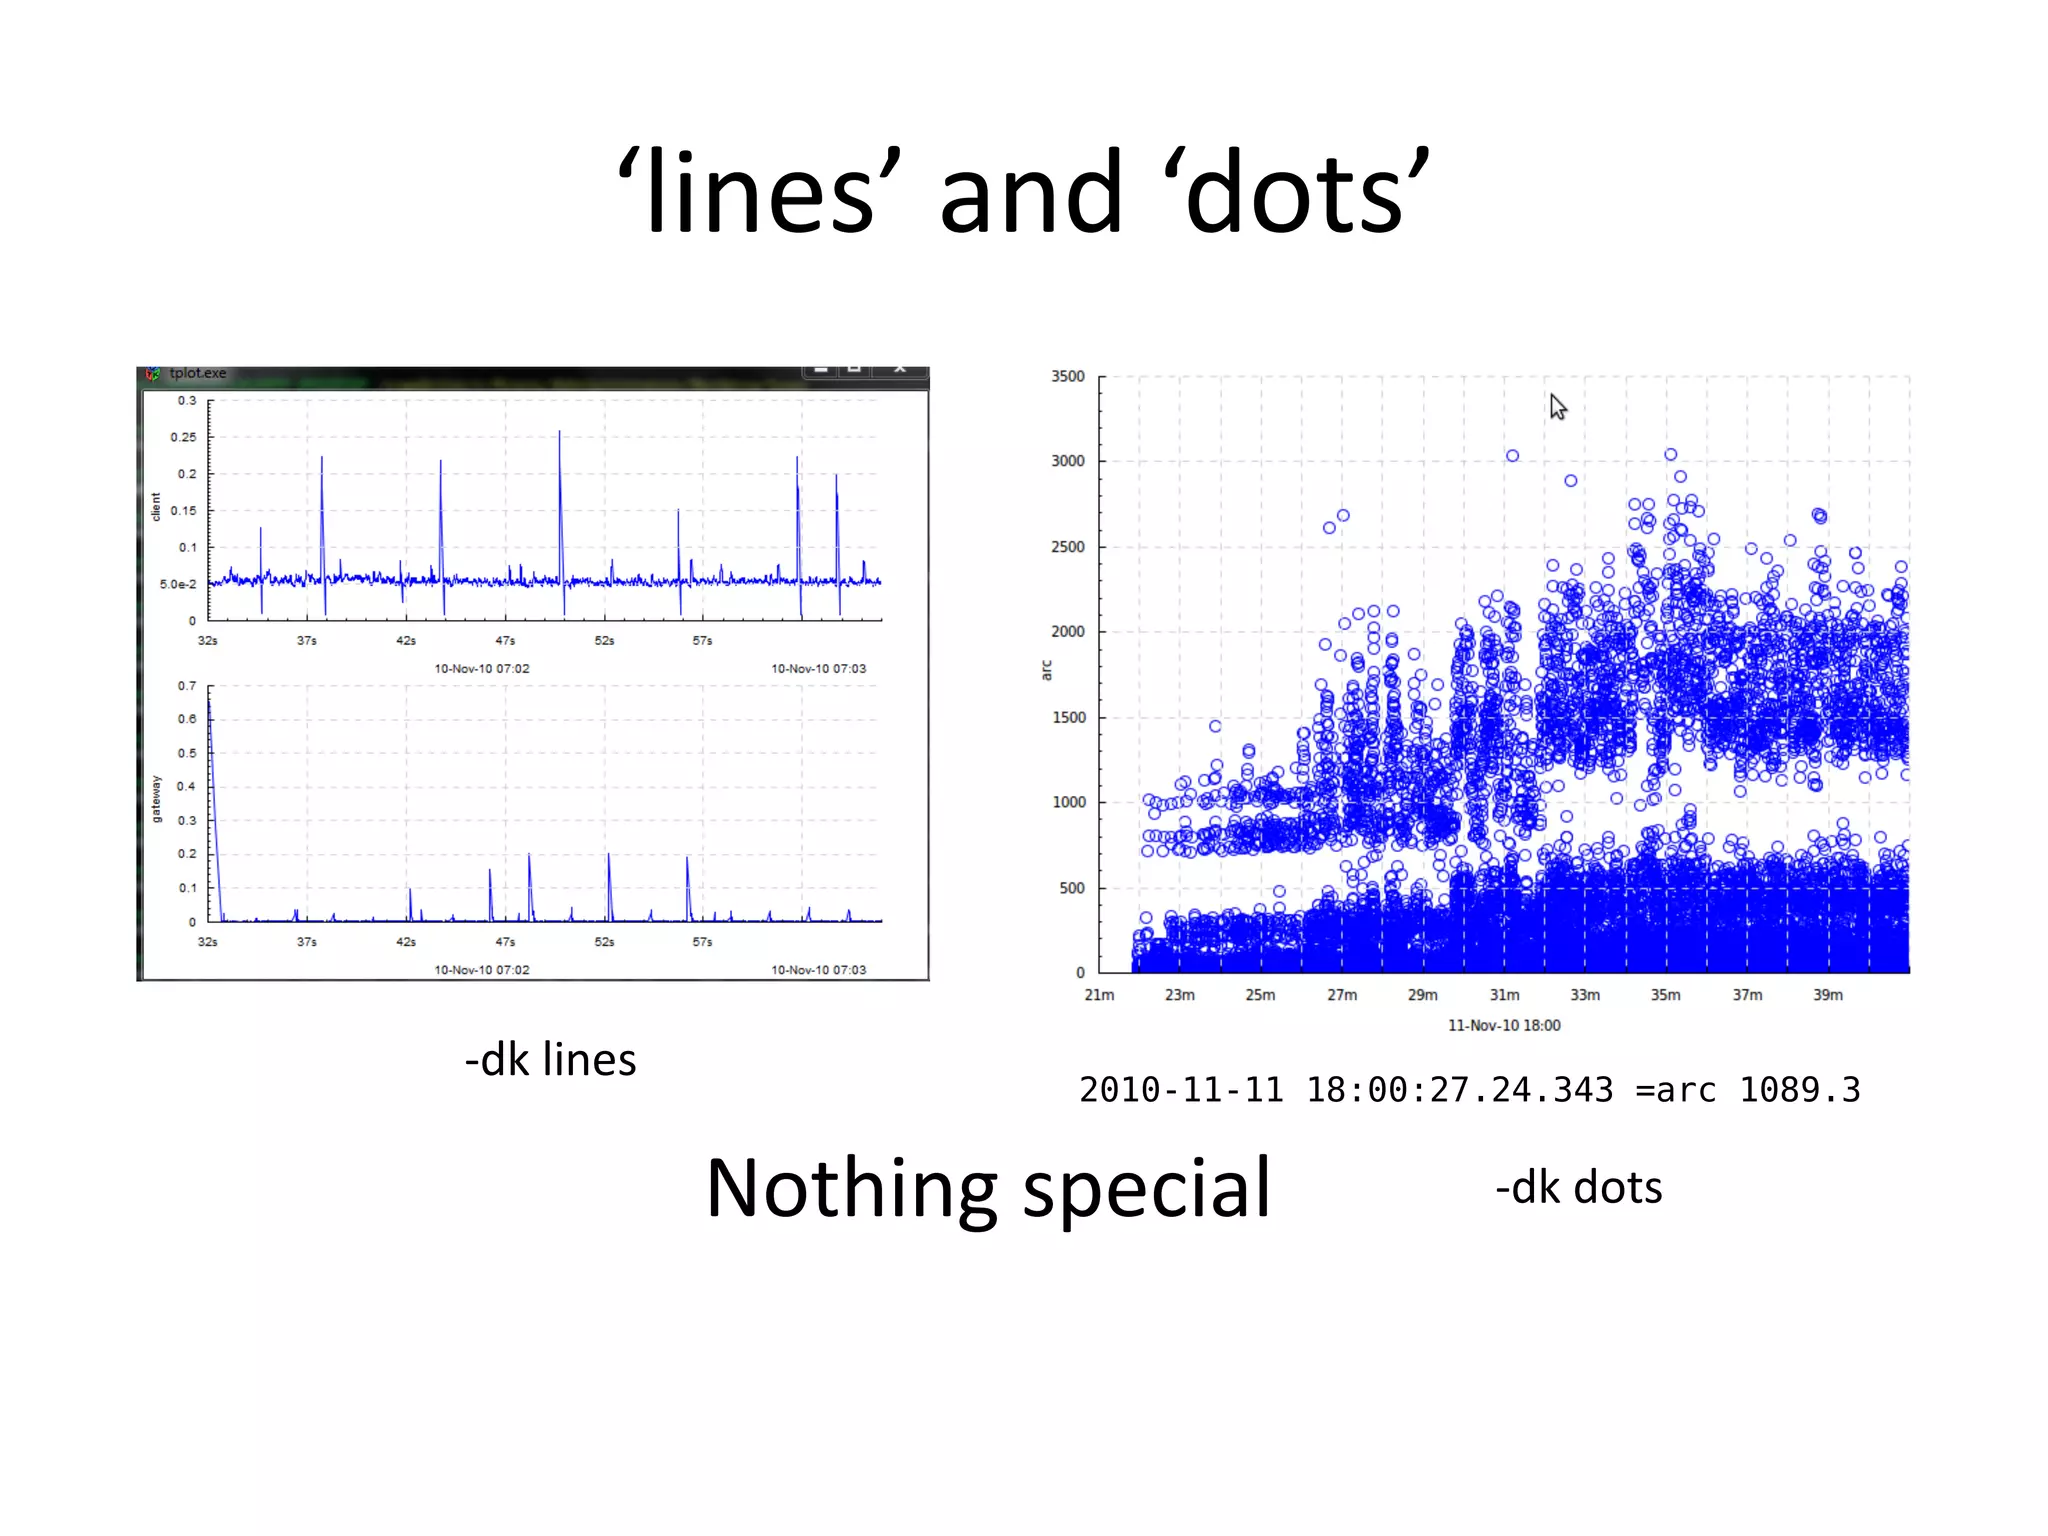
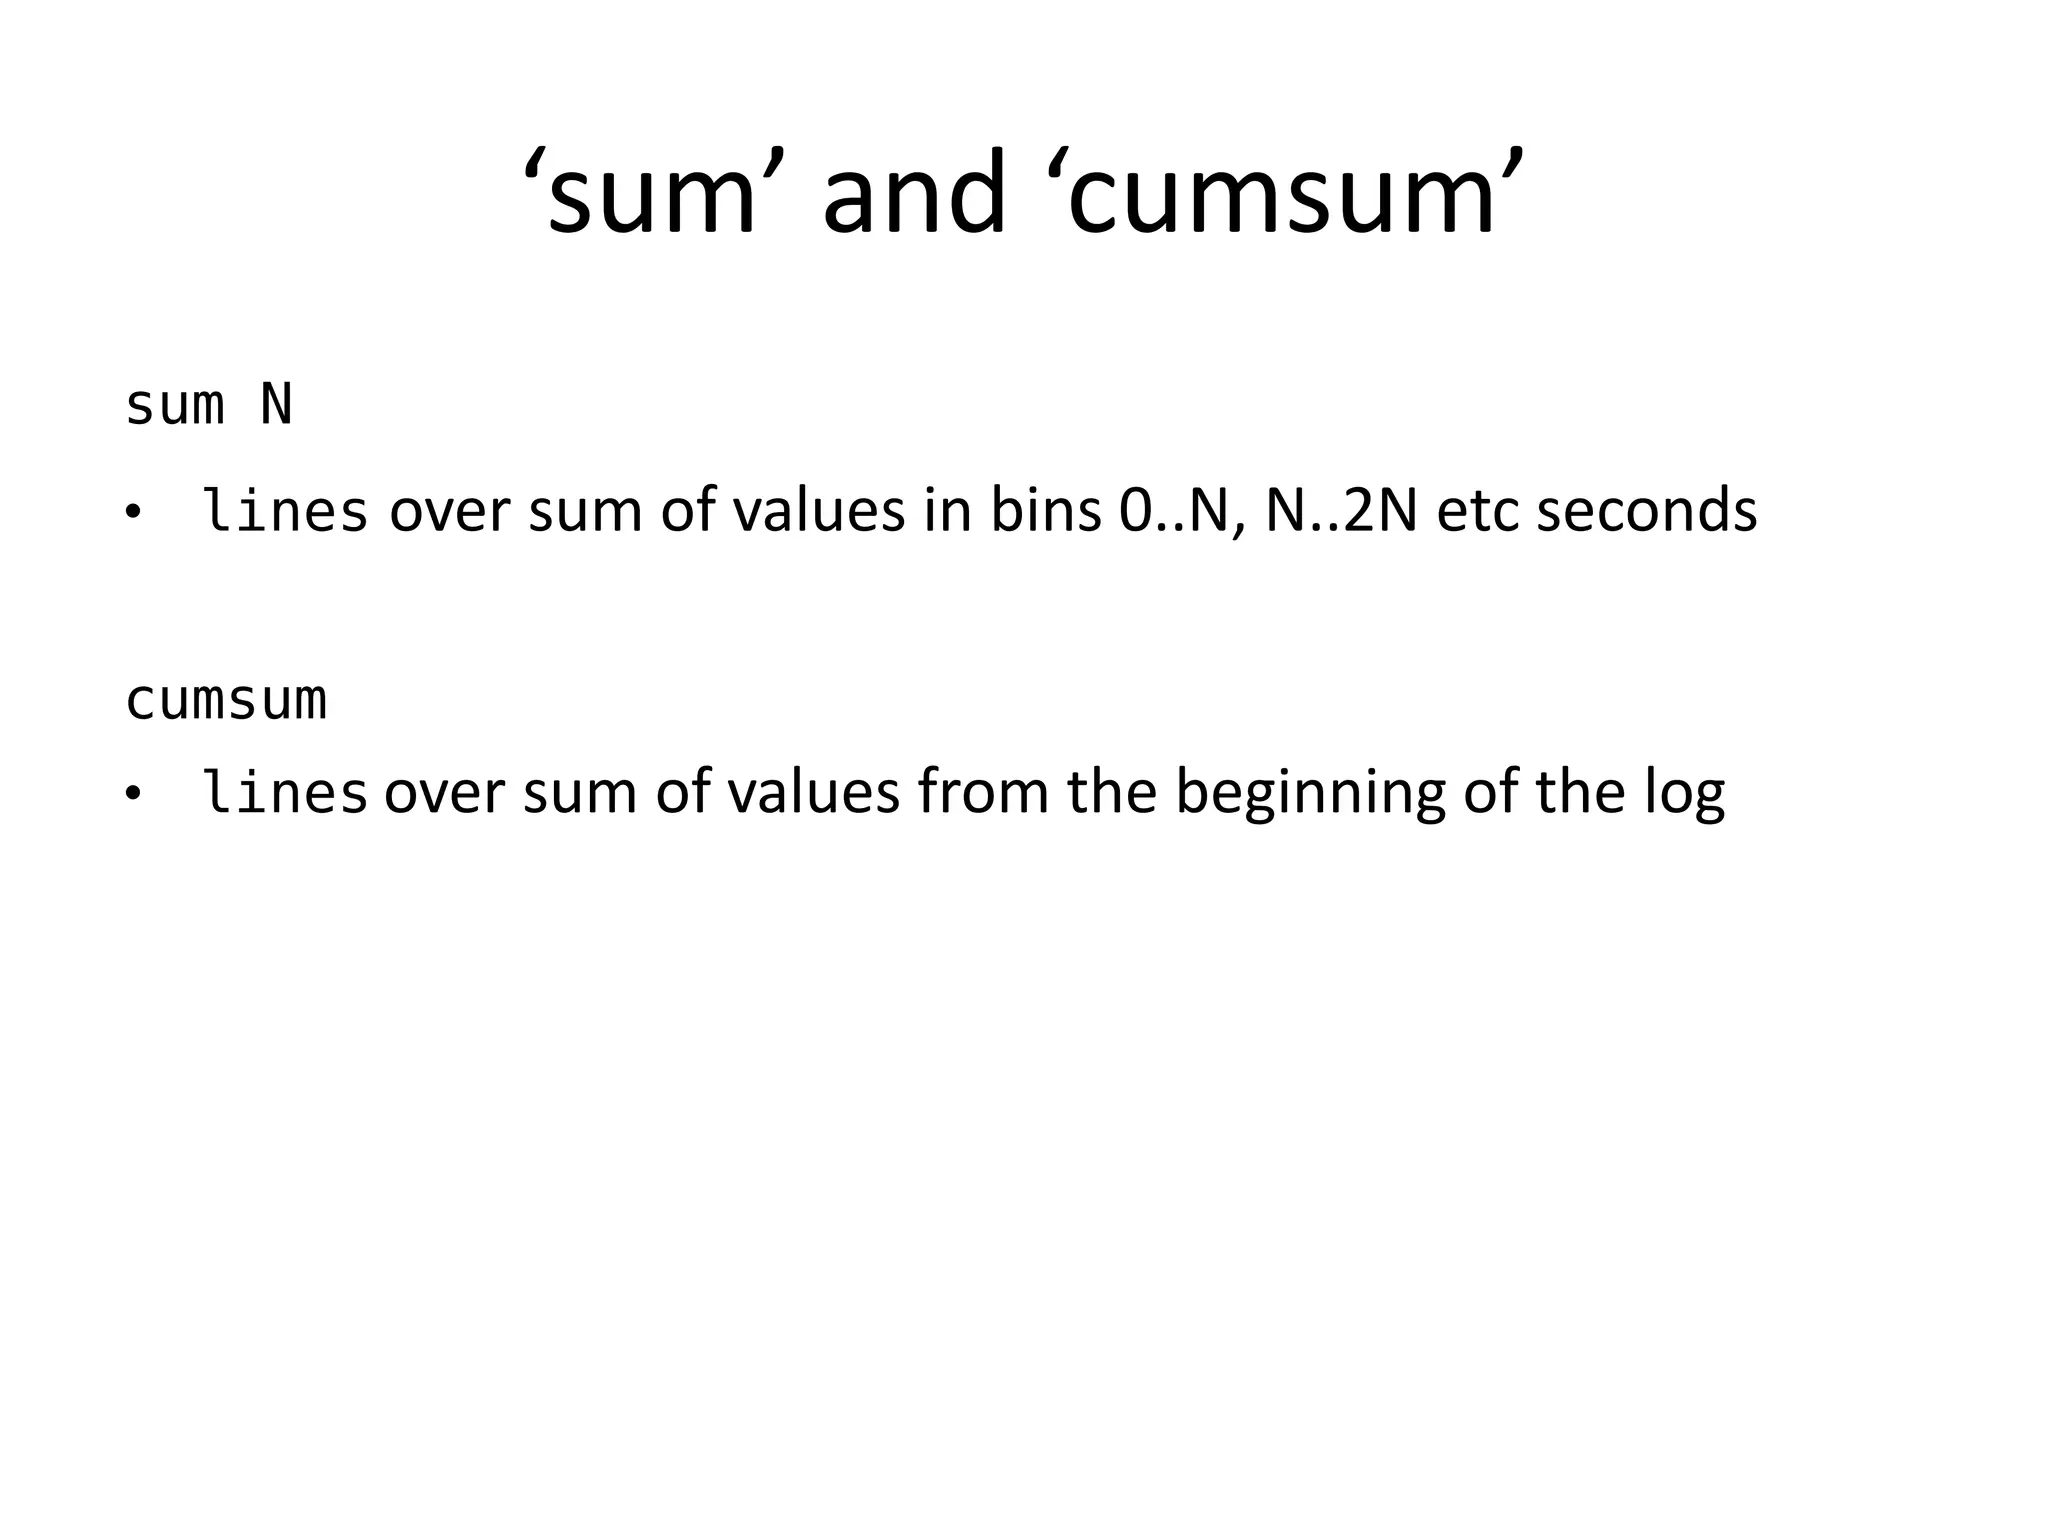
'lines' - a simple line plot of numeric values
'dots' - a simple dot plot of numeric values
'cumsum' - a simple line plot of the sum of the numeric values
'sum N' - a simple line plot of the sum of the numeric values in time bins of size N
N is measured in units or in seconds.](https://image.slidesharecdn.com/twovisualizationtools-101216081249-phpapp01/75/Two-visualization-tools-52-2048.jpg)
![But it’s used the same way
Log file INFO 2010-12-02 07:08:10.422 [Pool-1] A task arrived
INFO 2010-12-02 07:08:10.440 [Pool-2] A task arrived
INFO 2010-12-02 07:08:10.518 [Pool-3] Task finished
awk ‘{t=$2 “ “ $3}
One-liner /arrived/{print t “ >running”; print t “ !begin/5s”}
/finished/{print t “ <running”; print t “ !end/5s”}’
2010-12-02 07:08:10.422 !begin/5s
2010-12-02 07:08:10.422 >running
2010-12-02 07:08:10.440 !begin/5s
Trace file (input for tools) 2010-12-02
2010-12-02
07:08:10.440
07:08:10.518
>running
!end/5s
2010-12-02 07:08:10.518 <running
One-liner tplot -dk ‘count 5’ -if - -of x -or 1400x800
Pretty picture](https://image.slidesharecdn.com/twovisualizationtools-101216081249-phpapp01/75/Two-visualization-tools-53-2048.jpg)
![But it’s used the same way
Log file INFO 2010-12-02 07:08:10.422 [Pool-1] A task arrived
INFO 2010-12-02 07:08:10.440 [Pool-2] A task arrived
INFO 2010-12-02 07:08:10.518 [Pool-3] Task finished
awk ‘{t=$2 “ “ $3}
One-liner /arrived/{print t “ >running”; print t “ !begin/5s”}
/finished/{print t “ <running”; print t “ !end/5s”}’
2010-12-02 07:08:10.422 !begin/5s
2010-12-02 07:08:10.422 >running
2010-12-02 07:08:10.440 !begin/5s
Trace file (input for tools) 2010-12-02
2010-12-02
07:08:10.440
07:08:10.518
>running
!end/5s
2010-12-02 07:08:10.518 <running
One-liner tplot -dk ‘count 5’ -if - -of x -or 1400x800
Pretty picture](https://image.slidesharecdn.com/twovisualizationtools-101216081249-phpapp01/75/Two-visualization-tools-59-2048.jpg)
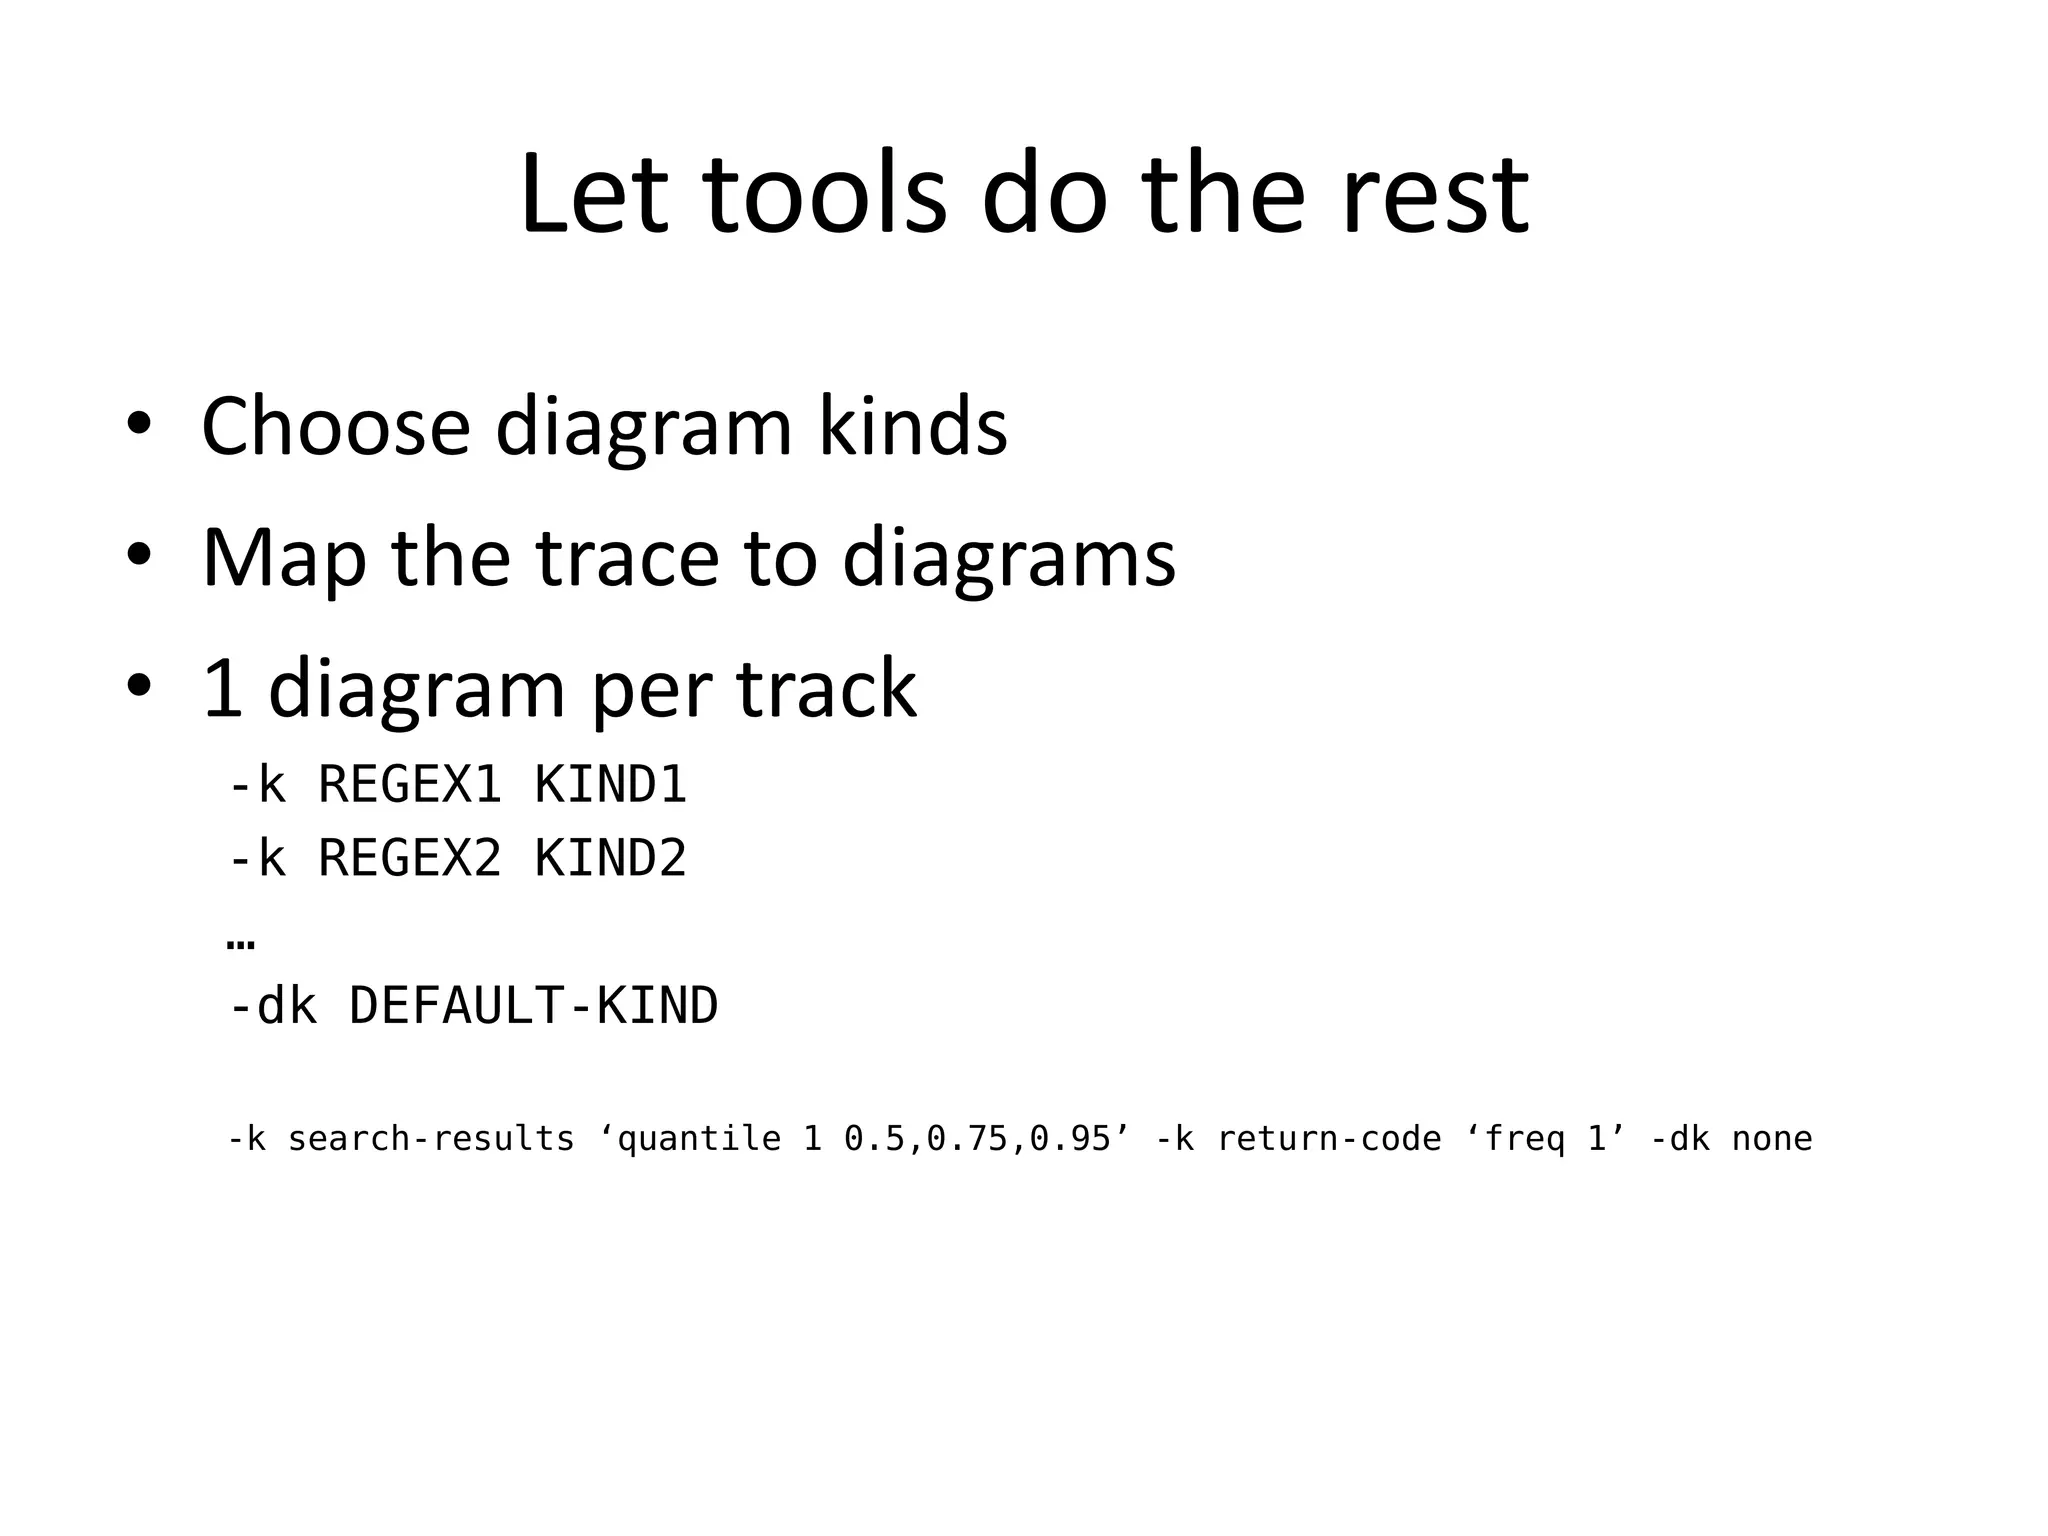
![Choose your poison diagram kind
‘none’ - do not plot this track
'event' is for event diagrams: activities are drawn like --[===]--- , pulse events like --|--
'duration XXXX' - plot any kind of diagram over the *durations* of events on a track (delimited by > ... <)
for example 'duration quantile 300 0.25,0.5,0.75' will plot these quantiles of durations of the events.
This is useful where your log looks like 'Started processing' ... 'Finished processing': you can plot
processing durations without computing them yourself.
'duration[C] XXXX' - same as 'duration', but of a track's name we only take the part before character C.
For example, if you have processes named 'MACHINE-PID' (i.e. UNIT027-8532) say 'begin something' /
'end something' and you're interested in the properties of per-machine durations, use duration[-].
'count N' is for activity counts: a 'histogram' is drawn with granularity of N time units, where
the bin corresponding to [t..t+N) has value 'what was the maximal number of active events
in that interval', or 'what was the number of impulses in that interval'.
'freq N [TYPE]' is for event frequency histograms: a histogram of type TYPE (stacked or
clustered, default clustered) is drawn for each time bin of size N, about the distribution
of various ` events
'hist N [TYPE]' is for event frequency histograms: a histogram of type TYPE (stacked or
clustered, default clustered) is drawn for each time bin of size N, about the counts of
various ` events
'quantile N q1,q2,..' (example: quantile 100 0.25,0.5,0.75) - a bar chart of corresponding
quantiles in time bins of size N
'binf N v1,v2,..' (example: binf 100 1,2,5,10) - a bar chart of frequency of values falling
into bins min..v1, v1..v2, .., v2..max in time bins of size N
'binh N v1,v2,..' (example: binf 100 1,2,5,10) - a bar chart of counts of values falling
into bins min..v1, v1..v2, .., v2..max in time bins of size N
'lines' - a simple line plot of numeric values
'dots' - a simple dot plot of numeric values
'cumsum' - a simple line plot of the sum of the numeric values
'sum N' - a simple line plot of the sum of the numeric values in time bins of size N](https://image.slidesharecdn.com/twovisualizationtools-101216081249-phpapp01/75/Two-visualization-tools-61-2048.jpg)

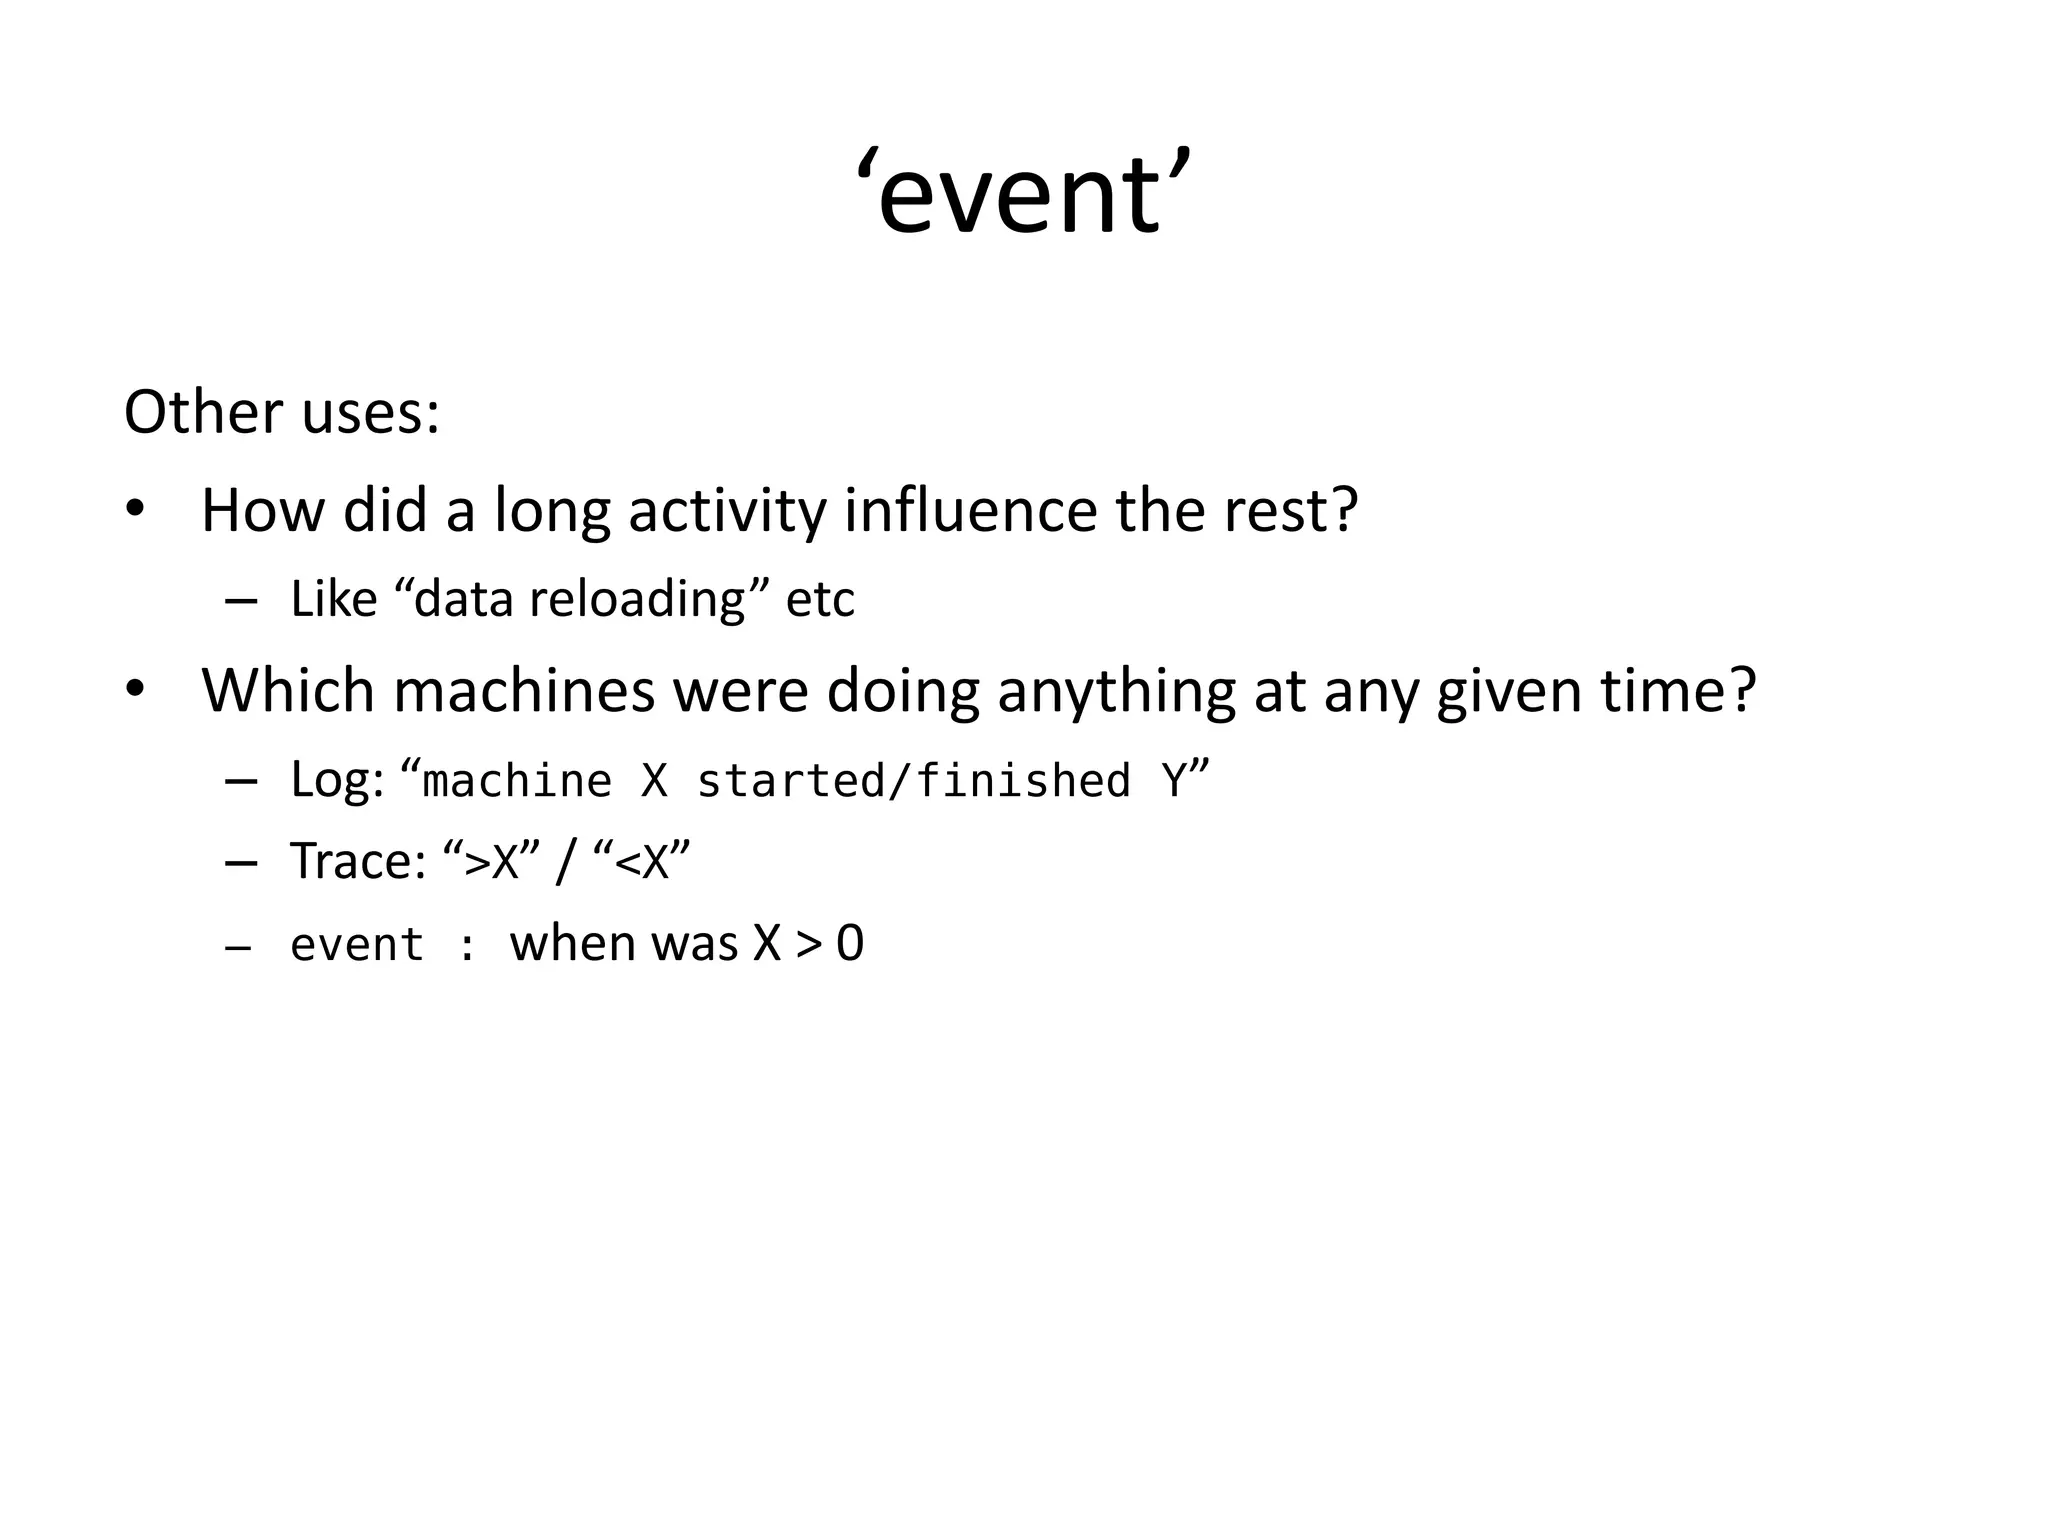
![‘event’
'event' is for event diagrams: activities are drawn like --[===]--- , pulse events like --|--
Which ‘computation sites’ were active
at any given time?
12/9/2010 5:31:25 >site-0
12/9/2010 5:31:25 >site-4
12/9/2010 5:31:25 >site-1
12/9/2010 5:31:25 >site-5
12/9/2010 5:31:25 >site-3
12/9/2010 5:31:25 >site-2
12/9/2010 5:35:27 <site-2
12/9/2010 5:35:28 >site-6
12/9/2010 5:36:14 <site-4
12/9/2010 5:36:15 >site-7
…
-k site event](https://image.slidesharecdn.com/twovisualizationtools-101216081249-phpapp01/75/Two-visualization-tools-64-2048.jpg)
![‘count’
INFO 2010-12-02 07:08:10.422 [Pool-1] A task arrived
INFO 2010-12-02 07:08:10.440 [Pool-2] A task arrived
INFO 2010-12-02 07:08:10.518 [Pool-3] Task finished
…
2010-12-02 07:08:10.422 !begin/5s
2010-12-02 07:08:10.422 >running
2010-12-02 07:08:10.440 !begin/5s
2010-12-02 07:08:10.440 >running
2010-12-02 07:08:10.518 !end/5s
2010-12-02 07:08:10.518 <running
… count 5
Tasks started/finished per 5s
Max active tasks per 5s](https://image.slidesharecdn.com/twovisualizationtools-101216081249-phpapp01/75/Two-visualization-tools-66-2048.jpg)
![How much time memcached took on a 360-node cluster, in each 10-second interval
2010-12-09 01:00:57.738 =memcached/10s 0.059
It was quite unstable.
-k memcached ‘sum 10’
Ok, actually
duration[-] sum 10
Stay tuned!](https://image.slidesharecdn.com/twovisualizationtools-101216081249-phpapp01/75/Two-visualization-tools-69-2048.jpg)
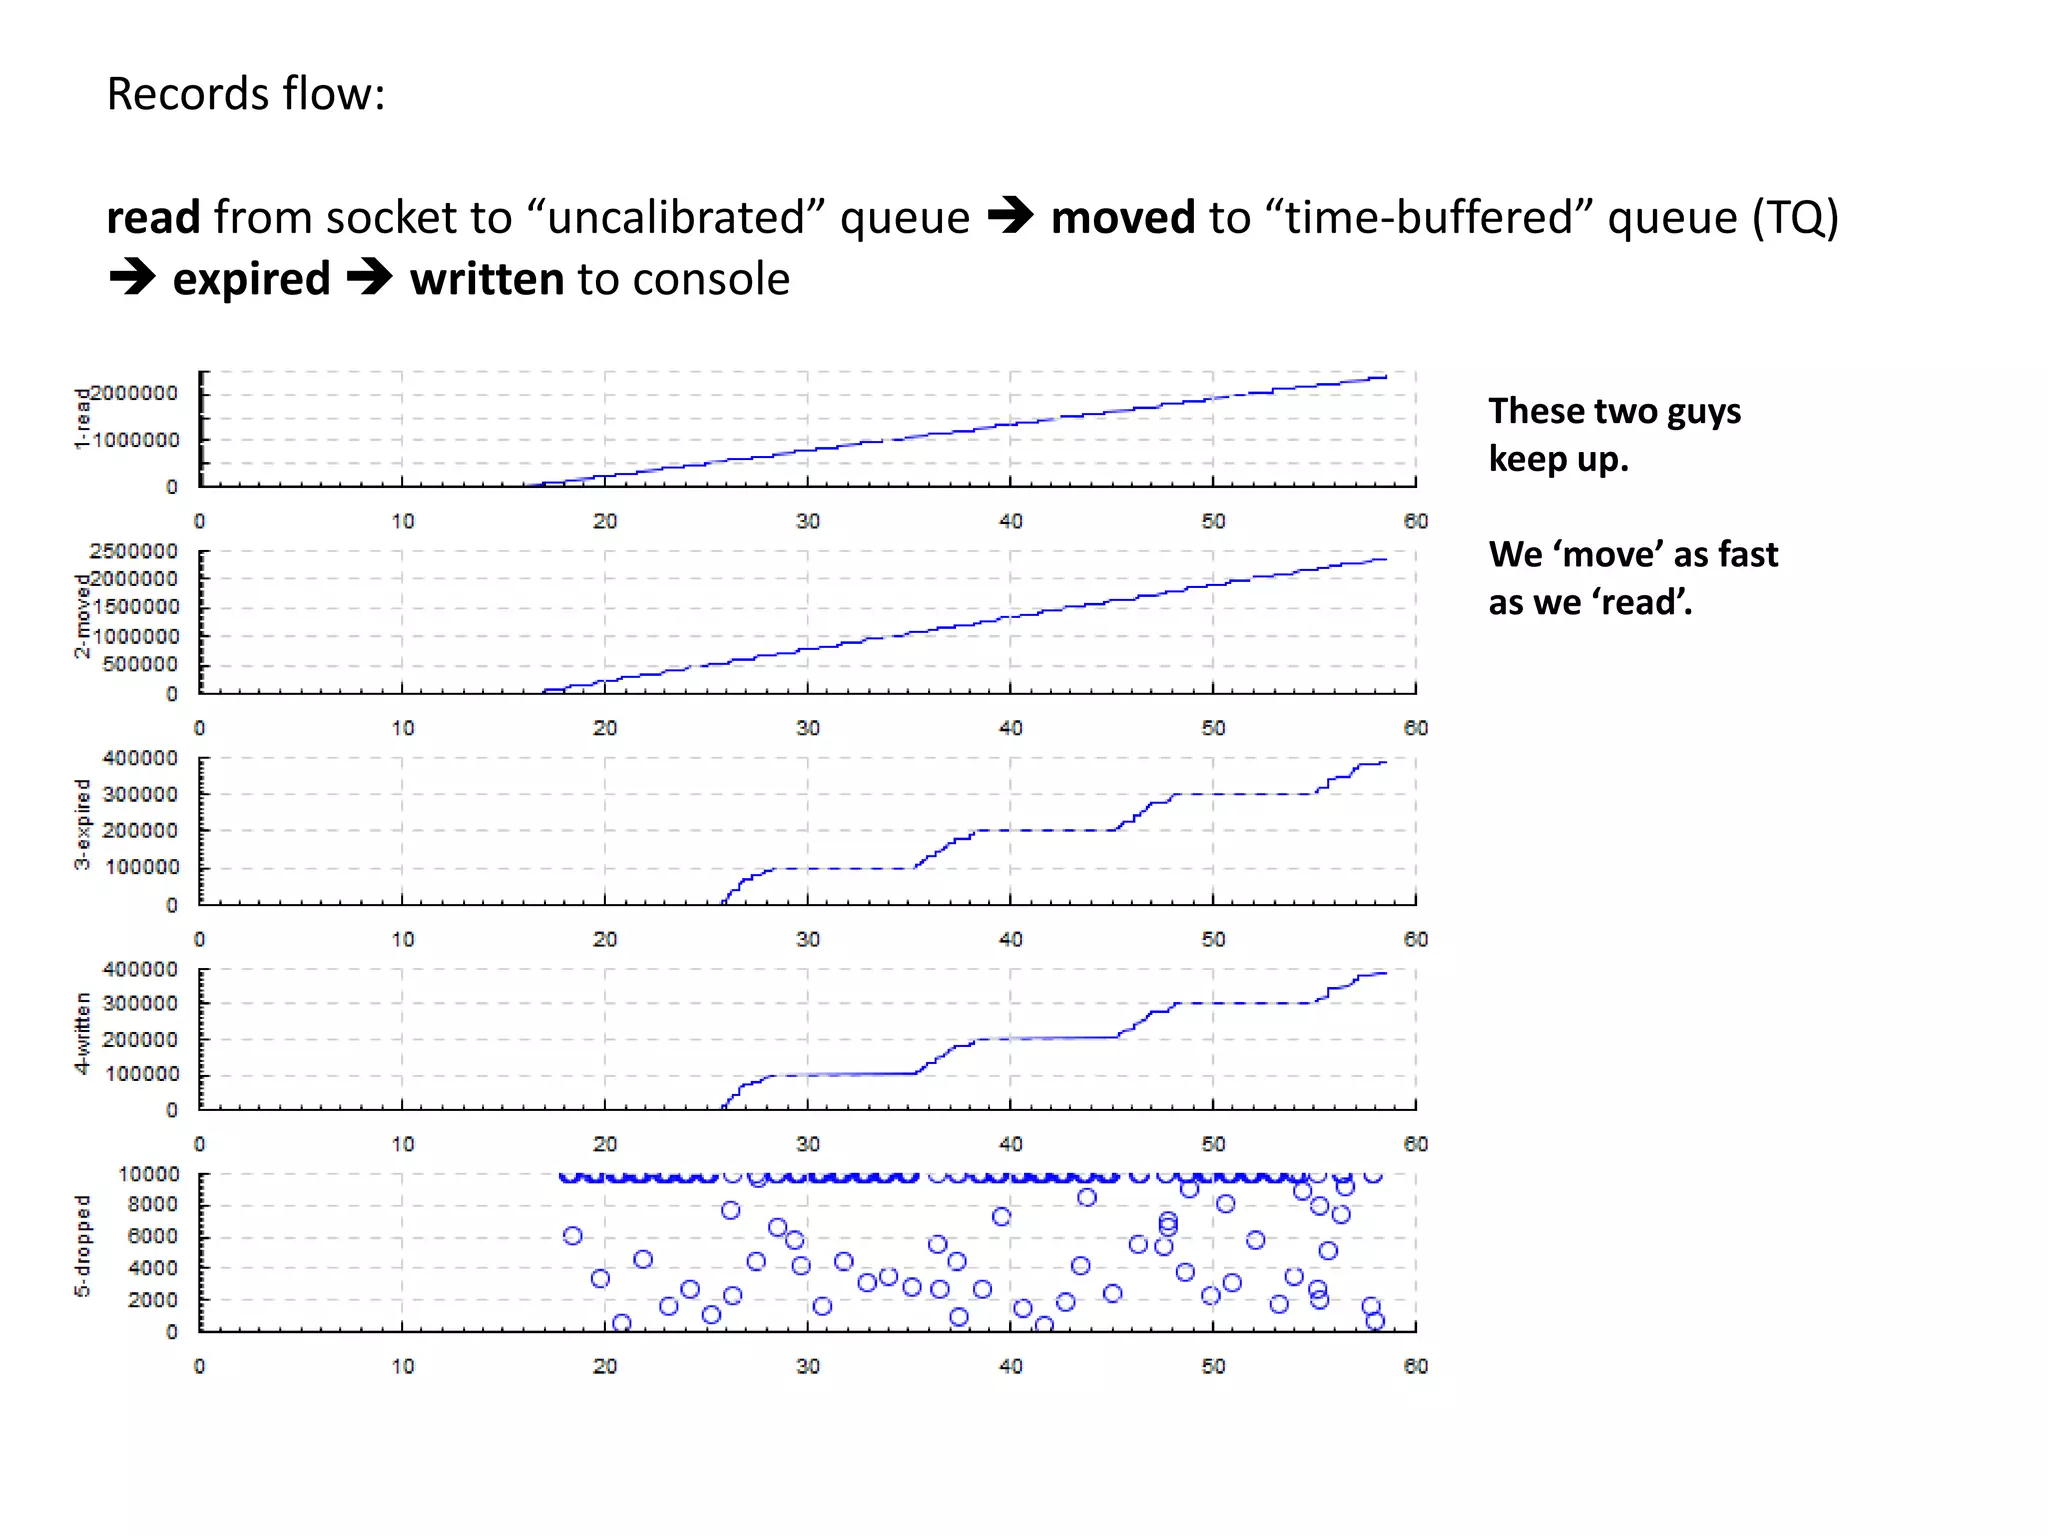
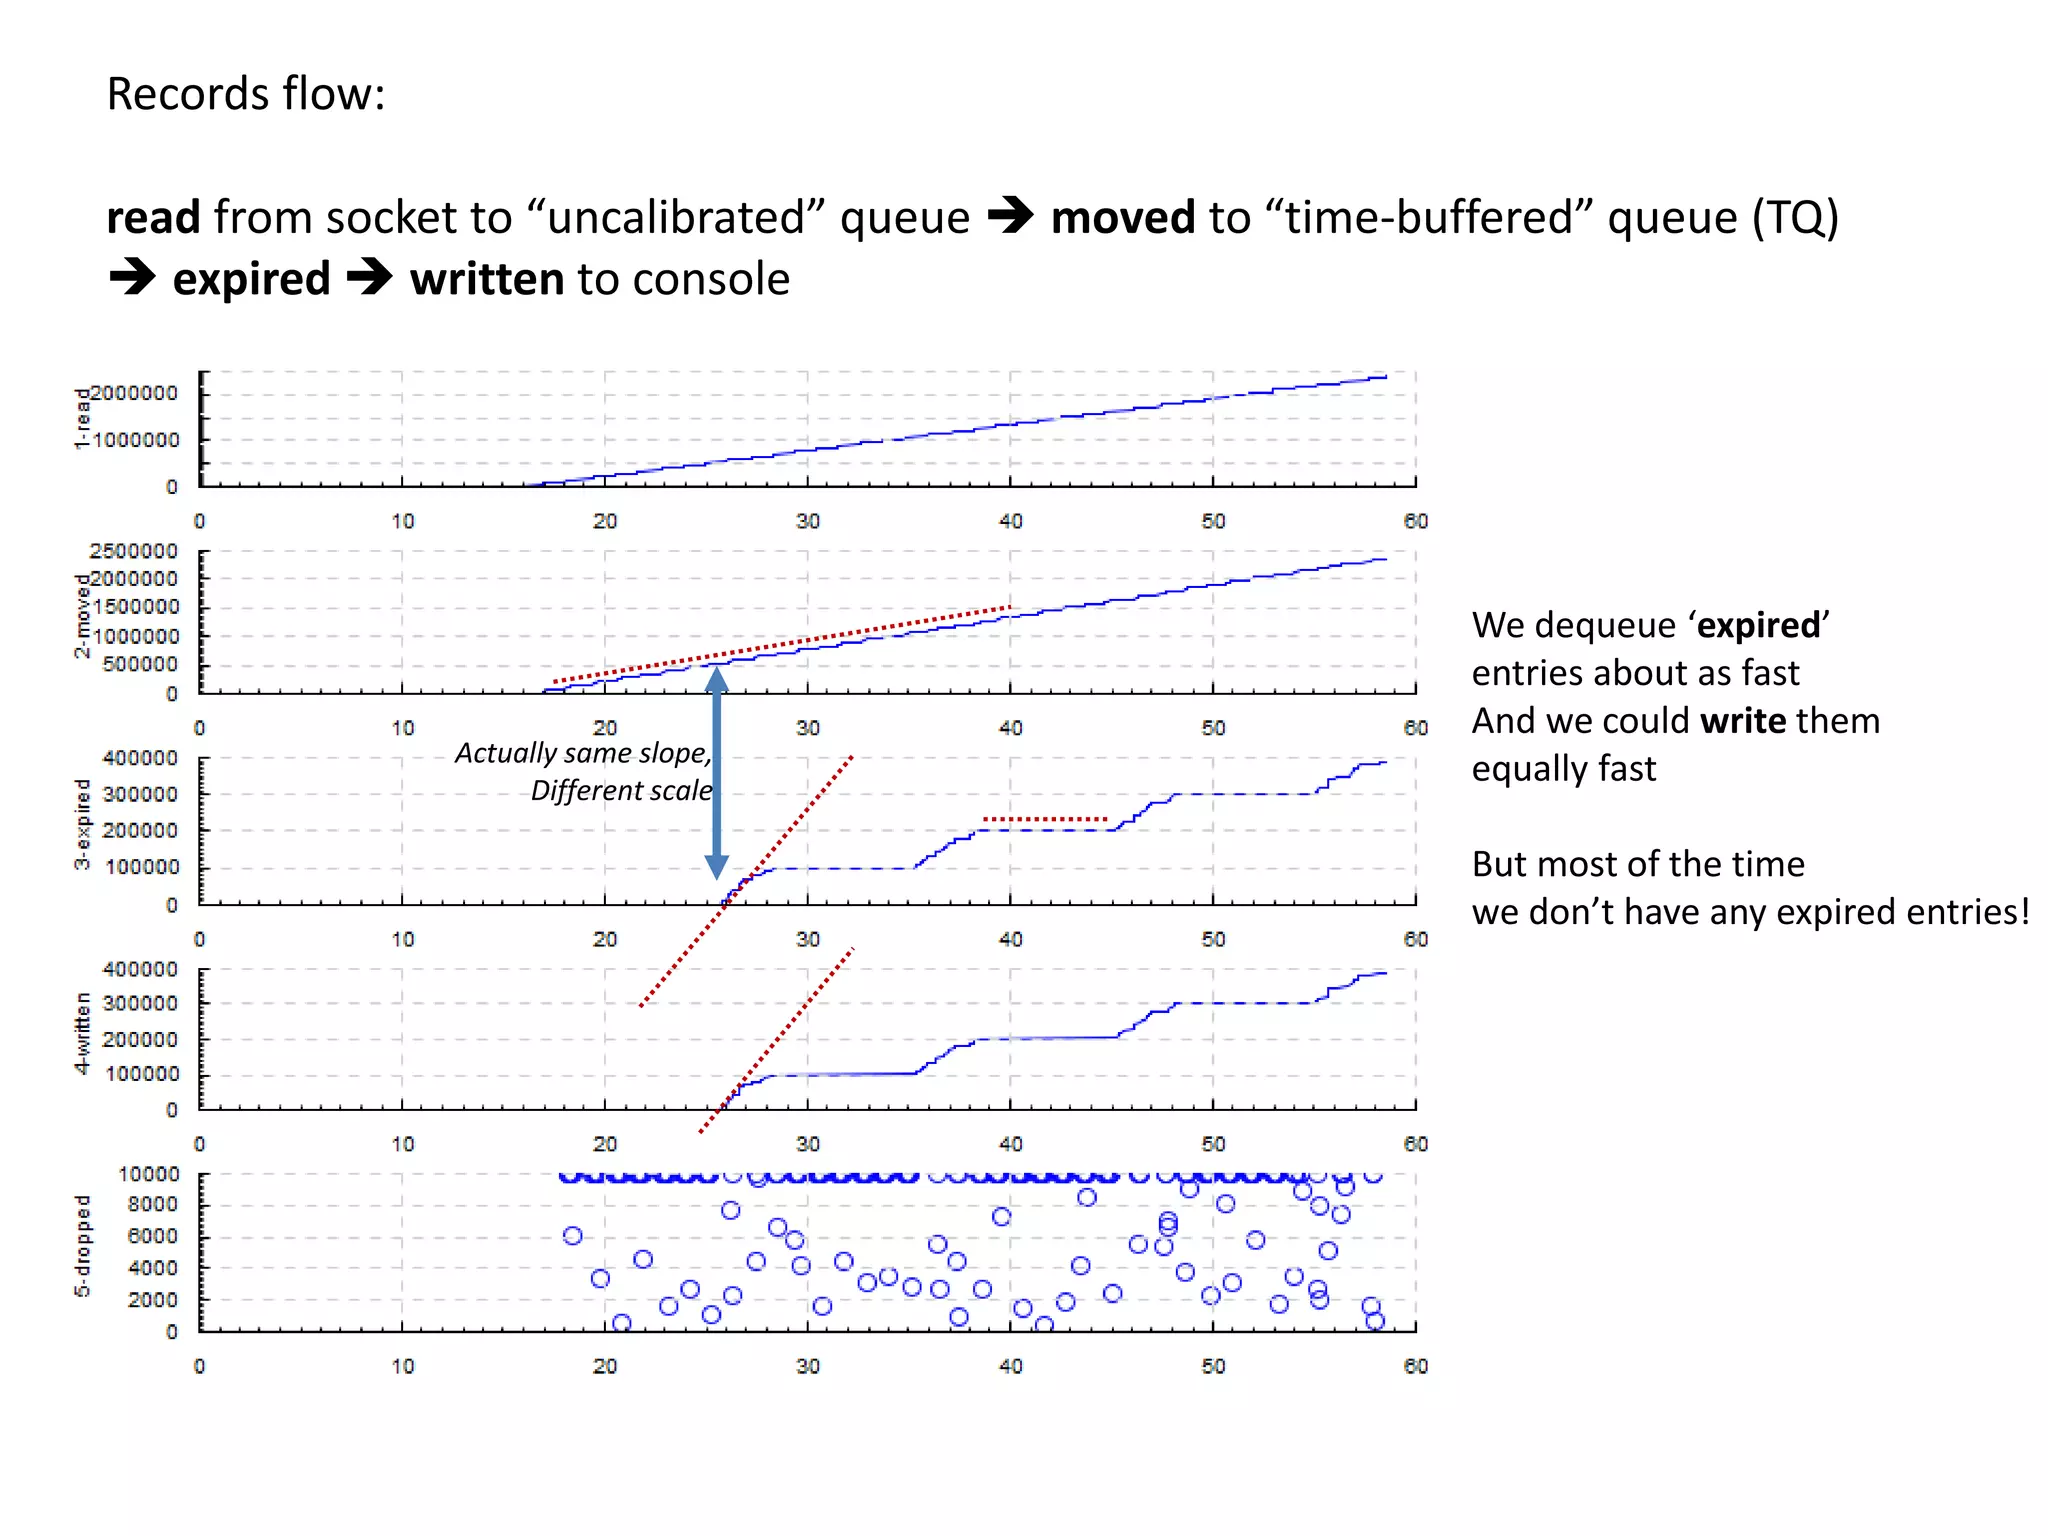
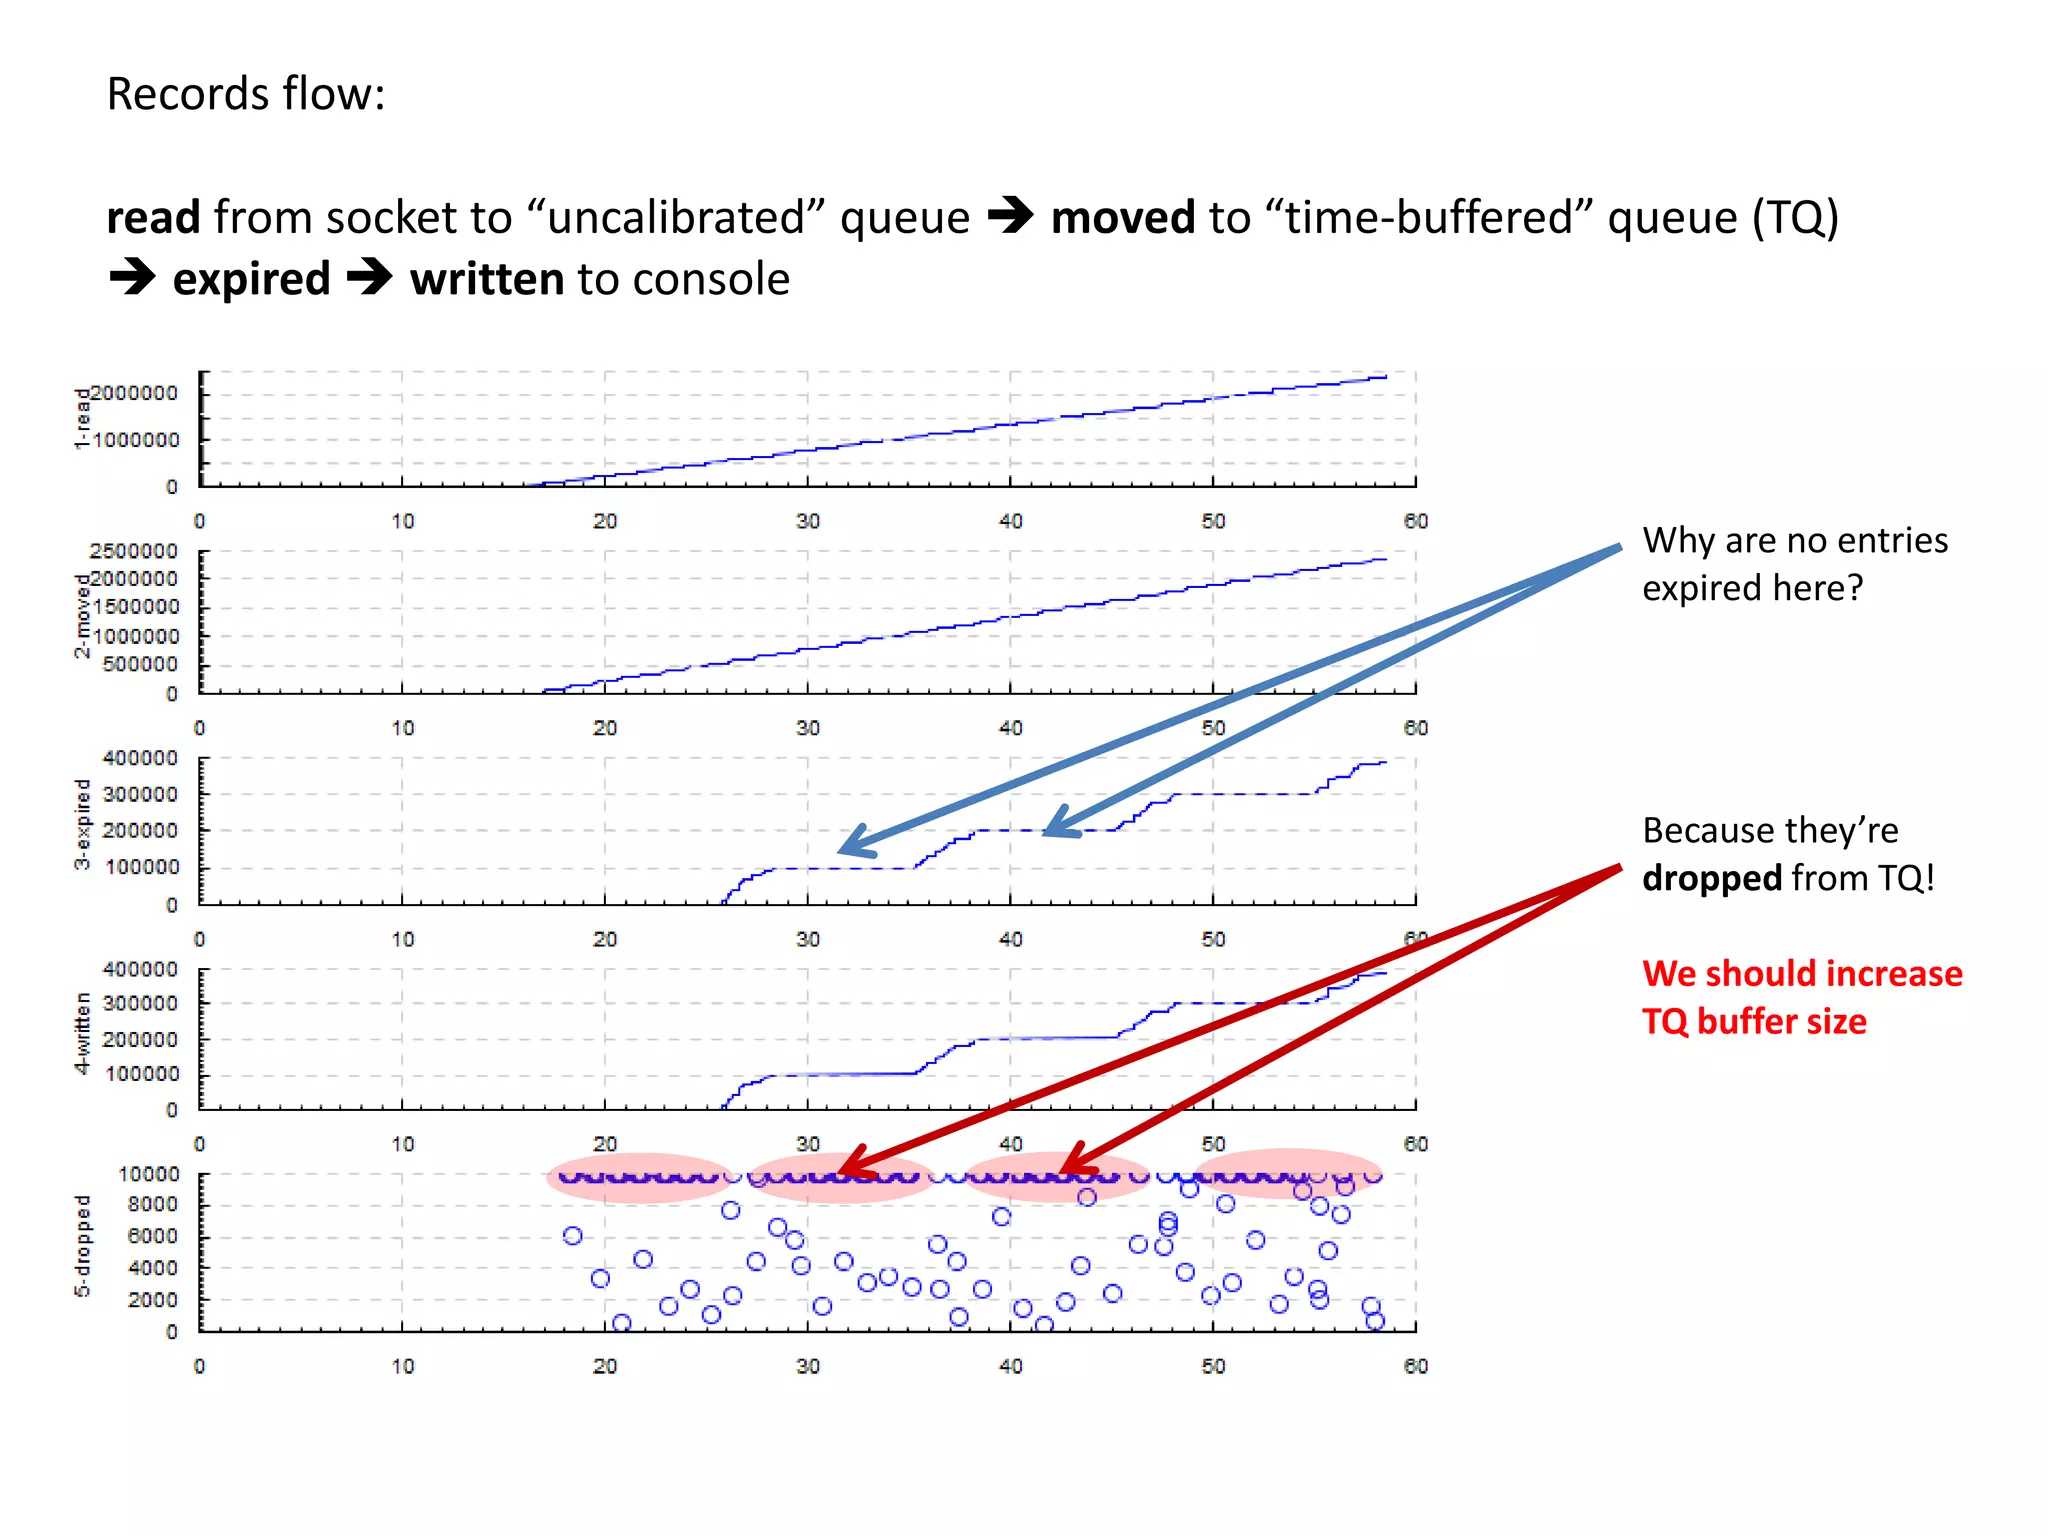
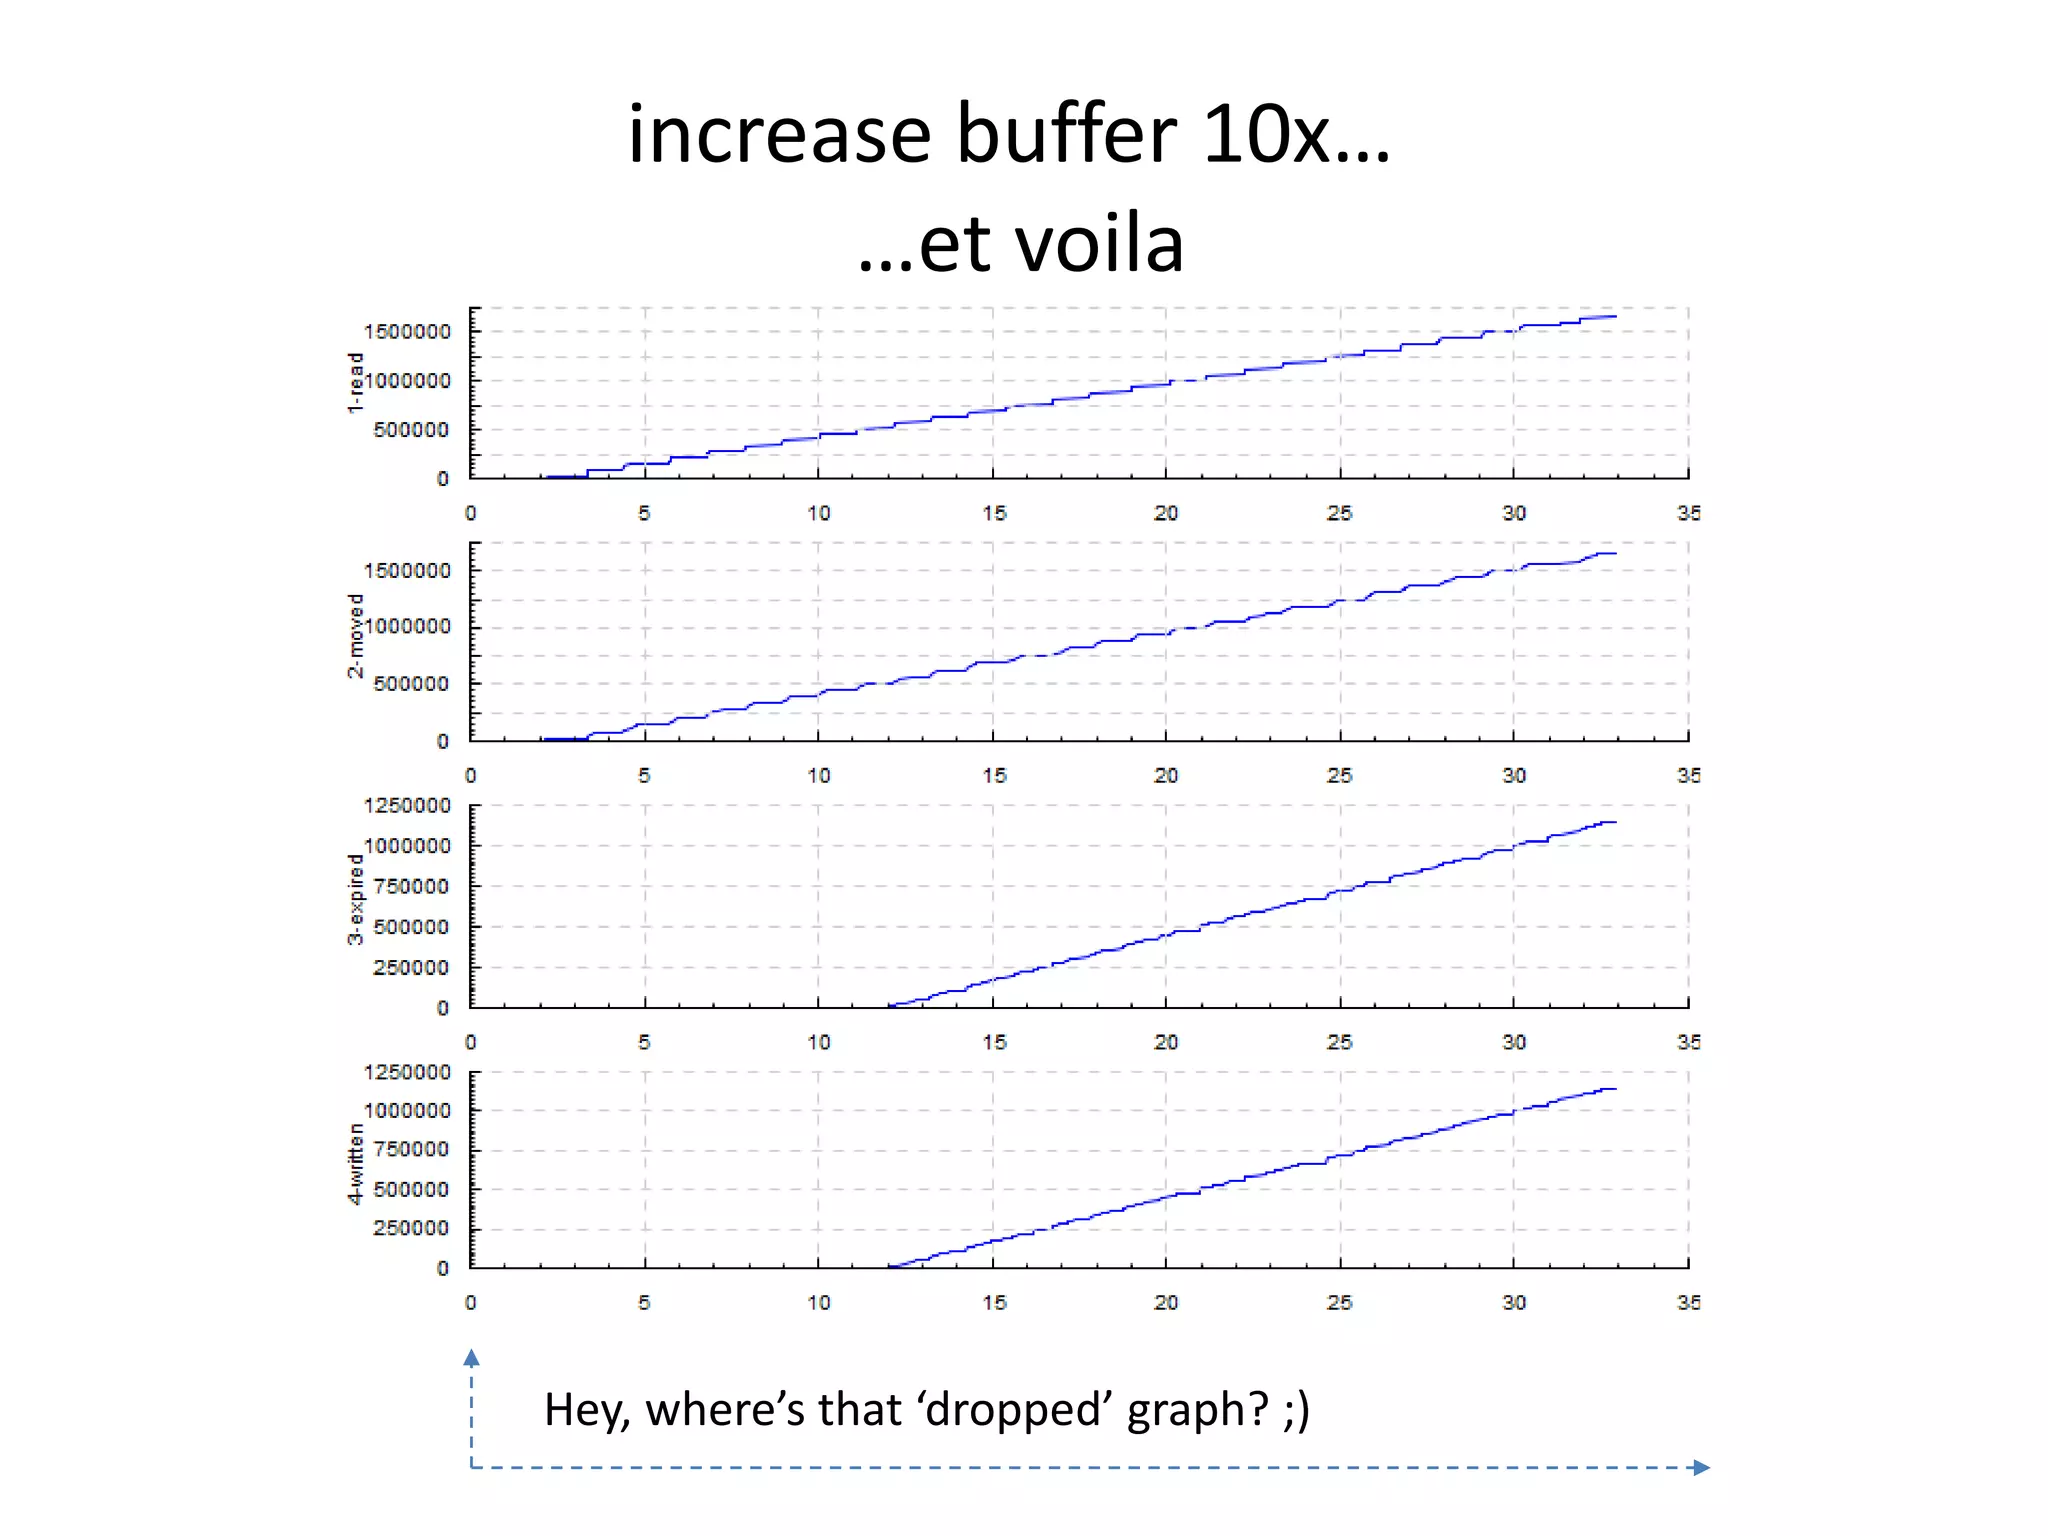
![Records flow:
read from socket to “uncalibrated” queue moved to “time-buffered” queue (TQ)
expired written to console
00013846 58.27768326 [332] Dequeued uncalibrated: 0 58.27768326 =2-moved 0
00013847 58.29270172 [332] TQ dequeued 0 entries 58.29270172 =3-expired 0
00013848 58.57195663 [332] Dequeued uncalibrated: 0 58.57195663 =2-moved 0
00013849 58.57243347 [332] TQ dequeued 59 entries 58.57243347 =3-expired 59
00013850 58.57282257 [332] Dequeued uncalibrated: 0 58.57282257 =2-moved 0
00013851 58.57336044 [332] Read 10000 entries from socket 58.57336044 =1-read 10000
00013852 58.57374191 [332] Read 10000 entries from socket 58.57374191 =1-read 10000
00013853 58.57406998 [332] Read 10000 entries from socket 58.57406998 =1-read 10000
00013854 58.57439423 [332] Read 10000 entries from socket 58.57439423 =1-read 10000
00013855 58.57477188 [332] Read 10000 entries from socket 58.57477188 =1-read 10000
00013856 58.57511139 [332] Writer dequeued 59 records 58.57511139 =4-written 59
-k dropped dots
-dk cumsum](https://image.slidesharecdn.com/twovisualizationtools-101216081249-phpapp01/75/Two-visualization-tools-70-2048.jpg)
![‘duration’
• Log: “Started quizzling”, “Finished quizzling”
• We wonder about quizzling durations
• Trace >quizzle, <quizzle
• ‘duration XXX’ plots XXX over durations
• Examples:
– duration dots
– duration sum 10
– duration binh 100,200,500
– duration quantile 1 0.5,0.75,0.95
• duration[SEP] is more universal](https://image.slidesharecdn.com/twovisualizationtools-101216081249-phpapp01/75/Two-visualization-tools-81-2048.jpg)
![‘duration*SEP+’
• Log: “UNIT035 started quizzling”, “UNIT035 Finished quizzling”
• We wonder about quizzling durations
• Trace >quizzle@UNIT035, <quizzle@UNIT035
• ‘duration[SEP] XXX’ plots XXX over durations
• Like ‘duration XXX’ but durations of all actors go to 1 track
• Examples:
– duration[@] dots
– duration[@] sum 10
– duration[@] binh 100,200,500
– duration[@] quantile 1 0.5,0.75,0.95](https://image.slidesharecdn.com/twovisualizationtools-101216081249-phpapp01/75/Two-visualization-tools-82-2048.jpg)
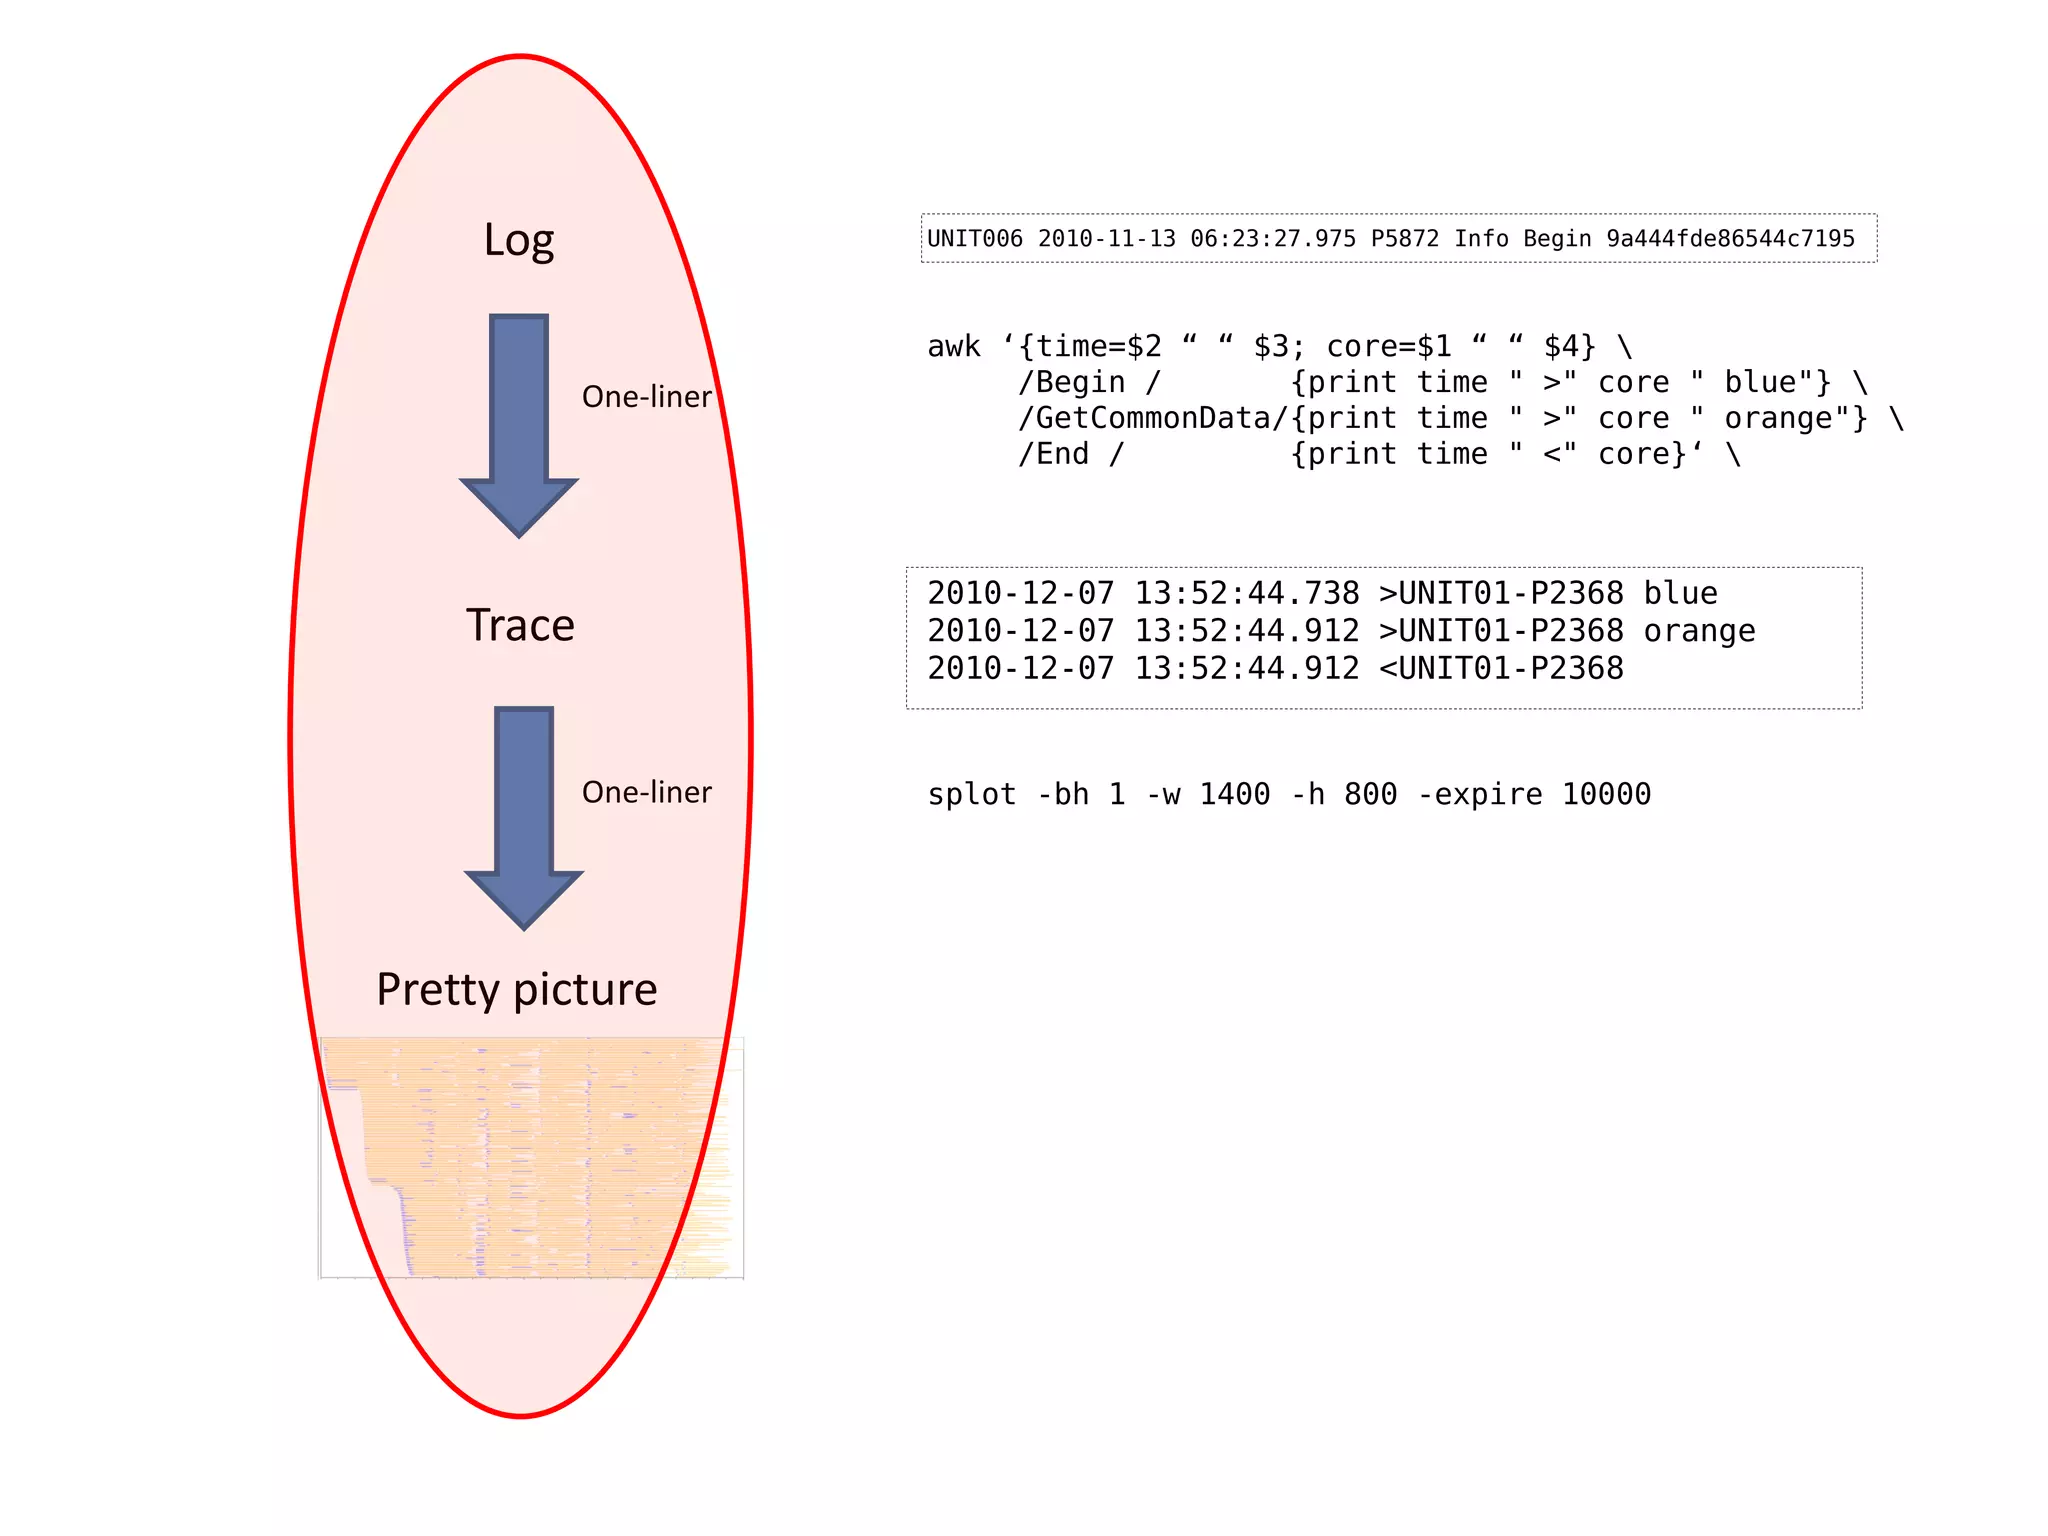
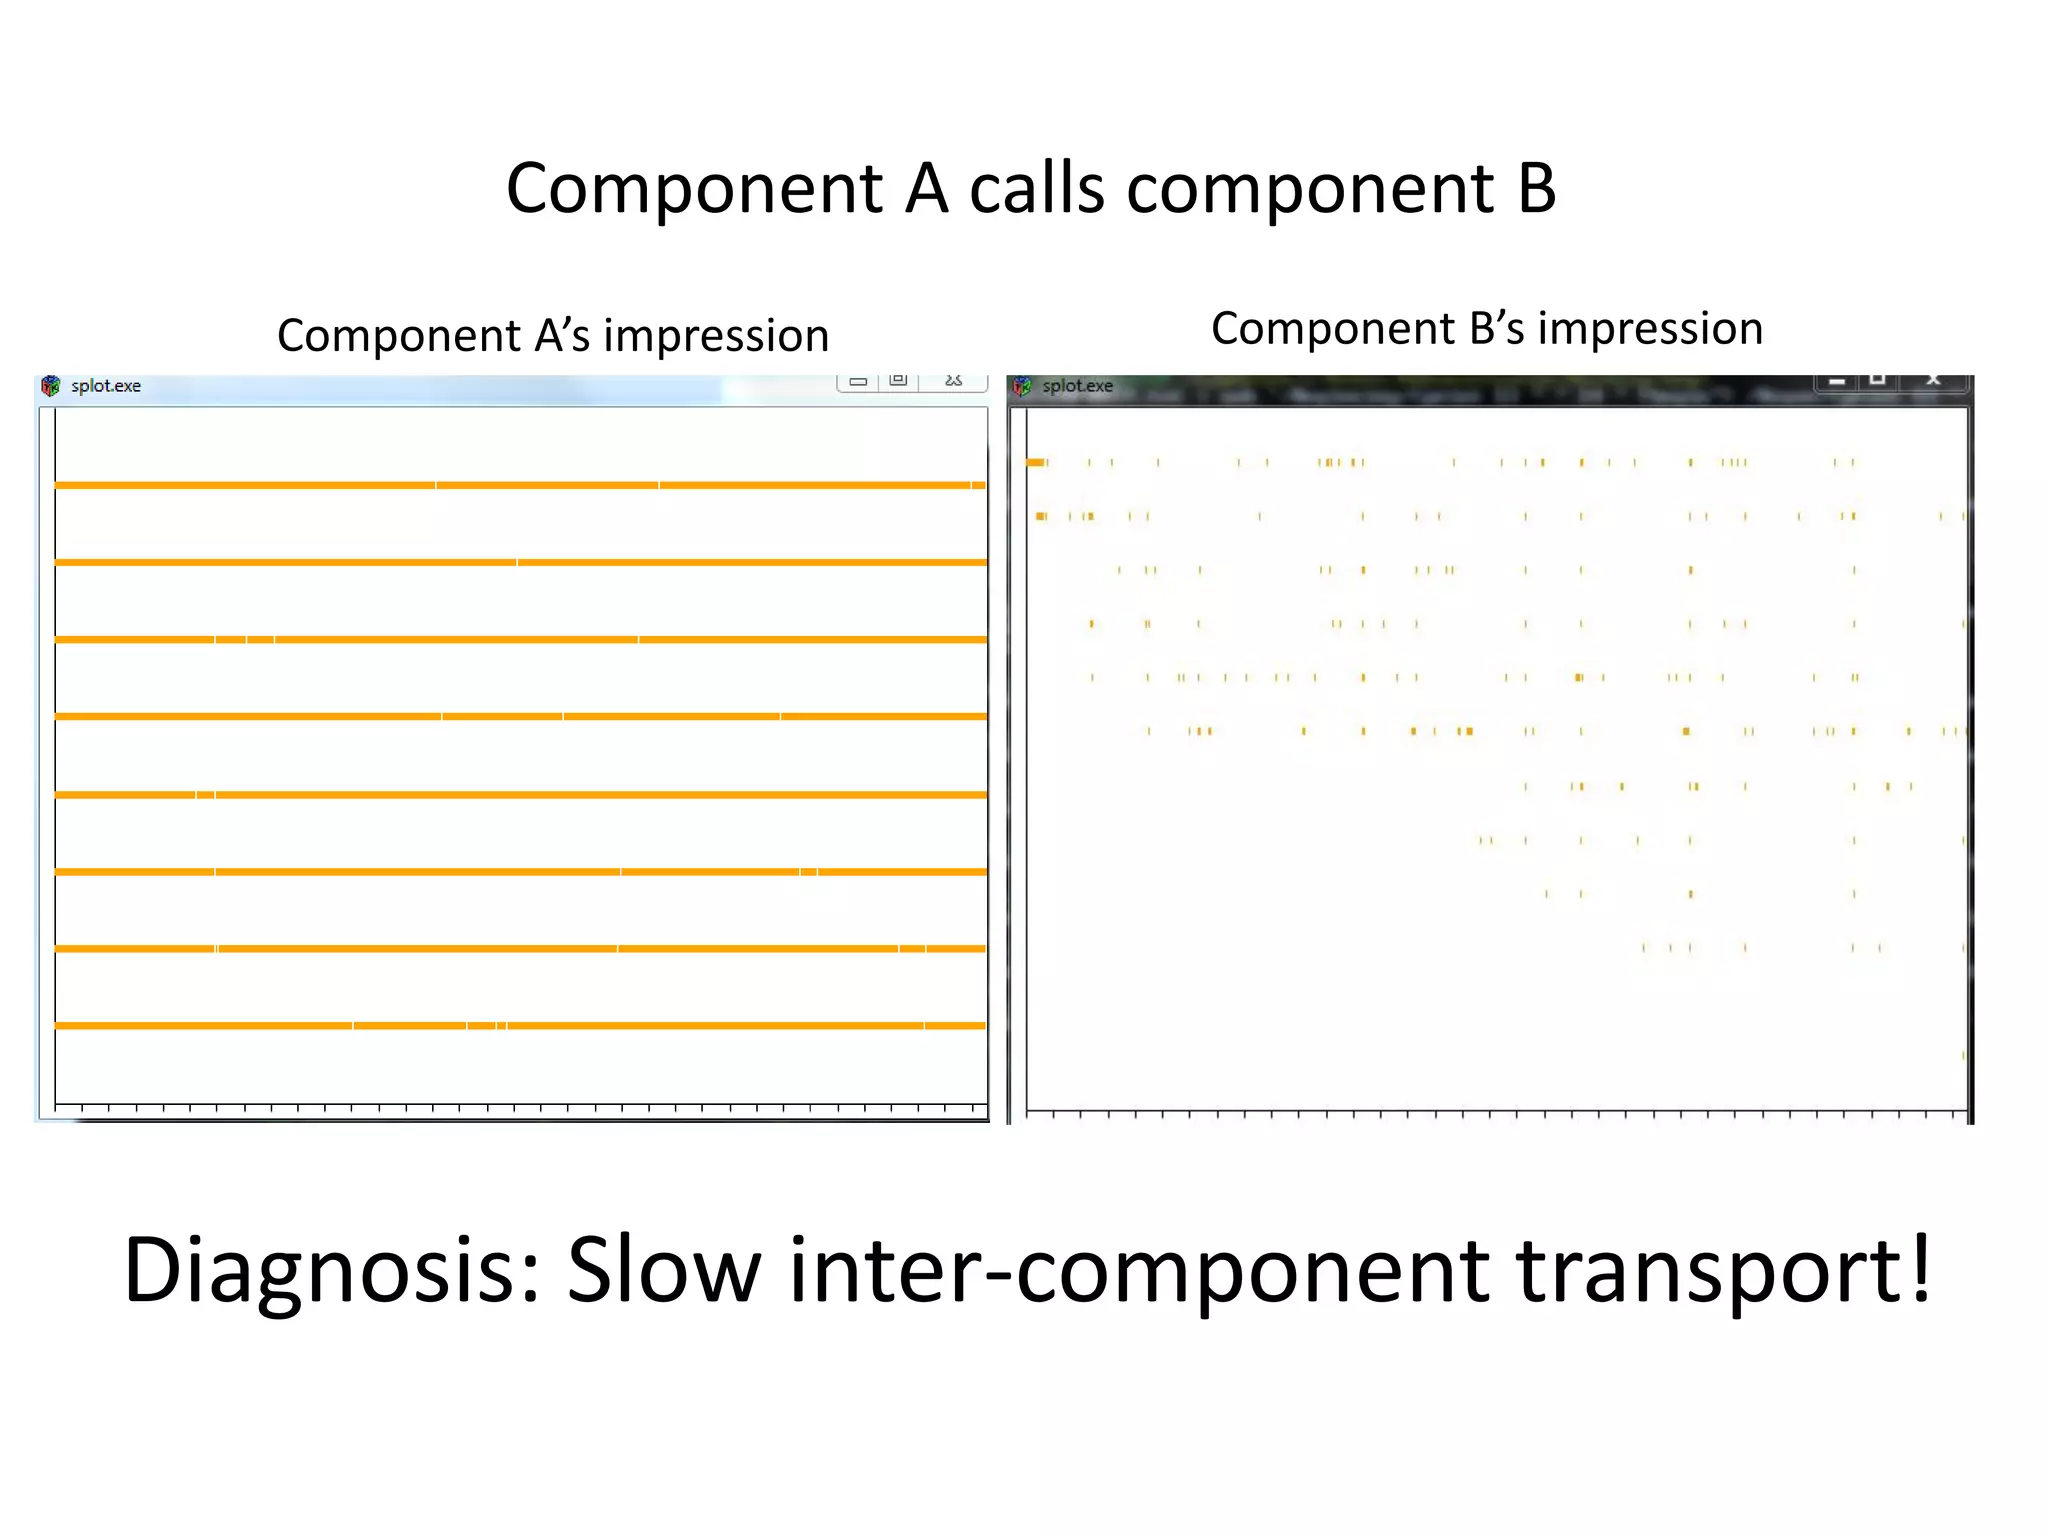
![UNIT011 is on blade 1, UNIT051 is on blade 5, memcached is on blade 1.
UNIT011 2010-12-09 01:54:41.927 P3964 Info Begin 390256d1-ce56-4f23-8428-1e1b109ab61c/51
<memcached-UNIT011.P3964
UNIT011 2010-12-09 01:54:41.928 P3964 Debug GetCommonData 390256d1-ce56-4f23-8428-1e1b109ab61c/51
UNIT051 2010-12-09 01:54:42.045 P3832 Info Begin 390256d1-ce56-4f23-8428-1e1b109ab61c/99
UNIT051 2010-12-09 01:54:42.045 P3164 Info Begin 390256d1-ce56-4f23-8428-1e1b109ab61c/98
memcached-UNIT011
UNIT051 2010-12-09 01:54:42.046 P3164 Debug GetCommonData 390256d1-ce56-4f23-8428-1e1b109ab61c/98
UNIT051 2010-12-09 01:54:42.046 P3832 Debug GetCommonData 390256d1-ce56-4f23-8428-1e1b109ab61c/99
UNIT011 2010-12-09 01:54:42.132 P2740 Info Begin 390256d1-ce56-4f23-8428-1e1b109ab61c/135
UNIT011 2010-12-09 01:54:42.132 P4032 Info Begin 390256d1-ce56-4f23-8428-1e1b109ab61c/136
UNIT011 2010-12-09 01:54:42.133 P2740 Debug GetCommonData 390256d1-ce56-4f23-8428-1e1b109ab61c/135
UNIT011 2010-12-09 01:54:42.133 P4032 Debug GetCommonData 390256d1-ce56-4f23-8428-1e1b109ab61c/136
awk ‘{t=$2 “ “ $3; p=“memcached-” $1 “.” $4}
/Begin /{print t " >” p}
/GetCommonData /{print t " <“ p}'
2010-12-09 01:54:41.853 <memcached-UNIT011.P3964
2010-12-09 01:54:41.927 >memcached-UNIT011.P3964
2010-12-09 01:54:42.001 <memcached-UNIT051.P3164
2010-12-09 01:54:42.002 <memcached-UNIT051.P3832
2010-12-09 01:54:42.045 >memcached-UNIT051.P3832
2010-12-09 01:54:42.045 >memcached-UNIT051.P3164
2010-12-09 01:54:42.128 <memcached-UNIT011.P2740
-dk ‘duration[.] binf 10 0.001,0.002,0.005,0.01,0.05‘
So, apparently, memcached access times
for blade 1 are smaller.
Who’d have thought ](https://image.slidesharecdn.com/twovisualizationtools-101216081249-phpapp01/75/Two-visualization-tools-83-2048.jpg)

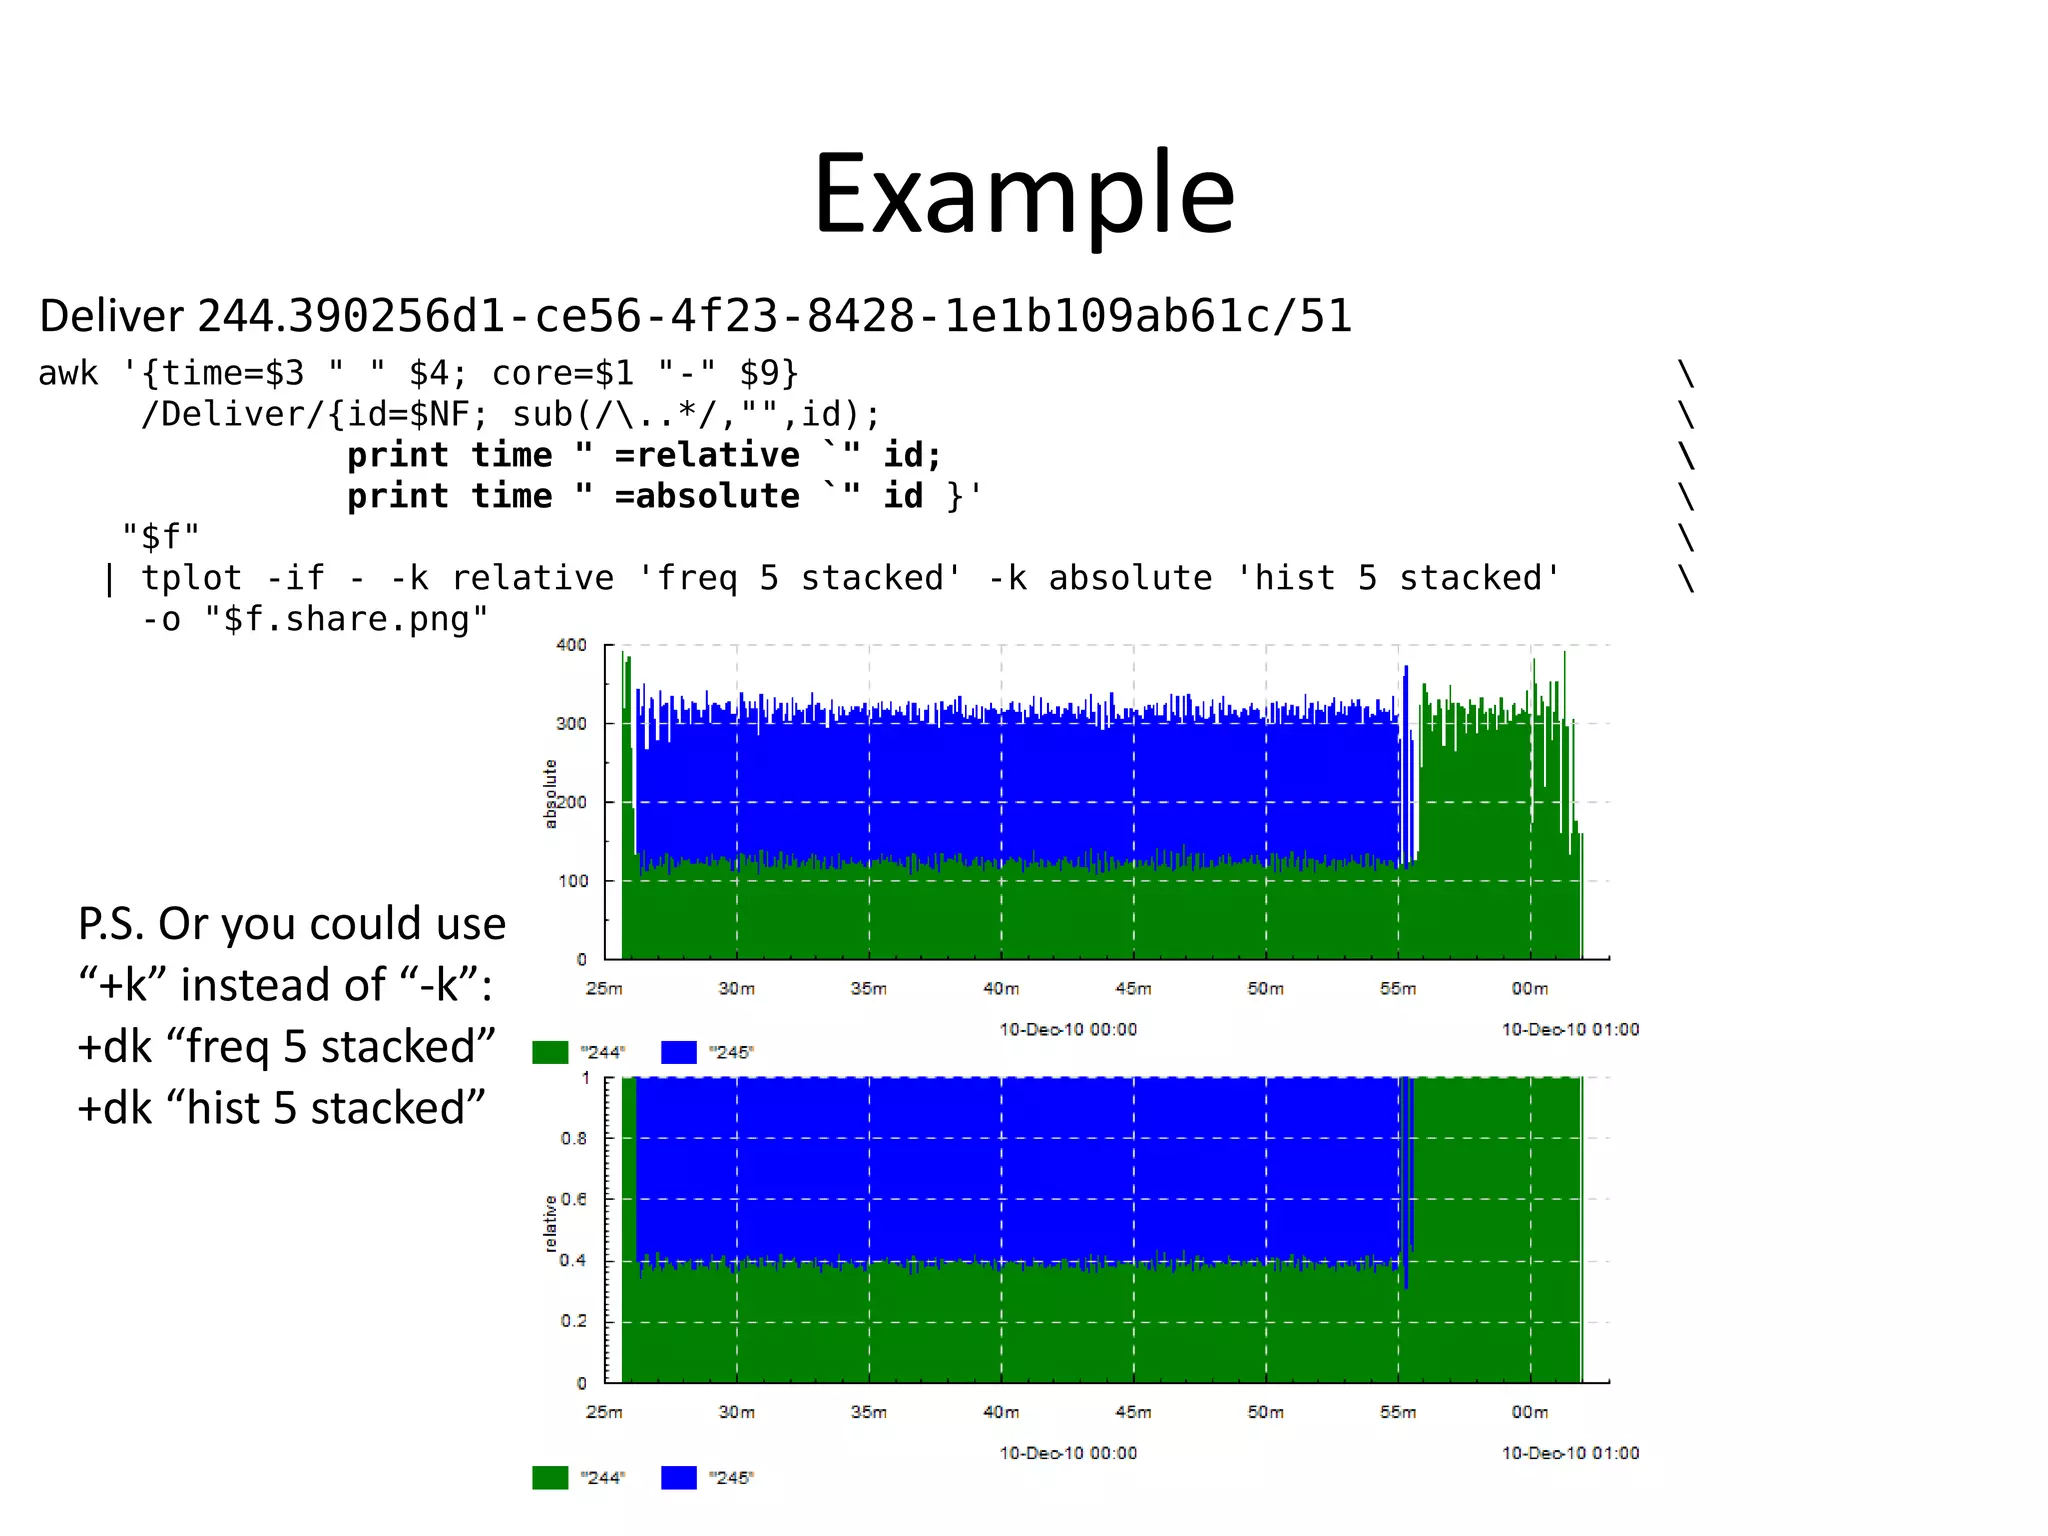
![Example
cat log.txt
| grep 'UNIT0[15]1'
| awk '/Begin / {print $3 " " $4 " >memcached-" $1 "." $9}
/GetCommonData /{print $3 " " $4 " <memcached-" $1 "." $9}'
| tplot -if - -dk 'duration[.] binf 10 0.001,0.002,0.005,0.01,0.05' -of x](https://image.slidesharecdn.com/twovisualizationtools-101216081249-phpapp01/75/Two-visualization-tools-92-2048.jpg)
![P.S. Installation on Linux
• Install http://hackage.haskell.org/platform/
– Better from source (not from package manager – may be outdated)
• cabal update
• cabal install alex
• cabal install gtk2hs-buildtools
• Add /home/YOURSELF/.cabal/bin to PATH
– Don’t use ~/.cabal/bin
• Restart your shell (to update PATH)
• Install dev libraries for glib, cairo, pango, gtk
– sudo apt-get install libglib2.0-dev libcairo2-dev libpango1.0-dev libgtk2.0-dev
• cabal install gtk
• cabal install [--flags=gtk] timeplot
• cabal install splot](https://image.slidesharecdn.com/twovisualizationtools-101216081249-phpapp01/75/Two-visualization-tools-95-2048.jpg)
![P.S. Installation on Windows
• Install http://hackage.haskell.org/platform/
• Follow http://jystic.com/2010/10/20/installing-gtk2hs-on-windows/
• cabal update
• cabal install [--flags=gtk] timeplot
• cabal install splot
• Install http://www.cygwin.com/ for awk or whatever
• Use cygwin shell](https://image.slidesharecdn.com/twovisualizationtools-101216081249-phpapp01/75/Two-visualization-tools-96-2048.jpg)


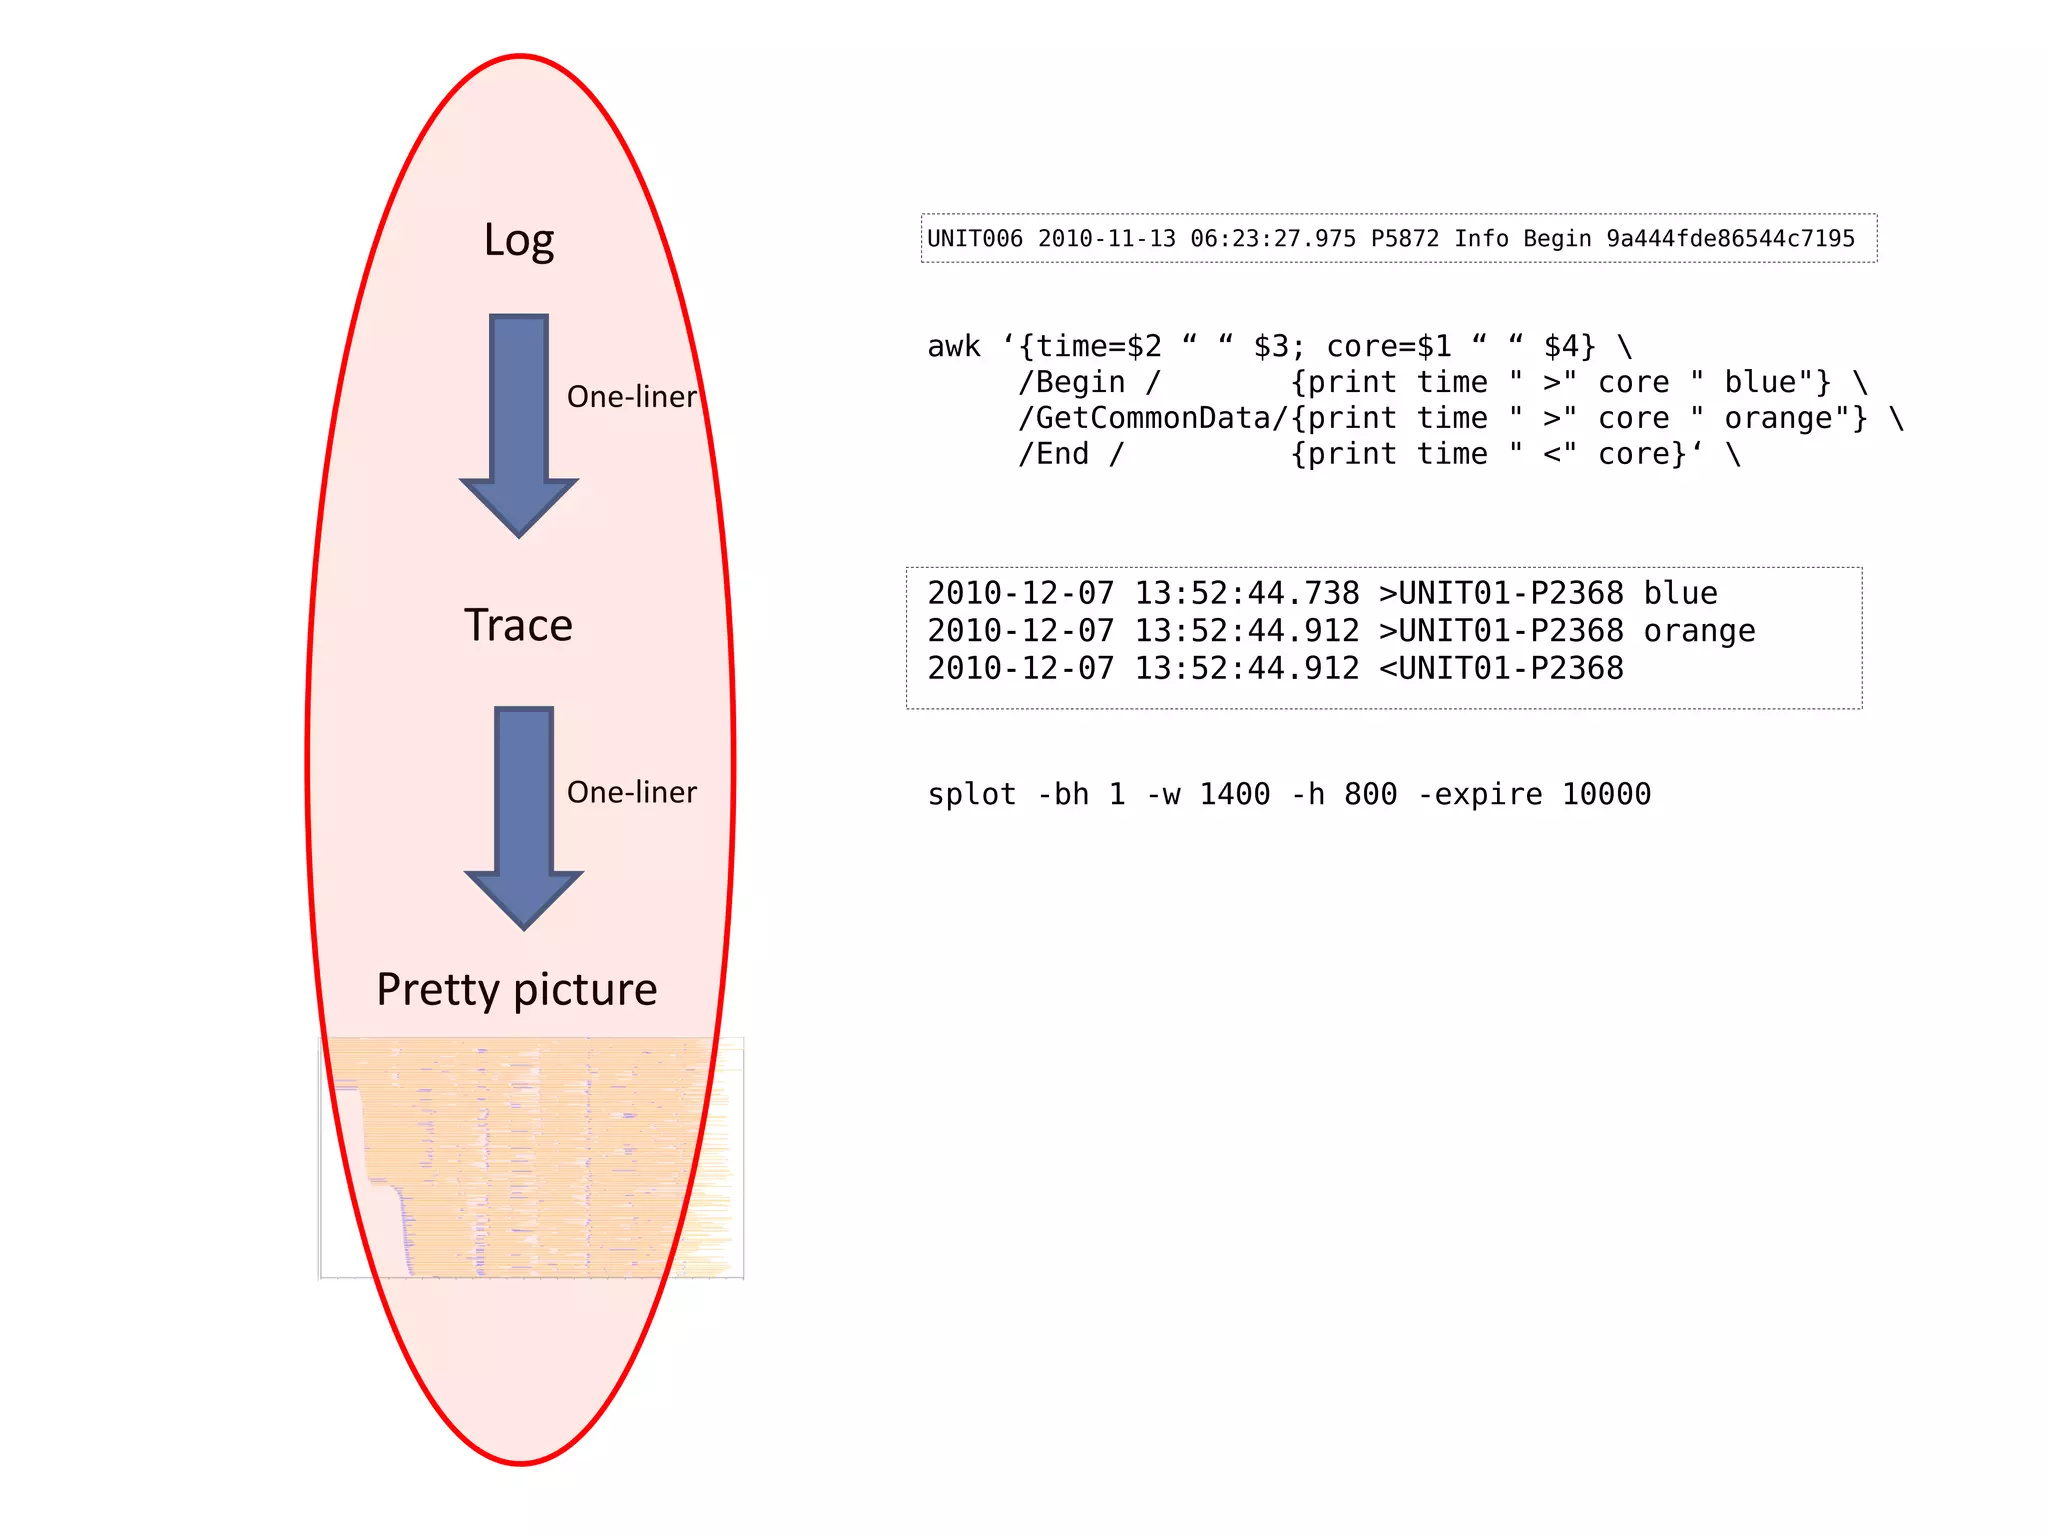
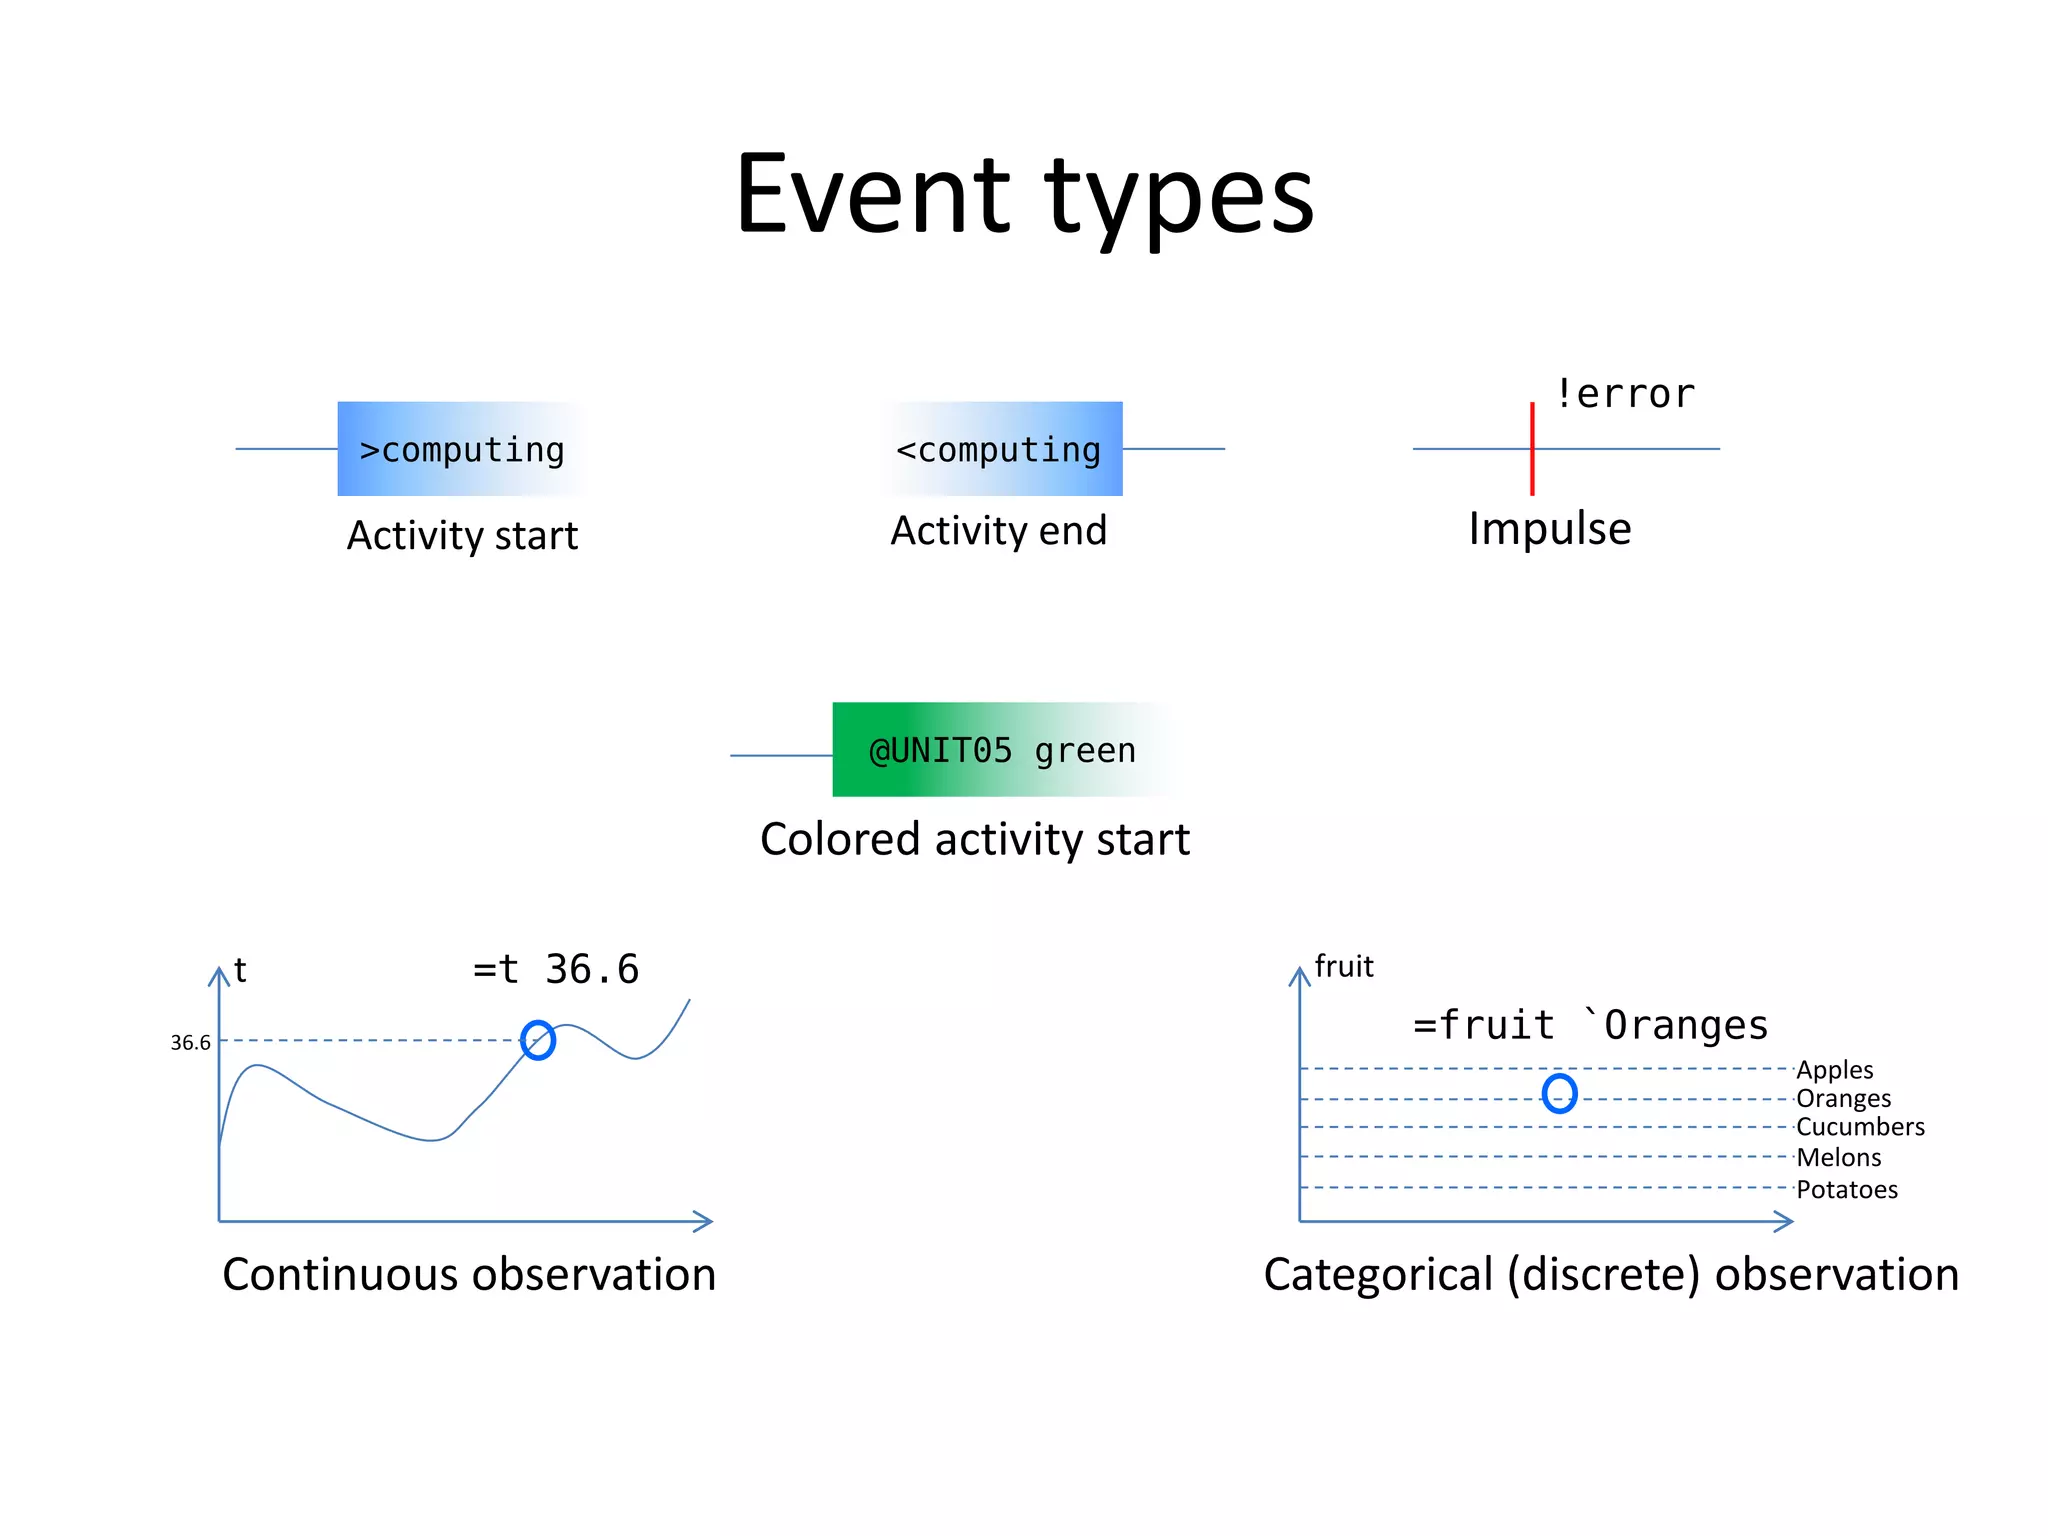
The document describes two visualization tools: splot and tplot. Splot creates state plots from log files, showing states of different actors over time. Tplot creates time plots, showing how quantitative metrics change over time. Both tools take log files as input, use simple text processing like awk to extract time and actor/metric information, and output interactive visualizations without depending on log or domain specifics. They aim to help users quickly gain insights by visualizing patterns that are difficult to see otherwise.


![[52nd KUG PP] Intro KUG](https://cdn.slidesharecdn.com/ss_thumbnails/introkug-100117080401-phpapp01-thumbnail.jpg?width=640&height=640&fit=bounds)