Determining the optimal strategy for reopening schools, the impact of test and trace interventions, and the risk of occurrence of a second COVID-19 epidemic wave in the UK: a modelling study. Jasmina Panovska-Griffiths & others

This modelling study used an individual-based model called Covasim to evaluate the impact of two school reopening strategies (full time or part time rota system) combined with three testing scenarios on preventing a second COVID-19 wave in the UK. The model was calibrated using UK COVID-19 data and suggested testing rates of 1.98% for symptomatic individuals. The findings indicate that with increased testing of symptomatic individuals (between 59-87% depending on scenario) and effective contact tracing, a second wave could be prevented. However, without sufficient testing and tracing, school reopening is likely to induce a second wave peaking in December 2020 or February 2021. Large-scale population testing is needed along with school reopening to avoid

Recommended
Recommended
More Related Content
What's hot
What's hot (17)
Similar to Determining the optimal strategy for reopening schools, the impact of test and trace interventions, and the risk of occurrence of a second COVID-19 epidemic wave in the UK: a modelling study. Jasmina Panovska-Griffiths & others
Similar to Determining the optimal strategy for reopening schools, the impact of test and trace interventions, and the risk of occurrence of a second COVID-19 epidemic wave in the UK: a modelling study. Jasmina Panovska-Griffiths & others (20)
More from eraser Juan José Calderón
More from eraser Juan José Calderón (20)
Recently uploaded
Recently uploaded (20)
Determining the optimal strategy for reopening schools, the impact of test and trace interventions, and the risk of occurrence of a second COVID-19 epidemic wave in the UK: a modelling study. Jasmina Panovska-Griffiths & others
- 1. www.thelancet.com/child-adolescent Published online July 30, 2020 https://doi.org/10.1016/S2352-4642(20)30250-9 1 Articles LancetChild Adolesc Health 2020 Published Online August 3, 2020 https://doi.org/10.1016/ S2352-4642(20)30250-9 See Online/Comment https://doi.org/10.1016/ S2352-4642(20)30249-2 *Joint senior authors Department of Applied Health Research and Institute for Global Health, University College London, London, UK (J Panovska-Griffiths DPhil); The Queen’s College, University of Oxford, Oxford, UK (J Panovska-Griffiths); Institute for Disease Modeling, Bellevue, WA, USA (C C Kerr PhD, D Mistry PhD, D J Klein PhD); Complex Systems Group, School of Physics, University of Sydney, Sydney, NSW,Australia (C C Kerr); Department of Mathematical Sciences, University of Copenhagen, Copenhagen, Denmark (R M Stuart PhD); Burnet Institute, Melbourne,VIC, Australia (R M Stuart); UCL Great Ormond St Institute of Child Health, London, UK (R MViner PhD); and Faculty of Public Health and Policy, London School of Hygiene and Tropical Medicine, London, UK (C Bonell PhD) Correspondence to: Dr Jasmina Panovska-Griffiths, Department of Applied Health Research, University College London, LondonWC1E 6BT, UK j.panovska-griffiths@ucl.ac.uk Determining the optimal strategy for reopening schools, the impact of test and trace interventions, and the risk of occurrence of a second COVID-19 epidemic wave in the UK: a modelling study Jasmina Panovska-Griffiths, Cliff C Kerr, Robyn M Stuart, Dina Mistry, Daniel J Klein, Russell MViner*,Chris Bonell* Summary Background As lockdown measures to slow the spread of severe acute respiratory syndrome coronavirus 2 (SARS-CoV-2) infection begin to ease in the UK, it is important to assess the impact of any changes in policy, including school reopening and broader relaxation of physical distancing measures. We aimed to use an individual-based model to predict the impact of two possible strategies for reopening schools to all students in the UK from September, 2020, in combination with different assumptions about relaxation of physical distancing measures and the scale-up of testing. Methods In this modelling study, we used Covasim, a stochastic individual-based model for transmission of SARS-CoV-2, calibrated to the UK epidemic. The model describes individuals’ contact networks stratified into household, school, workplace, and community layers, and uses demographic and epidemiological data from the UK. We simulated six different scenarios, representing the combination of two school reopening strategies (full time and a part-time rota system with 50% of students attending school on alternate weeks) and three testing scenarios (68% contact tracing with no scale-up in testing, 68% contact tracing with sufficient testing to avoid a second COVID-19 wave, and 40% contact tracing with sufficient testing to avoid a second COVID-19 wave). We estimated the number of new infections, cases, and deaths, as well as the effective reproduction number (R) under different strategies. In a sensitivity analysis to account for uncertainties within the stochastic simulation, we also simulated infectiousness of children and young adults aged younger than 20 years at 50% relative to older ages (20 years and older). Findings With increased levels of testing (between 59% and 87% of symptomatic people tested at some point during an active SARS-CoV-2 infection, depending on the scenario), and effective contact tracing and isolation, an epidemic rebound might be prevented. Assuming 68% of contacts could be traced, we estimate that 75% of individuals with symptomatic infection would need to be tested and positive cases isolated if schools return full-time in September, or 65% if a part-time rota system were used. If only 40% of contacts could be traced, these figures would increase to 87% and 75%, respectively. However, without these levels of testing and contact tracing, reopening of schools together with gradual relaxing of the lockdown measures are likely to induce a second wave that would peak in December, 2020, if schools open full-time in September, and in February, 2021, if a part-time rota system were adopted. In either case, the second wave would result in R rising above 1 and a resulting second wave of infections 2·0–2·3 times the size of the original COVID-19 wave. When infectiousness of children and young adults was varied from 100% to 50% of that of older ages, we still found that a comprehensive and effective test–trace–isolate strategy would be required to avoid a second COVID-19 wave. Interpretation To prevent a second COVID-19 wave, relaxation of physical distancing, including reopening of schools, in the UK must be accompanied by large-scale, population-wide testing of symptomatic individuals and effective tracing of their contacts, followed by isolation of diagnosed individuals. Funding None. Copyright © 2020 Elsevier Ltd. All rights reserved. Introduction The COVID-19 pandemic, caused by severe acute respi ratory syndrome coronavirus 2 (SARS-CoV-2), continues to spread globally.1 In the UK, since the first two reported cases on Jan 31, 2020, and the first reported COVID-19-related death on March 7, 2020, the number of reported cases and deaths has increased steadily, with 301 455 confirmed cases and more than 45 961 deaths reported up to July 29, 2020. To slow down spread of the virus, the UK Government imposed strict physical distancing (ie, lockdown) measures on March 23, 2020. Informed by mathematical modelling of the potential spread and mortality of this pandemic,2 and following the example of the countries affected For reported cases and deaths see https://coronavirus.data.gov. uk
- 2. Articles 2 www.thelancet.com/child-adolescent Published online July 30, 2020 https://doi.org/10.1016/S2352-4642(20)30250-9 earlier,3 schools closures have occurred worldwide. On March 19, 2020, the UN Educational, Scientific and Cultural Organisation estimated that 1·6 billion children and young people in more than 180 countries had stopped attending school.3 In the UK, schools for children and adolescents aged 4–18 years remained open only for the children of key workers and children with defined health, education, or social needs, with up to 2% of school children attending during lockdown.4 School closure reduces the number of contacts within the population and hence reduces onward transmission; however, it can also cause considerable harms.5,6 These harms include hampering health-care and other key workers’ ability to go to work;7 reduced economic pro ductivity;8 and damage to children and young people’s education, development, and physical and mental health9–11 arising from social isolation,12 reduced social support, and possible increased exposure to violence at home.12 As the rate of increase in the number of COVID-19- related hospital admissions and deaths in the UK has slowed down,13 lockdown has been eased gradually, with partial reopening of English primary schools (reception, year one, and year six; ages 4–6 and 10–11) from June 1, 2020, and, secondary schools (years 10 and year 12; ages 14–15 and 17–18) from June 15, 2020. These options were based on assumptions of lower transmission among primary school children and on findings from early population testing suggesting very low SARS-CoV-2 infection or asymptomatic carriage rates, particularly in children younger than 10 years.14 Under current plans, all primary and secondary school students will return to school in England in September, 2020, but the exact return-to-school policy is undecided. Return in other UK countries is also likely to be in late August or September, 2020. Decisions will be based on an understanding of the likely effect of different policies, but there is still uncertainty about the importance of children and young people in SARS-CoV-2 transmission and the impact of school closures in COVID-19 control.9–11 Although previous modelling studies have suggested that school closures reduce transmission when implemented alongside other physical distancing interventions,2 the studies generally assume that transmissibility among children and young people is equivalent to that among adults. Data on susceptibility to and transmission of SARS-CoV-2 among children and adolescents are sparse.8 A population-based contact tracing study on transmission in schools in Australia identified two likely secondary cases from 18 index cases and 863 contacts.9 Yet others have suggested that the attack rate (ie, probability that an infected individual will transmit the disease to a susceptible individual) is similar to that in adults,10 and much of the data on transmission in schools are from periods when schools have been fully or partially closed. A meta-analysis suggested that susceptibility to SARS-CoV-2 among children and adolescents was around half of that Research in context Evidence before this study Since the onset of the COVID-19 pandemic, mathematical modelling has been at the heart of informing decision making, including the implementation of the lockdown in the UK. Although published studies have modelled the epidemic spread across different settings, no studies so far have used modelling to evaluate the impact of reopening schools and society specifically.We searched PubMed for modelling studies that have modelled different schools opening strategies in combination with testing interventions published up to May 10, 2020, using the terms (“SARS-CoV-2” OR “COVID-19”) AND (“modelling” OR “model”) AND (“testing”) AND (“schools”). No language restriction was applied.We did not find any studies that met these criteria. As countries are now starting to ease lockdown measures, it is important to assess the impact of different lockdown exit strategies, including whether and how to reopen schools and relax other physical distancing measures. Reopening of schools represents an early step of reopening society by allowing parents to return to work and hence increased community mixing. Added value of this study To our knowledge, our study is the first to provide quantification of the amount of testing and tracing that would be needed to prevent a second wave of COVID-19 in the UK under different school reopening scenarios (accompanied by a society-wide relaxation of lockdown measures) and in the presence of different test–trace–isolate strategies. Reopening of schools and society alongside active testing of the symptomatic population (between 59% and 87% of people with symptomatic SARS-CoV-2 infection across different scenarios), with effective contact tracing and isolation strategies, will prevent a second epidemic wave and avert a large number of COVID-19 cases and deaths. However, in the absence of a large-scale testing, contact tracing, and isolation strategy, having reopened schools partially in June, 2020, and reopening full time or in part-time rotas from September, 2020, alongside reopening society, is likely to induce a second pandemic wave of COVID-19 in the UK. Implications of all the available evidence Evidence so far points to the need for additional testing, contact tracing, and isolation of individuals who have been diagnosed with COVID-19 or who are considered to be at high risk of carrying infection because of their contact history or symptoms. Our study supports these conclusions and provides additional quantification of the amount of testing and tracing that would be needed to prevent a second wave of COVID-19 in the UK under different school reopening strategies.
- 3. Articles www.thelancet.com/child-adolescent Published online July 30, 2020 https://doi.org/10.1016/S2352-4642(20)30250-9 3 among adults,11 but symptoms are much less common in children than in adults and the degree of asymptomatic transmission by children is unknown. Reopening of schools represents the first step of reopening society by allowing parents to return to work and hence increased community mixing. We aimed to use modelling to explore the impact of two possible strategies to reopen all schools from September, 2020, combined with society-wide relaxing of the physical distancing measures in the UK, in combination with three different test–trace–isolate scenarios. The strategies that we have explored have been discussed with members of scientific advisory bodies in the UK. Methods Transmission model We modelled the spread of COVID-19 using Covasim (version 1.4.7), a stochastic agent-based model of SARS-CoV-2 transmission. The model was developed by the Institute for Disease Modeling (Bellevue, WA, USA); further details of the mathematical approach used for Covasim have been published previously as a preprint.15 Briefly, within the model, individuals are modelled as either susceptible to the virus, exposed to it, infected, recovered, or dead. In addition, infected and infectious individuals are categorised as either asymptomatic or in different symptomatic groups: pre-symptomatic (before viral shedding has begun), or with mild, severe, or critical symptoms (figure 1). For this study, the model was adapted to the UK context. Covasim’s default parameters determine the ways in which people progress through the states depicted in figure 1, including the probabilities associated with onward transmission and disease progression, duration of disease by acuity, and the effects of interventions; these parameters were collated during Covasim’s development during May, 2020,15 and are updated when new evidence becomes available. In addition, Covasim is pre-populated with demographic data on population age structures and household sizes by country, and uses these data to generate population contact networks for the setting. By default, Covasim generates four different contact net works: schools, workplaces, households, and community settings. The per-contact transmission probability (β) that an infectious individual transmits the virus to a suscep tible individual is assumed to depend on the contact network. Covasim accounts for testing strategies via parameters that determine the probabilities with which people with different symptoms receive a test each day (appendix p 4). Data sources and calibration Publicly available data were collated and used for the analysis. We used Covasim’s default settings to generate a population of 100 000 agents who interact over the four networks described previously. This approach is similar to that in the study by Ferguson and colleagues,2 which informed the implementation of lockdown measures in the UK. To fit the model to the UK epidemic, we did an automated search for the optimal values of the number of infected people on Jan 21, 2020, the per-contact layer- dependent transmission probabilities, and the daily testing probabilities for symptomatic individuals (ps) during May and June that minimised the sum of squared differences between the model’s estimates of confirmed cases and deaths, and data on these same two indicators between Jan 21 and June 17, 2020, collated from the UK Government’s COVID-19 dashboard. These parti cular parameters were selected as the most important to estimate because the considerable uncertainties around them—in particular, about whether the per-contact trans mission probability is age dependent16 or differs across asymptomatic and symptomatic cases—translate to uncertainties around the true number of infections in the population and the proportion of those that have been detected. We accounted for the effect of the lockdown by reducing the per-contact transmission probabilities from March 23, 2020, to 2% of their pre-lockdown values within schools, and to 20% of their pre-lockdown values within workplace and community settings. The calibrated model estimated that between Jan 21 and June 17, 2021, the daily probability of testing people with symptoms was 1·98% corresponding to about 18% of people with symptomatic infection being tested at some point during their illness (assuming an average symptomatic period of about 10 days). In addition, the model assumed that the daily probability of testing people without symptoms was 0·075% corresponding to about 0·75% of people with asymptomatic infection being tested at some point during their illness (assuming an average symptomatic period of about 10 days). In addition, we determined that 1500 people were infected in the UK on See Online for appendix For more on Covasim see http://docs.covasim.org For the UK Government’s COVID-19 dashboard see https://coronavirus.data.gov.uk Figure 1: Modelled disease states Blue shading indicates that an individual is infectious and can transmit the disease to other susceptible individuals. States in a darker shade of blue are considered to be symptomatic for the purpose of testing eligibility. This schematic is reproduced from existing work from members of this group.15 Susceptible Exposed Presymptomatic Asymptomatic Mild Severe Critical Recovered Dead
- 4. Articles 4 www.thelancet.com/child-adolescent Published online July 30, 2020 https://doi.org/10.1016/S2352-4642(20)30250-9 Jan 21, 2020 (appendix p 1), and that the per-contact transmission probability was 0·59% (appendix p 5). School and society reopening scenarios The UK Government reopened schools in a phased manner from June 1, 2020, with students in reception (aged 4–5 years), year one (aged 5–6 years), and year six (aged 10–11 years) in English primary schools returning to school on June 1, 2020, followed by secondary school students in years 10 (aged 14–15 years) and 12 (aged 17–18 years) from June 15, 2020. However, although 91% of schools reopened, only 7% of children attended.17 Under current plans, all school students will return in September, 2020, either full time or part time depending on the state of the epidemic. Therefore, a second plausible scenario is that returning to school in September could include a rota system with students attending school on alternate weeks, with half of the students attending school one week and the other half the following week. We explore these two scenarios of schools returning from September together with phased reopening from June 1 (table). The phased reopening of schools was implemented by setting the per-contact transmission probabilities within schools to be proportional to the number of school years returning to school, and to 90% of its pre-lockdown value for the full-time reopening scenario (to account for protective measures assumed to be in place; table). In both scenarios, we accounted for holiday periods by assuming no transmission in schools and higher transmission in households (by 29%, based on Google movement data over the lockdown period) over holiday periods. We also assumed that reopening of schools would correspond to increases in workplace and community transmission probabilities, to account for increased social mixing with reopening of schools and relaxation of the physical distancing restrictions that have applied to work, leisure, and community activities. We assumed that if schools were to reopen full time or in a part-time rota system, the transmission probability in community settings would be respectively 90% or 70% of its pre- lockdown value when schools are in session and 70% during school holiday periods, and workplace trans mission would be 70% of its pre-lockdown value during school terms (under the assumption that 30% remain working from home for foreseeable future; personal communication with policy decision makers) and 50% during school holidays. In addition, we assumed that if schools reopen in a part-time rota, this system would be in place for one school term (autumn term, 2020) only and then schools will go back full time from Jan 1, 2021 (table). Test–trace–isolate strategies In line with current policy in the UK, we also modelled the implementation of test–trace–isolate strategies to test individuals in the population presenting with COVID-19-like symptoms, isolate those testing positive, and trace their contacts. Since March 23, 2020, the strategy in the UK has been to test people presenting with severe COVID-19 symptoms and ask them to self- isolate, and starting on June 1, 2020, this approach has been complemented by a strategy to trace contacts of those people who test positive for infection. The tracing strategy was simulated in Covasim by introducing two coverage levels of tracing beginning on June 1, 2020. First, to resemble the current scenario of tracing contacts, we assumed that 75%18 of individuals testing positive are contacted and that 90%19 of their contacts are traced and asked to isolate, which results in a contact tracing level of 68%. Second, we also simulated a more pessimistic scenario for tracing capability, which could arise if there were problems in scaling up the test–trace– isolate strategy, of a contact tracing level of 40%. We used the model to derive the testing levels necessary to avoid the second pandemic wave with these two tracing strategies. We assumed 100% sensitivity and specificity of the testing, a delay of 1 day to receive the test result, and that individuals testing positive would immediately be isolated for 14 days. In the model, this isolation reduced their infectiousness by 90%. In addition, with both strategies, symptomatic people were isolated, with their infectiousness reduced by 50%. Analysis Overall, we simulated six core scenarios, comprising two different school reopening strategies (students return full time in September vs students return Home contacts School contacts Work contacts Community contacts Full time June 1, 2020 100% 23%* 40% 40% June 15, 2020 100% 38%† 50% 50% Sept 1, 2020 100% 90%‡ 70% 90% Part-time rota June 1, 2020 100% 23%* 40% 40% June 15, 2020 100% 38%† 50% 50% Sept 1, 2020 100% 50%§ 70% 70% Jan 1, 2021 100% 90%‡ 70% 90% Each intervention is simulated by altering the daily transmission probability due to home, school, workplace, and community contact, with details presented in the appendix (pp 5–7).We assume that transmission within schools is proportional to school years going back, which allows parents to go back to work. We thus assume that return to workplaces is proportional to reopening of schools. Furthermore, we assume that 30% of the workforce will remain working from home for the foreseeable future. SARS-CoV-2=severe acute respiratory syndrome coronavirus 2. *Representing three of 13 school years returning to school. †Representing five of 13 school years returning to school. ‡Representing all 13 years returning to school full time, with 10% subtracted to account for protective measures assumed to be in place. §All 13 years returning school, but on part-time rota, with half of school years present at one time. Table: Scale factors applied to daily SARS-CoV-2 transmission probabilities in households, schools, workplaces, and the community under the scenarios of full-time and part-time rota reopening of schools
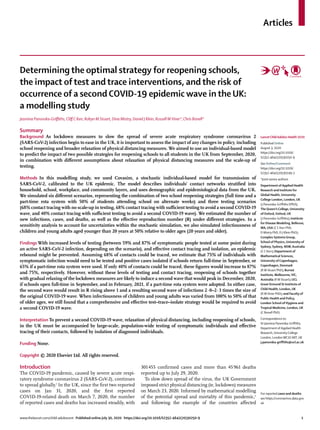
- 5. Articles www.thelancet.com/child-adolescent Published online July 30, 2020 https://doi.org/10.1016/S2352-4642(20)30250-9 5 part-time in a rota system in September) and three test– trace–isolate strategies. In the first strategy, 68% of contacts are traced with no scale-up in testing (ie, 18% of people with symptomatic infection and about 0·75% of those with asymptomatic infection are tested). In the second strategy, 68% of contacts are traced and testing is scaled up sufficiently to avoid a second COVID-19 wave. In the third strategy, 40% of contacts are traced Figure 2: Model estimates of daily new SARS-CoV-2 infections from Jan 21, 2020, to Dec 31, 2021 (A) New infections with 68% tracing and 18% testing in the full-time school reopening scenario. (B) New infections with 68% tracing and 18% testing in the part-time rota school reopening scenario. (C) New infections with 68% tracing and 75% testing in the full-time school reopening scenario. (D) New infections with 68% tracing and 65% testing in the part-time rota school reopening scenario. (E) New infections with 40% tracing and 87% testing in the full-time school reopening scenario. (F) New infections with 40% tracing and 75% testing in the part-time rota school reopening scenario. Medians across ten simulations are indicated by solid lines and 10% and 90% quantiles by shading.The results do not change if we run a larger number of simulations, and we tested 1, 3, 6, 8, 10, and 20 simulations. The difference is that the noise in the simulations increases with increased size of simulations; therefore, we chose ten simulations for these figures. SARS-CoV-2=severe acute respiratory syndrome coronavirus 2. A 68% tracing, 18% testing C 68% tracing, 75% testing E 40% tracing, 87% testing F 40% tracing, 75% testing D 68% tracing, 65% testing B 68% tracing, 18% testing Timepoint 0 25000 50000 75000 100000 125000 150000 175000 200000 NewinfectionsNewinfectionsNewinfections Decem ber,2019 M arch,2020 M arch,2021 June,2021 Septem ber,2021 Decem ber,2021 June,2020 Septem ber,2020Decem ber,2020 Timepoint Decem ber,2019M arch,2020 M arch,2021 June,2021 Septem ber,2021 Decem ber,2021 June,2020 Septem ber,2020Decem ber,2020 Full-time school reopening Part-time rota school reopening 0 25000 50000 75000 100000 125000 150000 175000 200000 0 25000 50000 75000 100000 125000 150000 175000 200000
- 6. Articles 6 www.thelancet.com/child-adolescent Published online July 30, 2020 https://doi.org/10.1016/S2352-4642(20)30250-9 and symptomatic testing is scaled up sufficiently to avoid a second COVID-19 wave. For each scenario, we estimated the daily and cumu lative numbers of infections and deaths, as well as time series of the effective reproduction number R, until Dec 31, 2021. Since Covasim is stochastic, we simulated each scenario under ten different random number seeds, and we present the median estimates along with ranges corresponding to the upper (90%) and lower (10%) bounds generated by these ten seeds. Figure 3: Model estimates of cumulative COVID-19 deaths from Jan 21, 2020, to Dec 31, 2021 (A) Deaths with 68% tracing and 18% testing in the full-time school reopening scenario. (B) Deaths with 68% tracing and 18% testing in the part-time rota school reopening scenario. (C) Deaths with 68% tracing and 75% testing in the full-time school reopening scenario. (D) Deaths with 68% tracing and 65% testing in the part-time rota school reopening scenario. (E) Deaths with 40% tracing and 87% testing in the full-time school reopening scenario. (F) Deaths with 40% tracing and 75% testing in the part-time rota school reopening scenario. Medians across ten simulations are indicated by solid lines and the 10% and 90% quantiles by shading. A 68% tracing, 18% testing B 68% tracing, 18% testing 0 50000 100000 150000 200000 250000 300000 350000 DeathsDeathsDeaths C 68% tracing, 75% testing D 68% tracing, 65% testing 0 Predicted cumulative deaths Cumulative deaths to date E 40% tracing, 87% testing F 40% tracing, 75% testing Timepoint Decem ber,2019M arch,2020 M arch,2021 June,2021 Septem ber,2021 Decem ber,2021 June,2020 Septem ber,2020Decem ber,2020 Timepoint Decem ber,2019 M arch,2020 M arch,2021 June,2021 Septem ber,2021 Decem ber,2021 June,2020 Septem ber,2020Decem ber,2020 Full-time school reopening Part-time rota school reopening 50000 100000 150000 200000 250000 300000 350000 0 50000 100000 150000 200000 250000 300000 350000
- 7. Articles www.thelancet.com/child-adolescent Published online July 30, 2020 https://doi.org/10.1016/S2352-4642(20)30250-9 7 In view of the uncertainties in the role of different age groups in transmission,8 we simulated the same scenarios in a sensitivity analysis, in which transmissibility for people aged younger than 20 years was assumed to be half that of people older than 20 years.20 As part of this analysis, the model was Figure 4: Model estimates of effective reproduction number R from Jan 21, 2020, to Dec 31, 2021 (A) Reproductive number R with 68% tracing and 18% testing in the full-time school reopening scenario. (B) Reproductive number R with 68% tracing and 18% testing in the part-time rota school reopening scenario. (C) Reproductive number R with 68% tracing and 75% testing in the full-time school reopening scenario. (D) Reproductive number R with 68% tracing and 65% testing in the part-time rota school reopening scenario. (E) Reproductive number R with 40% tracing and 87% testing in the full-time school reopening scenario. (F) Reproductive number R with 40% tracing and 75% testing in the part-time rota school reopening scenario. Medians across ten simulations are indicated by solid lines and the 10% and 90% quantiles by shading. An R value of less than 1 is necessary for virus suppression. A 68% tracing, 18% testing 0 0·5 1·0 1·5 2·0 2·5 3·0 RRR B 68% tracing, 18% testing D 68% tracing, 65% testing F 40% tracing, 75% testing C 68% tracing, 75% testing 0 0·5 1·0 1·5 2·0 2·5 3·0 E 40% tracing, 87% testing 0 0·5 1·0 1·5 2·0 2·5 3·0 Timepoint Decem ber,2019 M arch,2020 M arch,2021 June,2021 Septem ber,2021Decem ber,2021 June,2020 Septem ber,2020Decem ber,2020 Timepoint Decem ber,2019M arch,2020 M arch,2021 June,2021 Septem ber,2021 Decem ber,2021 June,2020 Septem ber,2020 Decem ber,2020 Full-time school reopening Part-time rota school reopening
- 8. Articles 8 www.thelancet.com/child-adolescent Published online July 30, 2020 https://doi.org/10.1016/S2352-4642(20)30250-9 recalibrated and equivalent analysis to the main one undertaken (appendix pp 5, 7–9). Role of the funding source The funders of the study had no role in study design, data collection, data analysis, data interpretation, or writing of the report. The corresponding author had full access to all the data in the study and had final responsibility for the decision to submit for publication. Results Our model predicts that reopening schools either full time or in a part-time rota system from Sept 1, 2020, alongside relaxation of other social distancing measures will induce a second COVID-19 wave in the absence of a scaled-up testing programme (figures 2A, B, 3A, B, 4A, B). This second wave would peak in December, 2020, if schools open full time in September, and in February, 2021, if a part-time rota system were adopted. In either case, the second wave would be 2·0–2·3 times larger than the first COVID-19 wave in the UK. Our findings suggest that it might be possible to avoid a second pandemic wave across both school reopening scenarios if enough people with symptomatic infection can be tested, and contacts of those diagnosed can be traced and effectively isolated (figures 2C–F, 3C–F, 4C–F). Assuming 68% of contacts could be traced, we estimate that 75% of those with symptomatic infection would need to be tested and isolated if schools return full time in September, or 65% if a part-time rota system were used. If only 40% of contacts could be traced, these figures would increase to 87% and 75%, respectively. The temporal profiles of the effective reproduction number R follow the trend of the time series of new infections(comparingrespectivepanelsinfigures2and4). R evidently increases over the threshold of 1, suggesting an increase in the number of new infections, when a second COVID-19 wave occurs (figures 2A, B, 4A, B). Across both scenarios of school and society reopening and different tracing levels, the test–trace–isolate strategy would need to test a sufficiently large proportion of the population with COVID-19 symptomatic infection and trace their contacts with sufficiently large coverage, for R to diminish below 1 (figures 2C–F, 3C–F). Specifically, our simulations suggest that the timepoint at which R diminishes depends on the degree to which the test– trace–isolate strategy had been implemented and the combination of testing and tracing; the exact association between timing of R diminishment at different levels of testing, tracing, and isolating from June, 2020, will be explored in subsequent analyses. When we reran the six core scenarios with infect iousness among children and young adults aged younger than 20 years assumed to be 50% of that among older ages (20 years and older), our results remained largely unchanged (appendix pp 8–9). We still found that it is possible to avoid a second COVID-19 wave across all scenarios of school and society reopening and different tracing levels, if the test–trace–isolate strategy tests a sufficiently large proportion of the population with COVID-19 symptomatic infection and traces their contacts with sufficiently large coverage. Assuming that 68% of contacts could be traced, we estimate that 61% of those with symptomatic infection would need to be diagnosed and isolated if schools return full time in September (compared with 75% if children transmit equally to adults), or 59% if a part-time rota system were used (appendix p 8). If only 40% of contacts could be traced, these figures would increase to 78% and 70%, respectively. These results are summarised in the appendix (pp 8–9). Discussion Our modelling results suggest that if schools and society reopened full time or in a part-time rota system on Sept 1, 2020, with sufficiently broad coverage of a test– trace–isolate programme, a second COVID-19 wave could be prevented in the UK. Such measures would markedly reduce cumulative numbers of new infections and deaths, and contribute to keeping R below 1. This finding is consistent under both assumptions of infectivity of children and young adults aged younger than 20 years relative to adults (50% and 100%; appendix pp 8–9). We note that depending on the overall population prevalence of COVID-19-like illness, achieving this level of coverage with a test–trace–isolate strategy would probably require testing a large number of people. However, we also predict that in the absence of sufficiently broad test–trace–isolate coverage, reopening of schools combined with accompanied reopening of society across all scenarios might induce a second COVID-19 wave. For example, our modelling results suggest that full school reopening in September, 2020, without an effective test–trace–isolate strategy would result in R rising above 1 and a resulting second wave of infections that would peak in December, 2020, and be 2·3 times the size of the original COVID-19 wave. Cases would then decline and peak again, with a wave 2·0 times larger than the original wave. In our modelling, we have assumed that reopening schools is not a binary off–on switch, but instead that reopening schools would be accompanied by broader changes. School reopening would allow parents to go back to work, as reopening a proportion of businesses are anticipated to be an important step in restarting economic activity. Specifically, we simulated increasing not only the transmission in schools, but also increased transmission in workplaces and the community. The exact numbers representing these changes in this analysis are based on modelling assumptions, and the model can be rerun if more reliable numbers are available in future. Evidence from countries such as South Korea,21,22 where large-scale testing and contact tracing have been able to control the spread of COVID-19, points to the need for
- 9. Articles www.thelancet.com/child-adolescent Published online July 30, 2020 https://doi.org/10.1016/S2352-4642(20)30250-9 9 additional testing, effective contact tracing, and isolation of individuals who have been diagnosed with COVID-19, or who are considered to be at high risk of carrying infection as a result of their contact history or symptoms, to control the virus spread. Our study supports these conclusions and provides additional quantification of the amount of testing and tracing that would be needed to prevent a second wave of COVID-19 in the UK under different strategies to reopen schools and society from September, 2020. To our knowledge, this is the first study to give such quantitative modelled measures for the UK. There are differences in policies relating to school reopening across the four UK countries but these findings are likely to be generalisable to each country. We anticipate that re running the analysis separately for England, Scotland, Wales, and Northern Ireland would highlight the need for a comprehensive test–trace–isolate strategy to avoid second COVID-19 peak, but possibly the minimum testing levels will differ across the four UK countries. Although such analyses were beyond the scope of this paper, we are planning to explore this further in future work. Our analyses have some limitations. First, although we have made an effort to characterise the pandemic to resemble that of the UK, some of the parameters used are from various sources across different settings.15 However, the main aspect we have focused on changing to illustrate different scenarios is the transmission probability of social (household, school, workplace, and community) contacts and the primary source for these data was UK based.23 The changes we have simulated across scenarios reflect our understanding of possible options for school reopening as discussed in the UK. They are, therefore, fit for purpose within this analysis. Second, as with any modelling study, we have made a series of assumptions within the modelling framework. In particular, we made assumptions about the proportion of SARS-CoV-2 infections that are symptomatic, as evidence in the literature is mixed. WHO suggests that 80% of people with infections show mild symptoms24 and a study from the Italian city of Vo’ Euganeo25 at the epicentre of the European pandemic confirms that a large proportion, 30–50%, of people with infections do not have symptoms; however, other studies suggest that this number is smaller—eg, 10% among children,26 18% among passengers on the Diamond Princess cruise ship,27 and 42% among Japanese people returning from Wuhan.28 There is currently a high degree of uncertainty around the proportion of asymptomatic infection, with evidence29 suggesting that asymptomatic incidence ranges from 2% to 57%. We note, however, that many studies do not differentiate between presymptomatic and asymptomatic infection; instead the number reported is the proportion of individuals not exhibiting symptoms at the time of testing positive. Instead, in our model, we have assumed that asymptomatic infections account for 30% of onward-transmitted infections and that develop ment of symptoms is age dependent. The assumption in this study, as in Covasim, is that 70% of infection is symptomatic and, guided by the findings by Davies and colleagues,20 that the probability of developing clinical symptoms increases from around 20% in individuals aged younger than 20 years to around 69% in people aged older than 70 years. Future analyses will explore how changing the proportion of asymptomatic SARS-CoV-2 infections affects the impact of a test–trace– isolate strategy. Some of our assumptions about the implementation of a test–trace–isolate strategy are likely to be optimistic in the UK context, so our finding should be interpreted as the minimal amount of testing that would be needed. In particular, we assume a 1-day delay after a test is done before results are communicated, that diagnosed indi viduals immediately isolate for 14 days with 90% efficacy, and that individuals displaying COVID-19-like symptoms will self-isolate with 50% efficacy until symptoms clear. Furthermore, in the absence of robust data, we made assumptions (varied in the sensitivity analysis) about the infectiousness among children and young adults aged younger than 20 years. Future analysis might find that infectiousness among children is even lower than 50%, although there are no data suggesting higher trans mission than in adults.8 Finally, we note that in addition to simulating the current test–trace–isolate policy for the UK, we also simulated an additional level of tracing chosen to resemble a more pessimistic tracing level. We have chosen this level to be 40% as a modelling assumption. For both levels of tracing, 40% and 68%, simulated here, we determined the testing level required to avoid a second COVID-19 wave in the UK during 2020 and 2021. We note that we have not swept the entire testing and tracing level parameter space to explore regimes within the phase plane where R is less than 1 at all timepoints and hence a second wave is avoided, as this is beyond the scope of this work. Indeed, follow-up work on this is currently ongoing both for the UK and the USA. We also have not modelled in this study the behaviour of young people who are not in school and, specifically, we have not assumed increased social mixing outside schools. Inclusion of this parameter is possible within our framework, but it is currently difficult to quantify. We can rerun the model when reliable estimates are available in future. In summary, our findings suggest that reopening of schools can form part of the next step of gradual relaxing of lockdown if combined with a high-coverage test–trace– isolate strategy. It is currently unclear when the UK test– trace–isolate strategy will achieve sufficient coverage. Such a strategy, to prevent onward transmission, could possibly comprise virus testing for active infection in symptomatic individuals (ie, RT-PCR tests for SARS-CoV-2) and possibly as part of primary care,
- 10. Articles 10 www.thelancet.com/child-adolescent Published online July 30, 2020 https://doi.org/10.1016/S2352-4642(20)30250-9 followed by contact tracing of individuals within the network of the infected person and isolation of indivi duals, including those showing symptoms or diagnosed positive for infection. This approach would be an alternative to intermittent lockdown measures, including further school closures while we await an effective vaccine against SARS-CoV-2. Contributors JP-G and RMV conceptualised the study. JP-G, CCK, DM, RMS developed the specific modelling framework, based on the Covasim model developed by CCK, RMS, DM, and DJK. JP-G, CCK, RMS, DM, DJK collated data for the parameters used. JP-G ran the modelling analysis with input from CCK, RMS, and DM. JP-G, RMV, and CB defined the different scenarios in the UK context following conversations with the Scientific Pandemic Influenza Modelling Group, which gives expert advice to the UK Department of Health and Social Care and wider UK Government. JP-G wrote the manuscript with input from CCK, RMS, DM, DJK, RMV, and CB. All authors approved the final version. Declaration of interests We declare no competing interests. Data sharing The model code for Covasim is available from https://github.com/ InstituteforDiseaseModeling/covasim. The code used to run all simulations contained in this Article is available from https://github. com/Jasminapg/Covid-19-Analysis. Acknowledgments JP-G was supported by the UK National Institute for Health Research (NIHR) Applied Health Research and Care North Thames at Bart’s Health National Health Service Trust. CCK, DM, and DJK were supported by the Bill and Melinda Gates Foundation through the Global Good Fund. The views expressed in this Article are those of the authors and not necessarily those of the National Health Service, the NIHR, or the UK Department of Health and Social Care. We acknowledge Graham Medley (London School of Hygiene and Tropical Medicine, London, UK) on helpful discussions around the modelling scenarios, Edwin van Leeuwen (Public Health England, London, UK), Tim Colbourn (University College London, London, UK), and William Waites (University of Edinburgh, Edinburgh, UK) for their helpful conversations about different modelling approaches, and Ruth Gilbert (University College London) for reading an earlier version of the paper. References 1 WHO. Coronavirus disease (COVID-19). Situation report—156. June 24, 2020. https://www.who.int/docs/default-source/ coronaviruse/situation-reports/20200624-covid-19-sitrep-156. pdf?sfvrsn=af42e480_2 (accessed June 25, 2020). 2 Ferguson NM, Laydon D, Nedjati-Gilani G, et al. Report 9: impact of non-pharmaceutical interventions (NPIs) to reduce COVID-19 mortality and healthcare demand. March 16, 2020. https://www. imperial.ac.uk/media/imperial-college/medicine/sph/ide/gida- fellowships/Imperial-College-COVID19-NPI-modelling-16-03-2020. pdf (accessed May 20, 2020). 3 UN Educational, Scientific and Cultural Organisation. COVID-19 educational disruption and response. 2020. https://en.unesco.org/ themes/education-emergencies/coronavirus-school-closures (accessed March 19, 2020). 4 Whittaker F. Coronavirus: School attendance around 1%, finds DfE analysis. April 21, 2020. https://schoolsweek.co.uk/coronavirus- school-attendance-around-1-finds-dfe-analysis/ (accessed July 27, 2020). 5 Royal Society DELVE Initiative. Balancing the risks of pupils returning to schools. July 24, 2020. https://rs-delve.github.io/ reports/2020/07/24/balancing-the-risk-of-pupils-returning-to- schools.html#1-background (accessed July 31, 2020). 6 Viner RM, Russell SJ, Croker H, et al. School closure and management practices during coronavirus outbreaks including COVID-19: a rapid systematic review. Lancet Child Adolesc Health 2020; 4: 397–404. 7 O’Sullivan TL, Amaratunga C, Phillips KP, et al. If schools are closed, who will watch our kids? Family caregiving and other sources of role conflict among nurses during large-scale outbreaks. Prehosp Disaster Med 2009; 24: 321–25. 8 Brurberg KD. The role of children in the transmission of SARS-CoV-2 (COVID-19), 1st update—a rapid review. Oslo: Norwegian Institute of Public Health, 2020. 9 Macartney K, Quinn HE, Pillsbury AJ, et al. Transmission of SARS-CoV-2 in Australian educational settings: a prospective cohort study. Lancet Child Adolesc Health 2020; published online Aug 3. https://doi.org/10.1016/S2352-4642(20)30251-0. 10 Bi Q, Wu Y, Mei S, et al. Epidemiology and transmission of COVID-19 in 391 cases and 1286 of their close contacts in Shenzhen, China: a retrospective cohort study. Lancet Infect Dis 2020; published online April 27. https://doi.org/10.1016/S1473- 3099(20)30287-5. 11 Viner RM, Mytton O, Bonell C, et al. Susceptibility to COVID-19 amongst children and adolescents compared with adults: a systematic review and meta-analysis. medRxiv 2020; published online May 24. DOI:10.1101/2020.05.20.20108126 (preprint). 12 Abramson A. How COVID-19 may increase domestic violence and child abuse. April 8, 2020. https://www.apa.org/topics/covid-19/ domestic-violence-child-abuse (accessed May 20, 2020). 13 UK Government. Coronavirus (COVID-19) in the UK. https:// coronavirus.data.gov.uk/?_ga=2.41681382.554770926.1588844302- 1722033634.1588620867 (accessed May 6, 2020). 14 Jones TC, Muhlemann B, Veith T, et al. An analysis of SARS-CoV-2 viral load by patient age. medRxiv 2020; published online June 9. DOI:10.1101/2020.06.08.20125484 (preprint). 15 Kerr CC, Stuart RM, Mistry D, et al. Covasim: an agent-based model for COVID-9 dynamics and suppression scenarios. medRxiv 2020; published online May 15. DOI:10.1101/2020.05.10.20097469 (preprint). 16 Zhang J, Litvinova M, Liang Y, et al. Changes in contact patterns shape the dynamics of the COVID-19 outbreak in China. Science 2020; 368: 1481–86. 17 UK Department for Education. Attendance in education and early years settings during the coronavirus (COVID-19) outbreak – summary of returns to 4 June. https://assets.publishing.service.gov. uk/government/uploads/system/uploads/attachment_data/ file/890949/Attendance_figures_coronavirus_covid_19_4_ June_2020.pdf (accessed July 30, 2020). 18 Boseley S. Contact tracers in England get no data from 26% of people with coronavirus. June 18, 2020. https://www.theguardian. com/world/2020/jun/18/contact-tracers-in-england-get-no-data- from-26-of-people-with-coronavirus (accessed May 20, 2020). 19 Triggle N. Coronavirus: One in four infected by virus cannot be reached. June 18, 2020. https://www.bbc.co.uk/news/health- 53009775?intlink_from_url=https://www.bbc.co.uk/news/topics/ ck2l9qxx17nt/coronavirus-testing&link_location=live-reporting-story (accessed May 20, 2020). 20 Davies NG, Klepac P, Liu Y, et al. Age-dependent effects in the transmission and control of COVID-19 epidemics. Nat Med 2020; published online June 16. DOI:10.1038/s41591-020-0962-9. 21 Shim E, Tariq A, Choi W, Lee Y, Chowell G. Transmission potential and severity of COVID-19 in South Korea. Int J Infect Dis 2020; 93: 339–44. 22 Cohen J, Kupferschmidt K. Countries test tactics in ‘war’ against COVID-19. Science 2020; 367: 1287–88. 23 Prem K, Cook AR, Jit M. Projecting social contact matrices in 152 countries using contact surveys and demographic data. PLoS Comput Biol 2017; 13: e1005697. 24 WHO. Coronavirus disease 2019 (COVID-19). Situation report—46. March 6, 2020. https://www.who.int/docs/default-source/ coronaviruse/situation-reports/20200306-sitrep-46-covid-19. pdf?sfvrsn=96b04adf_4 (accessed May 20, 2020). 25 Lavezzo E, Franchin E, Ciavarella C, et al. Suppression of COVID-19 outbreak in the municipality of Vo, Italy. medRxiv 2020; published online April 18. DOI:10.1101/2020.04.17.20053157 (preprint). 26 Qiu H, Wu J, Hong L, Luo Y, Song Q, Chen D. Clinical and epidemiological features of 36 children with coronavirus disease 2019 (COVID-19) in Zhejiang, China: an observational cohort study. Lancet Infect Dis 2020; 20: 689–96.
- 11. Articles www.thelancet.com/child-adolescent Published online July 30, 2020 https://doi.org/10.1016/S2352-4642(20)30250-9 11 27 Mizumoto K, Kagaya K, Zarebski A, Chowell G. Estimating the asymptomatic proportion of coronavirus disease 2019 (COVID-19) cases on board the Diamond Princess cruise ship, Yokohama, Japan, 2020. Euro Surveill 2020; 25: 2000180. 28 Nishiura H, Kobayashi T, Miyama T, et al. Estimation of the asymptomatic ratio of novel coronavirus infections (COVID-19). Int J Infect Dis 2020; 94: 154–55. 29 Gao Z, Xu Y, Sun C, et al. A systematics review of asymptomatic infections with COVID-19. J Microbiol Immunol Infect 2020; published online May 15. DOI:10.1016/j.jmii.2020.05.001.