Download to read offline


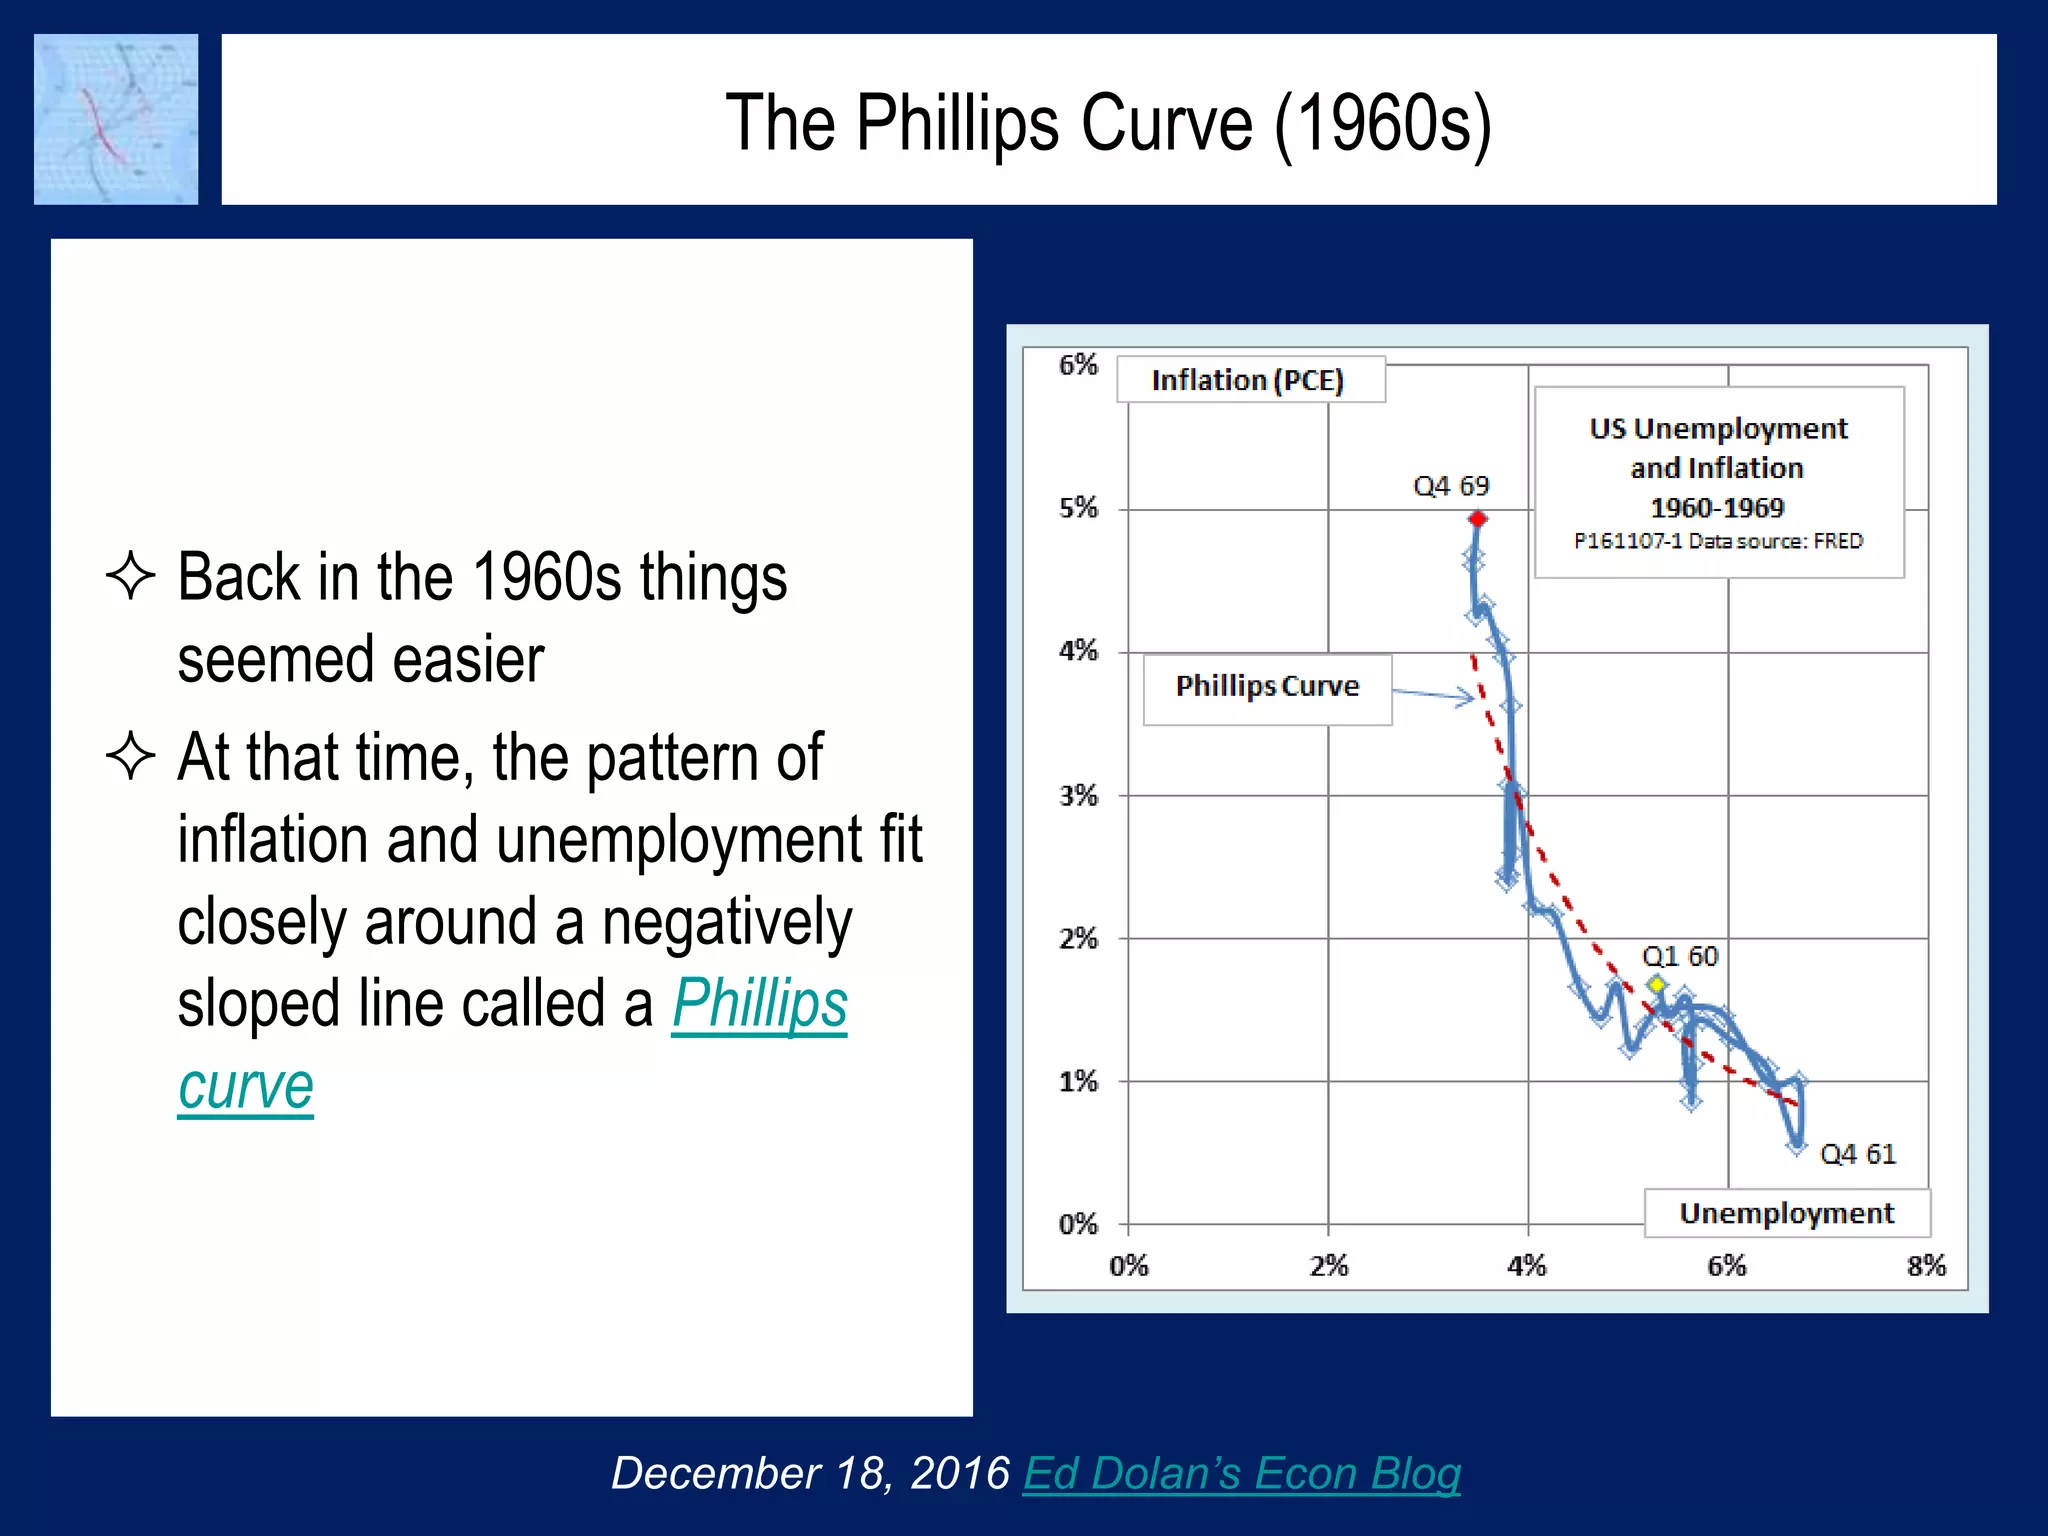


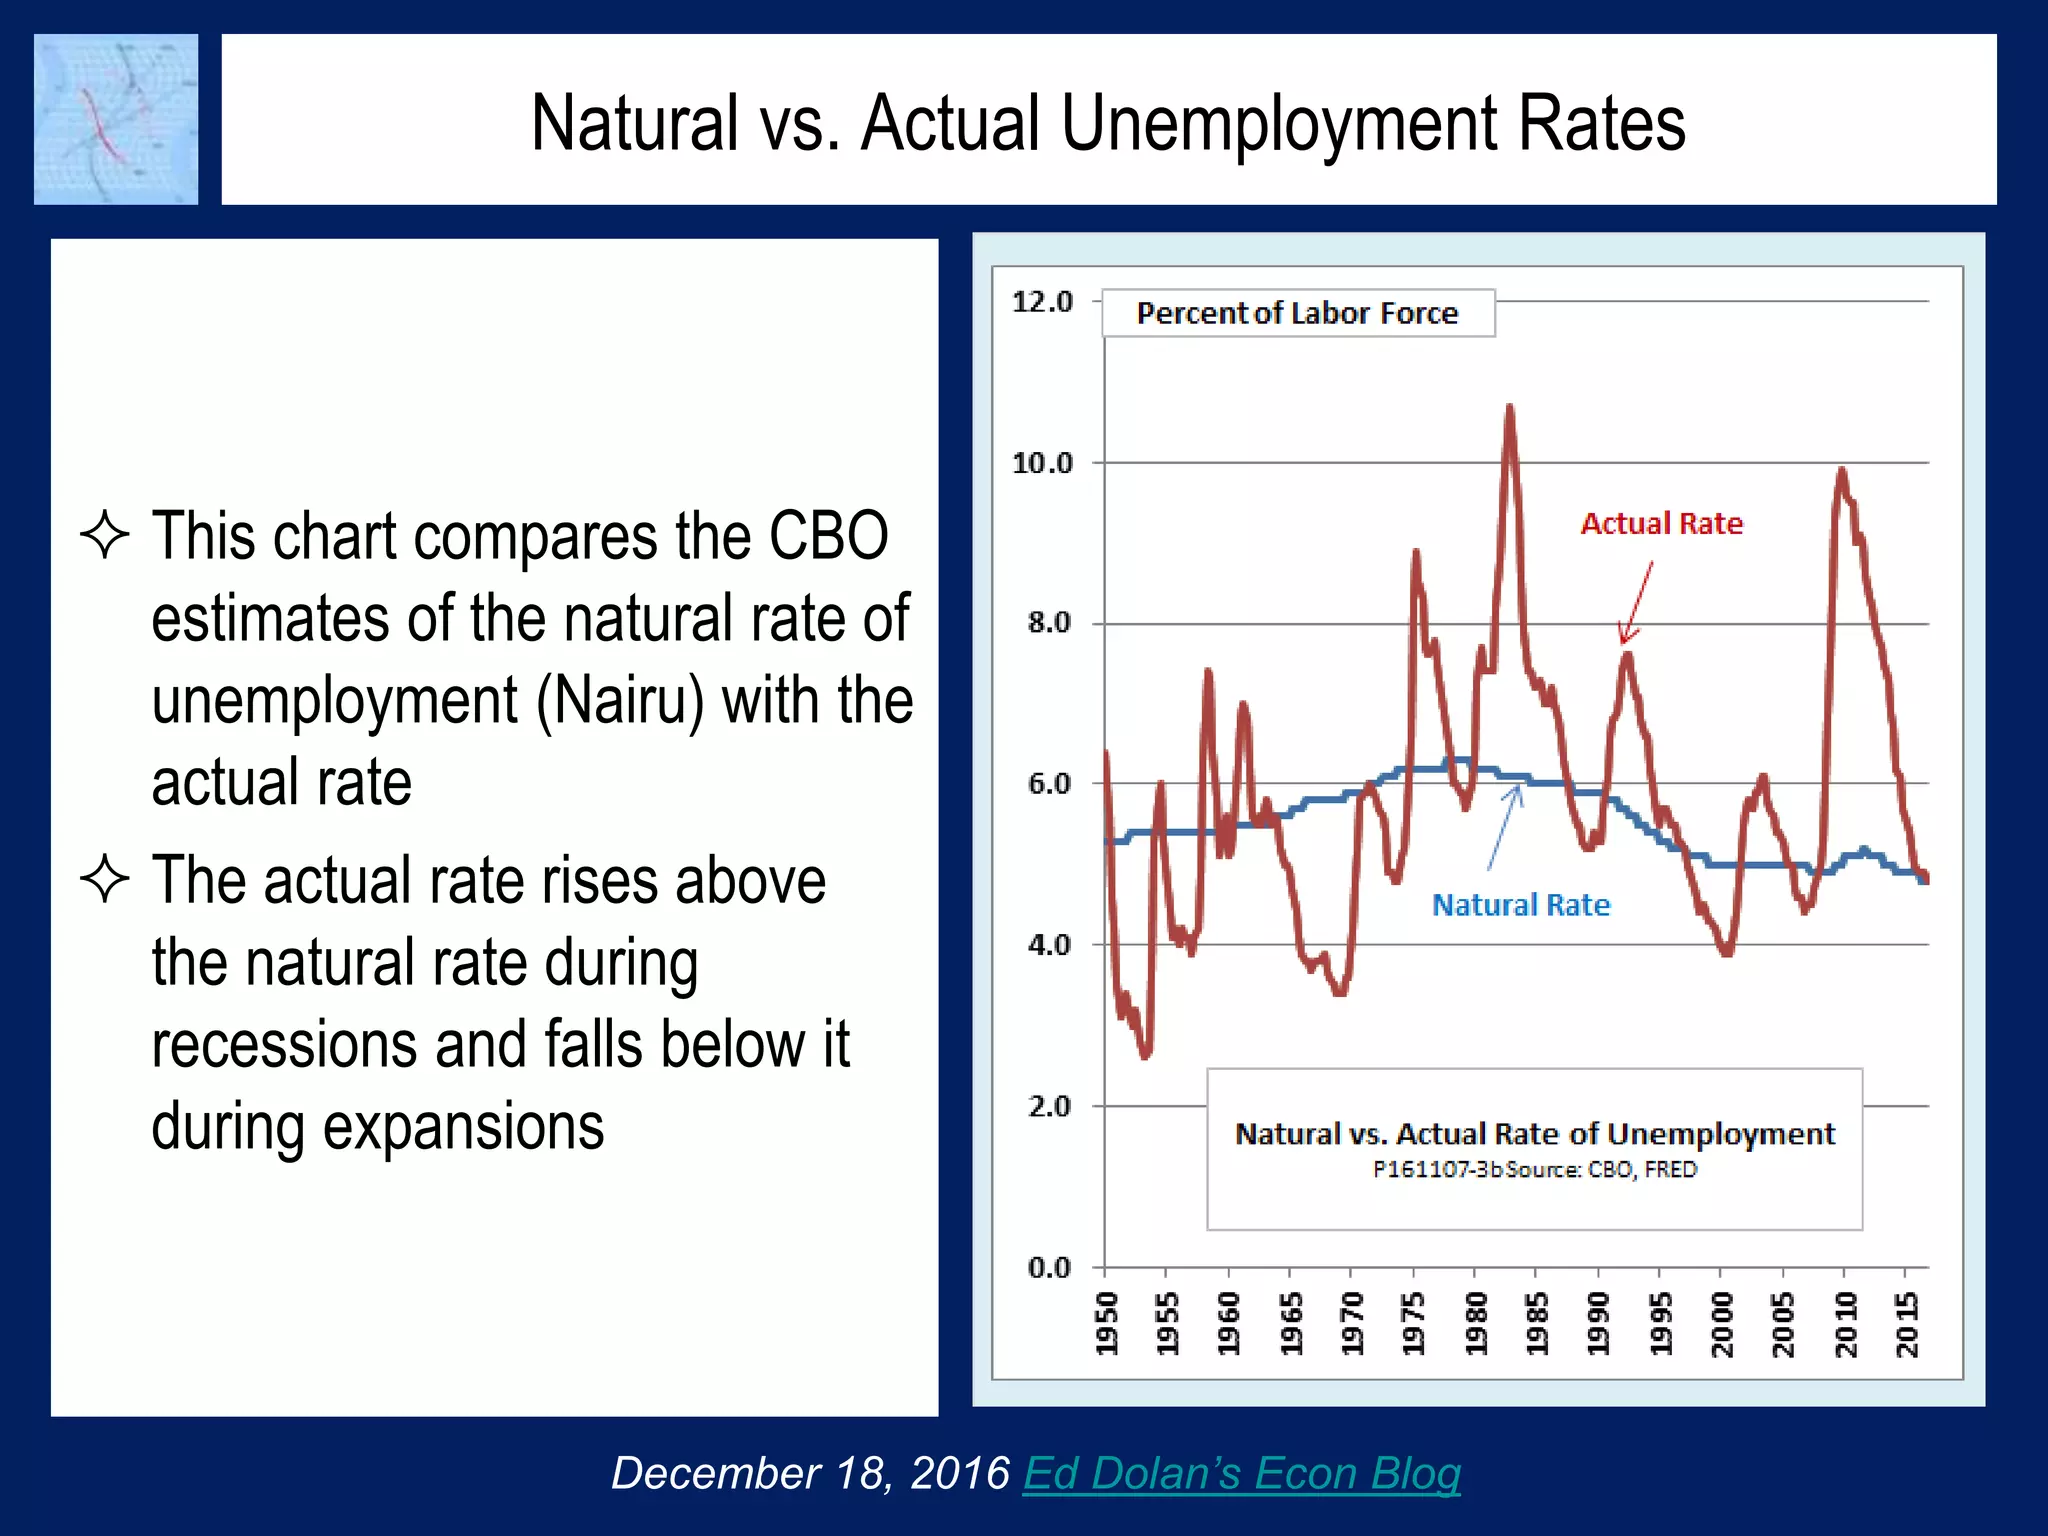
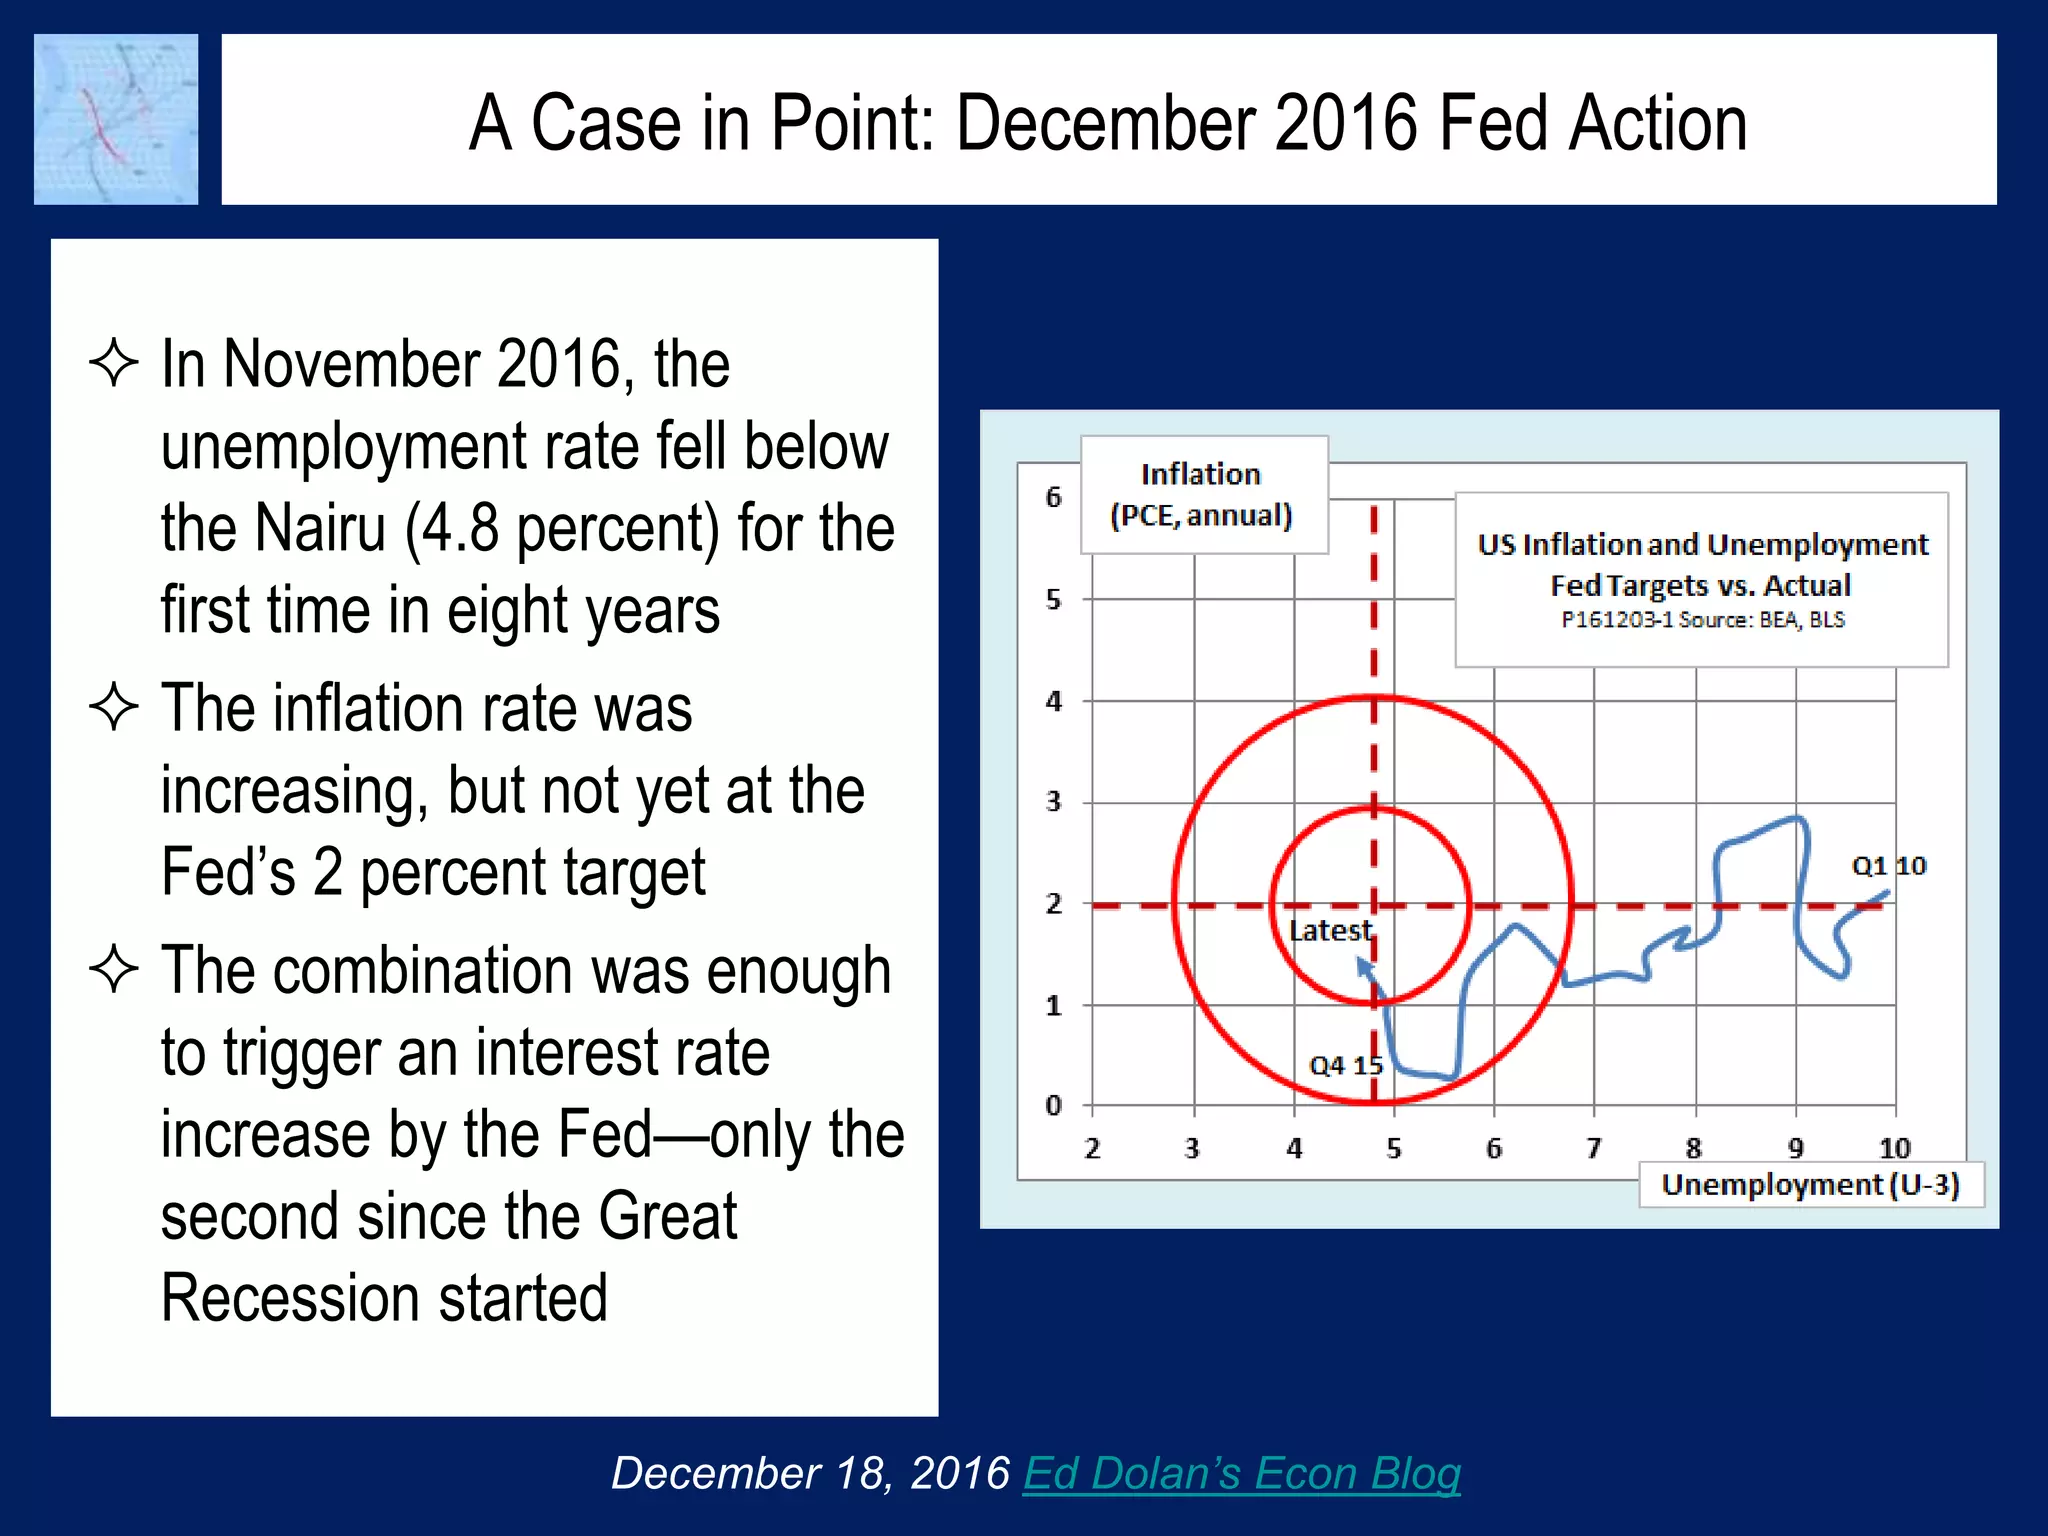


The document discusses the concept of the Non-Accelerating Inflation Rate of Unemployment (Nairu). The Nairu represents the lowest level of unemployment an economy can sustain before wages and prices begin to rapidly increase. It captures both parts of the Federal Reserve's dual mandate to achieve maximum employment and price stability. However, estimating the precise Nairu is difficult because the relationship between unemployment and inflation has changed over time and the Phillips Curve is no longer stable. Nonetheless, the Federal Reserve monitors unemployment relative to estimates of the Nairu when making decisions around interest rates and monetary policy.


