Applied Math 40S Slides May 16, 2007

Loading...

Flash Player 9 (or above) is needed to view presentations.
We have detected that you do not have it on your computer. To install it, go here.

0 comments

Post a comment

    Post a comment
    Embed Video
    Edit your comment Cancel

    Favorites, Groups & Events

    Applied Math 40S Slides May 16, 2007 - Presentation Transcript

    1. The sine curve (graph) ...
    2. The sine curve (graph) ...
    3. Let's look at the weather ... Winnipeg Weather Data as of May 15, 2007 for the last year Temperature Month J F MAM J J A SO N D Mean -17 -14 -6 4 12 17 20 18 12 6 -4 -14 Source: Winnipeg weather statistics

    + dkuropatwadkuropatwa, 3 years ago

    custom

    667 views, 0 favs, 1 embeds more stats

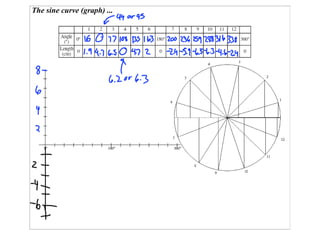
    The equation y = sin(x) and sinusoidal regression; more

    More info about this document

    © All Rights Reserved

    Go to text version

    • Total Views 667
      • 663 on SlideShare
      • 4 from embeds
    • Comments 0
    • Favorites 0
    • Downloads 15
    Most viewed embeds
    • 4 views on http://am40sw07.blogspot.com

    more

    All embeds
    • 4 views on http://am40sw07.blogspot.com

    less

    Flagged as inappropriate Flag as inappropriate
    Flag as inappropriate

    Select your reason for flagging this presentation as inappropriate. If needed, use the feedback form to let us know more details.

    Cancel
    File a copyright complaint
    Having problems? Go to our helpdesk?

    Categories