President Donald Trump's approval rating in Hawaii
•
1 like•2,034 views

President Donald Trump's approval rating in Hawaii

Recommended
Recommended
More Related Content
What's hot
What's hot (20)
Similar to President Donald Trump's approval rating in Hawaii
Similar to President Donald Trump's approval rating in Hawaii (20)
More from Honolulu Civil Beat
More from Honolulu Civil Beat (20)
Recently uploaded
Recently uploaded (20)
President Donald Trump's approval rating in Hawaii
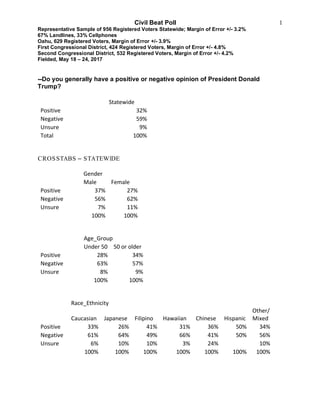
- 1. Civil Beat Poll Representative Sample of 956 Registered Voters Statewide; Margin of Error +/- 3.2% 67% Landlines, 33% Cellphones Oahu, 629 Registered Voters, Margin of Error +/- 3.9% First Congressional District, 424 Registered Voters, Margin of Error +/- 4.8% Second Congressional District, 532 Registered Voters, Margin of Error +/- 4.2% Fielded, May 18 – 24, 2017 1 --Do you generally have a positive or negative opinion of President Donald Trump? Statewide Positive 32% Negative 59% Unsure 9% Total 100% CROSSTABS – STATEWIDE Gender Male Female Positive 37% 27% Negative 56% 62% Unsure 7% 11% 100% 100% Age_Group Under 50 50 or older Positive 28% 34% Negative 63% 57% Unsure 8% 9% 100% 100% Race_Ethnicity Caucasian Japanese Filipino Hawaiian Chinese Hispanic Other/ Mixed Positive 33% 26% 41% 31% 36% 50% 34% Negative 61% 64% 49% 66% 41% 50% 56% Unsure 6% 10% 10% 3% 24% 10% 100% 100% 100% 100% 100% 100% 100%
- 2. Civil Beat Poll Representative Sample of 956 Registered Voters Statewide; Margin of Error +/- 3.2% 67% Landlines, 33% Cellphones Oahu, 629 Registered Voters, Margin of Error +/- 3.9% First Congressional District, 424 Registered Voters, Margin of Error +/- 4.8% Second Congressional District, 532 Registered Voters, Margin of Error +/- 4.2% Fielded, May 18 – 24, 2017 2 Political_Ideology Liberal/progressive Moderate Conservative Unsure Positive 12% 26% 69% 26% Negative 85% 67% 22% 53% Unsure 3% 7% 9% 21% 100% 100% 100% 100% PartyID Democrat Republican Independent Unsure Positive 10% 71% 48% 34% Negative 85% 16% 43% 41% Unsure 6% 13% 9% 25% 100% 100% 100% 100% CollegeDegree College Degree No college Degree No Response Positive 28% 33% 44% Negative 67% 57% 38% Unsure 6% 10% 18% 100% 100% 100% Income Less than $50,000 $50,000 - $100,000 More than $100,000 No Response Positive 31% 29% 34% 34% Negative 64% 64% 57% 50% Unsure 5% 7% 9% 16% 100% 100% 100% 100% County_CD Oahu_1 Oahu_2 Hawaii Maui Kauai Positive 29% 40% 26% 39% 43% Negative 61% 50% 66% 52% 53% Unsure 10% 10% 8% 8% 4% 100% 100% 100% 100% 100%
- 3. Civil Beat Poll Representative Sample of 956 Registered Voters Statewide; Margin of Error +/- 3.2% 67% Landlines, 33% Cellphones Oahu, 629 Registered Voters, Margin of Error +/- 3.9% First Congressional District, 424 Registered Voters, Margin of Error +/- 4.8% Second Congressional District, 532 Registered Voters, Margin of Error +/- 4.2% Fielded, May 18 – 24, 2017 3 --The state government of Hawaii has been at the forefront in opposing the Trump administration’s travel ban on people from a number of countries in the Middle- East--filing a number of lawsuits claiming that the ban is unconconstitutional because it singles out Muslims for discrimination. How do you feel about the state’s opposition to the Trump administration’s travel ban? Do you think it’s a good thing or a bad thing that the State of Hawaii has taken the lead on opposing the travel ban, or does it not matter much to you either way? Statewide Opposing Good 53% Opposing Bad 35% Does not matter 5% Unsure 9% Total 100% CROSSTABS – STATEWIDE Gender Male Female Opposing Good 51% 54% Opposing Bad 41% 29% Does not matter 4% 5% Unsure 4% 12% 100% 100% Age_Group Under 50 50 or older Opposing Good 58% 52% Opposing Bad 31% 36% Does not matter 4% 5% Unsure 7% 8% 100% 100%
- 4. Civil Beat Poll Representative Sample of 956 Registered Voters Statewide; Margin of Error +/- 3.2% 67% Landlines, 33% Cellphones Oahu, 629 Registered Voters, Margin of Error +/- 3.9% First Congressional District, 424 Registered Voters, Margin of Error +/- 4.8% Second Congressional District, 532 Registered Voters, Margin of Error +/- 4.2% Fielded, May 18 – 24, 2017 4 Race_Ethnicity Caucasian Japanese Filipino Hawaiian Chinese Hispanic Other/ Mixed Opposing Good 61% 49% 49% 49% 36% 50% 52% Opposing Bad 34% 34% 39% 34% 32% 50% 39% Does not matter 3% 8% 5% 2% 9% 3% Unsure 2% 9% 7% 15% 24% 6% 100% 100% 100% 100% 100% 100% 100% Political_Ideology Liberal/progressive Moderate Conservative Unsure Opposing Good 82% 62% 17% 41% Opposing Bad 14% 27% 73% 29% Does not matter 3% 6% 5% 7% Unsure 2% 5% 5% 24% 100% 100% 100% 100% PartyID Democrat Republican Independent Unsure Opposing Good 74% 14% 44% 23% Opposing Bad 15% 75% 44% 40% Does not matter 5% 6% 5% 2% Unsure 6% 5% 7% 35% 100% 100% 100% 100% CollegeDegree College Degree No college Degree No Response Opposing Good 60% 51% 34% Opposing Bad 30% 38% 42% Does not matter 6% 4% 1% Unsure 4% 7% 23% 100% 100% 100%
- 5. Civil Beat Poll Representative Sample of 956 Registered Voters Statewide; Margin of Error +/- 3.2% 67% Landlines, 33% Cellphones Oahu, 629 Registered Voters, Margin of Error +/- 3.9% First Congressional District, 424 Registered Voters, Margin of Error +/- 4.8% Second Congressional District, 532 Registered Voters, Margin of Error +/- 4.2% Fielded, May 18 – 24, 2017 5 Income Less than $50,000 $50,000 - $100,000 More than $100,000 No Response Opposing Good 57% 59% 53% 43% Opposing Bad 35% 33% 40% 31% Does not matter 4% 4% 3% 8% Unsure 4% 5% 3% 18% 100% 100% 100% 100% County_CD Oahu_1 Oahu_2 Hawaii Maui Kauai Opposing Good 51% 47% 65% 47% 59% Opposing Bad 36% 40% 21% 39% 26% Does not matter 5% 4% 4% 8% Unsure 7% 10% 10% 7% 15% 100% 100% 100% 100% 100% QTrump Positive Negative Unsure Opposing Good 13% 79% 23% Opposing Bad 79% 12% 26% Does not matter 4% 4% 11% Unsure 5% 6% 40% 100% 100% 100%
- 6. Civil Beat Poll Representative Sample of 956 Registered Voters Statewide; Margin of Error +/- 3.2% 67% Landlines, 33% Cellphones Oahu, 629 Registered Voters, Margin of Error +/- 3.9% First Congressional District, 424 Registered Voters, Margin of Error +/- 4.8% Second Congressional District, 532 Registered Voters, Margin of Error +/- 4.2% Fielded, May 18 – 24, 2017 6 --State lawmakers recently introduced a resolution saying that Hawaii should not help the federal government deport undocumented immigrants, as long they have not committed a violent crime. This is sometimes referred to as a “sanctuary state” resolution and also as a resolution to honor Hawaii’s Ho’okipa tradition of hospitality. Do you think the state should or should not help the federal government deport non-violent undocumented immigrants, or does it not matter much to you either way? Statewide Should help 36% Should not help 45% Does not matter 7% Unsure 12% Total 100% CROSSTABS – STATEWIDE Gender Male Female Should help 45% 28% Should not help 42% 47% Does not matter 5% 10% Unsure 8% 15% 100% 100% Age_Group Under 50 50 or older Should help 34% 36% Should not help 50% 44% Does not matter 6% 8% Unsure 10% 12% 100% 100%
- 7. Civil Beat Poll Representative Sample of 956 Registered Voters Statewide; Margin of Error +/- 3.2% 67% Landlines, 33% Cellphones Oahu, 629 Registered Voters, Margin of Error +/- 3.9% First Congressional District, 424 Registered Voters, Margin of Error +/- 4.8% Second Congressional District, 532 Registered Voters, Margin of Error +/- 4.2% Fielded, May 18 – 24, 2017 7 Race_Ethnicity Caucasian Japanese Filipino Hawaiian Chinese Hispanic Other/ Mixed Should help 34% 30% 49% 28% 36% 50% 41% Should not help 56% 41% 30% 47% 37% 50% 44% Does not matter 3% 17% 6% 8% 5% 3% Unsure 7% 12% 15% 18% 22% 12% 100% 100% 100% 100% 100% 100% 100% Political_Ideology Liberal/progressive Moderate Conservative Unsure Should help 26% 35% 55% 22% Should not help 66% 50% 28% 29% Does not matter 4% 6% 8% 16% Unsure 4% 9% 8% 33% 100% 100% 100% 100% PartyID Democrat Republican Independent Unsure Should help 24% 58% 43% 18% Should not help 58% 22% 40% 36% Does not matter 8% 11% 6% 2% Unsure 10% 9% 11% 43% 100% 100% 100% 100% CollegeDegree College Degree No college Degree No Response Should help 34% 38% 29% Should not help 53% 41% 33% Does not matter 5% 10% 9% Unsure 8% 11% 29% 100% 100% 100%
- 8. Civil Beat Poll Representative Sample of 956 Registered Voters Statewide; Margin of Error +/- 3.2% 67% Landlines, 33% Cellphones Oahu, 629 Registered Voters, Margin of Error +/- 3.9% First Congressional District, 424 Registered Voters, Margin of Error +/- 4.8% Second Congressional District, 532 Registered Voters, Margin of Error +/- 4.2% Fielded, May 18 – 24, 2017 8 Income Less than $50,000 $50,000 - $100,000 More than $100,000 No Response Should help 38% 32% 39% 33% Should not help 48% 53% 48% 33% Does not matter 8% 6% 7% 11% Unsure 7% 10% 7% 24% 100% 100% 100% 100% County_CD Oahu_1 Oahu_2 Hawaii Maui Kauai Should help 36% 37% 31% 32% 47% Should not help 42% 45% 53% 50% 34% Does not matter 9% 7% 5% 5% 6% Unsure 12% 11% 11% 13% 13% 100% 100% 100% 100% 100% Trump Positive Negative Unsure Should help 62% 22% 29% Should not help 24% 61% 14% Does not matter 5% 7% 15% Unsure 9% 9% 43% 100% 100% 100%
- 9. Civil Beat Poll Representative Sample of 956 Registered Voters Statewide; Margin of Error +/- 3.2% 67% Landlines, 33% Cellphones Oahu, 629 Registered Voters, Margin of Error +/- 3.9% First Congressional District, 424 Registered Voters, Margin of Error +/- 4.8% Second Congressional District, 532 Registered Voters, Margin of Error +/- 4.2% Fielded, May 18 – 24, 2017 9 --It has been fairly well established by U.S. and other intelligence agencies that computer hackers associated with Russia were responsible for leaking Democratic National Committee emails in 2016 with the goal of damaging Hillary Clinton’s campaign. What role, if any, do you think the Trump campaign had in the release of those emails? Do you think that the Trump campaign was not involved in the email leaks at all, that there may have been some members or associates of the Trump campaign who were involved in planning the email leaks, but that Donald Trump himself did not know about it and was not involved, or that Donald Trump himself had some involvement in planning the email leaks? Statewide Not involved 28% Campaign involved 16% Trump involved 35% Unsure 21% Total 100% CROSSTABS – STATEWIDE Gender Male Female Not involved 31% 26% Campaign involved 18% 15% Trump involved 31% 40% Unsure 20% 20% 100% 100% Age_Group Under 50 50 or older Not involved 22% 31% Campaign involved 19% 16% Trump involved 36% 36% Unsure 23% 18% 100% 100%
- 10. Civil Beat Poll Representative Sample of 956 Registered Voters Statewide; Margin of Error +/- 3.2% 67% Landlines, 33% Cellphones Oahu, 629 Registered Voters, Margin of Error +/- 3.9% First Congressional District, 424 Registered Voters, Margin of Error +/- 4.8% Second Congressional District, 532 Registered Voters, Margin of Error +/- 4.2% Fielded, May 18 – 24, 2017 10 Race_Ethnicity Caucasian Japanese Filipino Hawaiian Chinese Hispanic Other/ Mixed Not involved 30% 28% 21% 31% 22% 44% 29% Campaign involved 17% 16% 14% 18% 24% 22% 14% Trump involved 35% 39% 36% 40% 20% 33% 35% Unsure 18% 18% 29% 11% 34% 22% 100% 100% 100% 100% 100% 100% 100% Political_Ideology Liberal/progressive Moderate Conservative Unsure Not involved 12% 20% 63% 20% Campaign involved 22% 20% 10% 12% Trump involved 50% 41% 16% 30% Unsure 16% 20% 11% 38% 100% 100% 100% 100% Democrat Republican Independent Not involved 9% 65% 37% Campaign involved 21% 10% 15% Trump involved 53% 9% 24% Unsure 18% 16% 23% 100% 100% 100% CollegeDegree College Degree No college Degree No Response Not involved 24% 31% 31% Campaign involved 17% 17% 13% Trump involved 39% 37% 18% Unsure 20% 16% 38% 100% 100% 100%
- 11. Civil Beat Poll Representative Sample of 956 Registered Voters Statewide; Margin of Error +/- 3.2% 67% Landlines, 33% Cellphones Oahu, 629 Registered Voters, Margin of Error +/- 3.9% First Congressional District, 424 Registered Voters, Margin of Error +/- 4.8% Second Congressional District, 532 Registered Voters, Margin of Error +/- 4.2% Fielded, May 18 – 24, 2017 11 Income Less than $50,000 $50,000 - $100,000 More than $100,000 No Response Not involved 27% 25% 38% 24% Campaign involved 17% 20% 15% 13% Trump involved 40% 35% 37% 30% Unsure 16% 20% 10% 33% 100% 100% 100% 100% County_CD Oahu_1 Oahu_2 Hawaii Maui Kauai Not involved 28% 33% 18% 38% 21% Campaign involved 16% 22% 22% 7% 9% Trump involved 39% 28% 42% 26% 25% Unsure 18% 17% 18% 29% 45% 100% 100% 100% 100% 100% QTrump Positive Negative Unsure Not involved 72% 5% 24% Campaign involved 10% 21% 9% Trump involved 2% 56% 18% Unsure 16% 19% 48% 100% 100% 100%
- 12. Civil Beat Poll Representative Sample of 956 Registered Voters Statewide; Margin of Error +/- 3.2% 67% Landlines, 33% Cellphones Oahu, 629 Registered Voters, Margin of Error +/- 3.9% First Congressional District, 424 Registered Voters, Margin of Error +/- 4.8% Second Congressional District, 532 Registered Voters, Margin of Error +/- 4.2% Fielded, May 18 – 24, 2017 12 About the Poll Civil Beat surveyed a random sample of 956 registered voters statewide. Calls were made from May 18 - 24, 2017, using interactive voice response technology (touch-tone polling). Cell phones were contacted by live call-agents who asked respondents whether they were willing to participate in a recorded survey. Respondents who gave consent were patched through to the same recorded survey that was sent to landlines. Results were balanced for gender, age, race/ethnicity, and education level. The margin of error for the full sample is +/- 3.2 percentage points. Other sources of error, such as imperfect response rates, are also common in public opinion research and may affect the results. The margin of error for any crosstabulated result is larger than the margin of error of the corresponding topline result. The poll was conducted by Civil Beat working with Merriman River Group, a full-service consulting organization specializing in opinion research, election management, and communications.