Civil Beat Poll October 2018 — Issues:
•
1 like•543 views

Civil Beat Poll October 2018 — Issues:

Recommended
Recommended
More Related Content
What's hot
What's hot (20)
Similar to Civil Beat Poll October 2018 — Issues:
Similar to Civil Beat Poll October 2018 — Issues: (20)
More from Honolulu Civil Beat
More from Honolulu Civil Beat (20)
Recently uploaded
Recently uploaded (16)
Civil Beat Poll October 2018 — Issues:
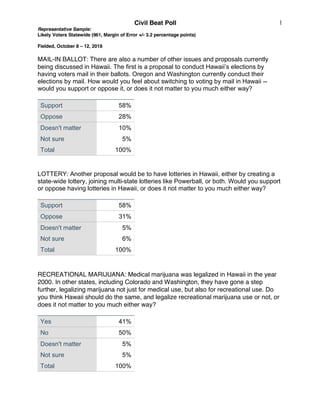
- 1. Civil Beat Poll Representative Sample: Likely Voters Statewide (961, Margin of Error +/- 3.2 percentage points) Fielded, October 8 – 12, 2018 1 MAIL-IN BALLOT: There are also a number of other issues and proposals currently being discussed in Hawaii. The first is a proposal to conduct Hawaii’s elections by having voters mail in their ballots. Oregon and Washington currently conduct their elections by mail. How would you feel about switching to voting by mail in Hawaii -- would you support or oppose it, or does it not matter to you much either way? Support 58% Oppose 28% Doesn't matter 10% Not sure 5% Total 100% LOTTERY: Another proposal would be to have lotteries in Hawaii, either by creating a state-wide lottery, joining multi-state lotteries like Powerball, or both. Would you support or oppose having lotteries in Hawaii, or does it not matter to you much either way? Support 58% Oppose 31% Doesn't matter 5% Not sure 6% Total 100% RECREATIONAL MARIJUANA: Medical marijuana was legalized in Hawaii in the year 2000. In other states, including Colorado and Washington, they have gone a step further, legalizing marijuana not just for medical use, but also for recreational use. Do you think Hawaii should do the same, and legalize recreational marijuana use or not, or does it not matter to you much either way? Yes 41% No 50% Doesn't matter 5% Not sure 5% Total 100%
- 2. Civil Beat Poll Representative Sample: Likely Voters Statewide (961, Margin of Error +/- 3.2 percentage points) Fielded, October 8 – 12, 2018 2 TERM LIMITS: Another proposal would be to have term limits for members of the state legislature in Hawaii. Currently, county officials, as well as Hawaii's governor and lieutenant governor have term limits, but state legislators do not. What do you think -- would you support or oppose term limits for members of the Hawaii state legislature, or does it not matter to you much either way? Support 70% Oppose 14% Doesn't matter 8% Not sure 8% Total 100% INITIATIVES, REFERENDUMS, AND RECALLS: Another issue is a system of citizen initiatives, referendums, and recalls. These allow residents to make changes to laws and government through direct vote, rather than having to go through the legislature. Currently, about half the states in the U.S. have citizens' initiatives, referendums, or recalls that allow their residents to make direct changes. What do you think – should Hawaii enact a system of citizen's initiatives, referendums, and recalls or not, or does it not matter to you much either way? Support 55% Oppose 21% Doesn't matter 10% Not sure 14% Total 100%
- 3. Civil Beat Poll Representative Sample: Likely Voters Statewide (961, Margin of Error +/- 3.2 percentage points) Fielded, October 8 – 12, 2018 3 CROSSTABS—Mail-In Ballot Male Female Support 57% 59% Oppose 32% 25% Does not matter 8% 11% Unsure 3% 6% Total 100% 100% Under 50 50 or Older Support 49% 62% Oppose 42% 23% Does not matter 6% 10% Unsure 3% 5% Total 100% 100% Caucasian Japanese Filipino Hawaiian Chinese Hispanic Other/Mixed Support 57% 64% 48% 58% 80% 52% 50% Oppose 30% 24% 35% 33% 13% 37% 33% Does not matter 8% 9% 11% 5% 5% 7% 12% Unsure 5% 3% 6% 5% 3% 4% 5% Total 100% 100% 100% 100% 100% 100% 100%
- 4. Civil Beat Poll Representative Sample: Likely Voters Statewide (961, Margin of Error +/- 3.2 percentage points) Fielded, October 8 – 12, 2018 4 Liberal/progressive Moderate Conservative Support 66% 59% 47% Oppose 24% 26% 43% Does not matter 7% 10% 7% Unsure 4% 5% 3% Total 100% 100% 100% Democrat Republican Independent Support 64% 40% 58% Oppose 23% 48% 29% Does not matter 10% 7% 7% Unsure 3% 4% 7% Total 100% 100% 100% College Degree No college Degree Support 58% 60% Oppose 30% 28% Does not matter 8% 10% Unsure 4% 3% Total 100% 100%
- 5. Civil Beat Poll Representative Sample: Likely Voters Statewide (961, Margin of Error +/- 3.2 percentage points) Fielded, October 8 – 12, 2018 5 Less than $50,000 $50,000 - $100,000 More than $100,000 Support 59% 60% 59% Oppose 29% 29% 30% Does not matter 10% 9% 6% Unsure 3% 2% 6% Total 100% 100% 100% Oahu_1 Oahu_2 Hawaii Maui Kauai Support 56% 62% 54% 63% 58% Oppose 30% 23% 29% 30% 21% Does not matter 10% 10% 12% 2% 14% Unsure 4% 5% 5% 6% 7% Total 100% 100% 100% 100% 100%
- 6. Civil Beat Poll Representative Sample: Likely Voters Statewide (961, Margin of Error +/- 3.2 percentage points) Fielded, October 8 – 12, 2018 6 CROSSTABS—Lottery Male Female Support 66% 52% Oppose 27% 35% Does not matter 4% 6% Unsure 4% 7% Total 100% 100% Under 50 50 or Older Support 64% 56% Oppose 23% 35% Does not matter 7% 4% Unsure 6% 5% Total 100% 100% Caucasian Japanese Filipino Hawaiian Chinese Hispanic Other/Mixed Support 56% 53% 60% 74% 60% 75% 57% Oppose 32% 39% 28% 20% 33% 11% 31% Does not matter 6% 4% 6% 1% 0% 11% 7% Unsure 7% 5% 6% 6% 8% 4% 4% Total 100% 100% 100% 100% 100% 100% 100%
- 7. Civil Beat Poll Representative Sample: Likely Voters Statewide (961, Margin of Error +/- 3.2 percentage points) Fielded, October 8 – 12, 2018 7 Liberal/progressive Moderate Conservative Support 56% 57% 62% Oppose 34% 29% 34% Does not matter 4% 8% 2% Unsure 7% 6% 3% Total 100% 100% 100% Democrat Republican Independent Support 53% 67% 63% Oppose 34% 29% 27% Does not matter 8% 2% 2% Unsure 5% 3% 8% Total 100% 100% 100% College Degree No college Degree Support 59% 58% Oppose 32% 31% Does not matter 4% 4% Unsure 5% 7% Total 100% 100%
- 8. Civil Beat Poll Representative Sample: Likely Voters Statewide (961, Margin of Error +/- 3.2 percentage points) Fielded, October 8 – 12, 2018 8 Less than $50,000 $50,000 - $100,000 More than $100,000 Support 58% 60% 67% Oppose 30% 31% 25% Does not matter 5% 5% 3% Unsure 7% 4% 4% Total 100% 100% 100% Oahu_1 Oahu_2 Hawaii Maui Kauai Support 61% 63% 47% 52% 58% Oppose 29% 31% 39% 35% 30% Does not matter 5% 1% 9% 5% 7% Unsure 6% 5% 4% 8% 5% Total 100% 100% 100% 100% 100%
- 9. Civil Beat Poll Representative Sample: Likely Voters Statewide (961, Margin of Error +/- 3.2 percentage points) Fielded, October 8 – 12, 2018 9 CROSSTABS—Recreational Marijuana Male Female Yes 49% 34% No 46% 54% Does not matter 2% 7% Unsure 4% 6% Total 100% 100% Under 50 50 or Older Yes 63% 33% No 29% 57% Does not matter 5% 4% Unsure 3% 6% Total 100% 100% Caucasian Japanese Filipino Hawaiian Chinese Hispanic Other/Mixed Yes 51% 31% 27% 43% 58% 32% 43% No 41% 62% 67% 44% 35% 50% 43% Does not matter 7% 2% 3% 1% 0% 18% 7% Unsure 2% 5% 4% 12% 8% 6% Total 100% 100% 100% 100% 100% 100% 100%
- 10. Civil Beat Poll Representative Sample: Likely Voters Statewide (961, Margin of Error +/- 3.2 percentage points) Fielded, October 8 – 12, 2018 10 Liberal/progressive Moderate Conservative Yes 60% 38% 26% No 31% 53% 68% Does not matter 3% 5% 3% Unsure 6% 3% 3% Total 100% 100% 100% Democrat Republican Independent Yes 44% 30% 45% No 45% 65% 49% Does not matter 6% 3% 3% Unsure 5% 3% 4% Total 100% 100% 100% College Degree No college Degree Yes 46% 38% No 46% 53% Does not matter 4% 4% Unsure 5% 4% Total 100% 100%
- 11. Civil Beat Poll Representative Sample: Likely Voters Statewide (961, Margin of Error +/- 3.2 percentage points) Fielded, October 8 – 12, 2018 11 Less than $50,000 $50,000 - $100,000 More than $100,000 Yes 46% 46% 42% No 46% 47% 48% Does not matter 4% 3% 6% Unsure 4% 4% 4% Total 100% 100% 100% Oahu_1 Oahu_2 Hawaii Maui Kauai Yes 37% 42% 50% 50% 30% No 55% 51% 38% 42% 47% Does not matter 4% 4% 7% 4% 9% Unsure 5% 4% 4% 5% 14% Total 100% 100% 100% 100% 100%
- 12. Civil Beat Poll Representative Sample: Likely Voters Statewide (961, Margin of Error +/- 3.2 percentage points) Fielded, October 8 – 12, 2018 12 CROSSTABS—Term Limits Male Female Support 73% 68% Oppose 17% 12% Does not matter 4% 10% Unsure 6% 10% Total 100% 100% Under 50 50 or Older Support 81% 69% Oppose 10% 15% Does not matter 1% 9% Unsure 8% 8% Total 100% 100% Caucasian Japanese Filipino Hawaiian Chinese Hispanic Other/Mixed Support 77% 59% 75% 77% 78% 78% 72% Oppose 14% 24% 8% 11% 5% 4% 9% Does not matter 4% 12% 9% 6% 13% 4% 4% Unsure 6% 4% 9% 7% 5% 15% 15% Total 100% 100% 100% 100% 100% 100% 100%
- 13. Civil Beat Poll Representative Sample: Likely Voters Statewide (961, Margin of Error +/- 3.2 percentage points) Fielded, October 8 – 12, 2018 13 Liberal/progressive Moderate Conservative Support 71% 69% 86% Oppose 19% 14% 9% Does not matter 4% 12% 3% Unsure 6% 5% 3% Total 100% 100% 100% Democrat Republican Independent Support 63% 84% 86% Oppose 19% 6% 8% Does not matter 9% 5% 4% Unsure 9% 5% 2% Total 100% 100% 100% College Degree No college Degree Support 77% 68% Oppose 14% 15% Does not matter 4% 10% Unsure 5% 8% Total 100% 100%
- 14. Civil Beat Poll Representative Sample: Likely Voters Statewide (961, Margin of Error +/- 3.2 percentage points) Fielded, October 8 – 12, 2018 14 Less than $50,000 $50,000 - $100,000 More than $100,000 Support 76% 77% 77% Oppose 11% 16% 14% Does not matter 9% 7% 4% Unsure 4% 1% 5% Total 100% 100% 100% Oahu_1 Oahu_2 Hawaii Maui Kauai Support 69% 70% 71% 81% 55% Oppose 14% 18% 14% 10% 7% Does not matter 8% 5% 8% 5% 19% Unsure 9% 7% 7% 5% 19% Total 100% 100% 100% 100% 100%
- 15. Civil Beat Poll Representative Sample: Likely Voters Statewide (961, Margin of Error +/- 3.2 percentage points) Fielded, October 8 – 12, 2018 15 CROSSTABS—Initiatives, Referendums, and Recalls Male Female Support 60% 52% Oppose 25% 17% Does not matter 6% 13% Unsure 10% 18% Total 100% 100% Under 50 50 or Older Support 63% 53% Oppose 14% 23% Does not matter 9% 9% Unsure 14% 14% Total 100% 100% Caucasian Japanese Filipino Hawaiian Chinese Hispanic Other/Mixed Support 55% 54% 51% 60% 55% 48% 64% Oppose 17% 29% 13% 17% 23% 26% 19% Does not matter 11% 7% 11% 6% 8% 7% 11% Unsure 17% 9% 25% 17% 15% 19% 6% Total 100% 100% 100% 100% 100% 100% 100%
- 16. Civil Beat Poll Representative Sample: Likely Voters Statewide (961, Margin of Error +/- 3.2 percentage points) Fielded, October 8 – 12, 2018 16 Liberal/progressive Moderate Conservative Support 64% 58% 55% Oppose 19% 19% 26% Does not matter 7% 10% 6% Unsure 11% 13% 13% Total 100% 100% 100% Democrat Republican Independent Support 56% 58% 58% Oppose 19% 22% 22% Does not matter 12% 8% 5% Unsure 14% 12% 15% Total 100% 100% 100% College Degree No college Degree Support 60% 57% Oppose 21% 18% Does not matter 7% 11% Unsure 12% 15% Total 100% 100%
- 17. Civil Beat Poll Representative Sample: Likely Voters Statewide (961, Margin of Error +/- 3.2 percentage points) Fielded, October 8 – 12, 2018 17 Less than $50,000 $50,000 - $100,000 More than $100,000 Support 64% 60% 63% Oppose 14% 19% 23% Does not matter 9% 10% 4% Unsure 13% 12% 11% Total 100% 100% 100% Oahu_1 Oahu_2 Hawaii Maui Kauai Support 55% 55% 53% 63% 51% Oppose 22% 24% 18% 18% 16% Does not matter 10% 9% 12% 7% 11% Unsure 14% 12% 18% 12% 23% Total 100% 100% 100% 100% 100%
- 18. Civil Beat Poll Representative Sample: Likely Voters Statewide (961, Margin of Error +/- 3.2 percentage points) Fielded, October 8 – 12, 2018 18 About the Poll Civil Beat surveyed a random sample of 961 likely General Election voters statewide. Calls were made from October 8 – 12, 2018, using interactive voice response technology (touch-tone polling). Cell phones were contacted by live call-agents who obtained consent and then patched consenting participants through to the same recorded survey as landline respondents. The sample consisted of 70% landlines and 30% cellphones. Results were balanced for gender, age, ancestry/ethnicity/race, county and Congressional District of residence, education, and likelihood of voting. The margin of error +/- 3.2 percentage points. Other sources of error, such as imperfect response rates and design effect (the effect of weighting results based on demographics) are also common in public opinion research and may affect the results. The adjusted margin of error, accounting for the design effect is +/- 4.3 percentage points. The margin of error for any crosstabulated result is larger than the margin of error of the corresponding topline result. Some columns may sum to totals slightly higher or lower than 100% due to rounding. The poll was conducted by Civil Beat working with Merriman River Group, a full-service consulting organization specializing in opinion research, election management, and communications.