Download as POTX, PPTX


![$ sar -n TCP,ETCP,DEV 1
Linux 3.2.55 (test-e4f1a80b) 08/18/2014 _x86_64_ (8 CPU)
09:10:43 PM IFACE rxpck/s txpck/s rxkB/s txkB/s rxcmp/s txcmp/s rxmcst/s
09:10:44 PM lo 14.00 14.00 1.34 1.34 0.00 0.00 0.00
09:10:44 PM eth0 4114.00 4186.00 4537.46 28513.24 0.00 0.00 0.00
09:10:43 PM active/s passive/s iseg/s oseg/s
09:10:44 PM 21.00 4.00 4107.00 22511.00
09:10:43 PM atmptf/s estres/s retrans/s isegerr/s orsts/s
09:10:44 PM 0.00 0.00 36.00 0.00 1.00
[…]](https://image.slidesharecdn.com/awsreinvent2014perftuningec2-141112191859-conversion-gate02/75/Performance-Tuning-EC2-Instances-54-2048.jpg)
![# ./iosnoop –ts
Tracing block I/O. Ctrl-C to end.
STARTs ENDs COMM PID TYPE DEV BLOCK BYTES LATms
5982800.302061 5982800.302679 supervise 1809 W 202,1 17039600 4096 0.62
5982800.302423 5982800.302842 supervise 1809 W 202,1 17039608 4096 0.42
5982800.304962 5982800.305446 supervise 1801 W 202,1 17039616 4096 0.48
5982800.305250 5982800.305676 supervise 1801 W 202,1 17039624 4096 0.43
[…]
# ./iosnoop –h
USAGE: iosnoop [-hQst] [-d device] [-i iotype] [-p PID] [-n name] [duration]
-d device # device string (eg, "202,1)
-i iotype # match type (eg, '*R*' for all reads)
-n name # process name to match on I/O issue
-p PID # PID to match on I/O issue
-Q # include queueing time in LATms
-s # include start time of I/O (s)
-t # include completion time of I/O (s)
[…]](https://image.slidesharecdn.com/awsreinvent2014perftuningec2-141112191859-conversion-gate02/75/Performance-Tuning-EC2-Instances-65-2048.jpg)
![# perf record –e skb:consume_skb –ag -- sleep 10
# perf report
[...]
74.42% swapper [kernel.kallsyms] [k] consume_skb
|
--- consume_skb
arp_process
arp_rcv
__netif_receive_skb_core
__netif_receive_skb
netif_receive_skb
virtnet_poll
net_rx_action
__do_softirq
irq_exit
do_IRQ
ret_from_intr
[…]
Summarizing stack traces for a
tracepoint
perf_events can do many things,
it is hard to pick just one example](https://image.slidesharecdn.com/awsreinvent2014perftuningec2-141112191859-conversion-gate02/75/Performance-Tuning-EC2-Instances-67-2048.jpg)
![ec2-guest# ./showboost
CPU MHz : 2500
Turbo MHz : 2900 (10 active)
Turbo Ratio : 116% (10 active)
CPU 0 summary every 5 seconds...
Real CPU MHz
TIME C0_MCYC C0_ACYC UTIL RATIO MHz
06:11:35 6428553166 7457384521 51% 116% 2900
06:11:40 6349881107 7365764152 50% 115% 2899
06:11:45 6240610655 7239046277 49% 115% 2899
[...]](https://image.slidesharecdn.com/awsreinvent2014perftuningec2-141112191859-conversion-gate02/75/Performance-Tuning-EC2-Instances-69-2048.jpg)


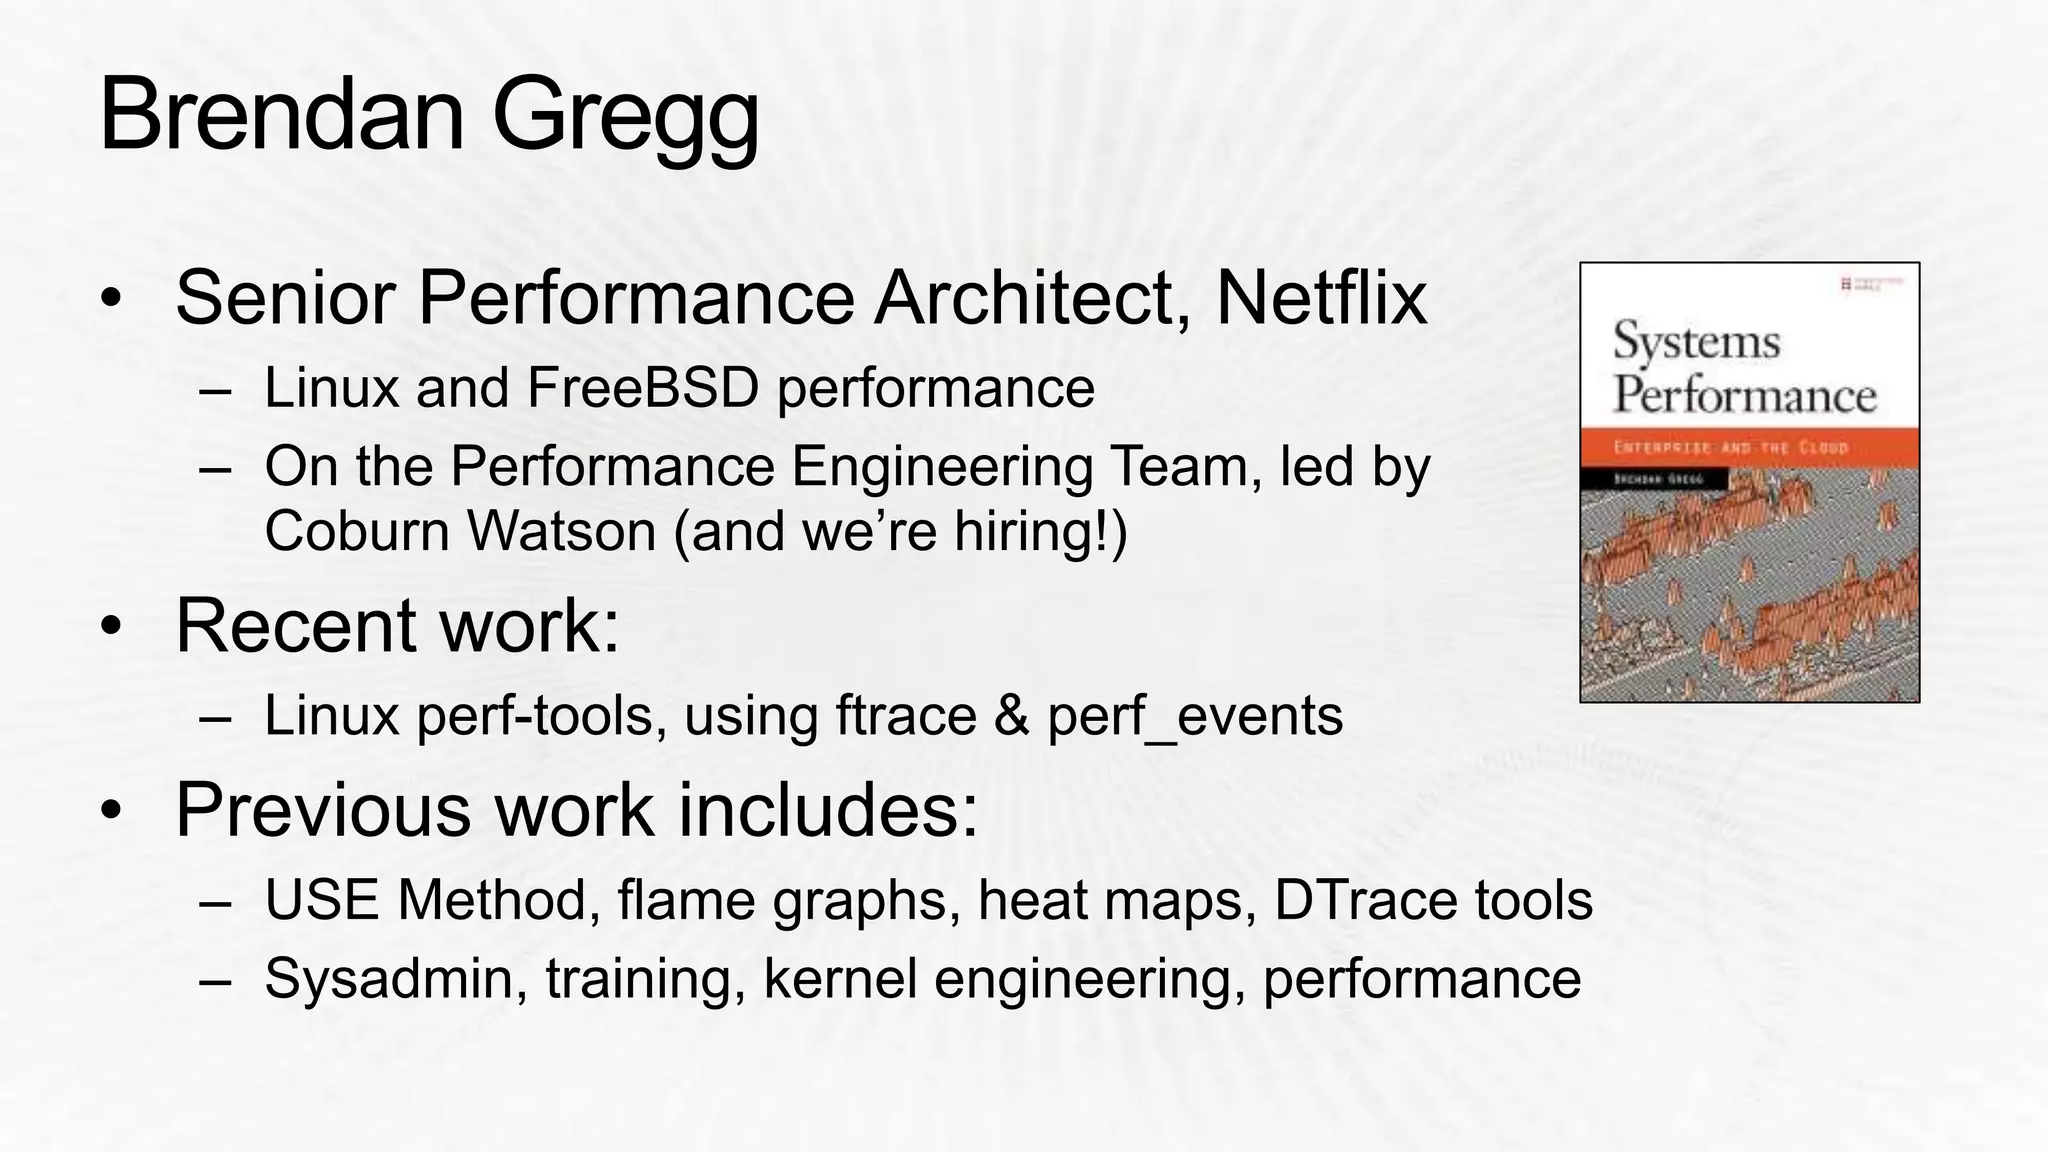
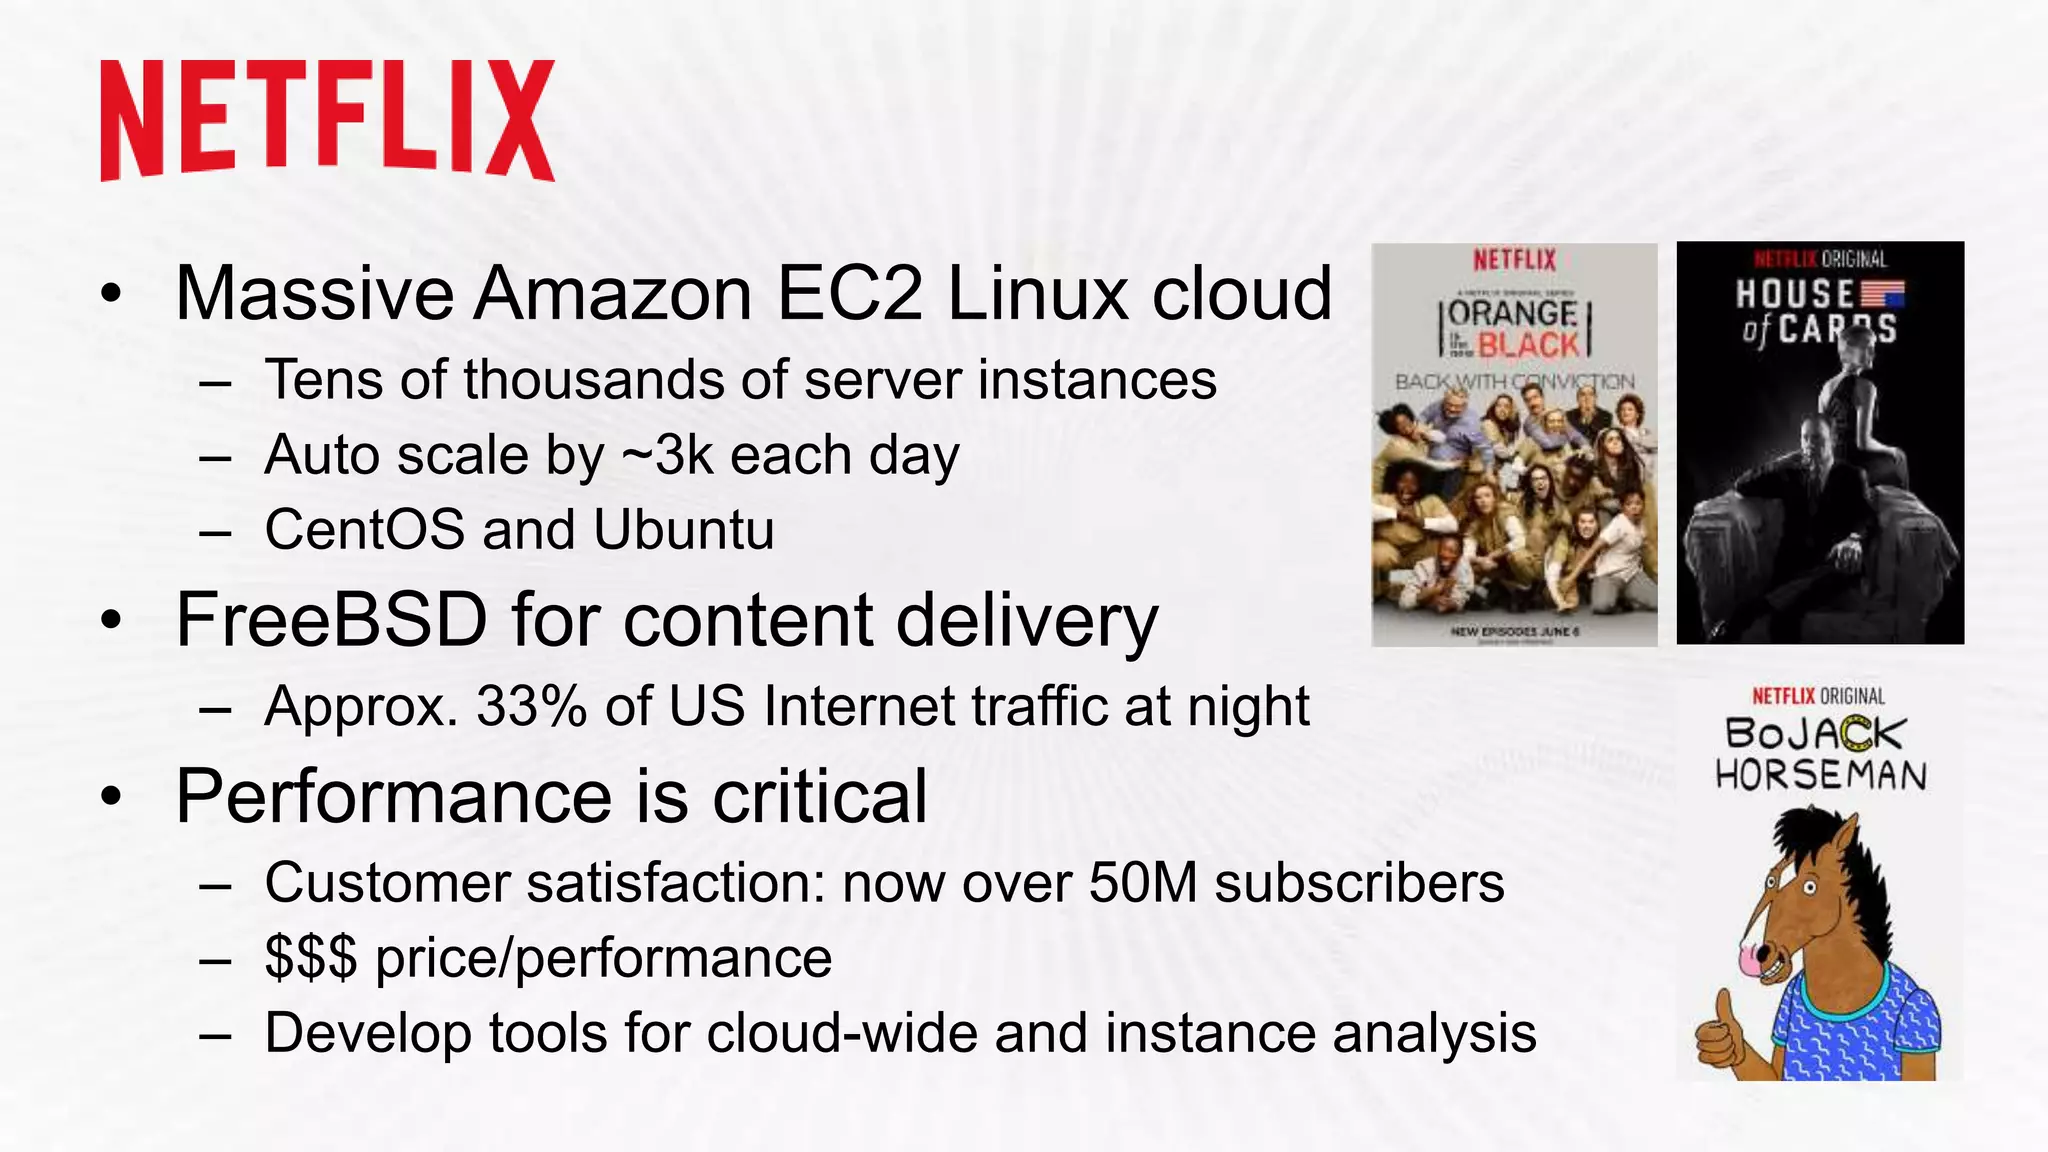
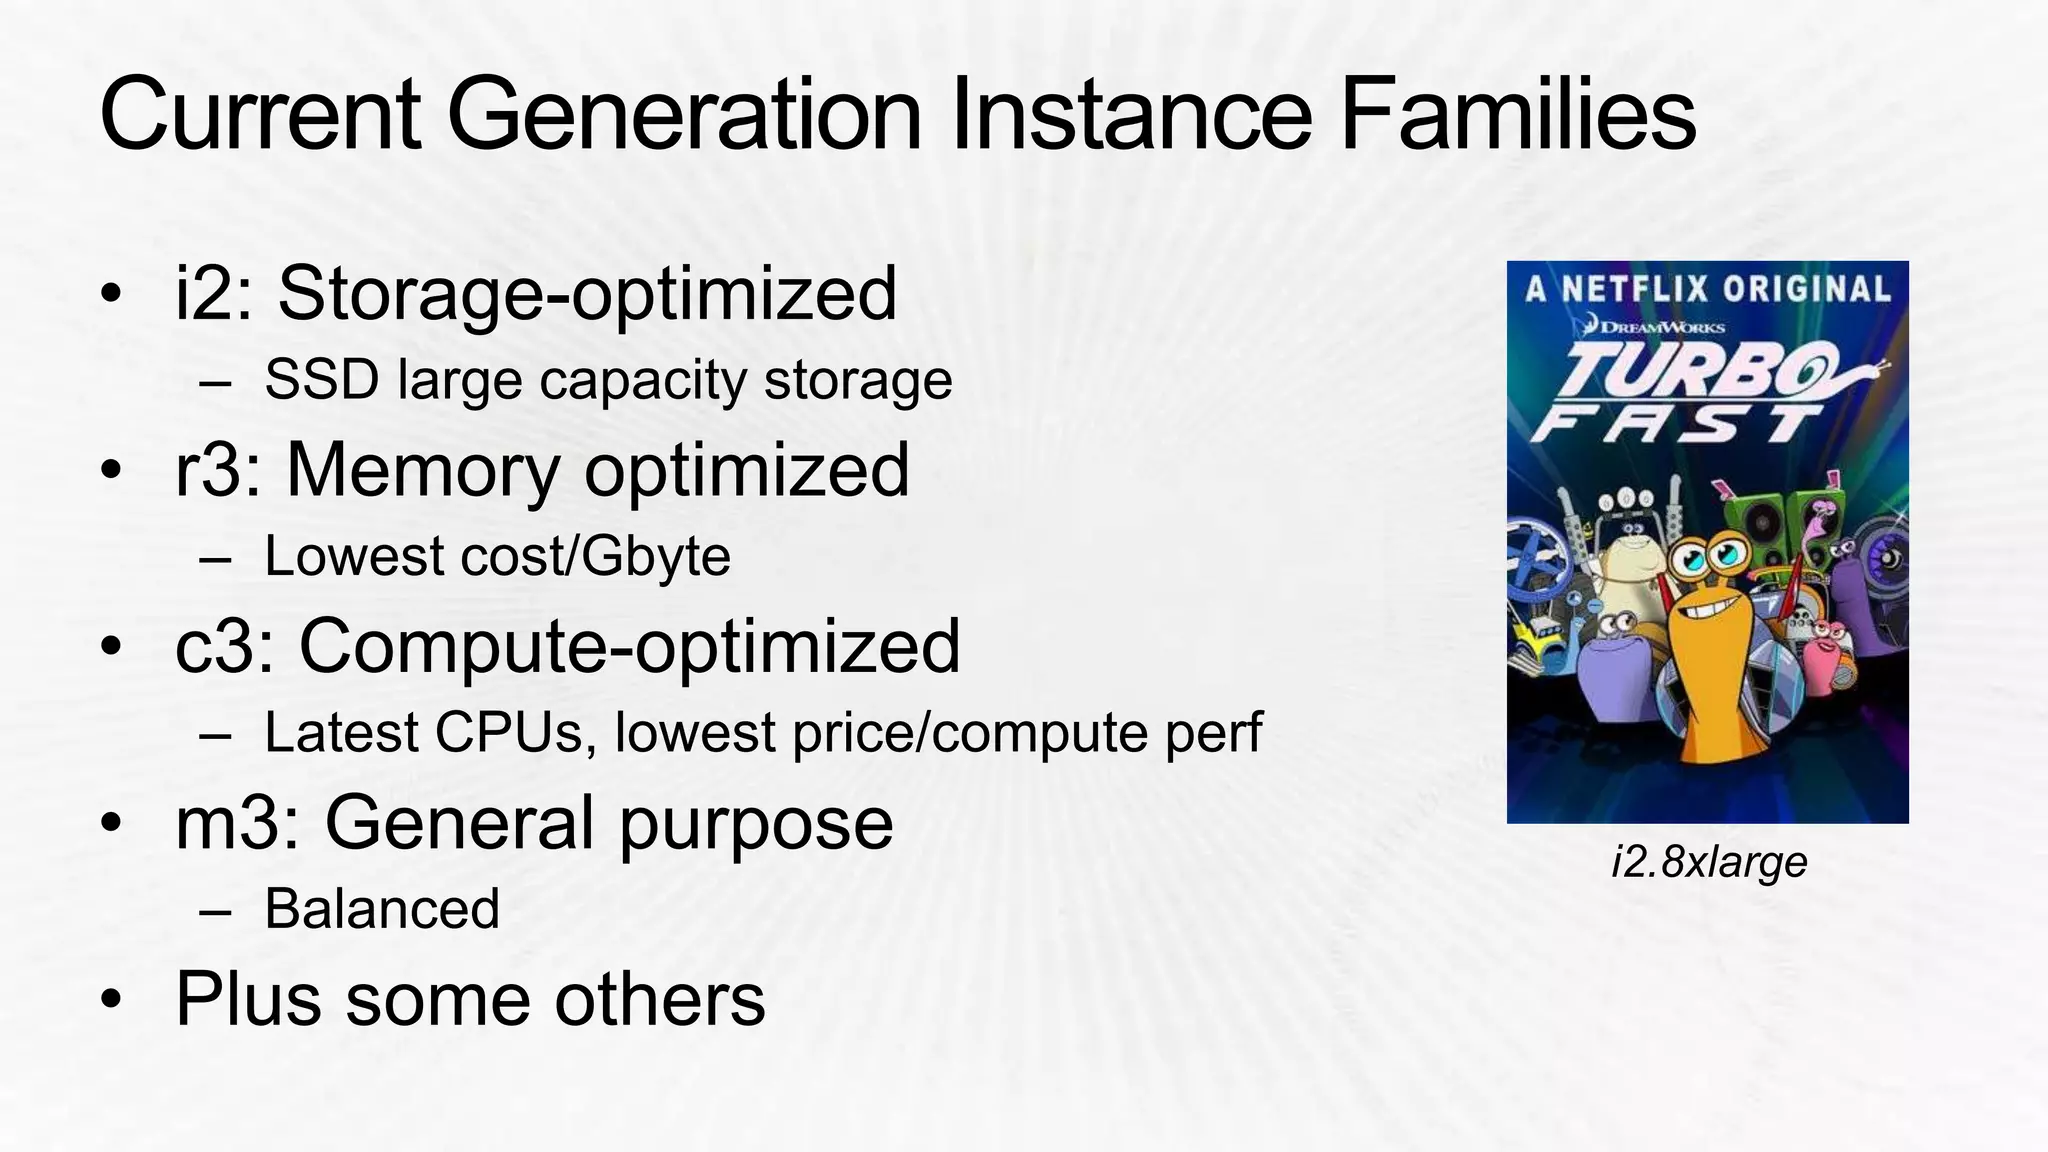
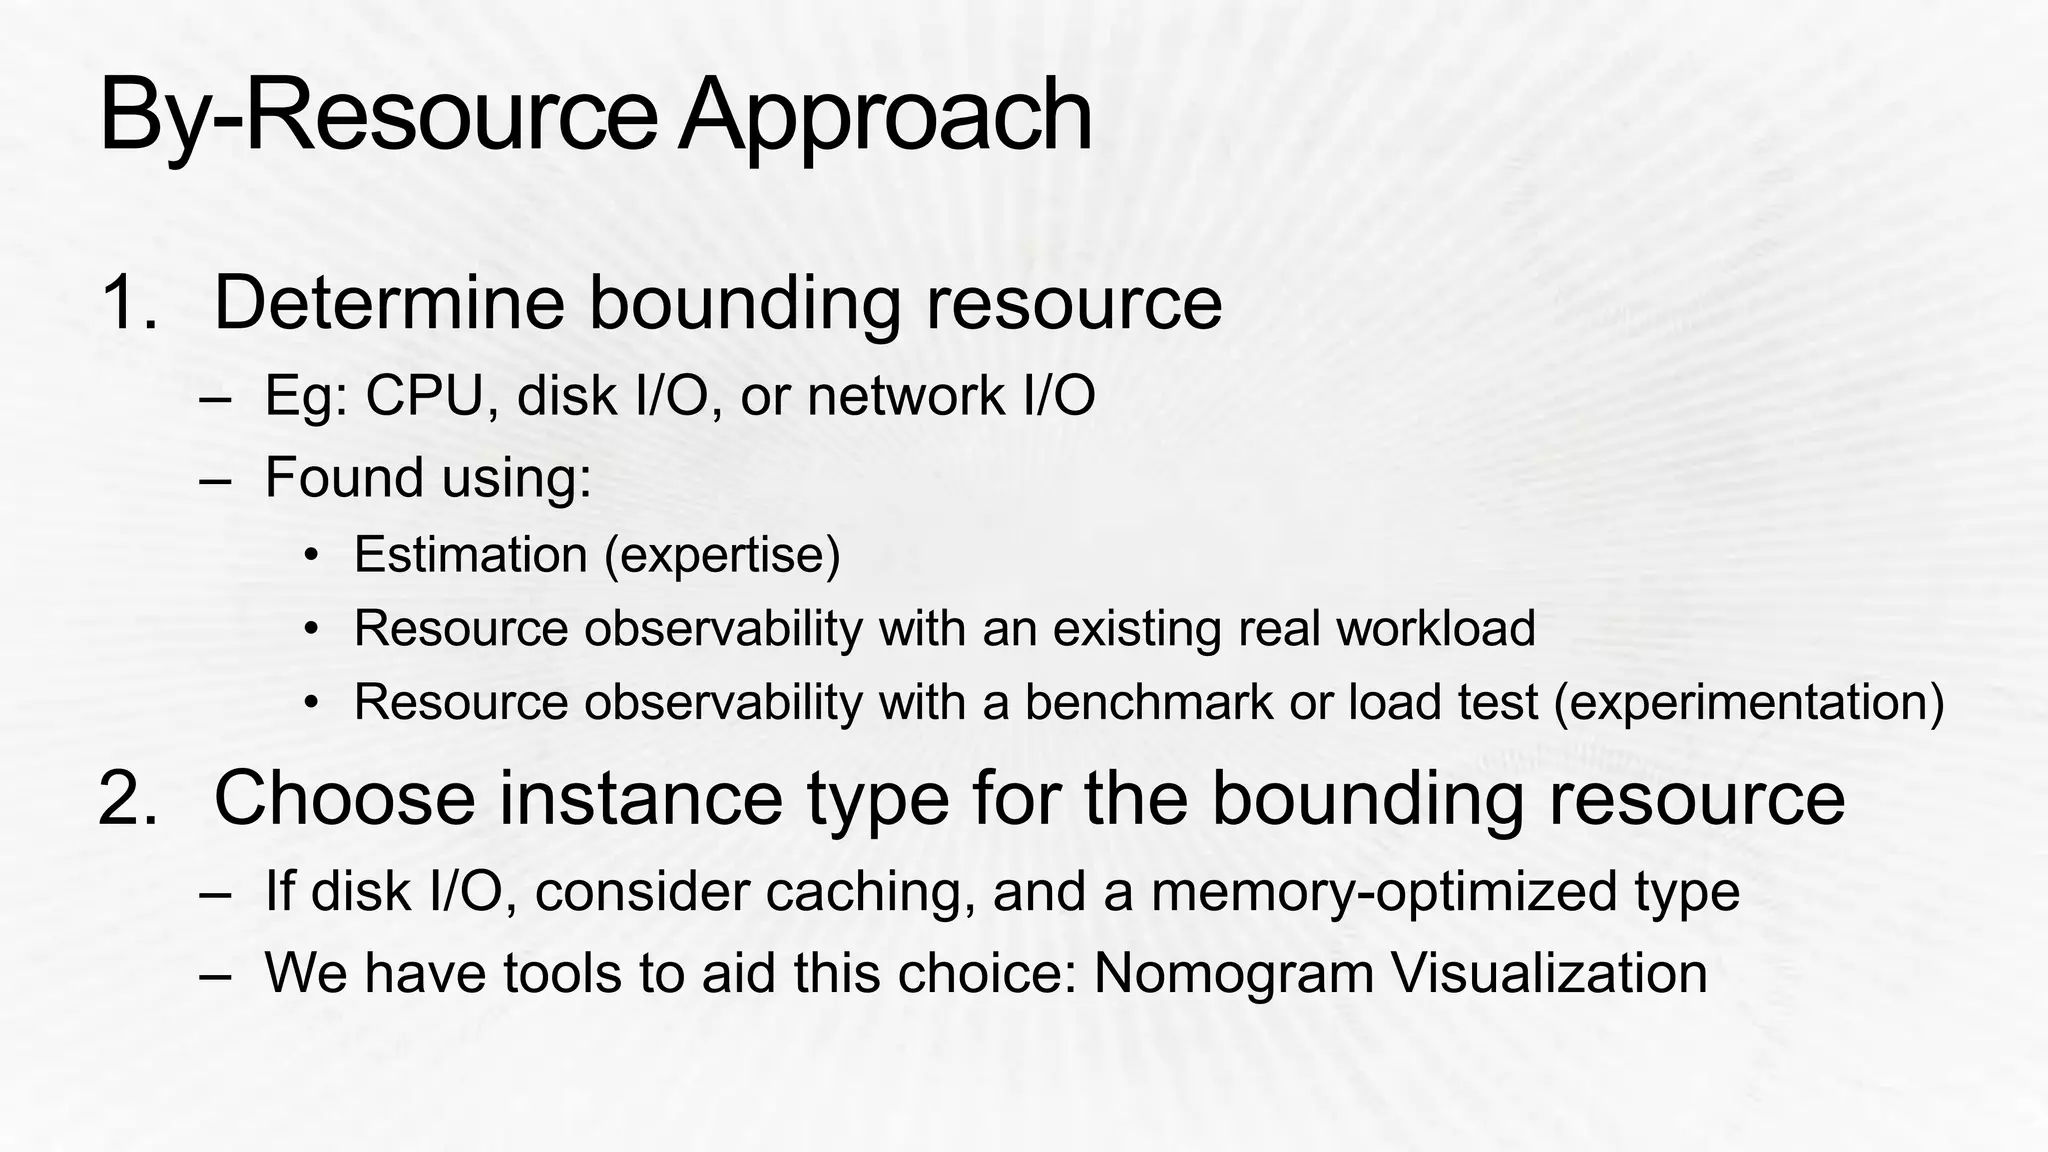
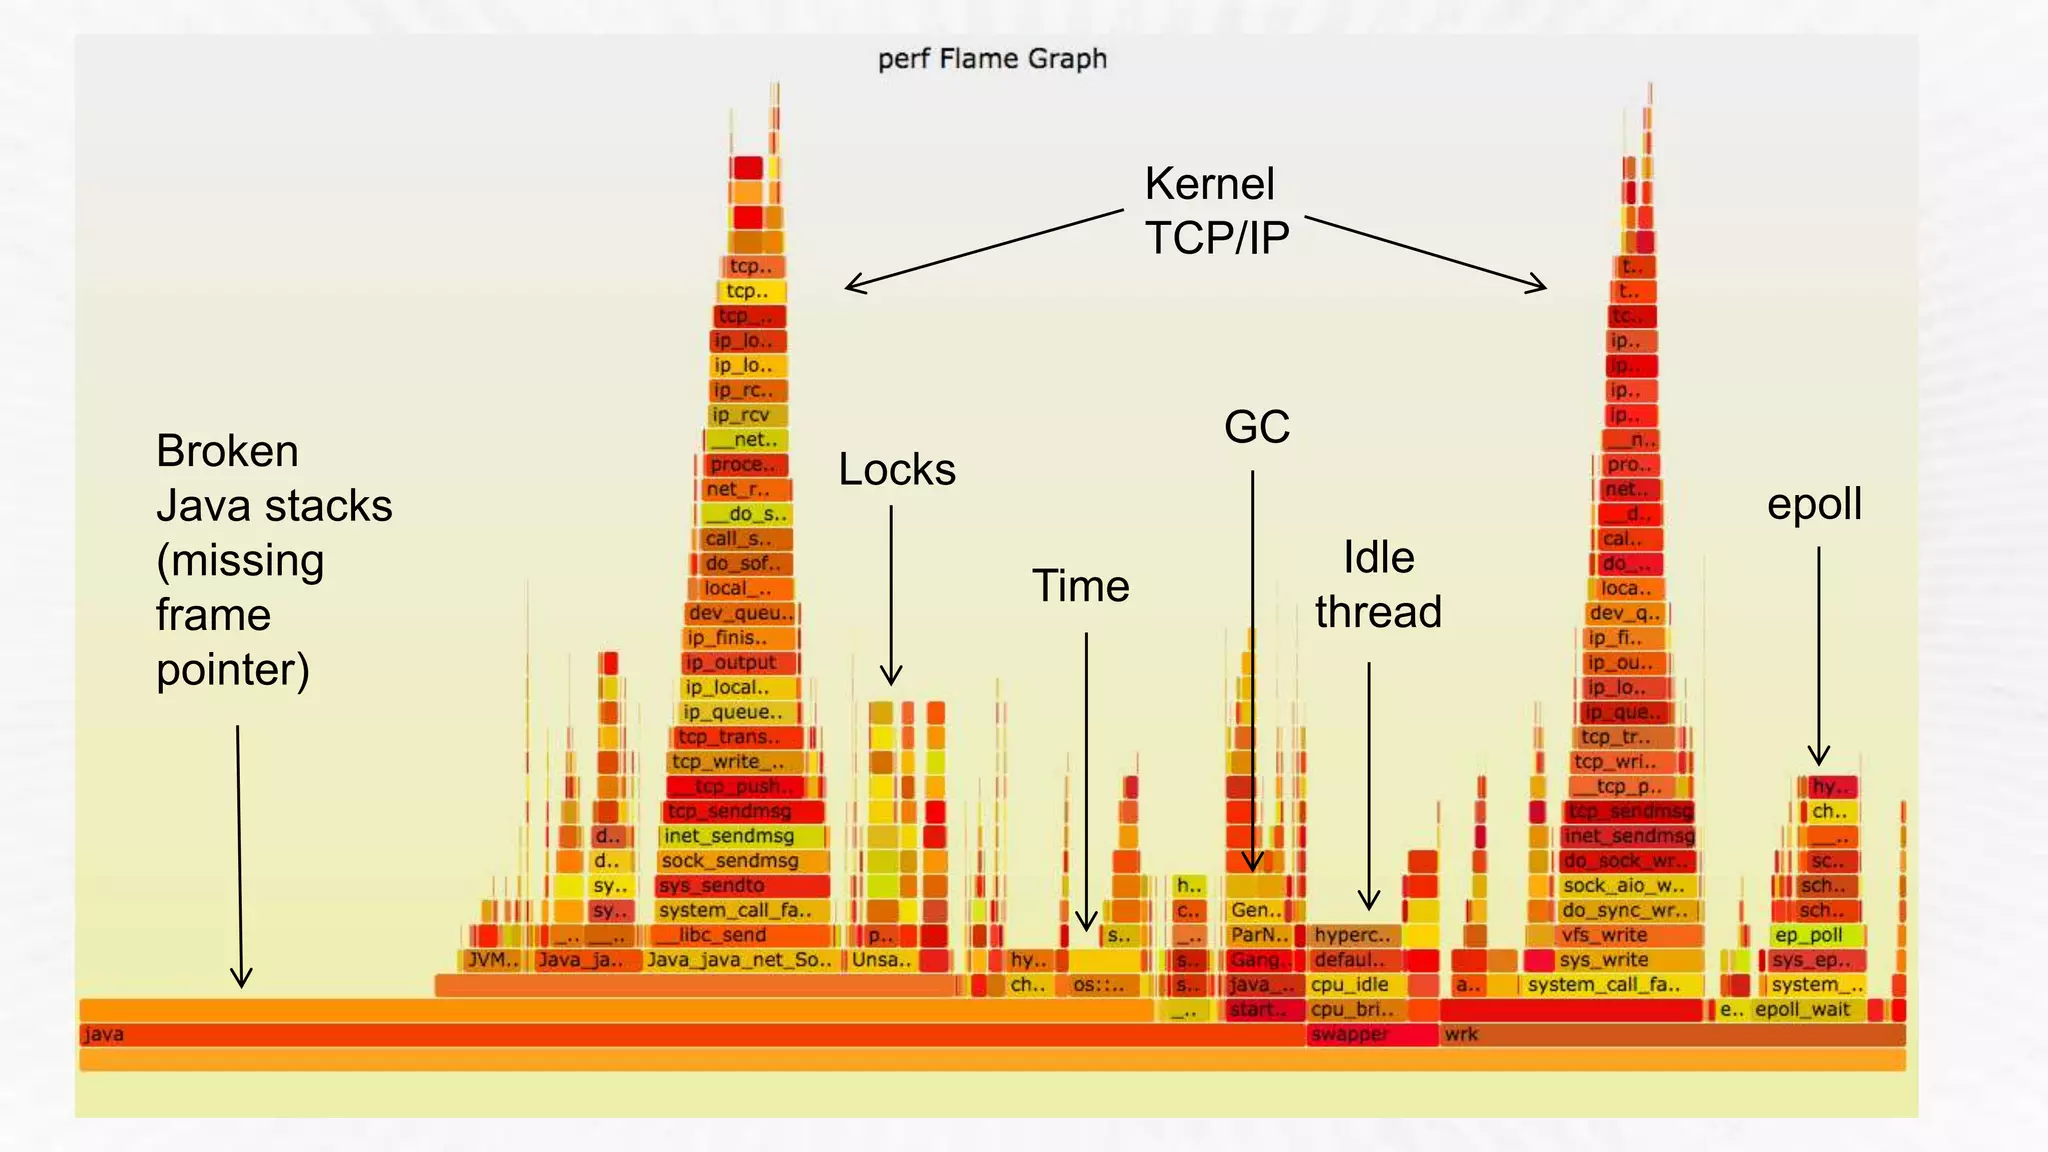
The document outlines a presentation by Brendan Gregg on performance engineering at Netflix, covering various aspects of system optimization and resource management for applications in the cloud. It includes technical details such as configuration settings for Linux systems, performance monitoring tools, and recommendations for tuning EC2 instances. Additionally, it provides links to further resources and related talks scheduled at the event.