Submit Search
Upload
Skole Carbon Benefits Seminar
•
Download as PPT, PDF
•
0 likes
•
215 views
World Agroforestry (ICRAF)
Follow
Technology
Report
Share
Report
Share
1 of 23
Download now
Recommended
050405 Epa Characterization
050405 Epa Characterization
Rudolf Husar
Drones and A.I in Earth Science
Drones and A.I in Earth Science
ARDC
Real Time Semantic Analysis of Streaming Sensor Data
Real Time Semantic Analysis of Streaming Sensor Data
Artificial Intelligence Institute at UofSC
Data Collection via Synthetic Aperture Radiometry towards Global System
Data Collection via Synthetic Aperture Radiometry towards Global System
IJERA Editor
land health surveillance highlights
land health surveillance highlights
World Agroforestry (ICRAF)
Air quality challenges and business opportunities in China: Fusion of environ...
Air quality challenges and business opportunities in China: Fusion of environ...
CLIC Innovation Ltd
USGS
USGS
Brian Pfeiffer
Concept Plan for a GIS-based Fire Monitoring & Prediction System
Concept Plan for a GIS-based Fire Monitoring & Prediction System
GlobalEnvironmentCentre
Smoke Emission Draft
Smoke Emission Draft
Rudolf Husar
2003-10-15 Biomass Smoke Emissions and Transport: Community-based Satellite a...
2003-10-15 Biomass Smoke Emissions and Transport: Community-based Satellite a...
Rudolf Husar
How can drone data be used in modelling?
How can drone data be used in modelling?
ARDC
GI2015 ppt hladikova copernicus_agriculture_forestry_lh
GI2015 ppt hladikova copernicus_agriculture_forestry_lh
IGN Vorstand
Spce technologies for disaster in thailand
Spce technologies for disaster in thailand
Institute of Space Knowledge Development
Australian Ecosystems Science Cloud
Australian Ecosystems Science Cloud
TERN Australia
How to use NCI's national repository of big spatial data collections
How to use NCI's national repository of big spatial data collections
ARDC
Drones in the Earth Sciences - Opportunities and issues
Drones in the Earth Sciences - Opportunities and issues
ARDC
2003-12-02 Environmental Information Systems for Monitoring, Assessment, and ...
2003-12-02 Environmental Information Systems for Monitoring, Assessment, and ...
Rudolf Husar
Rockefeller poster 1 rtu
Rockefeller poster 1 rtu
cenafrica
Hong Liu CanWEA presentation
Hong Liu CanWEA presentation
mtingle
Presentation adv gis 08 01-2014
Presentation adv gis 08 01-2014
Safdar Wattu
Remote sensing
Remote sensing
Anand Choudhary
Remote sensing and gis env bio
Remote sensing and gis env bio
WISDOM WEALTH INTERNATIONAL SCHOOL, TAMILNADU
AusCover Earth Observation Services and Data Cubes
AusCover Earth Observation Services and Data Cubes
TERN Australia
Implementation of RS-EBVs in Habitat Modelling
Implementation of RS-EBVs in Habitat Modelling
plan4all
Study of tropospheric scintillation effects in Ku-band frequency for satellit...
Study of tropospheric scintillation effects in Ku-band frequency for satellit...
IJECEIAES
Geospatial Analysis and Open Data - Forest and Climate
Geospatial Analysis and Open Data - Forest and Climate
Institute of Contemporary Sciences
ACEF: Australian Coastal Ecosystems Facility
ACEF: Australian Coastal Ecosystems Facility
TERN Australia
Hugh Neffendorf: NEED - Non-domestic Energy Efficiency Data Framework
Hugh Neffendorf: NEED - Non-domestic Energy Efficiency Data Framework
AGI Geocommunity
CleanStar Mozambique: A commercial case study of sustainable food and biofuel...
CleanStar Mozambique: A commercial case study of sustainable food and biofuel...
World Agroforestry (ICRAF)
40 Jeff Ehlers Tli Objective2 Phase Ii Work Plan
40 Jeff Ehlers Tli Objective2 Phase Ii Work Plan
World Agroforestry (ICRAF)
More Related Content
What's hot
Smoke Emission Draft
Smoke Emission Draft
Rudolf Husar
2003-10-15 Biomass Smoke Emissions and Transport: Community-based Satellite a...
2003-10-15 Biomass Smoke Emissions and Transport: Community-based Satellite a...
Rudolf Husar
How can drone data be used in modelling?
How can drone data be used in modelling?
ARDC
GI2015 ppt hladikova copernicus_agriculture_forestry_lh
GI2015 ppt hladikova copernicus_agriculture_forestry_lh
IGN Vorstand
Spce technologies for disaster in thailand
Spce technologies for disaster in thailand
Institute of Space Knowledge Development
Australian Ecosystems Science Cloud
Australian Ecosystems Science Cloud
TERN Australia
How to use NCI's national repository of big spatial data collections
How to use NCI's national repository of big spatial data collections
ARDC
Drones in the Earth Sciences - Opportunities and issues
Drones in the Earth Sciences - Opportunities and issues
ARDC
2003-12-02 Environmental Information Systems for Monitoring, Assessment, and ...
2003-12-02 Environmental Information Systems for Monitoring, Assessment, and ...
Rudolf Husar
Rockefeller poster 1 rtu
Rockefeller poster 1 rtu
cenafrica
Hong Liu CanWEA presentation
Hong Liu CanWEA presentation
mtingle
Presentation adv gis 08 01-2014
Presentation adv gis 08 01-2014
Safdar Wattu
Remote sensing
Remote sensing
Anand Choudhary
Remote sensing and gis env bio
Remote sensing and gis env bio
WISDOM WEALTH INTERNATIONAL SCHOOL, TAMILNADU
AusCover Earth Observation Services and Data Cubes
AusCover Earth Observation Services and Data Cubes
TERN Australia
Implementation of RS-EBVs in Habitat Modelling
Implementation of RS-EBVs in Habitat Modelling
plan4all
Study of tropospheric scintillation effects in Ku-band frequency for satellit...
Study of tropospheric scintillation effects in Ku-band frequency for satellit...
IJECEIAES
Geospatial Analysis and Open Data - Forest and Climate
Geospatial Analysis and Open Data - Forest and Climate
Institute of Contemporary Sciences
ACEF: Australian Coastal Ecosystems Facility
ACEF: Australian Coastal Ecosystems Facility
TERN Australia
Hugh Neffendorf: NEED - Non-domestic Energy Efficiency Data Framework
Hugh Neffendorf: NEED - Non-domestic Energy Efficiency Data Framework
AGI Geocommunity
What's hot
(20)
Smoke Emission Draft
Smoke Emission Draft
2003-10-15 Biomass Smoke Emissions and Transport: Community-based Satellite a...
2003-10-15 Biomass Smoke Emissions and Transport: Community-based Satellite a...
How can drone data be used in modelling?
How can drone data be used in modelling?
GI2015 ppt hladikova copernicus_agriculture_forestry_lh
GI2015 ppt hladikova copernicus_agriculture_forestry_lh
Spce technologies for disaster in thailand
Spce technologies for disaster in thailand
Australian Ecosystems Science Cloud
Australian Ecosystems Science Cloud
How to use NCI's national repository of big spatial data collections
How to use NCI's national repository of big spatial data collections
Drones in the Earth Sciences - Opportunities and issues
Drones in the Earth Sciences - Opportunities and issues
2003-12-02 Environmental Information Systems for Monitoring, Assessment, and ...
2003-12-02 Environmental Information Systems for Monitoring, Assessment, and ...
Rockefeller poster 1 rtu
Rockefeller poster 1 rtu
Hong Liu CanWEA presentation
Hong Liu CanWEA presentation
Presentation adv gis 08 01-2014
Presentation adv gis 08 01-2014
Remote sensing
Remote sensing
Remote sensing and gis env bio
Remote sensing and gis env bio
AusCover Earth Observation Services and Data Cubes
AusCover Earth Observation Services and Data Cubes
Implementation of RS-EBVs in Habitat Modelling
Implementation of RS-EBVs in Habitat Modelling
Study of tropospheric scintillation effects in Ku-band frequency for satellit...
Study of tropospheric scintillation effects in Ku-band frequency for satellit...
Geospatial Analysis and Open Data - Forest and Climate
Geospatial Analysis and Open Data - Forest and Climate
ACEF: Australian Coastal Ecosystems Facility
ACEF: Australian Coastal Ecosystems Facility
Hugh Neffendorf: NEED - Non-domestic Energy Efficiency Data Framework
Hugh Neffendorf: NEED - Non-domestic Energy Efficiency Data Framework
Viewers also liked
CleanStar Mozambique: A commercial case study of sustainable food and biofuel...
CleanStar Mozambique: A commercial case study of sustainable food and biofuel...
World Agroforestry (ICRAF)
40 Jeff Ehlers Tli Objective2 Phase Ii Work Plan
40 Jeff Ehlers Tli Objective2 Phase Ii Work Plan
World Agroforestry (ICRAF)
Carbon Benefits4
Carbon Benefits4
World Agroforestry (ICRAF)
Brent Swallow 6th October
Brent Swallow 6th October
World Agroforestry (ICRAF)
Scherr, Scaling Up Carbon Trading In Land Use 3 09
Scherr, Scaling Up Carbon Trading In Land Use 3 09
World Agroforestry (ICRAF)
2 Carmendevicente Tli
2 Carmendevicente Tli
World Agroforestry (ICRAF)
22b E S Monyo Obj 8
22b E S Monyo Obj 8
World Agroforestry (ICRAF)
35 Hailu Tefera Objective7 Work Plan
35 Hailu Tefera Objective7 Work Plan
World Agroforestry (ICRAF)
Carbon Benefits Kds V3 07
Carbon Benefits Kds V3 07
World Agroforestry (ICRAF)
Presentation on drivers of landcover and landuse change in Kenya
Presentation on drivers of landcover and landuse change in Kenya
World Agroforestry (ICRAF)
Viewers also liked
(10)
CleanStar Mozambique: A commercial case study of sustainable food and biofuel...
CleanStar Mozambique: A commercial case study of sustainable food and biofuel...
40 Jeff Ehlers Tli Objective2 Phase Ii Work Plan
40 Jeff Ehlers Tli Objective2 Phase Ii Work Plan
Carbon Benefits4
Carbon Benefits4
Brent Swallow 6th October
Brent Swallow 6th October
Scherr, Scaling Up Carbon Trading In Land Use 3 09
Scherr, Scaling Up Carbon Trading In Land Use 3 09
2 Carmendevicente Tli
2 Carmendevicente Tli
22b E S Monyo Obj 8
22b E S Monyo Obj 8
35 Hailu Tefera Objective7 Work Plan
35 Hailu Tefera Objective7 Work Plan
Carbon Benefits Kds V3 07
Carbon Benefits Kds V3 07
Presentation on drivers of landcover and landuse change in Kenya
Presentation on drivers of landcover and landuse change in Kenya
Similar to Skole Carbon Benefits Seminar
The potential use of theos satellite image for land use survey
The potential use of theos satellite image for land use survey
Institute of Space Knowledge Development
Remotesensing 11-00164
Remotesensing 11-00164
Erdenetsogt Su
Overview of hyperspectral remote sensing of impervious surfaces
Overview of hyperspectral remote sensing of impervious surfaces
zhengspace
Land Use/Land Cover Mapping Of Allahabad City by Using Remote Sensing & GIS
Land Use/Land Cover Mapping Of Allahabad City by Using Remote Sensing & GIS
IJMER
Isprsarchives xl-7-w3-897-2015
Isprsarchives xl-7-w3-897-2015
bayrmgl
Forest monitoring through remote sensing
Forest monitoring through remote sensing
Pritam Kumar Barman
Recent developments in the availability and delivery of biogeochemical datase...
Recent developments in the availability and delivery of biogeochemical datase...
TERN Australia
Viewpaper
Viewpaper
buianhthuan
7 srtm paleochannels_aeromagnetics data
7 srtm paleochannels_aeromagnetics data
IUMA MARTINEZ
Wireless Sensor Networks and Drones for Measuring Forest Photosynthetic Bioph...
Wireless Sensor Networks and Drones for Measuring Forest Photosynthetic Bioph...
Cassidy Rankine
Separability Analysis of Integrated Spaceborne Radar and Optical Data: Sudan ...
Separability Analysis of Integrated Spaceborne Radar and Optical Data: Sudan ...
rsmahabir
Summary of DART Electromagnetic Methodology 100111
Summary of DART Electromagnetic Methodology 100111
DART Project
Hyperparameters analysis of long short-term memory architecture for crop cla...
Hyperparameters analysis of long short-term memory architecture for crop cla...
IJECEIAES
Application of web ontology to harvest estimation of rice in Thailand
Application of web ontology to harvest estimation of rice in Thailand
AIMS (Agricultural Information Management Standards)
Application of web ontology to harvest estimation of rice in thailand
Application of web ontology to harvest estimation of rice in thailand
AIMS (Agricultural Information Management Standards)
CHANGE DETECTION TECHNIQUES - A SUR V EY
CHANGE DETECTION TECHNIQUES - A SUR V EY
ijcsa
MODULE VII_ Remote Sensing_Avantika.pptx
MODULE VII_ Remote Sensing_Avantika.pptx
avantikaadhruj1
IRJET-Mapping of Mineral Zones using the Spectral Feature Fitting Method in J...
IRJET-Mapping of Mineral Zones using the Spectral Feature Fitting Method in J...
IRJET Journal
Radar and optical remote sensing data evaluation and fusion; a case study for...
Radar and optical remote sensing data evaluation and fusion; a case study for...
rsmahabir
Multiple Crop Classification Using Various Support Vector Machine Kernel Func...
Multiple Crop Classification Using Various Support Vector Machine Kernel Func...
IJERA Editor
Similar to Skole Carbon Benefits Seminar
(20)
The potential use of theos satellite image for land use survey
The potential use of theos satellite image for land use survey
Remotesensing 11-00164
Remotesensing 11-00164
Overview of hyperspectral remote sensing of impervious surfaces
Overview of hyperspectral remote sensing of impervious surfaces
Land Use/Land Cover Mapping Of Allahabad City by Using Remote Sensing & GIS
Land Use/Land Cover Mapping Of Allahabad City by Using Remote Sensing & GIS
Isprsarchives xl-7-w3-897-2015
Isprsarchives xl-7-w3-897-2015
Forest monitoring through remote sensing
Forest monitoring through remote sensing
Recent developments in the availability and delivery of biogeochemical datase...
Recent developments in the availability and delivery of biogeochemical datase...
Viewpaper
Viewpaper
7 srtm paleochannels_aeromagnetics data
7 srtm paleochannels_aeromagnetics data
Wireless Sensor Networks and Drones for Measuring Forest Photosynthetic Bioph...
Wireless Sensor Networks and Drones for Measuring Forest Photosynthetic Bioph...
Separability Analysis of Integrated Spaceborne Radar and Optical Data: Sudan ...
Separability Analysis of Integrated Spaceborne Radar and Optical Data: Sudan ...
Summary of DART Electromagnetic Methodology 100111
Summary of DART Electromagnetic Methodology 100111
Hyperparameters analysis of long short-term memory architecture for crop cla...
Hyperparameters analysis of long short-term memory architecture for crop cla...
Application of web ontology to harvest estimation of rice in Thailand
Application of web ontology to harvest estimation of rice in Thailand
Application of web ontology to harvest estimation of rice in thailand
Application of web ontology to harvest estimation of rice in thailand
CHANGE DETECTION TECHNIQUES - A SUR V EY
CHANGE DETECTION TECHNIQUES - A SUR V EY
MODULE VII_ Remote Sensing_Avantika.pptx
MODULE VII_ Remote Sensing_Avantika.pptx
IRJET-Mapping of Mineral Zones using the Spectral Feature Fitting Method in J...
IRJET-Mapping of Mineral Zones using the Spectral Feature Fitting Method in J...
Radar and optical remote sensing data evaluation and fusion; a case study for...
Radar and optical remote sensing data evaluation and fusion; a case study for...
Multiple Crop Classification Using Various Support Vector Machine Kernel Func...
Multiple Crop Classification Using Various Support Vector Machine Kernel Func...
More from World Agroforestry (ICRAF)
Resilience of rubber based agroforestry facing global change
Resilience of rubber based agroforestry facing global change
World Agroforestry (ICRAF)
DryDev Closeout Webinar 30th June 2020
DryDev Closeout Webinar 30th June 2020
World Agroforestry (ICRAF)
Farmland Biodiversity
Farmland Biodiversity
World Agroforestry (ICRAF)
How can we overcome obstacles and mobilize investments for successful, sustai...
How can we overcome obstacles and mobilize investments for successful, sustai...
World Agroforestry (ICRAF)
Forest and agroforesty options for building resilience in refugee situations:...
Forest and agroforesty options for building resilience in refugee situations:...
World Agroforestry (ICRAF)
How local application of agroecological principles can transform food systems
How local application of agroecological principles can transform food systems
World Agroforestry (ICRAF)
Agroforestry systems for restoration in Brazil: reconciling social and ecolo...
Agroforestry systems for restoration in Brazil: reconciling social and ecolo...
World Agroforestry (ICRAF)
Vulnerabilities of forests and forest dependent people
Vulnerabilities of forests and forest dependent people
World Agroforestry (ICRAF)
Pests and diseases of trees in Africa: review of a growing emergency
Pests and diseases of trees in Africa: review of a growing emergency
World Agroforestry (ICRAF)
Wall posters on habitat distribution of nine tree species in Ethiopia
Wall posters on habitat distribution of nine tree species in Ethiopia
World Agroforestry (ICRAF)
Not all roads lead to Rome: Inclusive business models and responsible finance...
Not all roads lead to Rome: Inclusive business models and responsible finance...
World Agroforestry (ICRAF)
Decent work and economic growth: Potential impacts of SDG 8 on forests and fo...
Decent work and economic growth: Potential impacts of SDG 8 on forests and fo...
World Agroforestry (ICRAF)
Forest conservation and socio-economic benefits through community forest conc...
Forest conservation and socio-economic benefits through community forest conc...
World Agroforestry (ICRAF)
Sustainable land management for improved livelihoods and environmental sustai...
Sustainable land management for improved livelihoods and environmental sustai...
World Agroforestry (ICRAF)
Rangeland Management in Africa Research and case studies
Rangeland Management in Africa Research and case studies
World Agroforestry (ICRAF)
Sustainable transition of shifting cultivation systems for land degradation n...
Sustainable transition of shifting cultivation systems for land degradation n...
World Agroforestry (ICRAF)
Understanding farmer behavior and options to improve outcomes
Understanding farmer behavior and options to improve outcomes
World Agroforestry (ICRAF)
Scaling watershed development in India
Scaling watershed development in India
World Agroforestry (ICRAF)
NRM Innovations for Risk Management and Agricultural Transformation in Semiar...
NRM Innovations for Risk Management and Agricultural Transformation in Semiar...
World Agroforestry (ICRAF)
Combining land restoration and livelihoods - examples from Niger
Combining land restoration and livelihoods - examples from Niger
World Agroforestry (ICRAF)
More from World Agroforestry (ICRAF)
(20)
Resilience of rubber based agroforestry facing global change
Resilience of rubber based agroforestry facing global change
DryDev Closeout Webinar 30th June 2020
DryDev Closeout Webinar 30th June 2020
Farmland Biodiversity
Farmland Biodiversity
How can we overcome obstacles and mobilize investments for successful, sustai...
How can we overcome obstacles and mobilize investments for successful, sustai...
Forest and agroforesty options for building resilience in refugee situations:...
Forest and agroforesty options for building resilience in refugee situations:...
How local application of agroecological principles can transform food systems
How local application of agroecological principles can transform food systems
Agroforestry systems for restoration in Brazil: reconciling social and ecolo...
Agroforestry systems for restoration in Brazil: reconciling social and ecolo...
Vulnerabilities of forests and forest dependent people
Vulnerabilities of forests and forest dependent people
Pests and diseases of trees in Africa: review of a growing emergency
Pests and diseases of trees in Africa: review of a growing emergency
Wall posters on habitat distribution of nine tree species in Ethiopia
Wall posters on habitat distribution of nine tree species in Ethiopia
Not all roads lead to Rome: Inclusive business models and responsible finance...
Not all roads lead to Rome: Inclusive business models and responsible finance...
Decent work and economic growth: Potential impacts of SDG 8 on forests and fo...
Decent work and economic growth: Potential impacts of SDG 8 on forests and fo...
Forest conservation and socio-economic benefits through community forest conc...
Forest conservation and socio-economic benefits through community forest conc...
Sustainable land management for improved livelihoods and environmental sustai...
Sustainable land management for improved livelihoods and environmental sustai...
Rangeland Management in Africa Research and case studies
Rangeland Management in Africa Research and case studies
Sustainable transition of shifting cultivation systems for land degradation n...
Sustainable transition of shifting cultivation systems for land degradation n...
Understanding farmer behavior and options to improve outcomes
Understanding farmer behavior and options to improve outcomes
Scaling watershed development in India
Scaling watershed development in India
NRM Innovations for Risk Management and Agricultural Transformation in Semiar...
NRM Innovations for Risk Management and Agricultural Transformation in Semiar...
Combining land restoration and livelihoods - examples from Niger
Combining land restoration and livelihoods - examples from Niger
Recently uploaded
Strategize a Smooth Tenant-to-tenant Migration and Copilot Takeoff
Strategize a Smooth Tenant-to-tenant Migration and Copilot Takeoff
sammart93
Apidays New York 2024 - APIs in 2030: The Risk of Technological Sleepwalk by ...
Apidays New York 2024 - APIs in 2030: The Risk of Technological Sleepwalk by ...
apidays
WSO2's API Vision: Unifying Control, Empowering Developers
WSO2's API Vision: Unifying Control, Empowering Developers
WSO2
Architecting Cloud Native Applications
Architecting Cloud Native Applications
WSO2
Corporate and higher education May webinar.pptx
Corporate and higher education May webinar.pptx
Rustici Software
Polkadot JAM Slides - Token2049 - By Dr. Gavin Wood
Polkadot JAM Slides - Token2049 - By Dr. Gavin Wood
Juan lago vázquez
Mcleodganj Call Girls 🥰 8617370543 Service Offer VIP Hot Model
Mcleodganj Call Girls 🥰 8617370543 Service Offer VIP Hot Model
Deepika Singh
+971581248768>> SAFE AND ORIGINAL ABORTION PILLS FOR SALE IN DUBAI AND ABUDHA...
+971581248768>> SAFE AND ORIGINAL ABORTION PILLS FOR SALE IN DUBAI AND ABUDHA...
?#DUbAI#??##{{(☎️+971_581248768%)**%*]'#abortion pills for sale in dubai@
Exploring Multimodal Embeddings with Milvus
Exploring Multimodal Embeddings with Milvus
Zilliz
ProductAnonymous-April2024-WinProductDiscovery-MelissaKlemke
ProductAnonymous-April2024-WinProductDiscovery-MelissaKlemke
Product Anonymous
[BuildWithAI] Introduction to Gemini.pdf
[BuildWithAI] Introduction to Gemini.pdf
Sandro Moreira
Six Myths about Ontologies: The Basics of Formal Ontology
Six Myths about Ontologies: The Basics of Formal Ontology
johnbeverley2021
AWS Community Day CPH - Three problems of Terraform
AWS Community Day CPH - Three problems of Terraform
Andrey Devyatkin
Apidays New York 2024 - The value of a flexible API Management solution for O...
Apidays New York 2024 - The value of a flexible API Management solution for O...
apidays
Vector Search -An Introduction in Oracle Database 23ai.pptx
Vector Search -An Introduction in Oracle Database 23ai.pptx
Remote DBA Services
Understanding the FAA Part 107 License ..
Understanding the FAA Part 107 License ..
Christopher Logan Kennedy
Connector Corner: Accelerate revenue generation using UiPath API-centric busi...
Connector Corner: Accelerate revenue generation using UiPath API-centric busi...
DianaGray10
Navigating the Deluge_ Dubai Floods and the Resilience of Dubai International...
Navigating the Deluge_ Dubai Floods and the Resilience of Dubai International...
Orbitshub
Boost Fertility New Invention Ups Success Rates.pdf
Boost Fertility New Invention Ups Success Rates.pdf
sudhanshuwaghmare1
Modular Monolith - a Practical Alternative to Microservices @ Devoxx UK 2024
Modular Monolith - a Practical Alternative to Microservices @ Devoxx UK 2024
Victor Rentea
Recently uploaded
(20)
Strategize a Smooth Tenant-to-tenant Migration and Copilot Takeoff
Strategize a Smooth Tenant-to-tenant Migration and Copilot Takeoff
Apidays New York 2024 - APIs in 2030: The Risk of Technological Sleepwalk by ...
Apidays New York 2024 - APIs in 2030: The Risk of Technological Sleepwalk by ...
WSO2's API Vision: Unifying Control, Empowering Developers
WSO2's API Vision: Unifying Control, Empowering Developers
Architecting Cloud Native Applications
Architecting Cloud Native Applications
Corporate and higher education May webinar.pptx
Corporate and higher education May webinar.pptx
Polkadot JAM Slides - Token2049 - By Dr. Gavin Wood
Polkadot JAM Slides - Token2049 - By Dr. Gavin Wood
Mcleodganj Call Girls 🥰 8617370543 Service Offer VIP Hot Model
Mcleodganj Call Girls 🥰 8617370543 Service Offer VIP Hot Model
+971581248768>> SAFE AND ORIGINAL ABORTION PILLS FOR SALE IN DUBAI AND ABUDHA...
+971581248768>> SAFE AND ORIGINAL ABORTION PILLS FOR SALE IN DUBAI AND ABUDHA...
Exploring Multimodal Embeddings with Milvus
Exploring Multimodal Embeddings with Milvus
ProductAnonymous-April2024-WinProductDiscovery-MelissaKlemke
ProductAnonymous-April2024-WinProductDiscovery-MelissaKlemke
[BuildWithAI] Introduction to Gemini.pdf
[BuildWithAI] Introduction to Gemini.pdf
Six Myths about Ontologies: The Basics of Formal Ontology
Six Myths about Ontologies: The Basics of Formal Ontology
AWS Community Day CPH - Three problems of Terraform
AWS Community Day CPH - Three problems of Terraform
Apidays New York 2024 - The value of a flexible API Management solution for O...
Apidays New York 2024 - The value of a flexible API Management solution for O...
Vector Search -An Introduction in Oracle Database 23ai.pptx
Vector Search -An Introduction in Oracle Database 23ai.pptx
Understanding the FAA Part 107 License ..
Understanding the FAA Part 107 License ..
Connector Corner: Accelerate revenue generation using UiPath API-centric busi...
Connector Corner: Accelerate revenue generation using UiPath API-centric busi...
Navigating the Deluge_ Dubai Floods and the Resilience of Dubai International...
Navigating the Deluge_ Dubai Floods and the Resilience of Dubai International...
Boost Fertility New Invention Ups Success Rates.pdf
Boost Fertility New Invention Ups Success Rates.pdf
Modular Monolith - a Practical Alternative to Microservices @ Devoxx UK 2024
Modular Monolith - a Practical Alternative to Microservices @ Devoxx UK 2024
Skole Carbon Benefits Seminar
1.
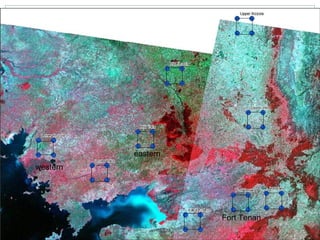
eastern western Fort
Tenan
2.
Eastern Sites
3.
4.
5.
Western Sites
6.
7.
8.
9.
WWW Ground measures
Local communities Remote measures Satellite – ground integration Analysis GEF (markets) TRFIC Technologies Carbon2Markets tools
10.
11.
12.
Biophysical measurements Forest
density and type mapping in Thailand
13.
Leaf Area Index
can be used as an Input to NPP-Carbon models
14.
Hyper-rez tree crown
detection
15.
Detailed View ETM+
(4,3,2)
16.
Detailed view VCF
30m
17.
Region east of
Kingaroy, north of Nanango
18.
Zoom in at
high resolution
19.
Region east of
Kingaroy, north of Nanango. Small blue dots are waypopints. White is non forest/trees. Carbon sequestration range: 4-8 tCO2e per ha per yr (light to dark)
20.
21.
22.
23.
Download now