Downloaded 33 times


![18
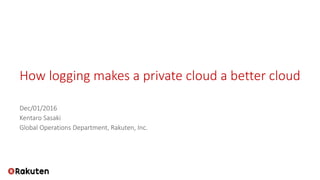
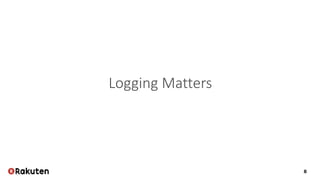
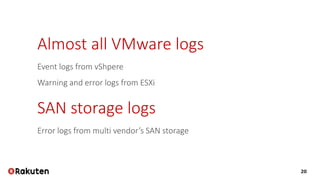
Huge Number of log files
22 log files in a single cluster
Manage logs for every Regions & Availability Zones
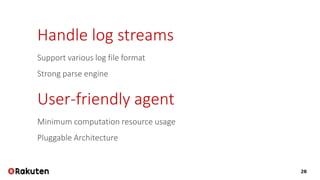
Manage un-manageable logs
CRITICAL message is un-manageable
Need to have strong analytical storage engine
Component # Log files
Nova 8
Keystone 1
Neutron 6
Glance 2
Cinder 5
etc. etc.
2013-02-25 21:05:51 17409 CRITICAL cinder [-
] Bad or unexpected response from the
storage volume backend API: volume group
cinder-volumes doesn't exist
...
2013-02-25 21:05:51 17409 TRACE cinder
VolumeBackendAPIException: Bad or unexpected
response from the storage volume
backend API: volume group cinder-volumes
doesn't exist
2013-02-25 21:05:51 17409 TRACE cinder](https://image.slidesharecdn.com/openstack-seminar-20161201-kentarosasaki-2-161129033648/85/How-logging-makes-a-private-cloud-a-better-cloud-OpenStack-2016-12-18-320.jpg)


![33
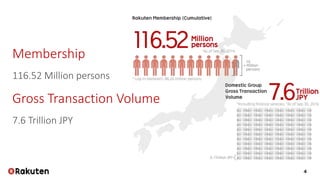
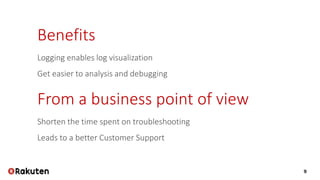
#!/usr/bin/env python
import json, libvirt
conn = libvirt.openReadOnly()
for id in conn.listDomainsID():
dom = conn.lookupByID(id)
print(json.dumps({
"uuid": dom.UUIDString(),
"name": dom.name(),
"id": dom.ID(),
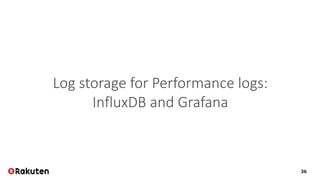
"vcpus":dom.vcpus()[0][3],
}))
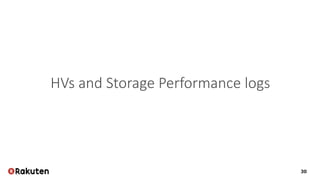
From KVM (OpenStack)
Use libvirt Python bindings to build the custom scripts
Generate json data and use in_tail plugin
From ESXi (VMware)
Get logs from vCenter](https://image.slidesharecdn.com/openstack-seminar-20161201-kentarosasaki-2-161129033648/85/How-logging-makes-a-private-cloud-a-better-cloud-OpenStack-2016-12-33-320.jpg)


Rakuten's logging infrastructure enhances its private cloud by enabling efficient log visualization and analysis, thereby improving troubleshooting and customer support. The use of tools like Splunk for event logs and InfluxDB for performance logs meets their operational requirements. This setup ensures high availability, data redundancy, and minimizes data loss while managing a vast amount of log data.

![[OpenStack 하반기 스터디] DPDK & OpenStack why?](https://cdn.slidesharecdn.com/ss_thumbnails/openstackteam3openstack-study-team3ver2description-151221120401-thumbnail.jpg?width=640&height=640&fit=bounds)
![[OpenStack Day in Korea 2015] Track 1-4 - VDI OpenStack? It Works!!!](https://cdn.slidesharecdn.com/ss_thumbnails/14-150213044503-conversion-gate02-thumbnail.jpg?width=640&height=640&fit=bounds)

![[OpenStack Day in Korea 2015] Track 1-6 - 갈라파고스의 이구아나, 인프라에 오픈소스를 올리다. 그래서 보이...](https://cdn.slidesharecdn.com/ss_thumbnails/16-150213044916-conversion-gate02-thumbnail.jpg?width=640&height=640&fit=bounds)

![[OpenStack Day in Korea 2015] Track 3-6 - Archiectural Overview of the Open S...](https://cdn.slidesharecdn.com/ss_thumbnails/36-150213070342-conversion-gate02-thumbnail.jpg?width=640&height=640&fit=bounds)

![[OpenStack Days Korea 2016] Track1 - All flash CEPH 구성 및 최적화](https://cdn.slidesharecdn.com/ss_thumbnails/12skt-160226171513-thumbnail.jpg?width=640&height=640&fit=bounds)


![[OpenStack 하반기 스터디] HA using DVR](https://cdn.slidesharecdn.com/ss_thumbnails/openstackteam2dvr20151214-151221115503-thumbnail.jpg?width=640&height=640&fit=bounds)


![[OpenStack Days Korea 2016] Track1 - Mellanox CloudX - Acceleration for Cloud...](https://cdn.slidesharecdn.com/ss_thumbnails/14mellanox-160226171740-thumbnail.jpg?width=640&height=640&fit=bounds)

![[OpenStack Day in Korea 2015] Track 3-4 - Software Defined Storage (SDS) and ...](https://cdn.slidesharecdn.com/ss_thumbnails/34-150213070106-conversion-gate02-thumbnail.jpg?width=640&height=640&fit=bounds)


