SlideShare a Scribd company logo
1 of 16
1 | P a g e 
Geo12_India_9_Planning and Sustainable Development in Indian Context 
Population is the pivotal element in social studies. 
 The census of India provides us with information regarding the population of our country. 
POPULATION SIZE AND DISTRIBUTION 
 India’s Population Distribution by Density 
Census 
 A census is an official enumeration of population done periodically. In India the first census 
was held in the year 1872. The first complete census however was taken in the year 1881. 
Since then censuses have been held regularly every tenth year. The Indian Census is the 
most comprehensive source of demographic, social and economic data 
 Almost half of India’s population lives in just five states. These are Uttar Pradesh, 
Maharashtra, Bihar, West Bengal, and Andhra Pradesh. Rajasthan, the biggest state in terms 
of area, has only 5.5 per cent of the total population of India 
 Population density provides a better picture of the uneven distribution. Population density is 
calculated as the number of persons per unit area. 
 Only Bangladesh and Japan have higher average population densities than India. 
 The Northern Plains and Kerala in the south have high to very high population densities 
because of the flat plains with fertile soils and abundant rainfall. 
NCERT_India Human Geograpahy
2 | P a g e 
POPULATION GROWTH AND PROCESSES OF POPULATION CHANGE 
 This is the influence of the interaction of the three processes, namely-births, deaths and 
migrations 
Population Growth 
Such a change can be expressed in two ways: in terms of absolute numbers and in terms of 
percentage change per year 
 The absolute numbers added each year or decade is the magnitude of increase. It is 
obtained by simply subtracting the earlier population (e.g. that of 1991) from the later 
population (e.g. that of 2001). It is referred to as the absolute increase. 
 The rate or the pace of population increase is the other important aspect. It is studied in per 
cent per annum, e.g. a rate of increase of 2 per cent per annum means that in a given year, 
there was an increase of two persons for every 100 persons in the base population. This is 
referred to as the annual growth rate. 
India’s population has been steadily increasing from 361 million in 1951 to 1028 million in 2001 
 During this period, birth rates declined rapidly. Still 182 million people were added to the 
total population in the 1990s alone (an annual addition larger than ever before). 
 India may overtake China in 2045 to become the most populous country in the world. 
Processes of Population Change/Growth 
There are three main processes of change of population: birth rates, death rates and migration. 
 Birth rate is the number of live births per thousand persons in a year. It is a major 
component of growth because in India, birth rates have always been higher than death 
rates. 
 Death rate is the number of deaths per thousand persons in a year. The main cause of the 
rate of growth of the Indian population has been the rapid decline in death rates 
 Migration is the movement of people across regions and territories. Migration can be 
internal (within the country) or international (between the countries) 
o In India, most migrations have been from rural to urban areas because of the “push” 
factor in rural areas. These are adverse conditions of poverty and unemployment in 
the rural areas and the “pull” of the city in terms of increased employment 
opportunities and better living conditions 
o In India, the rural-urban migration has resulted in a steady increase in the 
percentage of population in cities and towns. 
o There has been a significant increase in the number of ‘million plus cities’ from 23 to 
35 in just one decade i.e. 1991 to 2001 
NCERT_India Human Geograpahy
3 | P a g e 
Age Composition 
The population of a nation is generally grouped into three broad categories: 
 Children (generally below 15 years) 
o They are economically unproductive and need to be provided with food, clothing, 
education and medical care 
 Working Age (15-59 years) 
o They are economically productive and biologically reproductive. They comprise the 
working population. 
 Aged (Above 59 years) 
o They can be economically productive though they and may have retired. They may 
be working voluntarily but they are not available for employment through 
recruitment. The percentage of children and the aged affect the dependency ratio 
because these groups are not producers. 
NCERT_India Human Geograpahy
4 | P a g e 
Sex Ratio 
 Sex ratio is defined as the number of females per 1000 males in the population. 
Literacy Rates 
 Literacy is a very important quality of a population. Obviously, only an informed and 
educated citizen can make intelligent choices and undertake research and development 
projects. Low levels of literacy are a serious obstacle for economic improvement 
 who can read and write with understanding in any language, is treated as literate 
Occupational Structure 
 The distribution of the population according to different types of occupation is referred to as 
the occupational structure. Occupations are generally classified as primary, secondary, and 
tertiary 
o Primary activities include agriculture, animal husbandry, forestry, fishing, mining 
and quarrying etc. 
o Secondary activities include manufacturing industry, building and construction work 
etc. 
o Tertiary activities include transport, communications, commerce, administration 
and other services. 
Health 
 The substantial improvement is the result of many factors including improvement in public 
health, prevention of infectious diseases and application of modern medical practices in 
diagnosis and treatment of ailments 
 The per capita calorie consumption is much below the recommended levels and 
malnutrition afflicts a large percentage of our population. Safe drinking water and basic 
sanitation amenities are available to only one third of the rural population. These problems 
need to be tackled through an appropriate population policy. 
Adolescent Population 
 It constitutes one-fifth of the total population of India. Adolescents are generally grouped in 
the age-group of 10 to 19 years. 
 Nutrition requirements of adolescents are higher than those of a normal child or adult. Poor 
nutrition can lead to deficiency and stunted growth. But in India, the diet available to 
adolescents is inadequate in all nutrients. 
 A large number of adolescent girls suffer from anaemia. 
NCERT_India Human Geograpahy
5 | P a g e 
 The adolescent girls have to be sensitised to the problems they confront. Their awareness 
can be improved through the spread of literacy and education among them 
National Population Policy 
 Recognising that the planning of families would improve individual health and welfare, the 
Government of India initiated the comprehensive Family Planning Programme in 1952. 
 The National Population Policy 2000 is a culmination of years of planned efforts 
 The NPP 2000 provides a policy framework for imparting free and compulsory school 
education up to 14 years of age, reducing infant mortality rate to below 30 per 1000 live 
births, achieving universal immunisation of children against all vaccine preventable diseases, 
promoting delayed marriage for girls, and making family welfare a people-centered 
programme. 
NPP 2000 and Adolescents 
 NPP 2000 identified adolescents as one of the major sections of the population that need 
greater attention. Besides nutritional requirements, the policy put greater emphasis on 
other important needs of adolescents including protection from unwanted pregnancies and 
sexually transmitted diseases (STD). 
 People are the nation’s most valuable resource. A well- educated healthy population 
provides potential power 
Chapter 12_1: Geo12_India_1_Population - Distribution, Density, Growth and Composition 
POPULATION: Distribution, Density, Growth and Composition 
 India’s population is larger than the total population of North America, South America and 
Australia put together. 
 the North Indian Plains, deltas and Coastal Plains have higher proportion of population than 
the interior districts of southern and central Indian States, Himalayas, some of the north 
eastern and the western states 
 However, development of irrigation (Rajasthan), availability of mineral and energy resources 
(Jharkhand) and development of transport network (Peninsular States) have resulted in 
moderate to high proportion of population in areas 
 Among the socio-economic and historical factors of distribution of population, important 
ones are evolution of settled agriculture and agricultural development; pattern of human 
settlement; development of transport network, industrialisation and urbanisation. 
Density of Population 
 Density of population is expressed as number of persons per unit area. 
 There has been a steady increase of about 200 persons per sq km over the last 50 years as 
the density of population increased from 117 persons/ sq km in 1951 to 313 persons/sq km 
in 2001. 
 Physiological density=total population/ net cultivated are 
 Agricultural density=total agricultural population/net cultivable area 
NCERT_India Human Geograpahy
6 | P a g e 
 Agricultural population includes cultivators and agricultural labourers and their family 
members 
Growth of Population 
 Population growth has two components namely; natural and induced. While the natural 
growth is analysed by assessing the crude birth and death rates 
Population Doubling 
Time Population doubling time is the time taken by any population to double itself at its current 
annual growth rate. 
There are four distinct phases of growth identified within this period 
 Phase I: The period from 1901-1921 is referred to as a period of stagnant or stationary phase 
of growth of India’s population, since in this period growth rate was very low, even 
recording a negative growth rate during 1911-1921. 
 Phase II: The decades 1921-1951 are referred to as the period of steady population growth. 
 This is impressive at the backdrop of Great Economic Depression, 1920s and World War II 
 Phase III: The decades 1951-1981 are referred to as the period of population explosion in 
India, which was caused by a rapid fall in the mortality rate but a high fertility rate of 
population in the country. 
 Phase IV: In the post 1981 till present, the growth rate of country’s population though 
remained high, has started slowing down gradually 
 By World Development Report that population of India will touch 1,350 million by 2025 
Regional Variation in Population Growth 
 An important aspect of population growth in India is the growth of its adolescents. At 
present the share of adolescents i.e. up to the age group of 10-19 years is about 22 per cent 
(2001), among which male adolescents constitute 53 per cent and female adolescents 
constitute 47 per cent. 
 The National Youth Policy is one example which has been designed to look into the overall 
development of our large youth and adolescent population 
 The National Youth Policy of Government of India, launched in 2003, stresses on an allround 
improvement of the youth and adolescents enabling them to shoulder responsibility 
towards constructive development of the country. It also aims at reinforcing the qualities of 
patriotism and responsible citizenship 
 The thrust of this policy is youth empowerment in terms of their effective participation in 
decision making and carrying the responsibility of an able leader. 
 However, in order to have a better insight into the growth pattern of population it is also 
necessary to look into the social composition of population 
NCERT_India Human Geograpahy
7 | P a g e 
Population Composition 
 Population composition is a distinct field of study within population geography with a vast 
coverage of analysis of age and sex, place of residence, ethnic characteristics, tribes, 
language, religion, marital status, literacy and education, occupational characteristics, etc. 
Rural – Urban Composition 
 A thorough examination of the pattern of distribution of rural population of India reveals 
that both at intra-State and inter State levels, the relative degree of urbanisation and extent 
of rural-urban migration regulate the concentration of rural population. 
 The rural-urban migration is conspicuous in the case of urban areas along the main road 
links and railroads in the North Indian Plains, the industrial areas around Kolkata, Mumbai, 
Bangalore – Mysore, Madurai – Coimbatore, Ahmedabad – Surat, Delhi – Kanpur and 
Ludhiana – Jalandhar. 
 In the agriculturally stagnant parts of the middle and lower Ganga Plains, Telengana, non-irrigated 
Western Rajasthan, remote hilly, tribal areas of northeast, along the flood prone 
areas of Peninsular India and along eastern part of Madhya Pradesh, the degree of 
urbanisation has remained low 
NCERT_India Human Geograpahy
8 | P a g e 
Linguistic Composition 
 India is a land of linguistic diversity. According to Grierson (Linguistic Survey of India, 1903 – 
1928) there were 179 languages and as many as 544 dialects in the country. 
 In the context of modern India, there are about 18 scheduled languages (1991 census) and a 
number of non-scheduled languages. 
 The speakers of Hindi have the highest percentage (40.42). The smallest language groups are 
Kashmiri and Sanskrit speakers (0.01 per cent each). 
Linguistic Classification 
NCERT_India Human Geograpahy
9 | P a g e 
 Religion is one of the most dominant forces affecting the cultural and political life of the 
most of Indians. 
Composition of Working Population 
 The population of India according to their economic status is divided into three groups, 
namely; main workers, marginal workers and non-workers 
Standard Census Definition 
 Main Worker is a person who works for at least 183 days in a year. Marginal Worker is a 
person who works for less than 183 days in a year. 
 It is observed that in India, the proportion of workers (both main and marginal) is only 39 
per cent (2001) leaving a vast majority of 61 per cent as non-workers. 
The occupational composition of India’s population (which actually means engagement of an 
individual in farming, manufacturing trade, services or any kind of professional activities) shows a 
large proportion of primary sector workers compared to secondary and tertiary sectors. 
Occupational Categories 
 The 2001 Census has divided the working population of India into four major categories: 
 Cultivators 2.AgriculturalLabourers 3. Household Industrial Workers 4.Other Workers. 
Chapter 12_2: Geo12_India_2_Migration - Types, Causes and Consequences 
MIGRATION: Types, Causes and Consequences 
Indian Diaspora 
 During colonial period (British period) millions of the indentured labourers were sent to 
Mauritius, Caribbean islands (Trinidad, Tobago and Guyana), Fiji and South Africa by British 
from Uttar Pradesh and Bihar; to Reunion Island, Guadeloupe, Martinique and Surinam by 
French and Dutch and by Portuguese from Goa, Daman and Diu to Angola, Mozambique to 
work as plantation workers. 
o All such migrations were covered under the time-bound contract known as Girmit 
Act (Indian Emigration Act). However, the living conditions of these indentured 
labourers were not better than the slaves. 
 The second wave of migrants ventured out into the neighbouring countries in recent times 
as professionals, artisans, traders and factory workers, in search of economic opportunities 
to Thailand, Malaysia, Singapore, Indonesia, Brunei and African countries, etc. and the trend 
still continues. 
o There was a steady outflow of India’s semi-skilled and skilled labour in the wake of 
the oil boom in West Asia in the1970s.There was also some outflow of 
entrepreneurs, storeowners, professionals, businessmen to Western Countries. 
 Third wave, of migrant was comprised professionals like doctors, engineers (1960s onwards), 
software engineers, management consultants, financial experts, media persons (1980s 
onwards), and others migrated to countries such as USA, Canada, UK, Australia, New 
Zealand and Germany, etc. 
NCERT_India Human Geograpahy
10 | P a g e 
 These professional enjoy the distinction of being one of highly educated, the highest earning 
and prospering groups. After liberalisation, in the 90s education and knowledge–based 
Indian emigration has made Indian Diaspora one of the most powerful Diasporas in the 
world. In all these countries, Indian diaspora has been playing an important role in the 
development of the respective countries 
Actually migration was recorded beginning from the first Census of India conducted in 1881. This 
data were recorded on the basis of place of birth. However, the first major modification was 
introduced in 1961 Census by bringing in two additional components viz; place of birth i.e. village or 
town and duration of residence (if born elsewhere). 
 Further in 1971, additional information on place of last residence and duration of stay at the 
place of enumeration were incorporated. Information on reasons for migration were 
incorporated in 1981 Census and modified in consecutive Censuses. 
 In the Census of India migration is enumerated on two bases: 
o Place of birth, if the place of birth is different from the place of enumeration (known 
as life-time migrant); 
o Place of residence, if the place of last residence is different from the place of 
enumeration (known as migrant by place of last residence). 
 As per 2001 census, out of 1,029 million people in the country, 307 million (30 per cent) 
were reported as migrants by place of birth. However, this figure was 315 million (31 per 
cent) in case of place of last residence. 
Streams of Migration 
 Under the internal migration, four streams are identified: (a) rural to rural (R-R); (b) rural to 
urban (R-U); (c) urban to urban (U-U); and (d) urban to rural (U-R). 
 As far as emigration from India is concerned it is estimated that there are around 20 million 
people of Indian Diaspora, spread across 110 countries. 
Spatial Variation in Migration 
 Among the urban agglomeration (UA), Greater Mumbai received the higher number of in 
migrants. Intra-states migration constituted the largest share in it. These differences are 
largely due to the size of the state in which this Urban Agglomeration is located 
Causes of Migration 
 These reasons can be put into two broad categories: 
o push factor, these cause people to leave their place of residence or origin; and 
o pull factors, which attract the people from different places 
Consequences of Migration 
 People tend to move from place of low opportunity and low safety to the place of higher 
opportunity and better safety. 
 Consequences can be observed in economic, social, cultural, political and demographic 
terms. 
NCERT_India Human Geograpahy
11 | P a g e 
Economic Consequences 
 A major benefit for the source region is the remittance sent by migrants. Remittances from 
the international migrants are one of the major sources of foreign exchange. In 2002, India 
received US$ 11 billion as remittances from international migrants. 
Demographic Consequences 
 Migration leads to the redistribution of the population within a country. Rural urban 
migration is one of the important factors contributing to the population growth of cities. Age 
and skill selective out migration from the rural area have adverse effect on the rural 
demographic structure. 
Social Consequences 
 Migrants act as agents of social change. The new ideas related to new technologies, family 
planning, girl’s education, etc. get diffused from urban to rural areas through them 
Environmental Consequences 
 Overcrowding of people due to rural-urban migration has put pressure on the existing social 
and physical infrastructure in the urban areas. This ultimately leads to unplanned growth of 
urban settlement and formation of slums shanty colonies 
Others 
 Migration (even excluding the marriage migration) affects the status of women directly or 
indirectly 
 The market for advanced skills has become truly a global market and the most dynamic 
industrial economies are admitting and recruiting significant proportions of the highly 
trained professionals from poor regions. Consequently, the existing underdevelopment in 
the source region gets reinforced. 
Chapter 12_3: Geo12_India_3_Human Development 
HUMAN DEVELOPMENT 
Development of a few regions, individuals brought about in a short span of time leads to poverty 
and malnutrition for many along with large scale ecological degradation 
 “Development is freedom” which is often associated with modernisation, leisure, comfort 
and affluence. In the present context, computerisation, industrialisation, efficient transport 
and communication network, large education system, advanced and modern medical 
facilities, safety and security of individuals, etc. are considered as the symbols of 
development. 
 It is often called the western or euro-centric view of development. 
 For a Postcolonial country like India, colonisation, marginalisation, social discrimination and 
regional disparity, etc. show the other face of development 
NCERT_India Human Geograpahy
12 | P a g e 
 It is a well-established fact that majority of the scheduled castes, scheduled tribes, landless 
agricultural labourers, poor farmers and slums dwellers, etc. are the most marginalised lot. 
 A large segment of female population is the worst sufferers among all . 
 marginalised sections have worsened with the development happening over the years. 
Consequently, vast majority of people are compelled to live under abject poverty and 
subhuman conditions. 
Consequently, the poor are being subjected to three inter-related processes of declining capabilities; 
i.e. (1) social capabilities – due to displacement and weakening social ties (social capital), (2) 
environmental capabilities – due to pollution and, (3) personal capabilities – due to increasing 
incidence of diseases and accidents. This, in turn, has adverse effects on their quality of life and 
human development 
 It was thought to take up human development as a separate issue against the prevalent 
western views of development which considers development as the remedy to all the ills 
including human development, regional disparities and environmental crisis 
 Systematic effort towards this was the publication of the First Human Development Report 
by United Nations Development Programme (UNDP) in 1990 
 Since then, this organisation has been bringing out World Human Development Report every 
year. 
 According to the Human Development Report 1993, “progressive democratisation and 
increasing empowerment of people are seen as the minimum conditions for human 
development”. Moreover, it also mentions that “development must be woven around 
people, not the people around development” as was the case previously. 
What is Human Development? 
 “Human development is a process of enlarging the range of people’s choices, increasing 
their opportunities for education, health care, income and empowerment and covering the 
full range of human choices from a sound physical environment to economic, social and 
political freedom.” 
 Thus, enlarging the range of people’s choices is the most significant aspect of human 
development. 
Human Development in India 
 India with a population of over 1.09 billion is ranked 127 among 172 countries of the world 
in terms of the Human Development Index (HDI). With the composite HDI value of O.602 
India finds herself grouped with countries showing medium human development (UNDP 
2005) 
 Using the indicators selected by the UNDP, the Planning Commission of India also prepared 
the Human Development Report for India. It used states and the Union Territories as the 
units of analysis. 
 Subsequently, each state government also started preparing the state level Human 
Development Reports, using districts as the units of analysis. Although, the final HDI by the 
Planning Commission of India has been calculated 
NCERT_India Human Geograpahy
13 | P a g e 
Indicators of Economic Attainments 
 Rich resource base and access to these resources by all, particularly the poor, down trodden 
and the marginalised is the key to productivity, well-being and human development. Gross 
National Product (GNP) and its per capita availability are taken as measures to assess the 
resource base/ endowment of any country. 
 “Poverty is a state of deprivation. In absolute terms it reflects the inability of an individual to 
satisfy certain basic needs for a sustained, healthy and reasonably productive living.” 
Indicators of Social Empowerment 
 “Development is freedom”. Freedom from hunger, poverty, servitude, bondage, ignorance, 
illiteracy and any other forms of domination is the key to human development. 
 Freedom in real sense of the term is possible only with the empowerment and participation 
of the people in the exercise of their capabilities and choices in the society. 
 Access to knowledge about the society and environment are fundamental to freedom. 
Literacy is the beginning of access to such a world of knowledge and freedom 
Human Development Index in India 
 India has been placed among the countries showing medium human development. 
 There are several socio-political, economic and historical reasons for such a state of affairs. 
Kerala is able to record the highest value in the HDI largely due to its impressive 
performance in achieving near hundred per cent literacy (90.92 per cent) in 2001. 
 Regional distortions and social disparities which developed during the colonial period 
continue to play an important role in the Indian economy, polity and society. 
 The Government of India has made concerted efforts to institutionalise the balanced 
development with its main focus on social distributive justice through planned development 
Population, Environment and Development 
 People’s participation and their security were the major issues in the Human Development 
Report of 1993. 
 The report recognised greater constructive role of ‘Civil Societies’ in bringing about peace 
and human development. 
 In a nuclearised world, peace and well-being are major global concerns 
 Scholar like Sir Robert Malthus was the first one to voice his concern about the growing 
scarcity of resources as compared to the human population. 
Mahatma Gandhi in the recent times advocated the reinforcement of the harmony and balance 
between the two. He was quite apprehensive about the on-going development particularly the way 
industrialisation has institutionalised the loss of morality, spirituality, self -reliance, non-violence and 
mutual cooperation and environment. 
 In his opinion, austerity for individual, trusteeship of social wealth and non-violence are the 
key to attain higher goals in the life of an individual as well as that of a nation. 
NCERT_India Human Geograpahy
14 | P a g e 
 His views were also re-echoed in the Club of Rome Report “Limits to Growth” (1972), 
Schumacher’s book “Small is Beautiful” (1974), Brundtland Commission’s Report “Our 
Common Future” (1987) and finally in the “Agenda-21 Report of the Rio Conference” (1993). 
Chapter 12_4: Geo12_India_4_Human Settlements 
HUMAN SETTLEMENTS 
Settlements vary in size and type. They range from a hamlet to metropolitan cities. 
 The basic differences between rural and urban settlements are as follow: 
• The rural settlements derive their life support or basic economic needs from land 
based primary economic activities, whereas, urban settlements, depend on 
processing of raw materials and manufacturing of finished goods on the one hand 
and a variety of services on the other 
• Cities act as nodes of economic growth; provide goods and services not only to 
urban dwellers but also to the people of the rural settlements in their hinterlands in 
return for food and raw materials. This functional relationship between the urban 
and rural settlements takes place through transport and communication network 
• Rural and urban settlements differ in terms of social relationship, attitude and 
outlook. Rural people are less mobile and therefore, social relations among them are 
intimate. In urban areas, on the other hand, way of life is complex and fast, and 
social relations are formal 
Types of Rural Settlement 
 There are various factors and conditions responsible for having different types of rural 
settlements in India. These include: 
• physical features – nature of terrain, altitude, climate and availability of water 
• cultural and ethenic factors – social structure, caste and religion 
• Security factors – defence against thefts and robberies. 
Rural settlements in India can broadly be put into four types: 
 Clustered Settlements 
• In this type of village the general living area is distinct and separated from the 
surrounding farms, barns and pastures. 
 Semi-clustered or fragmented settlements 
• may result from tendency of clustering in a restricted area of dispersed settlement. 
• In this case, one or more sections of the village society choose or is forced to live a 
little away from the main cluster or village. In such cases, generally, the land-owning 
and dominant community occupies the central part of the main village, whereas 
people of lower strata of society and menial workers settle on the outer flanks of the 
village. 
 Hamleted Settlements 
• These units are locally called panna, para, palli, nagla, dhani, etc. in various parts of 
the country. This segmentation of a large village is often motivated by social and 
ethnic factors. 
NCERT_India Human Geograpahy
15 | P a g e 
 Dispersed Settlements 
• Dispersed or isolated settlement pattern in India appears in the form of isolated huts 
or hamlets of few huts in remote jungles, or on small hills with farms or pasture on 
the slopes 
Urban Settlements 
On the basis of their evolution in different periods, Indian towns may be classified as: 
 Ancient Towns 
• There are number of towns in India having historical background spanning over 2000 
years. Most of them developed as religious and cultural centres. Varanasi is one of 
the important towns among these. Prayag (Allahabad), Pataliputra (Patna), Madurai 
are some other examples of ancient towns in the country 
 Medieval Towns 
• About 100 of the existing towns have their roots in the medieval period. Most of 
them developed as headquarters of principalities and kingdoms. These are fort 
towns which came up on the ruins of ancient towns. Important among them are 
Delhi, Hyderabad, Jaipur, Lucknow, Agra and Nagpur 
 Modern Towns 
• The British and other Europeans have developed a number of towns in India. 
Starting their foothold on coastal locations, they first developed some trading ports 
such as Surat, Daman, Goa, Pondicherry, etc. The British later consolidated their 
hold around three principal nodes – Mumbai (Bombay), Chennai (Madras), and 
Kolkata (Calcutta) – and built them in the British style. 
Urbanisation in India 
 The level of urbanisation is measured in terms of percentage of urban population to total 
population. 
 Total urban population has increased eleven fold during twentieth century. 
 Enlargement of urban centres and emergence of new towns have played a significant role in 
the growth of urban population and urbanisation in the country. 
Classification of Towns on the basis of Population Size 
 Urban centre with population of more than one lakh is called a city or class I town. 
 Cities accommodating population size between one to five million are called metropolitan 
cities and more than five million are mega cities. 
 Majority of metropolitan and mega cities are urban agglomerations. An urban agglomeration 
may consist of any one of the following three combinations: 
• a town and its adjoining urban outgrowths, 
• two or more contiguous towns with or without their outgrowths, and 
• a city and one or more adjoining towns with their outgrowths together forming a 
contiguous spread. 
 Among them, Greater Mumbai is the largest agglomeration with 16.4 million people. 
Kolkata, Delhi, Chennai, Bangalore and Hyderabad are other mega cities in the country. 
NCERT_India Human Geograpahy
16 | P a g e 
Functional Classification of Towns 
 Administrative towns and cities 
 Industrial towns 
 Transport Cities 
 Commercial towns 
 Mining towns 
 Garrisson Cantonment towns 
 Educational towns 
 Religious and cultural towns 
 Tourist towns 
The cities are not static in their function. The functions change due to their dynamic nature. 
Even specialised cities, as they grow into metropolises become multifunctional wherein industry, 
business, administration, transport, etc. become important. The functions get so intertwined that 
the city cannot be categorised in a particular functional class 
NCERT_India Human Geograpahy

More Related Content

What's hot

Population 9th
Population 9thPopulation 9th
Population 9thSaloni777
 
population growth and economic development
population growth and economic developmentpopulation growth and economic development
population growth and economic developmenttalha butt
 
Population and its impact in india
Population and its impact in indiaPopulation and its impact in india
Population and its impact in indiaDino Vesper
 
demographic and population control policies
demographic and population control policiesdemographic and population control policies
demographic and population control policiesPatricia Clariza Santos
 
Chapter - 6, Population, Geography, Social Science, Class 9
Chapter - 6, Population, Geography, Social Science, Class 9Chapter - 6, Population, Geography, Social Science, Class 9
Chapter - 6, Population, Geography, Social Science, Class 9Shivam Parmar
 
Population ppt
Population ppt Population ppt
Population ppt SBrooker
 
Problems and polices relating population
Problems and polices relating populationProblems and polices relating population
Problems and polices relating populationzafrid hussain
 
Population class 8
Population class 8Population class 8
Population class 8LearnX365
 
Population explosion causes and its consequences
Population explosion causes  and its consequencesPopulation explosion causes  and its consequences
Population explosion causes and its consequencesSrinivas Gajjela
 
World population day and pakistan population
World population day and pakistan populationWorld population day and pakistan population
World population day and pakistan populationshabihhaider
 
Presentation on growing population of india
Presentation on growing population of indiaPresentation on growing population of india
Presentation on growing population of indiaBharateche15
 
population promote economic development
population promote economic developmentpopulation promote economic development
population promote economic developmentyasser poswal
 
World human population growth through history
World human population growth through historyWorld human population growth through history
World human population growth through historyBiswajit Das
 

What's hot (20)

Population 9th
Population 9thPopulation 9th
Population 9th
 
population growth and economic development
population growth and economic developmentpopulation growth and economic development
population growth and economic development
 
Population and its impact in india
Population and its impact in indiaPopulation and its impact in india
Population and its impact in india
 
demographic and population control policies
demographic and population control policiesdemographic and population control policies
demographic and population control policies
 
Chapter - 6, Population, Geography, Social Science, Class 9
Chapter - 6, Population, Geography, Social Science, Class 9Chapter - 6, Population, Geography, Social Science, Class 9
Chapter - 6, Population, Geography, Social Science, Class 9
 
Population ppt
Population ppt Population ppt
Population ppt
 
Population, size & growth, class 9 cbse
Population, size & growth, class 9 cbsePopulation, size & growth, class 9 cbse
Population, size & growth, class 9 cbse
 
Population
PopulationPopulation
Population
 
Problems and polices relating population
Problems and polices relating populationProblems and polices relating population
Problems and polices relating population
 
Population class 8
Population class 8Population class 8
Population class 8
 
Population Control
Population ControlPopulation Control
Population Control
 
Population
PopulationPopulation
Population
 
Population explosion causes and its consequences
Population explosion causes  and its consequencesPopulation explosion causes  and its consequences
Population explosion causes and its consequences
 
Population Explosion
Population Explosion Population Explosion
Population Explosion
 
World population day and pakistan population
World population day and pakistan populationWorld population day and pakistan population
World population day and pakistan population
 
Presentation on growing population of india
Presentation on growing population of indiaPresentation on growing population of india
Presentation on growing population of india
 
population promote economic development
population promote economic developmentpopulation promote economic development
population promote economic development
 
World human population growth through history
World human population growth through historyWorld human population growth through history
World human population growth through history
 
Unit 4 e) Population and Development
Unit 4 e) Population and DevelopmentUnit 4 e) Population and Development
Unit 4 e) Population and Development
 
Best Population PPT
Best Population  PPT Best Population  PPT
Best Population PPT
 

Similar to India's Population Distribution, Density, Growth and Composition

Population Class 9_6.pptx NCERT
Population Class  9_6.pptx NCERTPopulation Class  9_6.pptx NCERT
Population Class 9_6.pptx NCERTGeographer Sandeep
 
India- Human Resources.pptx
India- Human Resources.pptxIndia- Human Resources.pptx
India- Human Resources.pptxASShyamkumar4792
 
Population (IX).pptx
Population (IX).pptxPopulation (IX).pptx
Population (IX).pptxSujayJain6
 
Population 130628000500-phpapp02
Population 130628000500-phpapp02Population 130628000500-phpapp02
Population 130628000500-phpapp02Vibhore Gupta
 
Population, An Asset or A Liability?
Population, An Asset or A Liability?Population, An Asset or A Liability?
Population, An Asset or A Liability?SagarGupta372
 
Demographic transition in India and its effects
Demographic transition in India and its effectsDemographic transition in India and its effects
Demographic transition in India and its effectsSarinkumar P S
 
Population explosion and its control
Population explosion and its controlPopulation explosion and its control
Population explosion and its controlMd Yusuf Ali
 
Human population explosion
Human population explosion Human population explosion
Human population explosion Asim Gm
 
Population problem in india
Population problem in indiaPopulation problem in india
Population problem in indiaSwagatika Sahoo
 
GROWTH RATE & ESTIMATED POPULATION INDUSTRIALIZATION/ URBANIZTION
GROWTH RATE & ESTIMATED POPULATION INDUSTRIALIZATION/URBANIZTIONGROWTH RATE & ESTIMATED POPULATION INDUSTRIALIZATION/URBANIZTION
GROWTH RATE & ESTIMATED POPULATION INDUSTRIALIZATION/ URBANIZTIONKanav Bhanot
 
presentation_population_ppt_1527316824_147767.pptx
presentation_population_ppt_1527316824_147767.pptxpresentation_population_ppt_1527316824_147767.pptx
presentation_population_ppt_1527316824_147767.pptxVishwajeetJadhav21
 
Human Population and the Environment
Human Population and the EnvironmentHuman Population and the Environment
Human Population and the EnvironmentPrach Shetye
 
DEMOGRAPHY and family health census.pptx
DEMOGRAPHY and family health census.pptxDEMOGRAPHY and family health census.pptx
DEMOGRAPHY and family health census.pptxriyazameer
 

Similar to India's Population Distribution, Density, Growth and Composition (20)

Population Class 9_6.pptx NCERT
Population Class  9_6.pptx NCERTPopulation Class  9_6.pptx NCERT
Population Class 9_6.pptx NCERT
 
Population ( class 9 )
Population ( class 9 )    Population ( class 9 )
Population ( class 9 )
 
India- Human Resources.pptx
India- Human Resources.pptxIndia- Human Resources.pptx
India- Human Resources.pptx
 
Population (IX).pptx
Population (IX).pptxPopulation (IX).pptx
Population (IX).pptx
 
Population 130628000500-phpapp02
Population 130628000500-phpapp02Population 130628000500-phpapp02
Population 130628000500-phpapp02
 
Population, An Asset or A Liability?
Population, An Asset or A Liability?Population, An Asset or A Liability?
Population, An Asset or A Liability?
 
Demographic transition in India and its effects
Demographic transition in India and its effectsDemographic transition in India and its effects
Demographic transition in India and its effects
 
Social ppt 2
Social ppt 2Social ppt 2
Social ppt 2
 
Poverty
PovertyPoverty
Poverty
 
Demography.pptx
Demography.pptxDemography.pptx
Demography.pptx
 
Population explosion and its control
Population explosion and its controlPopulation explosion and its control
Population explosion and its control
 
Human population explosion
Human population explosion Human population explosion
Human population explosion
 
Consumer india i
Consumer india iConsumer india i
Consumer india i
 
Population problem in india
Population problem in indiaPopulation problem in india
Population problem in india
 
GROWTH RATE & ESTIMATED POPULATION INDUSTRIALIZATION/ URBANIZTION
GROWTH RATE & ESTIMATED POPULATION INDUSTRIALIZATION/URBANIZTIONGROWTH RATE & ESTIMATED POPULATION INDUSTRIALIZATION/URBANIZTION
GROWTH RATE & ESTIMATED POPULATION INDUSTRIALIZATION/ URBANIZTION
 
population ppt
population pptpopulation ppt
population ppt
 
presentation_population_ppt_1527316824_147767.pptx
presentation_population_ppt_1527316824_147767.pptxpresentation_population_ppt_1527316824_147767.pptx
presentation_population_ppt_1527316824_147767.pptx
 
Human Population and the Environment
Human Population and the EnvironmentHuman Population and the Environment
Human Population and the Environment
 
DEMOGRAPHY and family health census.pptx
DEMOGRAPHY and family health census.pptxDEMOGRAPHY and family health census.pptx
DEMOGRAPHY and family health census.pptx
 
Sprawled City; Lesson 5.ppt
Sprawled  City; Lesson 5.pptSprawled  City; Lesson 5.ppt
Sprawled City; Lesson 5.ppt
 

More from Venu Gopal Kallem

More from Venu Gopal Kallem (20)

The story of_civilization_ii
The story of_civilization_iiThe story of_civilization_ii
The story of_civilization_ii
 
The story of_civilization_i
The story of_civilization_iThe story of_civilization_i
The story of_civilization_i
 
Modern india bipan_chandra
Modern india bipan_chandraModern india bipan_chandra
Modern india bipan_chandra
 
Medieval india satish_chandra
Medieval india satish_chandraMedieval india satish_chandra
Medieval india satish_chandra
 
[Ncert] principles of geography xi(old edition)
[Ncert] principles of geography xi(old edition)[Ncert] principles of geography xi(old edition)
[Ncert] principles of geography xi(old edition)
 
[Ncert] principle basic of geography xi(old edition)
[Ncert] principle basic of geography xi(old edition)[Ncert] principle basic of geography xi(old edition)
[Ncert] principle basic of geography xi(old edition)
 
[Ncert] medieval india (romila thapar)
[Ncert] medieval india (romila thapar)[Ncert] medieval india (romila thapar)
[Ncert] medieval india (romila thapar)
 
[Ncert] economic & commercial geography of india x(old edition)
[Ncert] economic & commercial geography of india x(old edition)[Ncert] economic & commercial geography of india x(old edition)
[Ncert] economic & commercial geography of india x(old edition)
 
Physics
PhysicsPhysics
Physics
 
Chemistry
ChemistryChemistry
Chemistry
 
Biology
BiologyBiology
Biology
 
Ncert economy
Ncert economyNcert economy
Ncert economy
 
Economy
EconomyEconomy
Economy
 
New microsoft word document
New microsoft word documentNew microsoft word document
New microsoft word document
 
Ncert universe
Ncert universeNcert universe
Ncert universe
 
Ncert india rivers
Ncert india riversNcert india rivers
Ncert india rivers
 
Ncert india physical
Ncert india physicalNcert india physical
Ncert india physical
 
Ncert geo physical geograpy
Ncert geo physical geograpyNcert geo physical geograpy
Ncert geo physical geograpy
 
Ncert geo indian_geography
Ncert geo indian_geographyNcert geo indian_geography
Ncert geo indian_geography
 
Ncert earth
Ncert earthNcert earth
Ncert earth
 

Recently uploaded

Measures of Central Tendency: Mean, Median and Mode
Measures of Central Tendency: Mean, Median and ModeMeasures of Central Tendency: Mean, Median and Mode
Measures of Central Tendency: Mean, Median and ModeThiyagu K
 
Sanyam Choudhary Chemistry practical.pdf
Sanyam Choudhary Chemistry practical.pdfSanyam Choudhary Chemistry practical.pdf
Sanyam Choudhary Chemistry practical.pdfsanyamsingh5019
 
Call Girls in Dwarka Mor Delhi Contact Us 9654467111
Call Girls in Dwarka Mor Delhi Contact Us 9654467111Call Girls in Dwarka Mor Delhi Contact Us 9654467111
Call Girls in Dwarka Mor Delhi Contact Us 9654467111Sapana Sha
 
Arihant handbook biology for class 11 .pdf
Arihant handbook biology for class 11 .pdfArihant handbook biology for class 11 .pdf
Arihant handbook biology for class 11 .pdfchloefrazer622
 
microwave assisted reaction. General introduction
microwave assisted reaction. General introductionmicrowave assisted reaction. General introduction
microwave assisted reaction. General introductionMaksud Ahmed
 
Q4-W6-Restating Informational Text Grade 3
Q4-W6-Restating Informational Text Grade 3Q4-W6-Restating Informational Text Grade 3
Q4-W6-Restating Informational Text Grade 3JemimahLaneBuaron
 
SOCIAL AND HISTORICAL CONTEXT - LFTVD.pptx
SOCIAL AND HISTORICAL CONTEXT - LFTVD.pptxSOCIAL AND HISTORICAL CONTEXT - LFTVD.pptx
SOCIAL AND HISTORICAL CONTEXT - LFTVD.pptxiammrhaywood
 
BASLIQ CURRENT LOOKBOOK LOOKBOOK(1) (1).pdf
BASLIQ CURRENT LOOKBOOK  LOOKBOOK(1) (1).pdfBASLIQ CURRENT LOOKBOOK  LOOKBOOK(1) (1).pdf
BASLIQ CURRENT LOOKBOOK LOOKBOOK(1) (1).pdfSoniaTolstoy
 
Web & Social Media Analytics Previous Year Question Paper.pdf
Web & Social Media Analytics Previous Year Question Paper.pdfWeb & Social Media Analytics Previous Year Question Paper.pdf
Web & Social Media Analytics Previous Year Question Paper.pdfJayanti Pande
 
Grant Readiness 101 TechSoup and Remy Consulting
Grant Readiness 101 TechSoup and Remy ConsultingGrant Readiness 101 TechSoup and Remy Consulting
Grant Readiness 101 TechSoup and Remy ConsultingTechSoup
 
Accessible design: Minimum effort, maximum impact
Accessible design: Minimum effort, maximum impactAccessible design: Minimum effort, maximum impact
Accessible design: Minimum effort, maximum impactdawncurless
 
Russian Escort Service in Delhi 11k Hotel Foreigner Russian Call Girls in Delhi
Russian Escort Service in Delhi 11k Hotel Foreigner Russian Call Girls in DelhiRussian Escort Service in Delhi 11k Hotel Foreigner Russian Call Girls in Delhi
Russian Escort Service in Delhi 11k Hotel Foreigner Russian Call Girls in Delhikauryashika82
 
Activity 01 - Artificial Culture (1).pdf
Activity 01 - Artificial Culture (1).pdfActivity 01 - Artificial Culture (1).pdf
Activity 01 - Artificial Culture (1).pdfciinovamais
 
Class 11th Physics NEET formula sheet pdf
Class 11th Physics NEET formula sheet pdfClass 11th Physics NEET formula sheet pdf
Class 11th Physics NEET formula sheet pdfAyushMahapatra5
 
Disha NEET Physics Guide for classes 11 and 12.pdf
Disha NEET Physics Guide for classes 11 and 12.pdfDisha NEET Physics Guide for classes 11 and 12.pdf
Disha NEET Physics Guide for classes 11 and 12.pdfchloefrazer622
 
Student login on Anyboli platform.helpin
Student login on Anyboli platform.helpinStudent login on Anyboli platform.helpin
Student login on Anyboli platform.helpinRaunakKeshri1
 

Recently uploaded (20)

Measures of Central Tendency: Mean, Median and Mode
Measures of Central Tendency: Mean, Median and ModeMeasures of Central Tendency: Mean, Median and Mode
Measures of Central Tendency: Mean, Median and Mode
 
Sanyam Choudhary Chemistry practical.pdf
Sanyam Choudhary Chemistry practical.pdfSanyam Choudhary Chemistry practical.pdf
Sanyam Choudhary Chemistry practical.pdf
 
Call Girls in Dwarka Mor Delhi Contact Us 9654467111
Call Girls in Dwarka Mor Delhi Contact Us 9654467111Call Girls in Dwarka Mor Delhi Contact Us 9654467111
Call Girls in Dwarka Mor Delhi Contact Us 9654467111
 
INDIA QUIZ 2024 RLAC DELHI UNIVERSITY.pptx
INDIA QUIZ 2024 RLAC DELHI UNIVERSITY.pptxINDIA QUIZ 2024 RLAC DELHI UNIVERSITY.pptx
INDIA QUIZ 2024 RLAC DELHI UNIVERSITY.pptx
 
Arihant handbook biology for class 11 .pdf
Arihant handbook biology for class 11 .pdfArihant handbook biology for class 11 .pdf
Arihant handbook biology for class 11 .pdf
 
Mattingly "AI & Prompt Design: Structured Data, Assistants, & RAG"
Mattingly "AI & Prompt Design: Structured Data, Assistants, & RAG"Mattingly "AI & Prompt Design: Structured Data, Assistants, & RAG"
Mattingly "AI & Prompt Design: Structured Data, Assistants, & RAG"
 
microwave assisted reaction. General introduction
microwave assisted reaction. General introductionmicrowave assisted reaction. General introduction
microwave assisted reaction. General introduction
 
Q4-W6-Restating Informational Text Grade 3
Q4-W6-Restating Informational Text Grade 3Q4-W6-Restating Informational Text Grade 3
Q4-W6-Restating Informational Text Grade 3
 
SOCIAL AND HISTORICAL CONTEXT - LFTVD.pptx
SOCIAL AND HISTORICAL CONTEXT - LFTVD.pptxSOCIAL AND HISTORICAL CONTEXT - LFTVD.pptx
SOCIAL AND HISTORICAL CONTEXT - LFTVD.pptx
 
BASLIQ CURRENT LOOKBOOK LOOKBOOK(1) (1).pdf
BASLIQ CURRENT LOOKBOOK  LOOKBOOK(1) (1).pdfBASLIQ CURRENT LOOKBOOK  LOOKBOOK(1) (1).pdf
BASLIQ CURRENT LOOKBOOK LOOKBOOK(1) (1).pdf
 
Web & Social Media Analytics Previous Year Question Paper.pdf
Web & Social Media Analytics Previous Year Question Paper.pdfWeb & Social Media Analytics Previous Year Question Paper.pdf
Web & Social Media Analytics Previous Year Question Paper.pdf
 
Grant Readiness 101 TechSoup and Remy Consulting
Grant Readiness 101 TechSoup and Remy ConsultingGrant Readiness 101 TechSoup and Remy Consulting
Grant Readiness 101 TechSoup and Remy Consulting
 
Código Creativo y Arte de Software | Unidad 1
Código Creativo y Arte de Software | Unidad 1Código Creativo y Arte de Software | Unidad 1
Código Creativo y Arte de Software | Unidad 1
 
Accessible design: Minimum effort, maximum impact
Accessible design: Minimum effort, maximum impactAccessible design: Minimum effort, maximum impact
Accessible design: Minimum effort, maximum impact
 
Russian Escort Service in Delhi 11k Hotel Foreigner Russian Call Girls in Delhi
Russian Escort Service in Delhi 11k Hotel Foreigner Russian Call Girls in DelhiRussian Escort Service in Delhi 11k Hotel Foreigner Russian Call Girls in Delhi
Russian Escort Service in Delhi 11k Hotel Foreigner Russian Call Girls in Delhi
 
Activity 01 - Artificial Culture (1).pdf
Activity 01 - Artificial Culture (1).pdfActivity 01 - Artificial Culture (1).pdf
Activity 01 - Artificial Culture (1).pdf
 
Class 11th Physics NEET formula sheet pdf
Class 11th Physics NEET formula sheet pdfClass 11th Physics NEET formula sheet pdf
Class 11th Physics NEET formula sheet pdf
 
Disha NEET Physics Guide for classes 11 and 12.pdf
Disha NEET Physics Guide for classes 11 and 12.pdfDisha NEET Physics Guide for classes 11 and 12.pdf
Disha NEET Physics Guide for classes 11 and 12.pdf
 
Student login on Anyboli platform.helpin
Student login on Anyboli platform.helpinStudent login on Anyboli platform.helpin
Student login on Anyboli platform.helpin
 
Mattingly "AI & Prompt Design: The Basics of Prompt Design"
Mattingly "AI & Prompt Design: The Basics of Prompt Design"Mattingly "AI & Prompt Design: The Basics of Prompt Design"
Mattingly "AI & Prompt Design: The Basics of Prompt Design"
 

India's Population Distribution, Density, Growth and Composition

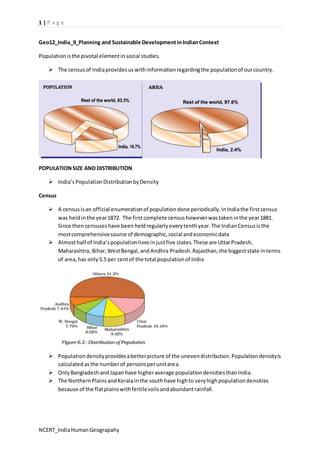
  • 1. 1 | P a g e Geo12_India_9_Planning and Sustainable Development in Indian Context Population is the pivotal element in social studies.  The census of India provides us with information regarding the population of our country. POPULATION SIZE AND DISTRIBUTION  India’s Population Distribution by Density Census  A census is an official enumeration of population done periodically. In India the first census was held in the year 1872. The first complete census however was taken in the year 1881. Since then censuses have been held regularly every tenth year. The Indian Census is the most comprehensive source of demographic, social and economic data  Almost half of India’s population lives in just five states. These are Uttar Pradesh, Maharashtra, Bihar, West Bengal, and Andhra Pradesh. Rajasthan, the biggest state in terms of area, has only 5.5 per cent of the total population of India  Population density provides a better picture of the uneven distribution. Population density is calculated as the number of persons per unit area.  Only Bangladesh and Japan have higher average population densities than India.  The Northern Plains and Kerala in the south have high to very high population densities because of the flat plains with fertile soils and abundant rainfall. NCERT_India Human Geograpahy
  • 2. 2 | P a g e POPULATION GROWTH AND PROCESSES OF POPULATION CHANGE  This is the influence of the interaction of the three processes, namely-births, deaths and migrations Population Growth Such a change can be expressed in two ways: in terms of absolute numbers and in terms of percentage change per year  The absolute numbers added each year or decade is the magnitude of increase. It is obtained by simply subtracting the earlier population (e.g. that of 1991) from the later population (e.g. that of 2001). It is referred to as the absolute increase.  The rate or the pace of population increase is the other important aspect. It is studied in per cent per annum, e.g. a rate of increase of 2 per cent per annum means that in a given year, there was an increase of two persons for every 100 persons in the base population. This is referred to as the annual growth rate. India’s population has been steadily increasing from 361 million in 1951 to 1028 million in 2001  During this period, birth rates declined rapidly. Still 182 million people were added to the total population in the 1990s alone (an annual addition larger than ever before).  India may overtake China in 2045 to become the most populous country in the world. Processes of Population Change/Growth There are three main processes of change of population: birth rates, death rates and migration.  Birth rate is the number of live births per thousand persons in a year. It is a major component of growth because in India, birth rates have always been higher than death rates.  Death rate is the number of deaths per thousand persons in a year. The main cause of the rate of growth of the Indian population has been the rapid decline in death rates  Migration is the movement of people across regions and territories. Migration can be internal (within the country) or international (between the countries) o In India, most migrations have been from rural to urban areas because of the “push” factor in rural areas. These are adverse conditions of poverty and unemployment in the rural areas and the “pull” of the city in terms of increased employment opportunities and better living conditions o In India, the rural-urban migration has resulted in a steady increase in the percentage of population in cities and towns. o There has been a significant increase in the number of ‘million plus cities’ from 23 to 35 in just one decade i.e. 1991 to 2001 NCERT_India Human Geograpahy
  • 3. 3 | P a g e Age Composition The population of a nation is generally grouped into three broad categories:  Children (generally below 15 years) o They are economically unproductive and need to be provided with food, clothing, education and medical care  Working Age (15-59 years) o They are economically productive and biologically reproductive. They comprise the working population.  Aged (Above 59 years) o They can be economically productive though they and may have retired. They may be working voluntarily but they are not available for employment through recruitment. The percentage of children and the aged affect the dependency ratio because these groups are not producers. NCERT_India Human Geograpahy
  • 4. 4 | P a g e Sex Ratio  Sex ratio is defined as the number of females per 1000 males in the population. Literacy Rates  Literacy is a very important quality of a population. Obviously, only an informed and educated citizen can make intelligent choices and undertake research and development projects. Low levels of literacy are a serious obstacle for economic improvement  who can read and write with understanding in any language, is treated as literate Occupational Structure  The distribution of the population according to different types of occupation is referred to as the occupational structure. Occupations are generally classified as primary, secondary, and tertiary o Primary activities include agriculture, animal husbandry, forestry, fishing, mining and quarrying etc. o Secondary activities include manufacturing industry, building and construction work etc. o Tertiary activities include transport, communications, commerce, administration and other services. Health  The substantial improvement is the result of many factors including improvement in public health, prevention of infectious diseases and application of modern medical practices in diagnosis and treatment of ailments  The per capita calorie consumption is much below the recommended levels and malnutrition afflicts a large percentage of our population. Safe drinking water and basic sanitation amenities are available to only one third of the rural population. These problems need to be tackled through an appropriate population policy. Adolescent Population  It constitutes one-fifth of the total population of India. Adolescents are generally grouped in the age-group of 10 to 19 years.  Nutrition requirements of adolescents are higher than those of a normal child or adult. Poor nutrition can lead to deficiency and stunted growth. But in India, the diet available to adolescents is inadequate in all nutrients.  A large number of adolescent girls suffer from anaemia. NCERT_India Human Geograpahy
  • 5. 5 | P a g e  The adolescent girls have to be sensitised to the problems they confront. Their awareness can be improved through the spread of literacy and education among them National Population Policy  Recognising that the planning of families would improve individual health and welfare, the Government of India initiated the comprehensive Family Planning Programme in 1952.  The National Population Policy 2000 is a culmination of years of planned efforts  The NPP 2000 provides a policy framework for imparting free and compulsory school education up to 14 years of age, reducing infant mortality rate to below 30 per 1000 live births, achieving universal immunisation of children against all vaccine preventable diseases, promoting delayed marriage for girls, and making family welfare a people-centered programme. NPP 2000 and Adolescents  NPP 2000 identified adolescents as one of the major sections of the population that need greater attention. Besides nutritional requirements, the policy put greater emphasis on other important needs of adolescents including protection from unwanted pregnancies and sexually transmitted diseases (STD).  People are the nation’s most valuable resource. A well- educated healthy population provides potential power Chapter 12_1: Geo12_India_1_Population - Distribution, Density, Growth and Composition POPULATION: Distribution, Density, Growth and Composition  India’s population is larger than the total population of North America, South America and Australia put together.  the North Indian Plains, deltas and Coastal Plains have higher proportion of population than the interior districts of southern and central Indian States, Himalayas, some of the north eastern and the western states  However, development of irrigation (Rajasthan), availability of mineral and energy resources (Jharkhand) and development of transport network (Peninsular States) have resulted in moderate to high proportion of population in areas  Among the socio-economic and historical factors of distribution of population, important ones are evolution of settled agriculture and agricultural development; pattern of human settlement; development of transport network, industrialisation and urbanisation. Density of Population  Density of population is expressed as number of persons per unit area.  There has been a steady increase of about 200 persons per sq km over the last 50 years as the density of population increased from 117 persons/ sq km in 1951 to 313 persons/sq km in 2001.  Physiological density=total population/ net cultivated are  Agricultural density=total agricultural population/net cultivable area NCERT_India Human Geograpahy
  • 6. 6 | P a g e  Agricultural population includes cultivators and agricultural labourers and their family members Growth of Population  Population growth has two components namely; natural and induced. While the natural growth is analysed by assessing the crude birth and death rates Population Doubling Time Population doubling time is the time taken by any population to double itself at its current annual growth rate. There are four distinct phases of growth identified within this period  Phase I: The period from 1901-1921 is referred to as a period of stagnant or stationary phase of growth of India’s population, since in this period growth rate was very low, even recording a negative growth rate during 1911-1921.  Phase II: The decades 1921-1951 are referred to as the period of steady population growth.  This is impressive at the backdrop of Great Economic Depression, 1920s and World War II  Phase III: The decades 1951-1981 are referred to as the period of population explosion in India, which was caused by a rapid fall in the mortality rate but a high fertility rate of population in the country.  Phase IV: In the post 1981 till present, the growth rate of country’s population though remained high, has started slowing down gradually  By World Development Report that population of India will touch 1,350 million by 2025 Regional Variation in Population Growth  An important aspect of population growth in India is the growth of its adolescents. At present the share of adolescents i.e. up to the age group of 10-19 years is about 22 per cent (2001), among which male adolescents constitute 53 per cent and female adolescents constitute 47 per cent.  The National Youth Policy is one example which has been designed to look into the overall development of our large youth and adolescent population  The National Youth Policy of Government of India, launched in 2003, stresses on an allround improvement of the youth and adolescents enabling them to shoulder responsibility towards constructive development of the country. It also aims at reinforcing the qualities of patriotism and responsible citizenship  The thrust of this policy is youth empowerment in terms of their effective participation in decision making and carrying the responsibility of an able leader.  However, in order to have a better insight into the growth pattern of population it is also necessary to look into the social composition of population NCERT_India Human Geograpahy
  • 7. 7 | P a g e Population Composition  Population composition is a distinct field of study within population geography with a vast coverage of analysis of age and sex, place of residence, ethnic characteristics, tribes, language, religion, marital status, literacy and education, occupational characteristics, etc. Rural – Urban Composition  A thorough examination of the pattern of distribution of rural population of India reveals that both at intra-State and inter State levels, the relative degree of urbanisation and extent of rural-urban migration regulate the concentration of rural population.  The rural-urban migration is conspicuous in the case of urban areas along the main road links and railroads in the North Indian Plains, the industrial areas around Kolkata, Mumbai, Bangalore – Mysore, Madurai – Coimbatore, Ahmedabad – Surat, Delhi – Kanpur and Ludhiana – Jalandhar.  In the agriculturally stagnant parts of the middle and lower Ganga Plains, Telengana, non-irrigated Western Rajasthan, remote hilly, tribal areas of northeast, along the flood prone areas of Peninsular India and along eastern part of Madhya Pradesh, the degree of urbanisation has remained low NCERT_India Human Geograpahy
  • 8. 8 | P a g e Linguistic Composition  India is a land of linguistic diversity. According to Grierson (Linguistic Survey of India, 1903 – 1928) there were 179 languages and as many as 544 dialects in the country.  In the context of modern India, there are about 18 scheduled languages (1991 census) and a number of non-scheduled languages.  The speakers of Hindi have the highest percentage (40.42). The smallest language groups are Kashmiri and Sanskrit speakers (0.01 per cent each). Linguistic Classification NCERT_India Human Geograpahy
  • 9. 9 | P a g e  Religion is one of the most dominant forces affecting the cultural and political life of the most of Indians. Composition of Working Population  The population of India according to their economic status is divided into three groups, namely; main workers, marginal workers and non-workers Standard Census Definition  Main Worker is a person who works for at least 183 days in a year. Marginal Worker is a person who works for less than 183 days in a year.  It is observed that in India, the proportion of workers (both main and marginal) is only 39 per cent (2001) leaving a vast majority of 61 per cent as non-workers. The occupational composition of India’s population (which actually means engagement of an individual in farming, manufacturing trade, services or any kind of professional activities) shows a large proportion of primary sector workers compared to secondary and tertiary sectors. Occupational Categories  The 2001 Census has divided the working population of India into four major categories:  Cultivators 2.AgriculturalLabourers 3. Household Industrial Workers 4.Other Workers. Chapter 12_2: Geo12_India_2_Migration - Types, Causes and Consequences MIGRATION: Types, Causes and Consequences Indian Diaspora  During colonial period (British period) millions of the indentured labourers were sent to Mauritius, Caribbean islands (Trinidad, Tobago and Guyana), Fiji and South Africa by British from Uttar Pradesh and Bihar; to Reunion Island, Guadeloupe, Martinique and Surinam by French and Dutch and by Portuguese from Goa, Daman and Diu to Angola, Mozambique to work as plantation workers. o All such migrations were covered under the time-bound contract known as Girmit Act (Indian Emigration Act). However, the living conditions of these indentured labourers were not better than the slaves.  The second wave of migrants ventured out into the neighbouring countries in recent times as professionals, artisans, traders and factory workers, in search of economic opportunities to Thailand, Malaysia, Singapore, Indonesia, Brunei and African countries, etc. and the trend still continues. o There was a steady outflow of India’s semi-skilled and skilled labour in the wake of the oil boom in West Asia in the1970s.There was also some outflow of entrepreneurs, storeowners, professionals, businessmen to Western Countries.  Third wave, of migrant was comprised professionals like doctors, engineers (1960s onwards), software engineers, management consultants, financial experts, media persons (1980s onwards), and others migrated to countries such as USA, Canada, UK, Australia, New Zealand and Germany, etc. NCERT_India Human Geograpahy
  • 10. 10 | P a g e  These professional enjoy the distinction of being one of highly educated, the highest earning and prospering groups. After liberalisation, in the 90s education and knowledge–based Indian emigration has made Indian Diaspora one of the most powerful Diasporas in the world. In all these countries, Indian diaspora has been playing an important role in the development of the respective countries Actually migration was recorded beginning from the first Census of India conducted in 1881. This data were recorded on the basis of place of birth. However, the first major modification was introduced in 1961 Census by bringing in two additional components viz; place of birth i.e. village or town and duration of residence (if born elsewhere).  Further in 1971, additional information on place of last residence and duration of stay at the place of enumeration were incorporated. Information on reasons for migration were incorporated in 1981 Census and modified in consecutive Censuses.  In the Census of India migration is enumerated on two bases: o Place of birth, if the place of birth is different from the place of enumeration (known as life-time migrant); o Place of residence, if the place of last residence is different from the place of enumeration (known as migrant by place of last residence).  As per 2001 census, out of 1,029 million people in the country, 307 million (30 per cent) were reported as migrants by place of birth. However, this figure was 315 million (31 per cent) in case of place of last residence. Streams of Migration  Under the internal migration, four streams are identified: (a) rural to rural (R-R); (b) rural to urban (R-U); (c) urban to urban (U-U); and (d) urban to rural (U-R).  As far as emigration from India is concerned it is estimated that there are around 20 million people of Indian Diaspora, spread across 110 countries. Spatial Variation in Migration  Among the urban agglomeration (UA), Greater Mumbai received the higher number of in migrants. Intra-states migration constituted the largest share in it. These differences are largely due to the size of the state in which this Urban Agglomeration is located Causes of Migration  These reasons can be put into two broad categories: o push factor, these cause people to leave their place of residence or origin; and o pull factors, which attract the people from different places Consequences of Migration  People tend to move from place of low opportunity and low safety to the place of higher opportunity and better safety.  Consequences can be observed in economic, social, cultural, political and demographic terms. NCERT_India Human Geograpahy
  • 11. 11 | P a g e Economic Consequences  A major benefit for the source region is the remittance sent by migrants. Remittances from the international migrants are one of the major sources of foreign exchange. In 2002, India received US$ 11 billion as remittances from international migrants. Demographic Consequences  Migration leads to the redistribution of the population within a country. Rural urban migration is one of the important factors contributing to the population growth of cities. Age and skill selective out migration from the rural area have adverse effect on the rural demographic structure. Social Consequences  Migrants act as agents of social change. The new ideas related to new technologies, family planning, girl’s education, etc. get diffused from urban to rural areas through them Environmental Consequences  Overcrowding of people due to rural-urban migration has put pressure on the existing social and physical infrastructure in the urban areas. This ultimately leads to unplanned growth of urban settlement and formation of slums shanty colonies Others  Migration (even excluding the marriage migration) affects the status of women directly or indirectly  The market for advanced skills has become truly a global market and the most dynamic industrial economies are admitting and recruiting significant proportions of the highly trained professionals from poor regions. Consequently, the existing underdevelopment in the source region gets reinforced. Chapter 12_3: Geo12_India_3_Human Development HUMAN DEVELOPMENT Development of a few regions, individuals brought about in a short span of time leads to poverty and malnutrition for many along with large scale ecological degradation  “Development is freedom” which is often associated with modernisation, leisure, comfort and affluence. In the present context, computerisation, industrialisation, efficient transport and communication network, large education system, advanced and modern medical facilities, safety and security of individuals, etc. are considered as the symbols of development.  It is often called the western or euro-centric view of development.  For a Postcolonial country like India, colonisation, marginalisation, social discrimination and regional disparity, etc. show the other face of development NCERT_India Human Geograpahy
  • 12. 12 | P a g e  It is a well-established fact that majority of the scheduled castes, scheduled tribes, landless agricultural labourers, poor farmers and slums dwellers, etc. are the most marginalised lot.  A large segment of female population is the worst sufferers among all .  marginalised sections have worsened with the development happening over the years. Consequently, vast majority of people are compelled to live under abject poverty and subhuman conditions. Consequently, the poor are being subjected to three inter-related processes of declining capabilities; i.e. (1) social capabilities – due to displacement and weakening social ties (social capital), (2) environmental capabilities – due to pollution and, (3) personal capabilities – due to increasing incidence of diseases and accidents. This, in turn, has adverse effects on their quality of life and human development  It was thought to take up human development as a separate issue against the prevalent western views of development which considers development as the remedy to all the ills including human development, regional disparities and environmental crisis  Systematic effort towards this was the publication of the First Human Development Report by United Nations Development Programme (UNDP) in 1990  Since then, this organisation has been bringing out World Human Development Report every year.  According to the Human Development Report 1993, “progressive democratisation and increasing empowerment of people are seen as the minimum conditions for human development”. Moreover, it also mentions that “development must be woven around people, not the people around development” as was the case previously. What is Human Development?  “Human development is a process of enlarging the range of people’s choices, increasing their opportunities for education, health care, income and empowerment and covering the full range of human choices from a sound physical environment to economic, social and political freedom.”  Thus, enlarging the range of people’s choices is the most significant aspect of human development. Human Development in India  India with a population of over 1.09 billion is ranked 127 among 172 countries of the world in terms of the Human Development Index (HDI). With the composite HDI value of O.602 India finds herself grouped with countries showing medium human development (UNDP 2005)  Using the indicators selected by the UNDP, the Planning Commission of India also prepared the Human Development Report for India. It used states and the Union Territories as the units of analysis.  Subsequently, each state government also started preparing the state level Human Development Reports, using districts as the units of analysis. Although, the final HDI by the Planning Commission of India has been calculated NCERT_India Human Geograpahy
  • 13. 13 | P a g e Indicators of Economic Attainments  Rich resource base and access to these resources by all, particularly the poor, down trodden and the marginalised is the key to productivity, well-being and human development. Gross National Product (GNP) and its per capita availability are taken as measures to assess the resource base/ endowment of any country.  “Poverty is a state of deprivation. In absolute terms it reflects the inability of an individual to satisfy certain basic needs for a sustained, healthy and reasonably productive living.” Indicators of Social Empowerment  “Development is freedom”. Freedom from hunger, poverty, servitude, bondage, ignorance, illiteracy and any other forms of domination is the key to human development.  Freedom in real sense of the term is possible only with the empowerment and participation of the people in the exercise of their capabilities and choices in the society.  Access to knowledge about the society and environment are fundamental to freedom. Literacy is the beginning of access to such a world of knowledge and freedom Human Development Index in India  India has been placed among the countries showing medium human development.  There are several socio-political, economic and historical reasons for such a state of affairs. Kerala is able to record the highest value in the HDI largely due to its impressive performance in achieving near hundred per cent literacy (90.92 per cent) in 2001.  Regional distortions and social disparities which developed during the colonial period continue to play an important role in the Indian economy, polity and society.  The Government of India has made concerted efforts to institutionalise the balanced development with its main focus on social distributive justice through planned development Population, Environment and Development  People’s participation and their security were the major issues in the Human Development Report of 1993.  The report recognised greater constructive role of ‘Civil Societies’ in bringing about peace and human development.  In a nuclearised world, peace and well-being are major global concerns  Scholar like Sir Robert Malthus was the first one to voice his concern about the growing scarcity of resources as compared to the human population. Mahatma Gandhi in the recent times advocated the reinforcement of the harmony and balance between the two. He was quite apprehensive about the on-going development particularly the way industrialisation has institutionalised the loss of morality, spirituality, self -reliance, non-violence and mutual cooperation and environment.  In his opinion, austerity for individual, trusteeship of social wealth and non-violence are the key to attain higher goals in the life of an individual as well as that of a nation. NCERT_India Human Geograpahy
  • 14. 14 | P a g e  His views were also re-echoed in the Club of Rome Report “Limits to Growth” (1972), Schumacher’s book “Small is Beautiful” (1974), Brundtland Commission’s Report “Our Common Future” (1987) and finally in the “Agenda-21 Report of the Rio Conference” (1993). Chapter 12_4: Geo12_India_4_Human Settlements HUMAN SETTLEMENTS Settlements vary in size and type. They range from a hamlet to metropolitan cities.  The basic differences between rural and urban settlements are as follow: • The rural settlements derive their life support or basic economic needs from land based primary economic activities, whereas, urban settlements, depend on processing of raw materials and manufacturing of finished goods on the one hand and a variety of services on the other • Cities act as nodes of economic growth; provide goods and services not only to urban dwellers but also to the people of the rural settlements in their hinterlands in return for food and raw materials. This functional relationship between the urban and rural settlements takes place through transport and communication network • Rural and urban settlements differ in terms of social relationship, attitude and outlook. Rural people are less mobile and therefore, social relations among them are intimate. In urban areas, on the other hand, way of life is complex and fast, and social relations are formal Types of Rural Settlement  There are various factors and conditions responsible for having different types of rural settlements in India. These include: • physical features – nature of terrain, altitude, climate and availability of water • cultural and ethenic factors – social structure, caste and religion • Security factors – defence against thefts and robberies. Rural settlements in India can broadly be put into four types:  Clustered Settlements • In this type of village the general living area is distinct and separated from the surrounding farms, barns and pastures.  Semi-clustered or fragmented settlements • may result from tendency of clustering in a restricted area of dispersed settlement. • In this case, one or more sections of the village society choose or is forced to live a little away from the main cluster or village. In such cases, generally, the land-owning and dominant community occupies the central part of the main village, whereas people of lower strata of society and menial workers settle on the outer flanks of the village.  Hamleted Settlements • These units are locally called panna, para, palli, nagla, dhani, etc. in various parts of the country. This segmentation of a large village is often motivated by social and ethnic factors. NCERT_India Human Geograpahy
  • 15. 15 | P a g e  Dispersed Settlements • Dispersed or isolated settlement pattern in India appears in the form of isolated huts or hamlets of few huts in remote jungles, or on small hills with farms or pasture on the slopes Urban Settlements On the basis of their evolution in different periods, Indian towns may be classified as:  Ancient Towns • There are number of towns in India having historical background spanning over 2000 years. Most of them developed as religious and cultural centres. Varanasi is one of the important towns among these. Prayag (Allahabad), Pataliputra (Patna), Madurai are some other examples of ancient towns in the country  Medieval Towns • About 100 of the existing towns have their roots in the medieval period. Most of them developed as headquarters of principalities and kingdoms. These are fort towns which came up on the ruins of ancient towns. Important among them are Delhi, Hyderabad, Jaipur, Lucknow, Agra and Nagpur  Modern Towns • The British and other Europeans have developed a number of towns in India. Starting their foothold on coastal locations, they first developed some trading ports such as Surat, Daman, Goa, Pondicherry, etc. The British later consolidated their hold around three principal nodes – Mumbai (Bombay), Chennai (Madras), and Kolkata (Calcutta) – and built them in the British style. Urbanisation in India  The level of urbanisation is measured in terms of percentage of urban population to total population.  Total urban population has increased eleven fold during twentieth century.  Enlargement of urban centres and emergence of new towns have played a significant role in the growth of urban population and urbanisation in the country. Classification of Towns on the basis of Population Size  Urban centre with population of more than one lakh is called a city or class I town.  Cities accommodating population size between one to five million are called metropolitan cities and more than five million are mega cities.  Majority of metropolitan and mega cities are urban agglomerations. An urban agglomeration may consist of any one of the following three combinations: • a town and its adjoining urban outgrowths, • two or more contiguous towns with or without their outgrowths, and • a city and one or more adjoining towns with their outgrowths together forming a contiguous spread.  Among them, Greater Mumbai is the largest agglomeration with 16.4 million people. Kolkata, Delhi, Chennai, Bangalore and Hyderabad are other mega cities in the country. NCERT_India Human Geograpahy
  • 16. 16 | P a g e Functional Classification of Towns  Administrative towns and cities  Industrial towns  Transport Cities  Commercial towns  Mining towns  Garrisson Cantonment towns  Educational towns  Religious and cultural towns  Tourist towns The cities are not static in their function. The functions change due to their dynamic nature. Even specialised cities, as they grow into metropolises become multifunctional wherein industry, business, administration, transport, etc. become important. The functions get so intertwined that the city cannot be categorised in a particular functional class NCERT_India Human Geograpahy