social pharmacy d-pharm 1st year by Pragati K. Mahajan
Question 1
1. Question 1
Based on the SPSS
1. Based on descriptive statistics,
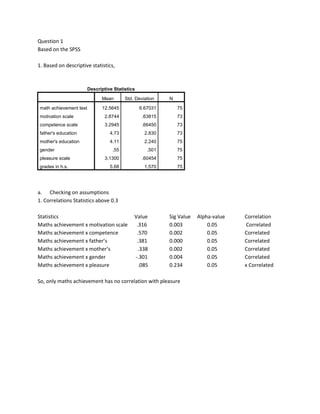
Descriptive Statistics
Mean Std. Deviation N
math achievement test 12.5645 6.67031 75
motivation scale 2.8744 .63815 73
competence scale 3.2945 .66450 73
father's education 4.73 2.830 73
mother's education 4.11 2.240 75
gender .55 .501 75
pleasure scale 3.1300 .60454 75
grades in h.s. 5.68 1.570 75
a. Checking on assumptions
1. Correlations Statistics above 0.3
Statistics Value Sig Value Alpha-value Correlation
Maths achievement x motivation scale .316 0.003 0.05 Correlated
Maths achievement x competence .570 0.002 0.05 Correlated
Maths achievement x father’s .381 0.000 0.05 Correlated
Maths achievement x mother’s .338 0.002 0.05 Correlated
Maths achievement x gender -.301 0.004 0.05 Correlated
Maths achievement x pleasure .085 0.234 0.05 x Correlated
So, only maths achievement has no correlation with pleasure
2. 2. Check on multicollinearity – Look on Coefficient
Tolerance value must be more than .1.
So, there is no multicollinearity.
3. Check on outliers, normality, linearity, homoscedaticity, independence of residuals
So, no major diversion from normality.
b. . Look at Model Summary
Model Summary
b
Model R R Square Adjusted R
Square
Std. Error of the
Estimate
1 .680
a
.462 .403 5.15575
Collinearity Statistics
Tolerance VIF
.639 1.566
.581 1.722
.501 1.997
.491 2.038
.870 1.149
.834 1.199
3. a. Predictors: (Constant), grades in h.s., motivation scale, mother's
education, pleasure scale, gender, competence scale, father's
education
b. Dependent Variable: math achievement test
R = .68, R squared = 0.462
= 46.2% variance in mathematics achievement
5. Hypothesis
Ho – There is no statistical significance in the multiple regression.
Ha – There is statistical significance in the multiple regression.
Test statistics Sig Value Alpha-value Decision
F =7.738 0.000 0.05 Able to reject Ho, Accept Ha
So, There is statistical significance in F (7,63) = 7.738, p<0.05.
c. Look at independent variables
Beta must be the biggest
Model Standardized Coefficients t Sig.
Beta
1
(Constant) -1.792 .078
motivation scale .163 1.412 .163
competence scale .029 .225 .823
father's education .120 .878 .383
mother's education .078 .592 .556
gender -.275 -2.690 .009
pleasure scale .091 .873 .386
grades in h.s. .473 4.438 .000
So, grades in high school has the strongest unique contribution towards mathematics
achievement, p<0.05.
4. Report:
A standard multiple regression has been used to analyze the combination of motivation, competence,
pleasure, grades in high school, father’s education, mother’s education and gender predict mathematics
achievement. Based on the descriptive statistics, the highest mean is the grades in high school which is
5.68. The data screen has showed that the combination are correlated with each other except for
pleasure with mathematics achievement. Further normality test shows that there is no major diversion
as well as there is no multicollinearity within the independent variables.
Regression results indicate an overall model of two predictors (gender and grades in high school)
significantly predicted mathematics achievement R squared = 0.462, F (7, 63) = 7.738, p<0.05. Therefore,
the model which includes grades and gender explains 46.2 % of the variance in the mathematics
achievement. Of these two variables, grades in high school makes the largest contribution (beta = 0.473)
while gender makes has a beta = -.2755. The beta values also indicate the increase of standard deviation
1.57 in grades, maths achievement statistics will also increase by 6.6.