
Recommended
More Related Content
Similar to Correlation of exam scores and relationship between test variables
Similar to Correlation of exam scores and relationship between test variables (20)
More from hyacinthshackley2629
More from hyacinthshackley2629 (20)
Recently uploaded
Recently uploaded (20)
Correlation of exam scores and relationship between test variables
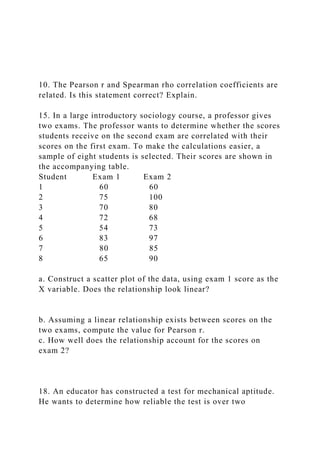
- 1. 10. The Pearson r and Spearman rho correlation coefficients are related. Is this statement correct? Explain. 15. In a large introductory sociology course, a professor gives two exams. The professor wants to determine whether the scores students receive on the second exam are correlated with their scores on the first exam. To make the calculations easier, a sample of eight students is selected. Their scores are shown in the accompanying table. Student Exam 1 Exam 2 1 60 60 2 75 100 3 70 80 4 72 68 5 54 73 6 83 97 7 80 85 8 65 90 a. Construct a scatter plot of the data, using exam 1 score as the X variable. Does the relationship look linear? b. Assuming a linear relationship exists between scores on the two exams, compute the value for Pearson r. c. How well does the relationship account for the scores on exam 2? 18. An educator has constructed a test for mechanical aptitude. He wants to determine how reliable the test is over two
- 2. administrations spaced by 1 month. A study is conducted in which 10 students are given two administrations of the test, with the second administration being 1 month after the first. The data are given in the following table. Student Administration 1 Administration 2 1 10 10 2 12 15 3 20 17 4 25 25 5 27 32 6 35 37 7 43 40 8 40 38 9 32 30 10 47 49 a. Construct a scatter plot of the paired scores. b. Determine the value of r. c. Would it be fair to say that this is a reliable test? Explain using r2. 22. A social psychologist conducts a study to determine the relationship between religion and selfesteem. Ten eighth graders are randomly selected for the study. Each individual undergoes two tests, one measuring self-esteem and the other religious involvement. For the self-esteem test, the lower the score is, the higher self-esteem is; for the test measuring religious involvement, the higher the score is, the higher
- 3. religious involvement is. The selfesteem test has a range from 1 to 10 and the religious involvement test ranges from 0 to 50. For the purposes of this question, assume both tests are well standardized and of interval scaling. The following data are collected. Subject Religious Involvement Self-Esteem 1 5 8 2 25 3 3 45 2 4 20 7 5 30 5 6 40 5 7 1 4 8 15 4 9 10 7 10 35 3 a. If a relationship exists such that the more religiously involved one is, the higher actual self-esteem is, would you expect r computed on the provided values to be negative or positive? Explain. b. Compute r. Were you correct in your answer to part a? Chapter 7: 9. Given the set of paired X and Y scores, X 7 10 9 13 7 11 13 Y 1 2 4 3 3 4 5 a. Construct a scatter plot of the paired scores. Does the relationship appear linear? b. Determine the least-squares regression line for predicting Y given X.
- 4. c. Draw the regression line on the scatter plot. d. Using the relationship between X and Y, what value would you predict for Y if X 12? (Round to two decimal places.) The predicted Y is, 12. A statistics professor conducts a study to investigate the relationship between the performance of his studentson exams and their anxiety. Ten students fromhis class are selected for the experiment. Just before taking the final exam, the 10 students are given ananxiety questionnaire. Here are final exam and anxietyscores for the 10 students: Student No.1 2 3 4 5 6 7 89 10 Anxiety 28 4135 39 31 42 50 46 45 37 Final Exam 82 5863 89 92 64 55 70 51 72 a. On a piece of graph paper, construct a scatter plot of the paired scores. Use anxiety as the X variable. b. Describe the relationship shown in the graph. c. Assuming the relationship is linear, compute the value of Pearson r. d. Determine the least-squares regression line for predicting the final exam score, given the anxiety level. Should be Y be positive or negative? Why? SUMMARY OUTPUT
- 5. Regression Statistics Multiple R 0.6908 R Square 0.4772 Adjusted R Square 0.4118
- 7. F Significance F Regression 1 861.9592 861.9592 7.3013 0.0270 Residual 8 944.4408 118.0551 Total 9 1806.4000 Coefficients Standard Error t Stat P-value
- 8. Lower 95% Upper 95% Intercept 125.8830 21.1109 5.9629 0.0003 77.2013 174.5648 Anxiety -1.4285 0.5287 -2.7021 0.0270 -2.6476 -0.2094 e. Draw the least-squares regression line of part d on the scatter plot of part a. f. Based on the data of the 10 students, if a student has an anxiety score of 38, what value would you predict for her final exam score? (Round to two decimal places.) g. Calculate the standard error of estimate for predicting final exam scores from anxiety scores. 13. The sales manager of a large sporting goods store hasrecently started a national advertising campaign. Hehas kept a record of the monthly costs of the advertisingand the monthly profits. These are shown here The entries are in thousands of
- 9. dollars. Month Jan.Feb.Mar.Apr.May Jun. Jul. MonthlyAdvertising Cost10.0 14.011.4 15.6 16.8 11.2 13.2 Monthly Profit125 200160 150 210 110 125 a. Assuming a linear relationship exists, derive the least-squares regression line for predicting monthly profits from monthly advertising costs. SUMMARY OUTPUT Regression Statistics Multiple R 0.6958
- 10. R Square 0.4841 Adjusted R Square 0.3809 Standard Error 30.3395 Observations 7
- 12. Coefficients Standard Error t Stat P-value Lower 95% Upper 95% Intercept 11.6599 66.8350 0.1745 0.8683 -160.1449 183.4648 Monthly Advertising Cost 10.8284 4.9990 2.1661 0.0825 -2.0219 23.6787 The output tells us that the regression equation is, Monthly Profit = 11.6599+10.8284*Monthly Advertising Cost b. In August, the manager plans to spend $17,000 on advertising. Based on the data, how much profit should he expect that month? (Round to the nearest $1000.)
- 13. c. Given the relationship shown by the paired scores, can you think of a reason why the manager doesn’t spend a lot more money on advertising? 18. In Chapter 6, Problem 22 (p. 153), data were presentedfrom a study conducted to determine the relationshipbetween religious involvement and self-esteem. Thedata are again presented below. Subject ReligiousInvolvement Self-Esteem 1 5 8 2 25 3 3 45 2 4 20 7 5 30 5 6 40 5 7 1 4 8 15 4 9 10 7 10 35 3 a. Assuming a linear relationship, derive the leastsquaresregression line for predicting self-esteemfrom religious involvement. SUMMARY OUTPUT
- 14. Regression Statistics Multiple R 0.5626 R Square 0.3165 Adjusted R Square 0.2310 Standard Error 1.7440
- 16. Residual 8 24.3333 3.0417 Total 9 35.6000 Coefficients Standard Error t Stat P-value Lower 95% Upper 95% Intercept 6.4885 1.0363 6.2614 0.0002 4.0989 8.8782
- 17. Religious Involvement -0.0747 0.0388 -1.9246 0.0905 -0.1642 0.0148 b. Using this regression line, what value of selfesteemwould you predict for an eighth graderwhose value of religious involvement is 43? References Academic Web Services (n.d.).The Visual Learner – Statistics.Retrieved from: http://lc.gcumedia.com/hlt362v/the- visual-learner/quantitative.html. Pagano, R. (2013). Understanding Statistics in theBehavioral Sciences (10th ed.). Wadsworth-CengageLearning. Y-Values 60 75 70 72 54 83 80 65 60 100 80 68 73 97 85 90