Download as PDF, PPTX
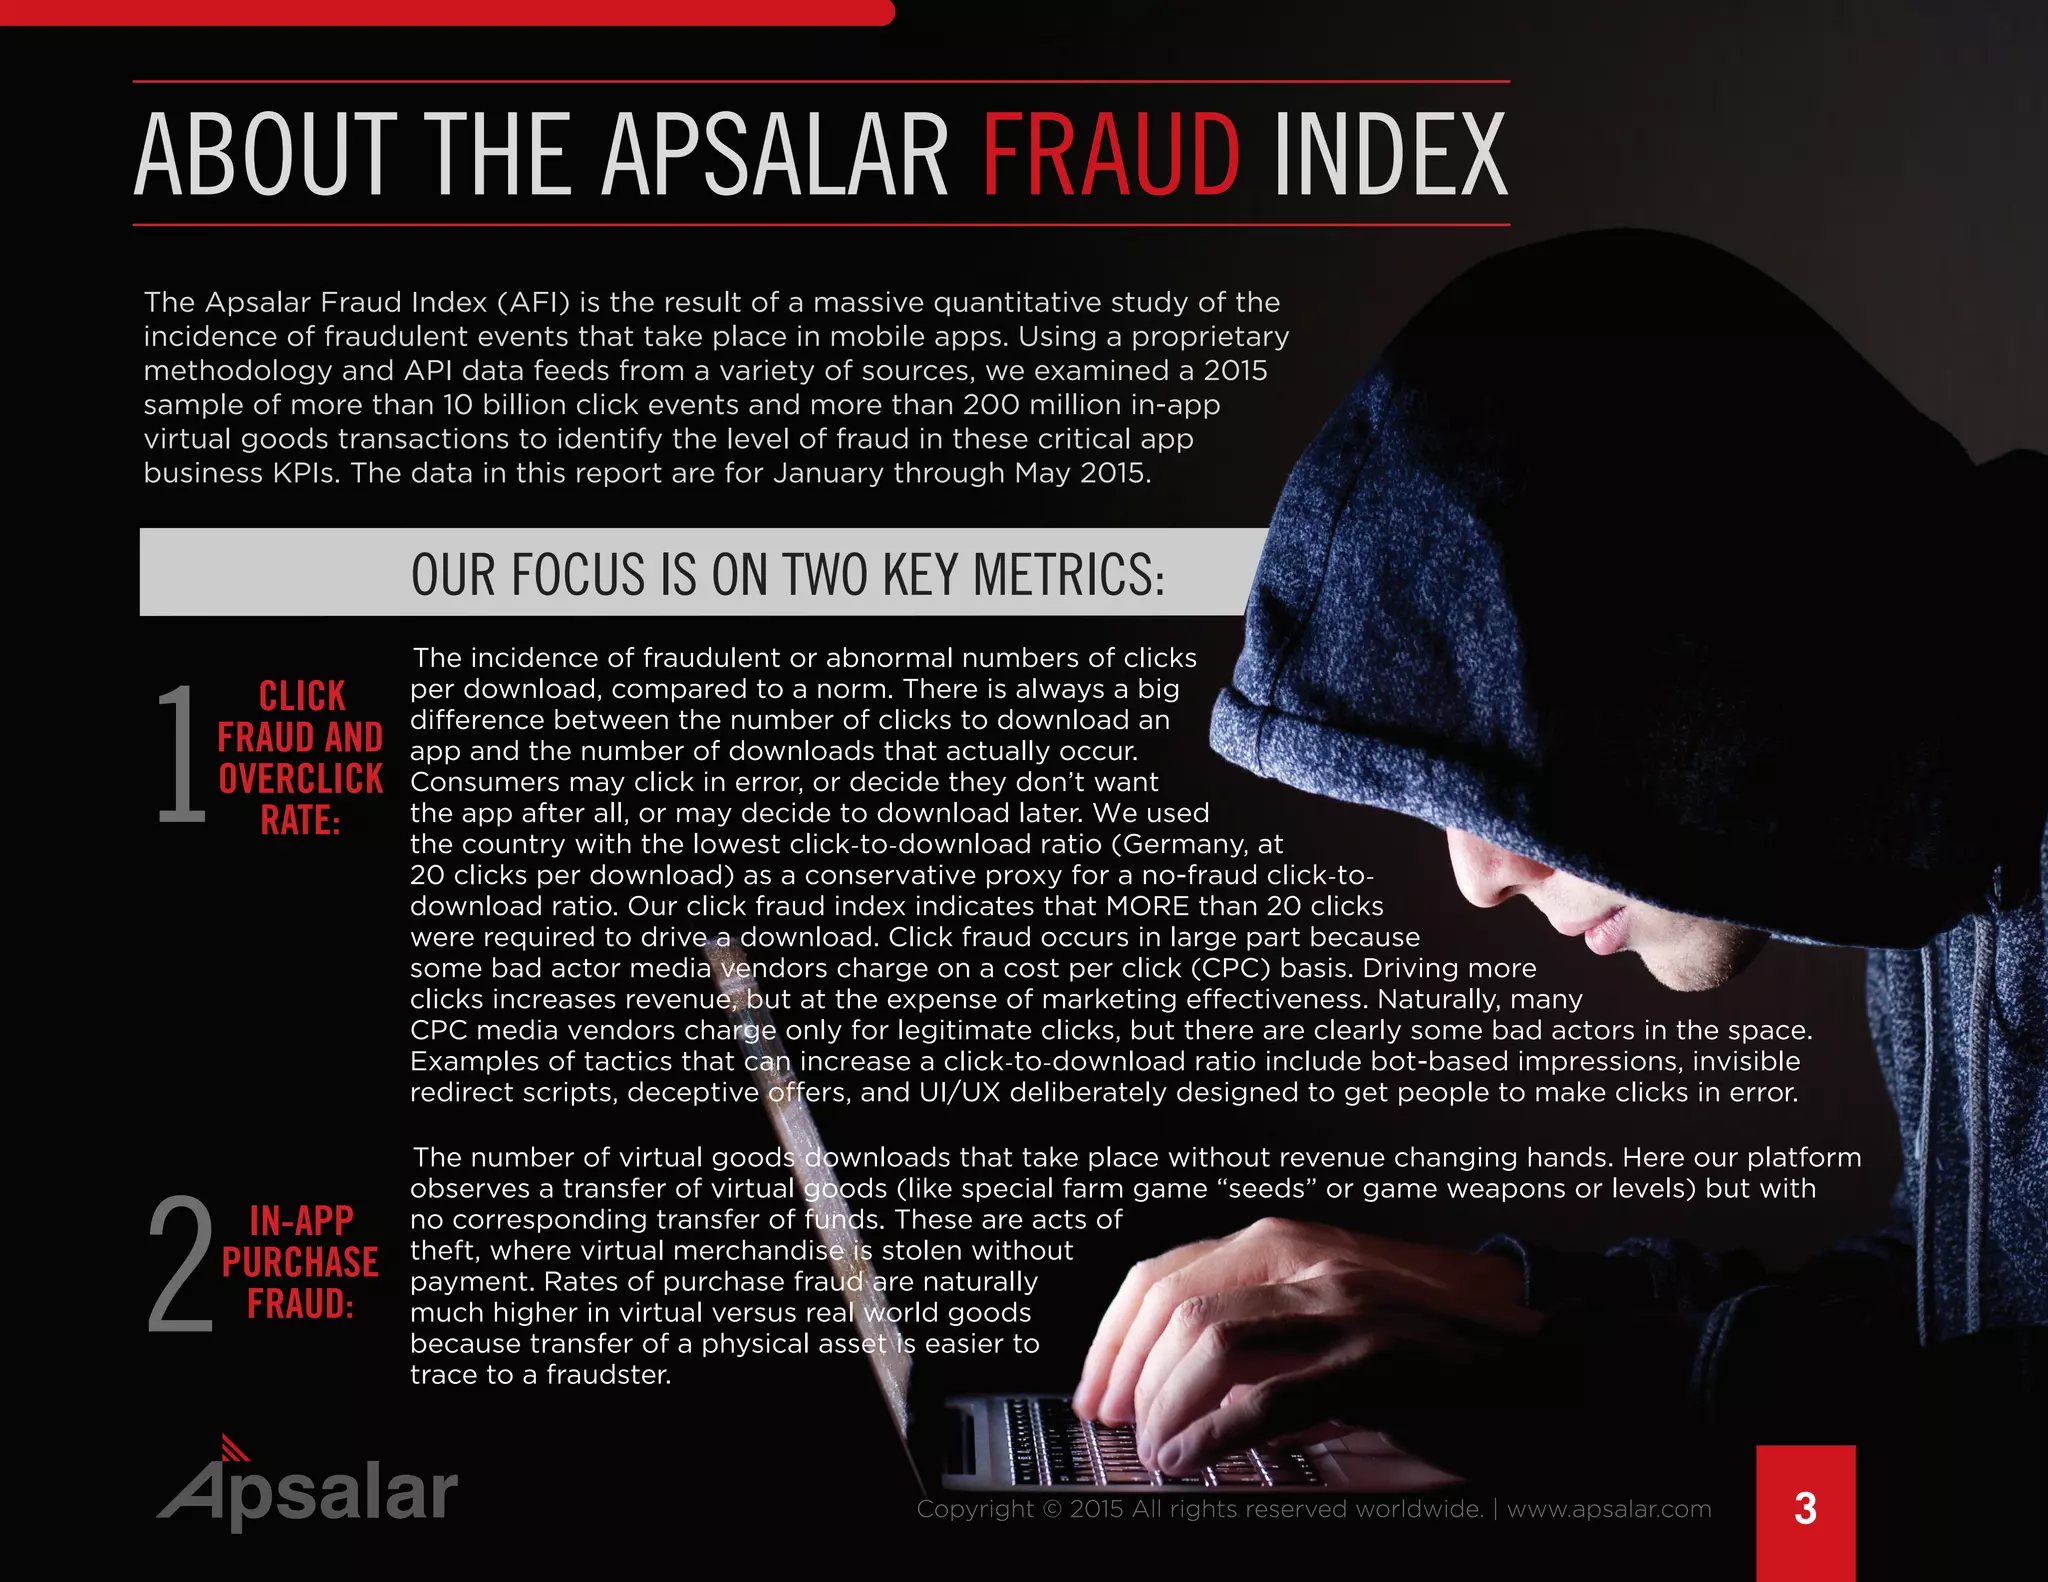
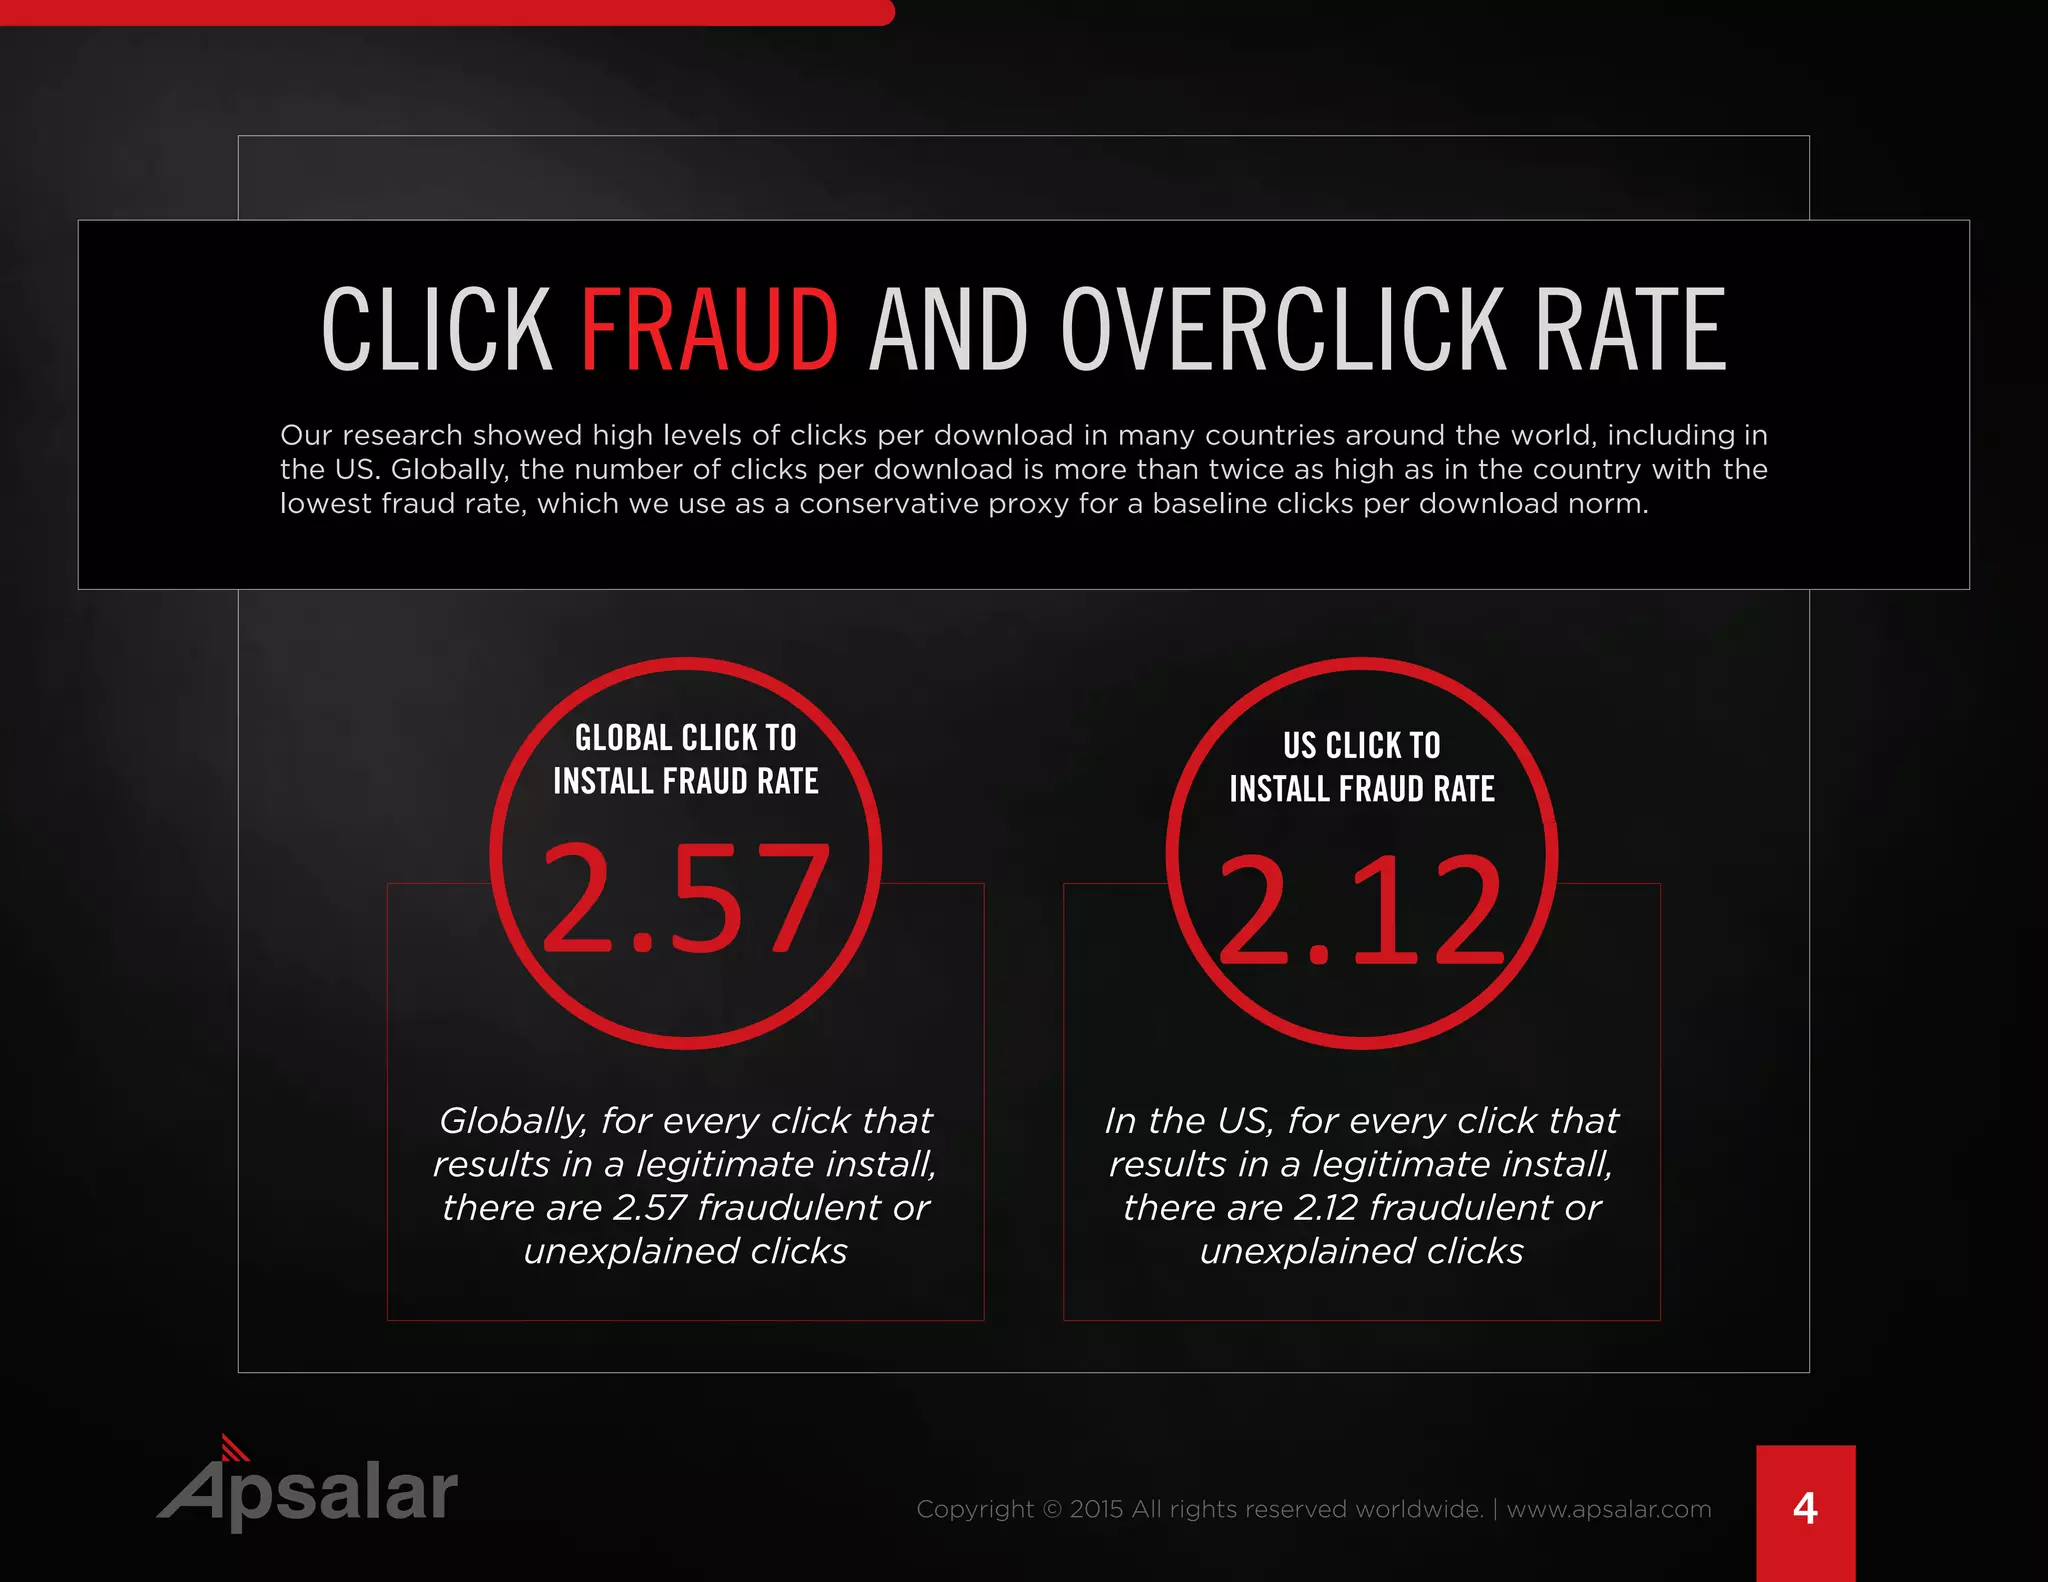

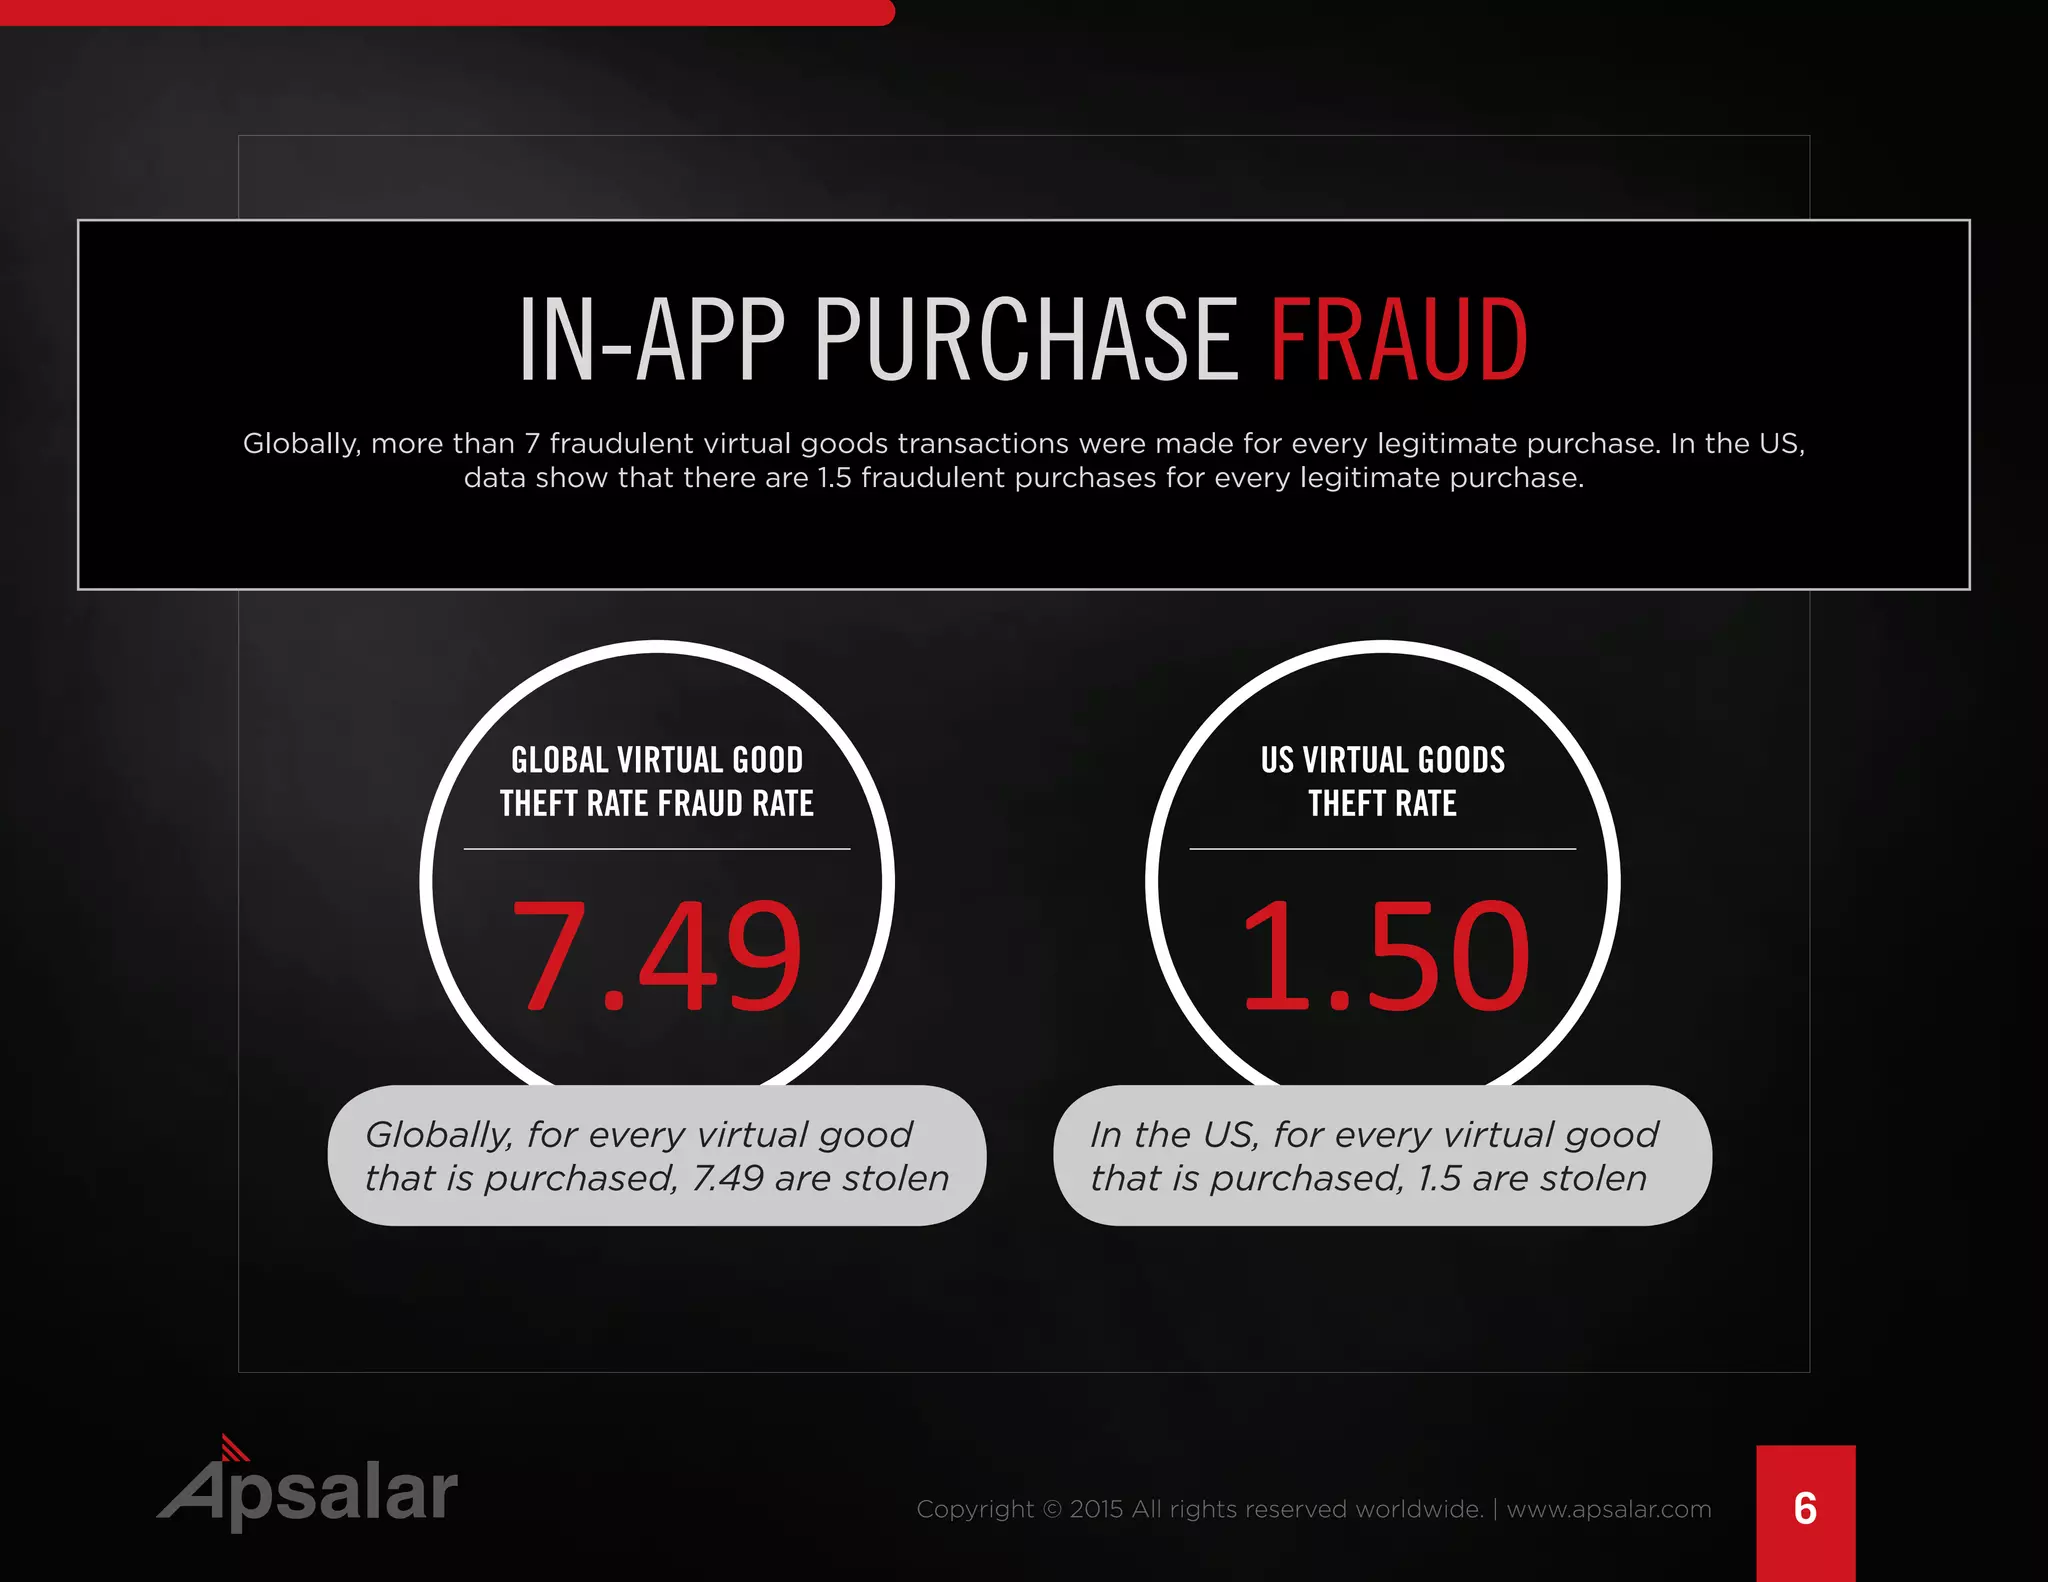
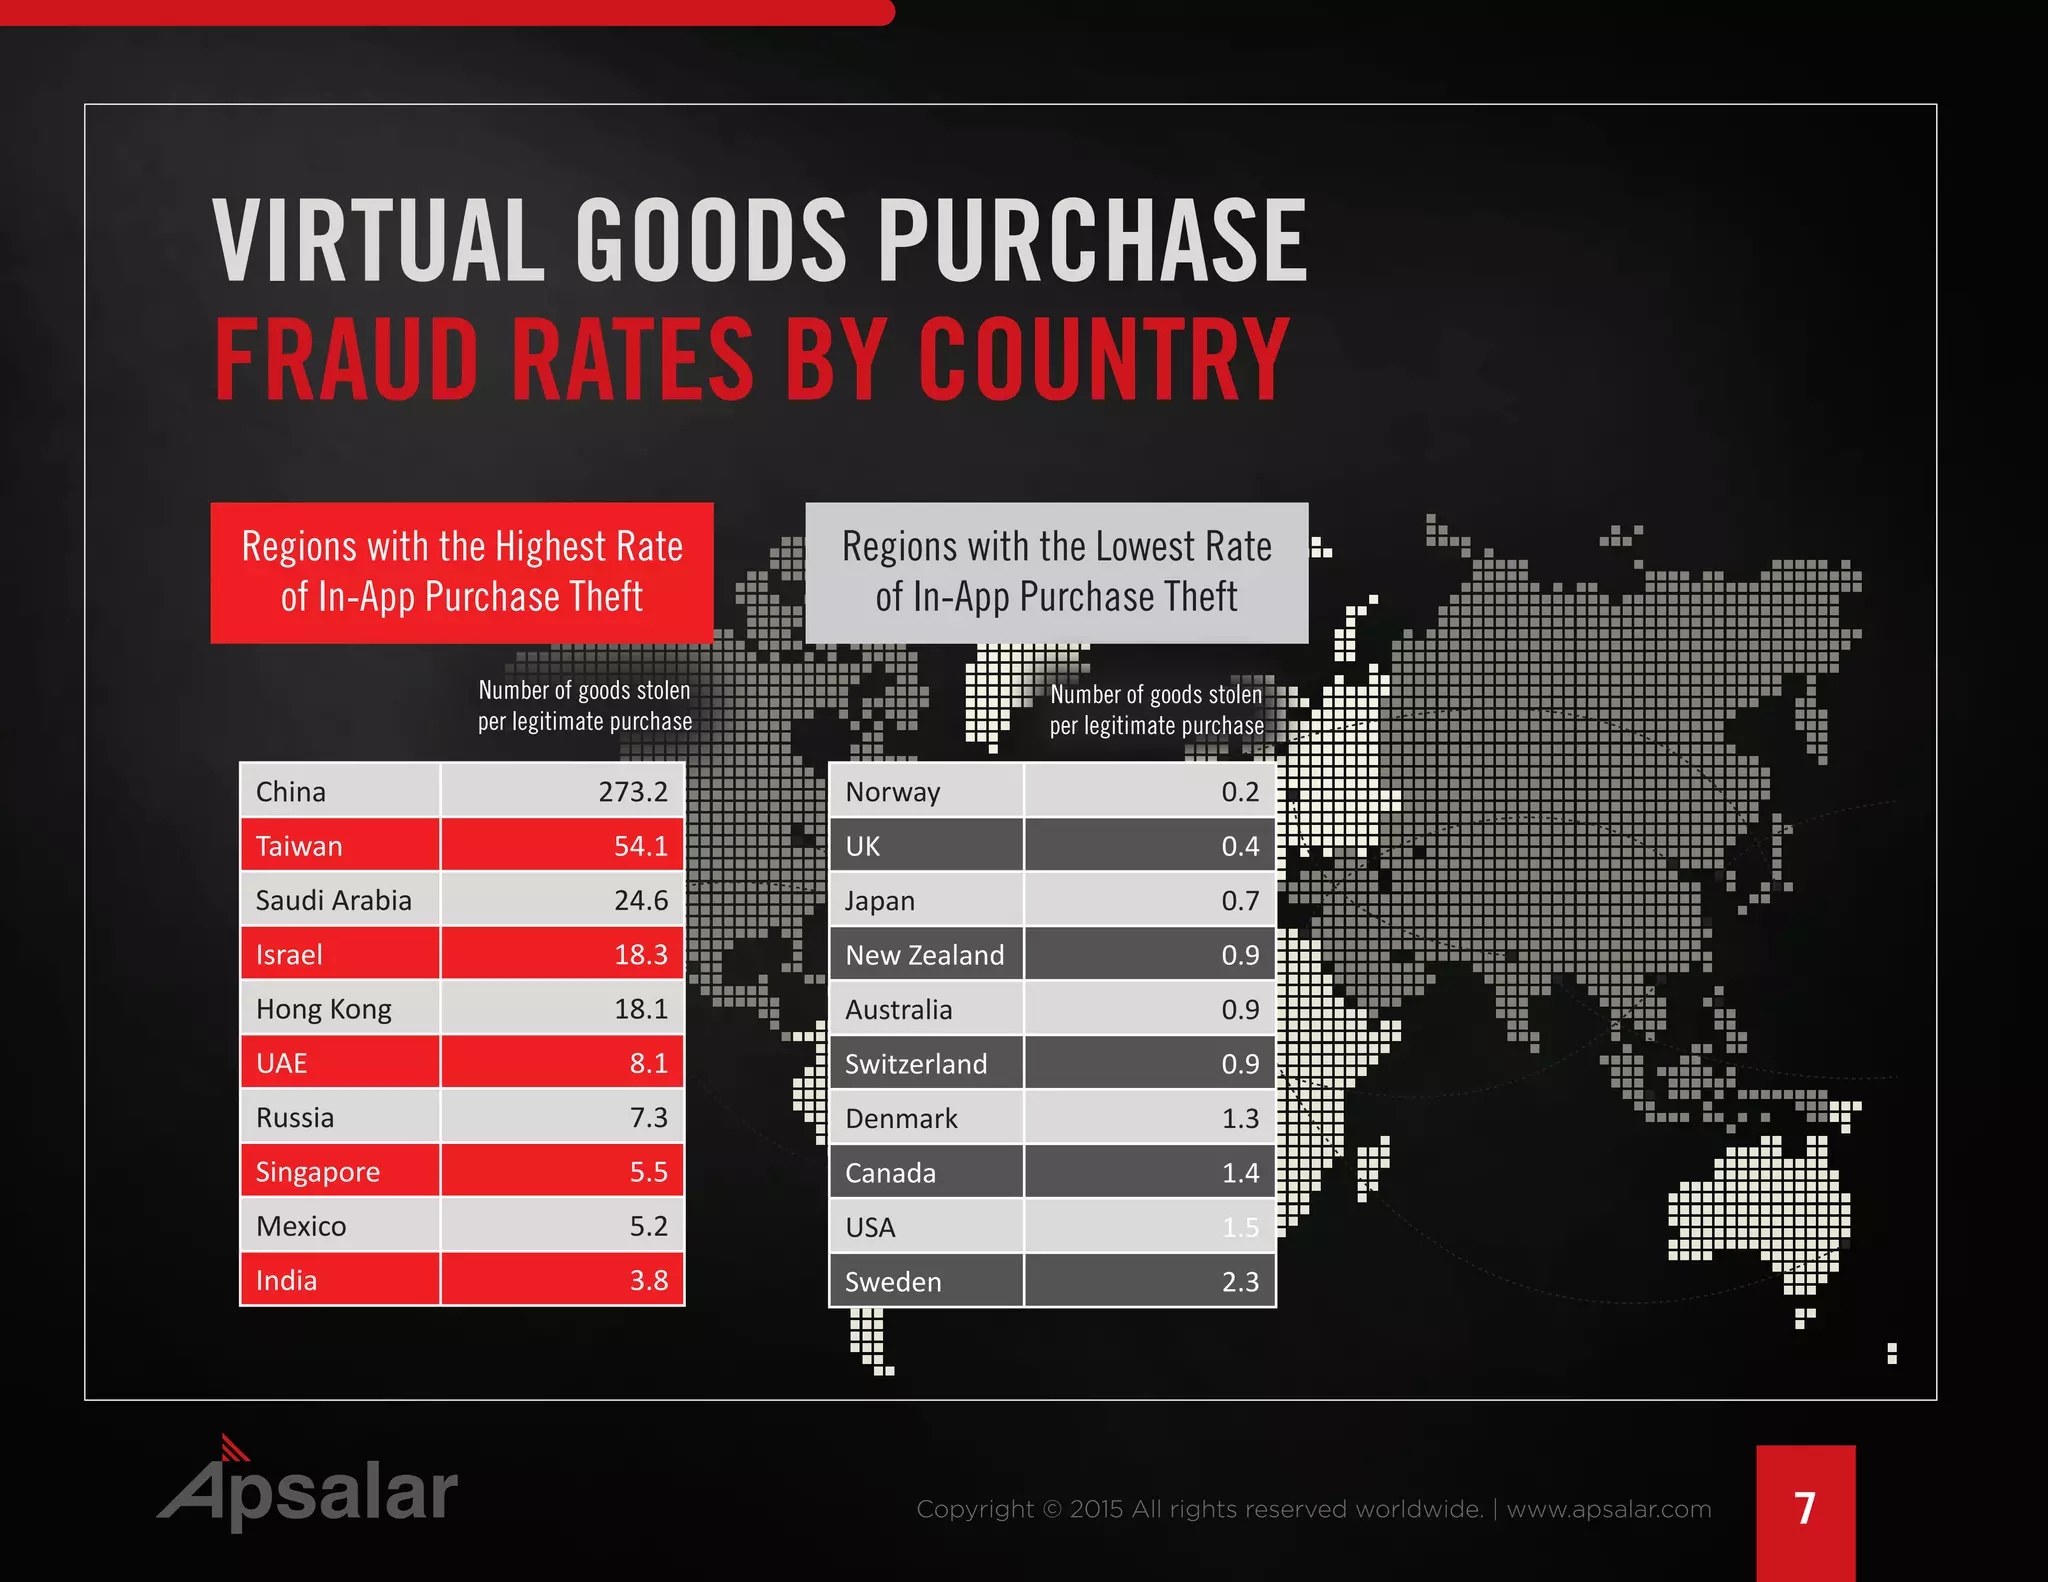
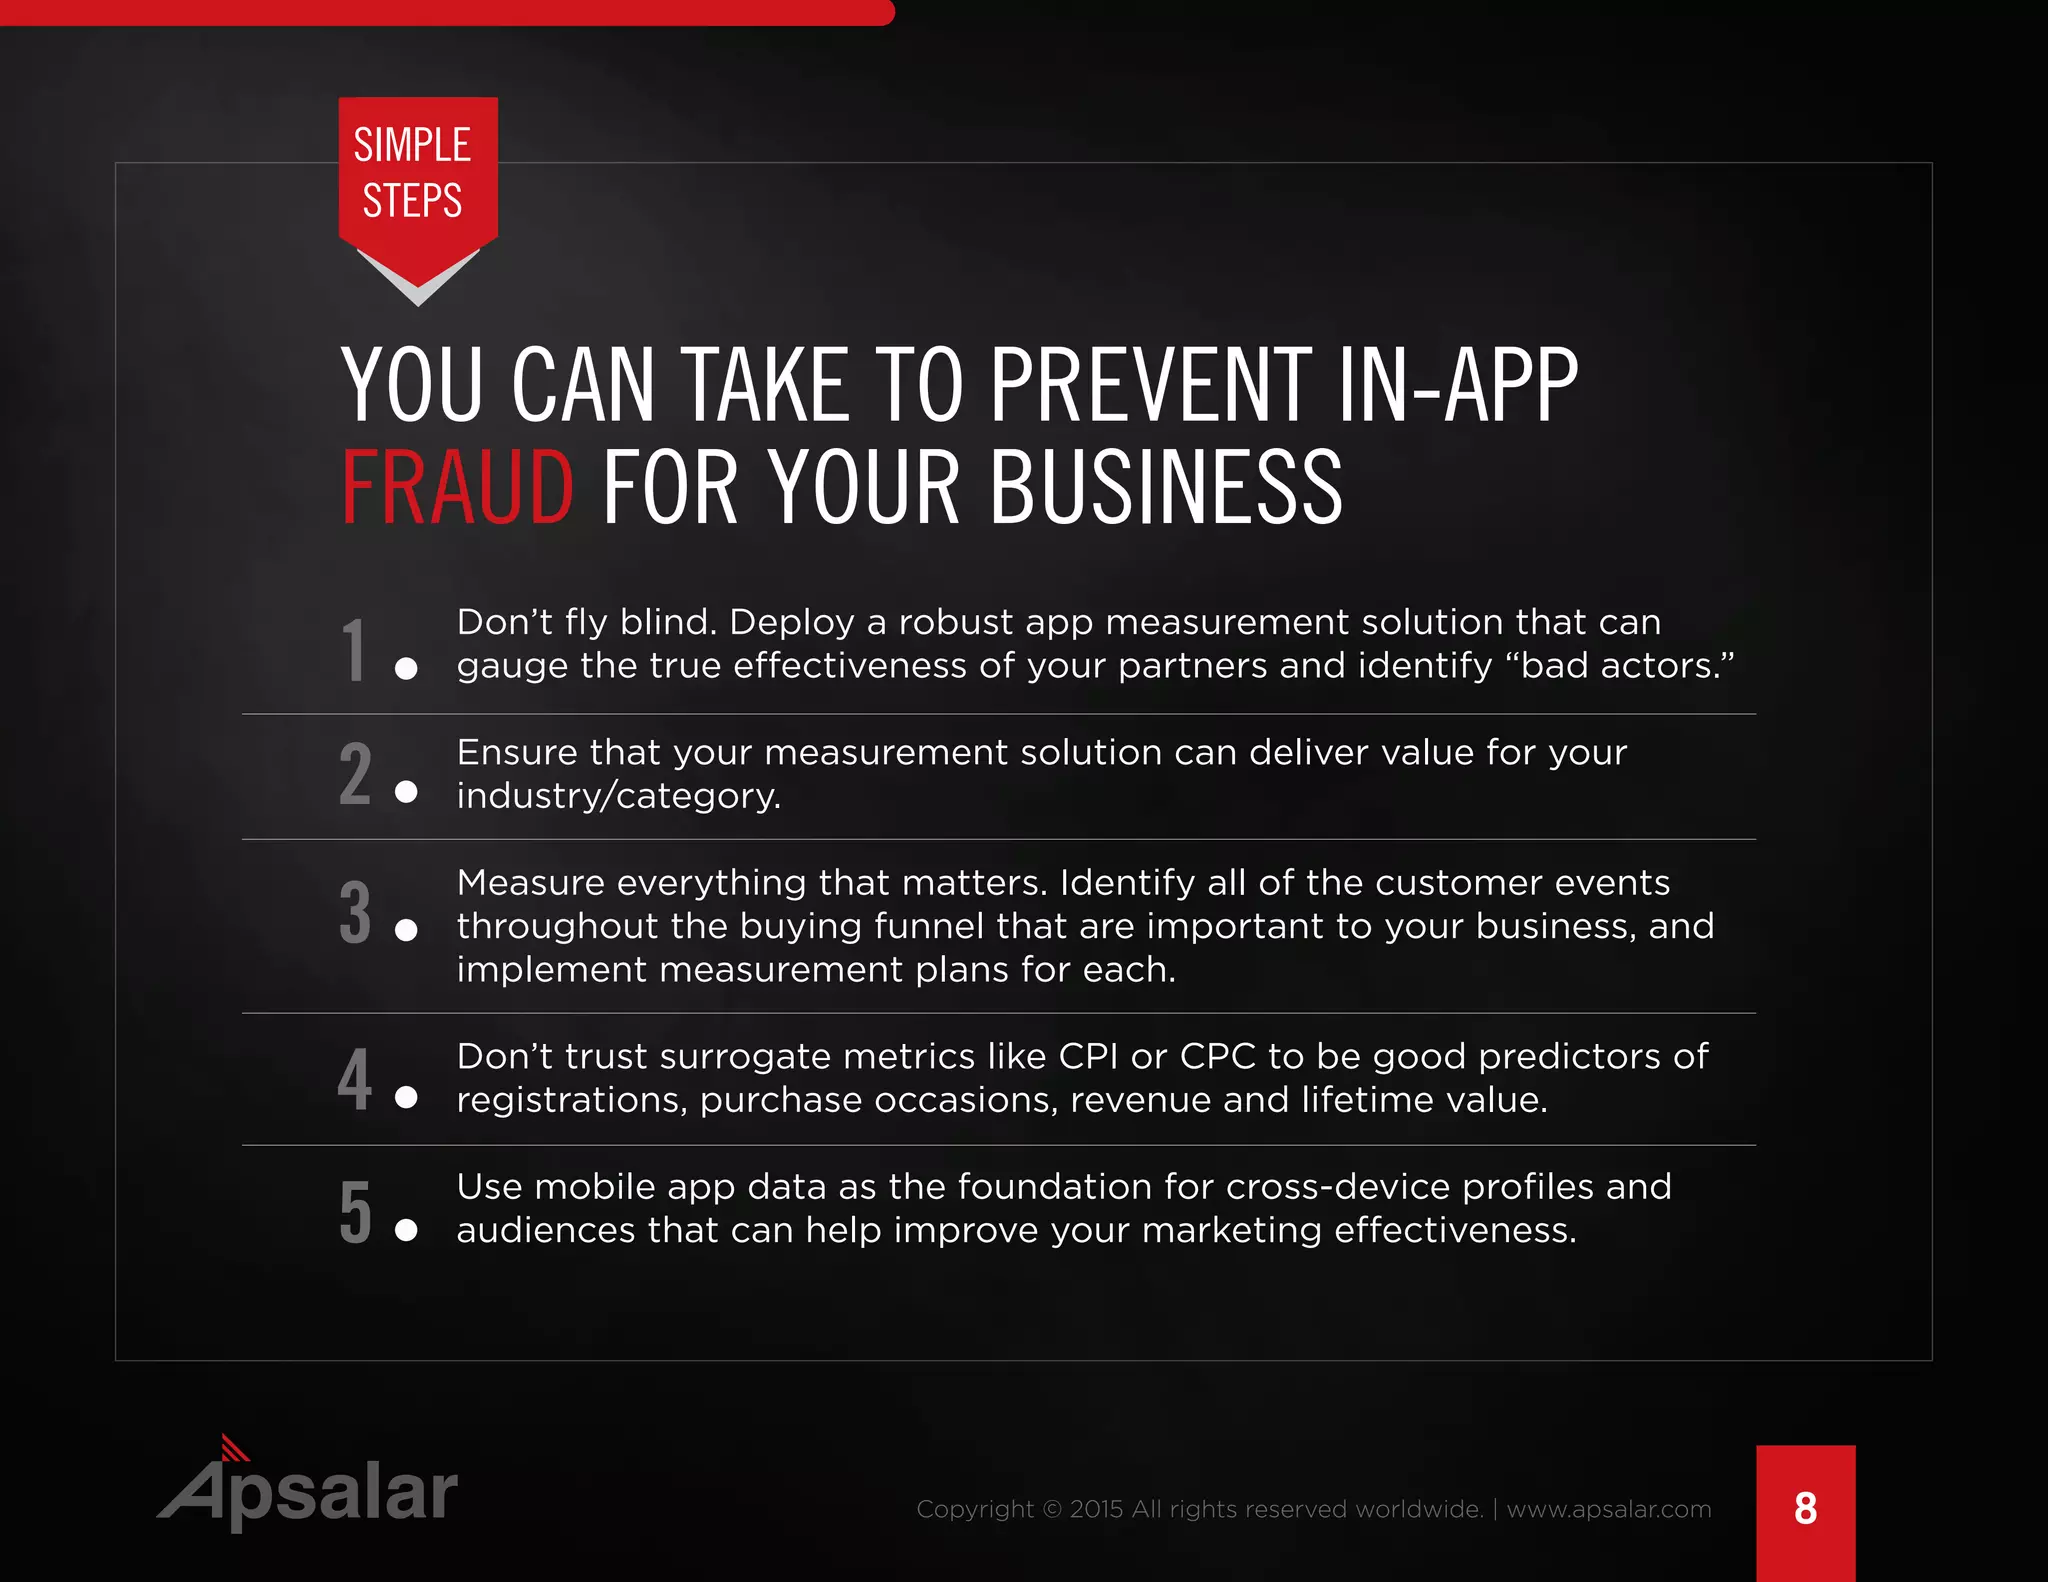

The document discusses findings from an investigation into instances of fraud related to in-app transactions and app installs. It presents data from a study of over 10 billion click events and 200 million in-app transactions from January to May 2015. The study found high levels of fraudulent clicks and in-app purchases globally and in many countries. Specifically, there were on average 2.57 fraudulent or unexplained clicks for every legitimate app install globally and over 7 fraudulent virtual goods transactions for every real purchase globally. The document provides fraud rates for various countries and recommends steps companies can take to prevent fraud.


