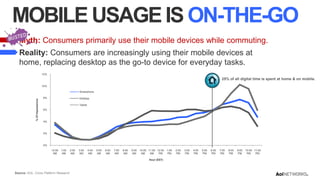
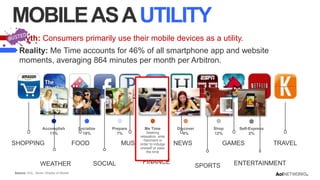
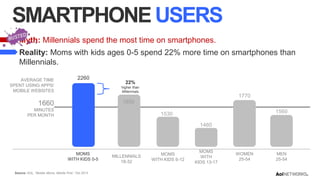
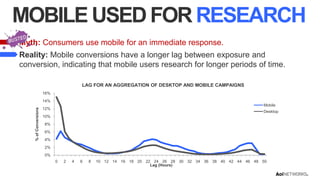
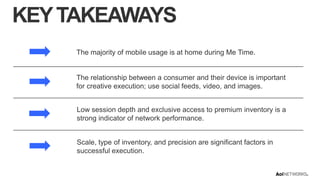
MOBILE
MYTHBUSTERS
Chad Gallagher
CONVENTIONAL WISDOM
“WHY EVERYONE SHOULD BE SHOPPING ONLINE – WHILE ACTUALLY IN STORES”
“34% OF IN-STORE CUSTOMERS COMPARE PRICES ON MOBILE DEVICES”
“LOCATION-BASED SERVICES CAN PUT BUSINESSES ON THE MAP”

“WALMART WANTS COSTUMERS TO USE ITS APPS IN STORES”

“SHOPKICK BEAMS COUPONS TO YOUR PHONE AS YOU WALK THROUGH THE MALL”
“HOW BETTER LOCATION DATA COULD MEAN MORE TARGETED MOBILE ADS”
THE STATE
OF MOBILE
MEDIA
WE ARE MOBILE.
THE MOBILE ADVERTISING
ECOSYSTEM
Ad Servers

App Analytics

DSPs

Ad Exchanges
SSPs

Ad Networks

HyperLocal

A

P

d

u

v

b

e

l

r

u
d

i

s

e

h

i

i

s

t

n

e

e

DMP’s and Data
Aggregators

r
s

A

Mobile Data
Providers

Mobile Video

Rich Media

r

s

c
e
THE YEAR OF
MOBILE?

2 HOURS, 19 MINUTES

2 HOURS, 21 MINUTES
2013 Mobile Ad Spend = $8B
(5% of total Ad Spend)

Source: eMarketer, July 2013
MYTH VS. REALITY
MOBILE USAGE
MOBILE USAGE IS ON-THE-GO
Myth: Consumers primarily use their mobile devices while commuting.
Reality: Consumers are increasingly using their mobile devices at
home, replacing desktop as the go-to device for everyday tasks.
12%

25% of all digital time is spent at home & on mobile.
10%

% Of Impressions

Smartphone
8%

Desktop
Tablet

6%

4%

2%

0%
12:00
AM

1:00
AM

2:00
AM

3:00
AM

4:00
AM

5:00
AM

6:00
AM

7:00
AM

8:00
AM

9:00
AM

10:00 11:00 12:00
AM
AM
PM

Hour (EST)

Source: AOL, Cross Platform Research

1:00
PM

2:00
PM

3:00
PM

4:00
PM

5:00
PM

6:00
PM

7:00
PM

8:00
PM

9:00
PM

10:00 11:00
PM
PM
MOBILE AS A UTILITY
Myth: Consumers primarily use their mobile devices as a utility.

Reality: Me Time accounts for 46% of all smartphone app and website
moments, averaging 864 minutes per month per Arbitron.

Accomplish
11%

SHOPPING
WEATHER
Source: AOL, Seven Shades of Mobile

Socialize
18%

Prepare
7%

FOOD

Me Time
Seeking
relaxation, ente
rtainment in
order to indulge
oneself or pass
the time

MUSIC
SOCIAL

FINANCE

Discover
4%

Shop
12%

NEWS

Self-Express
2%

GAMES

SPORTS

TRAVEL

ENTERTAINMENT
SMARTPHONE USERS
Myth: Millennials spend the most time on smartphones.
Reality: Moms with kids ages 0-5 spend 22% more time on smartphones than
Millennials.
AVERAGE TIME
SPENT USING APPS/
MOBILE WEBSITES

2260

22%
higher than
Millennials

1770
1850

1660
MINUTES
PER MONTH

1560

1530
1460

Adeffectiveness
MOMS
WITH KIDS 0-5
Source: AOL, “Mobile Moms, Mobile First,” Oct 2013

MILLENNIALS
18-32

MOMS
WITH KIDS 6-12

MOMS
WITH
KIDS 13-17

WOMEN
25-54

MEN
25-54
MOBILE USED FOR RESEARCH
Myth: Consumers use mobile for an immediate response.
Reality: Mobile conversions have a longer lag between exposure and
conversion, indicating that mobile users research for longer periods of time.
LAG FOR AN AGGREGATION OF DESKTOP AND MOBILE CAMPAIGNS
16%

% of Conversions

14%
Mobile

12%

Desktop

10%
8%
6%
4%
2%

0%
0

2

4

6

8

10 12 14 16 18 20 22 24 26 28 30 32 34 36 38 40 42 44 46 48 50
Lag (Hours)
MCOMMERCE
Myth: Customers won’t buy on mobile.

Reality: People do buy on mobile; mobile advertising is going to be an integral
part of the future of mCommerce.

TELECOM

RETAIL

(ex: Cell Phone Plan)

(ex: Buying a Shirt)

35%

37%

AUTOMOBILE
(ex: Configure a Car)

28%

TRAVEL
(ex: Booking a Hotel)

22%
COOKIES
Myth: Conversion tracking is not reliable; cookies do not work in mobile.
Reality:
Accepts 3rd Party Cookies

0 0

Mobile
WEB

5%

30%

70%

Mobile
APP

0
95%
MOBILE INVENTORY
Myth: 100 million uniques is an accurate measure of mobile vendor performance.
Reality: Most mobile networks only have access to unsold inventory on mobile
exchanges.
Most
mobile networks only have
access to this inventory.

10% 15%
15%

Direct Sales (Class 1)
Direct Sales Non
-Reserve (Class 2)
Network/SSP Block Buys
Remnant Inventory

60%
SESSION DEPTH
Myth: All impressions are created equal.

Response Rate

Reality: Low session depth impressions have the highest conversion rates.

Session Depth
(Impressions)

1

2

3

Typically
Sold Class 1

4

5

6

7

8

9

Typically Sold Class 2
or Networks/SSP Block

(Rarely Appears in RTB) (Sometimes Appears in RTB)

10 11 12 13 14 15 16 17 18 19 20+
Typically Goes to Networks or RTB
(Most of the Composition of RTB)
COST PER INSTALL CAMPAIGNS
Myth: Cost per Installation (CPI) cost basis is the only effective method to drive
app downloads.
Reality: CPI is valuable, but may limit your audience; rely on CPM or CPC first.
Be wary of incentivized app installs which display much lower lifetime value.
CROSS SCREEN TARGETING
Myth: The same user can be reached easily across screens.
Reality: A unique identifier links across screens, and privacy compliant device
identifiers are needed to consistently track a single user across channels.

DETERMINISTIC
O&O User Logins

MOBILE
ONLINE

PROBABILISTIC
Educated Guess

3rd Party Publishers

IP Address / Fingerprinting

Limited Scale

Behavioral Patterns

Scalable
HYPER-LOCAL TARGETING
Myth: Mobile networks can deliver geo-fencing campaigns at scale.

Reality: The value exchange of consumers sharing their location is important
and thus limited. Use mobile geo targeting as a strategy, but identify tactics
based on capabilities.

25%

of mobile impressions occur onthe-go.

<8%

of mobile impressions contain
latitude & longitude for
precise accuracy.
MOBILE INTERSTITALS
Myth: Interstitials are the new pop-up and brands should avoid them.

Reality: Users rarely complain so long as the unit functions properly, loads on
time, can clearly be closed, and offers some level of utility.
CREATIVE BEST PRACTICES
Myth: Desktop creative will perform just as well on mobile.
Reality: Advertisers can increase consumer engagement by:
• Using four words or fewer.
• Using three colors or fewer.
• Including a strong call to action and humans.
Tap to Expand CTA

Source: JumpTap Creative eBook 2013
KEY TAKEAWAYS
The majority of mobile usage is at home during Me Time.

The relationship between a consumer and their device is important
for creative execution; use social feeds, video, and images.
Low session depth and exclusive access to premium inventory is a
strong indicator of network performance.

Scale, type of inventory, and precision are significant factors in
successful execution.
Q&A

Chad Gallagher of Advertising.com - Mobile Myth Busters at SIC2013

  • 1.
  • 2.
    CONVENTIONAL WISDOM “WHY EVERYONESHOULD BE SHOPPING ONLINE – WHILE ACTUALLY IN STORES” “34% OF IN-STORE CUSTOMERS COMPARE PRICES ON MOBILE DEVICES” “LOCATION-BASED SERVICES CAN PUT BUSINESSES ON THE MAP” “WALMART WANTS COSTUMERS TO USE ITS APPS IN STORES” “SHOPKICK BEAMS COUPONS TO YOUR PHONE AS YOU WALK THROUGH THE MALL” “HOW BETTER LOCATION DATA COULD MEAN MORE TARGETED MOBILE ADS”
  • 3.
  • 4.
  • 5.
    THE MOBILE ADVERTISING ECOSYSTEM AdServers App Analytics DSPs Ad Exchanges SSPs Ad Networks HyperLocal A P d u v b e l r u d i s e h i i s t n e e DMP’s and Data Aggregators r s A Mobile Data Providers Mobile Video Rich Media r s c e
  • 6.
    THE YEAR OF MOBILE? 2HOURS, 19 MINUTES 2 HOURS, 21 MINUTES 2013 Mobile Ad Spend = $8B (5% of total Ad Spend) Source: eMarketer, July 2013
  • 7.
  • 8.
    MOBILE USAGE ISON-THE-GO Myth: Consumers primarily use their mobile devices while commuting. Reality: Consumers are increasingly using their mobile devices at home, replacing desktop as the go-to device for everyday tasks. 12% 25% of all digital time is spent at home & on mobile. 10% % Of Impressions Smartphone 8% Desktop Tablet 6% 4% 2% 0% 12:00 AM 1:00 AM 2:00 AM 3:00 AM 4:00 AM 5:00 AM 6:00 AM 7:00 AM 8:00 AM 9:00 AM 10:00 11:00 12:00 AM AM PM Hour (EST) Source: AOL, Cross Platform Research 1:00 PM 2:00 PM 3:00 PM 4:00 PM 5:00 PM 6:00 PM 7:00 PM 8:00 PM 9:00 PM 10:00 11:00 PM PM
  • 9.
    MOBILE AS AUTILITY Myth: Consumers primarily use their mobile devices as a utility. Reality: Me Time accounts for 46% of all smartphone app and website moments, averaging 864 minutes per month per Arbitron. Accomplish 11% SHOPPING WEATHER Source: AOL, Seven Shades of Mobile Socialize 18% Prepare 7% FOOD Me Time Seeking relaxation, ente rtainment in order to indulge oneself or pass the time MUSIC SOCIAL FINANCE Discover 4% Shop 12% NEWS Self-Express 2% GAMES SPORTS TRAVEL ENTERTAINMENT
  • 10.
    SMARTPHONE USERS Myth: Millennialsspend the most time on smartphones. Reality: Moms with kids ages 0-5 spend 22% more time on smartphones than Millennials. AVERAGE TIME SPENT USING APPS/ MOBILE WEBSITES 2260 22% higher than Millennials 1770 1850 1660 MINUTES PER MONTH 1560 1530 1460 Adeffectiveness MOMS WITH KIDS 0-5 Source: AOL, “Mobile Moms, Mobile First,” Oct 2013 MILLENNIALS 18-32 MOMS WITH KIDS 6-12 MOMS WITH KIDS 13-17 WOMEN 25-54 MEN 25-54
  • 11.
    MOBILE USED FORRESEARCH Myth: Consumers use mobile for an immediate response. Reality: Mobile conversions have a longer lag between exposure and conversion, indicating that mobile users research for longer periods of time. LAG FOR AN AGGREGATION OF DESKTOP AND MOBILE CAMPAIGNS 16% % of Conversions 14% Mobile 12% Desktop 10% 8% 6% 4% 2% 0% 0 2 4 6 8 10 12 14 16 18 20 22 24 26 28 30 32 34 36 38 40 42 44 46 48 50 Lag (Hours)
  • 12.
    MCOMMERCE Myth: Customers won’tbuy on mobile. Reality: People do buy on mobile; mobile advertising is going to be an integral part of the future of mCommerce. TELECOM RETAIL (ex: Cell Phone Plan) (ex: Buying a Shirt) 35% 37% AUTOMOBILE (ex: Configure a Car) 28% TRAVEL (ex: Booking a Hotel) 22%
  • 13.
    COOKIES Myth: Conversion trackingis not reliable; cookies do not work in mobile. Reality: Accepts 3rd Party Cookies 0 0 Mobile WEB 5% 30% 70% Mobile APP 0 95%
  • 14.
    MOBILE INVENTORY Myth: 100million uniques is an accurate measure of mobile vendor performance. Reality: Most mobile networks only have access to unsold inventory on mobile exchanges. Most mobile networks only have access to this inventory. 10% 15% 15% Direct Sales (Class 1) Direct Sales Non -Reserve (Class 2) Network/SSP Block Buys Remnant Inventory 60%
  • 15.
    SESSION DEPTH Myth: Allimpressions are created equal. Response Rate Reality: Low session depth impressions have the highest conversion rates. Session Depth (Impressions) 1 2 3 Typically Sold Class 1 4 5 6 7 8 9 Typically Sold Class 2 or Networks/SSP Block (Rarely Appears in RTB) (Sometimes Appears in RTB) 10 11 12 13 14 15 16 17 18 19 20+ Typically Goes to Networks or RTB (Most of the Composition of RTB)
  • 16.
    COST PER INSTALLCAMPAIGNS Myth: Cost per Installation (CPI) cost basis is the only effective method to drive app downloads. Reality: CPI is valuable, but may limit your audience; rely on CPM or CPC first. Be wary of incentivized app installs which display much lower lifetime value.
  • 17.
    CROSS SCREEN TARGETING Myth:The same user can be reached easily across screens. Reality: A unique identifier links across screens, and privacy compliant device identifiers are needed to consistently track a single user across channels. DETERMINISTIC O&O User Logins MOBILE ONLINE PROBABILISTIC Educated Guess 3rd Party Publishers IP Address / Fingerprinting Limited Scale Behavioral Patterns Scalable
  • 18.
    HYPER-LOCAL TARGETING Myth: Mobilenetworks can deliver geo-fencing campaigns at scale. Reality: The value exchange of consumers sharing their location is important and thus limited. Use mobile geo targeting as a strategy, but identify tactics based on capabilities. 25% of mobile impressions occur onthe-go. <8% of mobile impressions contain latitude & longitude for precise accuracy.
  • 19.
    MOBILE INTERSTITALS Myth: Interstitialsare the new pop-up and brands should avoid them. Reality: Users rarely complain so long as the unit functions properly, loads on time, can clearly be closed, and offers some level of utility.
  • 20.
    CREATIVE BEST PRACTICES Myth:Desktop creative will perform just as well on mobile. Reality: Advertisers can increase consumer engagement by: • Using four words or fewer. • Using three colors or fewer. • Including a strong call to action and humans. Tap to Expand CTA Source: JumpTap Creative eBook 2013
  • 21.
    KEY TAKEAWAYS The majorityof mobile usage is at home during Me Time. The relationship between a consumer and their device is important for creative execution; use social feeds, video, and images. Low session depth and exclusive access to premium inventory is a strong indicator of network performance. Scale, type of inventory, and precision are significant factors in successful execution.
  • 22.

Editor's Notes

  • #3 This conventional wisdom is supported by more and more media headlines, such as these, that remind us of the amazing opportunity that we’re going after: the opportunity to tap the on-the-go consumer.
  • #4 The goal of this section is to understand the significant players in the ad serving and content landscape
  • #6 The behind the scene process that connects Advertisers &amp; Publishers can be complex and include many players.Companies under the same category are not necessary similar as well as companies grouped in different categories might have a lot in common. There is overlap.Ad Agency Companies include:OmnicomGroup, Publicis, Razorfish, IPG, At&amp;t Interactive, Icrossing, Innovation Interactive, AKQA,LBI, Havas, Aegis Media, MDC Partners, Web Visible, Reach Local andYodleMedia Buying Platforms Companies include:OmnicomMediaGroup –TradingDesk, Vivaki, Cadreon, Atom, B3, Adnetik and Varickmedia.Online Creative Optimization Companies include:Sprout, Say Media, Adisn, SnapAds,Teracent, TUMRI, Adroit, Dapper, Struq, Choicestream, Spongecell and AdReadyData OptimizationTechnology that allows personalize campaigns to reach certain audiences based on demographics, location, etc.The platform must process hundreds of variables and automatically discover which subsets have the greatest predictive power, including any multivariate relationship. Data Optimization Companies include:Aggregate knowledge, Bizo, Adchemy, Quantcast, Permuto (buysight), TellApart, RedAril and JovianDataDemand-side platforms (DSPs)Sophisticated decision engines that calculate the best value for each individual impressionThese are tools for media buyers ― planning agencies, trading desks,  creative optimization, data optimization, analytics and ad serving.DSPs Companies include:MediaMath, Invitemedia, efficientfrontier, appnexus, triggit, xa.net, Turn, BransScreen, AdBuyer, and x+1,Ad Exchanges are technology platforms that facilitate the bidded buying and selling of online media advertising inventory from multiple ad networks.Supply-side platforms. These are tools for publishers ― ad servers and optimization tools as well as inventory tools for both yield optimization and ad networks;Ad Exchange and SSPs Companies include:Doubleclick, RightMedia, Advertising.com , ADECN, ContentWeb, AdBrite, OpenX,etcAnalytics Companies include:Omniture, Unica, Coremetrics, Webtrends, Tracksimple and Google Analytics.Verification and Attribution Companies include:Adsafe, DoubleVerify, Anchor, Ad-Juster, Vizu, Convertro, Adxpose, VisualIQ, Adometry, etc.Ad NetworksAn Ad Network is a group of Web sites which can be purchased through a single sales entity.Ad Network-Horizontal Companies include:Apt, Microsoft Media Network, Aol, Tribal Fusion, RealMedia, Undertone Networks, BurstMedia, Traffic, AdDynamix, ShortTail, Casale,Say, TitalTV, Tremormedia, Ooyala. BrightRoll, ScanScout and adonion,Vertical Ad Networks Companies include:NetShelter, Jumpstart, Technorati, IDG Tech Network, Spotgenic, Gorilla Nation and Glam.Targeted Audience Ad Networks Companies include:Specificmedia, Turn, Chango, Lucidmedia and Collectivemedia.Performance Ad Networks Companies include:LinkShare, MediatTrust, Tatto Media and Adteractive.Mobile Ad Networks Companies include:Admob, Quattro, Jumptop, inMobi and TransperaYield Optimization Technology Companies include:Rubicon, PubMatic and AdMeld.Publisher Tools Companies include:Fattail, Yieldex,Lijit and Scout Analytics.Data Suppliers Companies include:Experian, Acxiom, Datalogic and eBureau.Data Management Platforms Companies include:Bluekai, Brilig, RapLeaf and AlmondNet,Sharing Data &amp; Social Tools Companies include:Facebook, Twitter, ShareThis and Gigya.Ad Servers Technology Companies include:Doubleclick, pointroll, Openx, Adtech and Mediamind.Ad Ops Technology Companies include:DDS, Solbright, MediaBank, Operative, Centro, Facilitate, TraffiQ, Adify, Theorem, etc.
  • #7 In 2013, people are spending 2 hours &amp; 20 minutes on mobile devices per day.Mobile spend accounts for only 5% of total ad spend in 2013, projected to rise to over 17% in 2017.
  • #10 View mobile behaviors very superficially based on the discrete things that people do on their smartphones: Shop, listen to music, check out scores, get directionsMarketers have adapted their mobile content or their messages to be fully optimized for HOW the consumer is using mobile, instead WHY. Me Time accounts for 46% of all smartphone app and website moments averaging 864 minutes per month per Arbitron, this is more than twice the next biggest moment, socialize, and bigger than accomplish, socialize, and prepare combined. 70% of these moments are lean back moments and only 30% are lean forward moments. The me time market are those moments when a person is relaxing or watching TV with a goal of having fun. People select apps/sites that help them pass the time and relax where the smartphone is playing the role of time killer or gaming buddy.
  • #11 Mom spends 23% of her mobile moments to socialize. - She misses seeing her friends in person but her smartphone helps her to stay connected.She spends 39% of mobile moments for “me time” - Moms need to escape from the pressures of being a mom and take time out for herselfShe spends 12% of her mobile moments shopping - She’s responsible for buying products for the household that she might not be familiar with
  • #13 Reality: The size of the U.S. mobile advertising market reached nearly $800 million by the end of 2010, and the worldwide market for mobile advertising is expected to grow to $13.5 billion in 2015. Surely all of these advertisers aren’t spending money without expecting to see a return. More importantly, customers are becoming increasingly comfortable with buying on their mobile devices. Just as people used to say that “Amazon can’t make money because people aren’t comfortable with buying online,” people are only going to get more comfortable with making purchases from their mobile phones and mobile devices.
  • #19 Use geo-fencing technologies where precision lives, e.g. mapping &amp; weather.Use hyper-local content to capture mindset, e.g. shopping lists, local news, local search.Use active advertising, e.g. Push Notifications, Passbook &amp; SMS.Mine geo-social data such as Foursquare &amp; Yelp check-ins to build audiences.
  • #22 Mobile is frequently thought of as an on-the-go, utility device; however the majority of consumption is at home during Me Time.Leveraging the relationship between a consumer and their device is important for creative execution; use social feeds, video &amp; images.The scale of a mobile network often overshadows the type of inventory that is offered. Low session depth &amp; exclusive access to premium inventory is a strong indicator of network performance.Hyper-local targeting &amp; geo-fencing are viewed in parallel with mobile but scale, type of inventory &amp; precision are significant factors in successful execution.