Downloaded 121 times
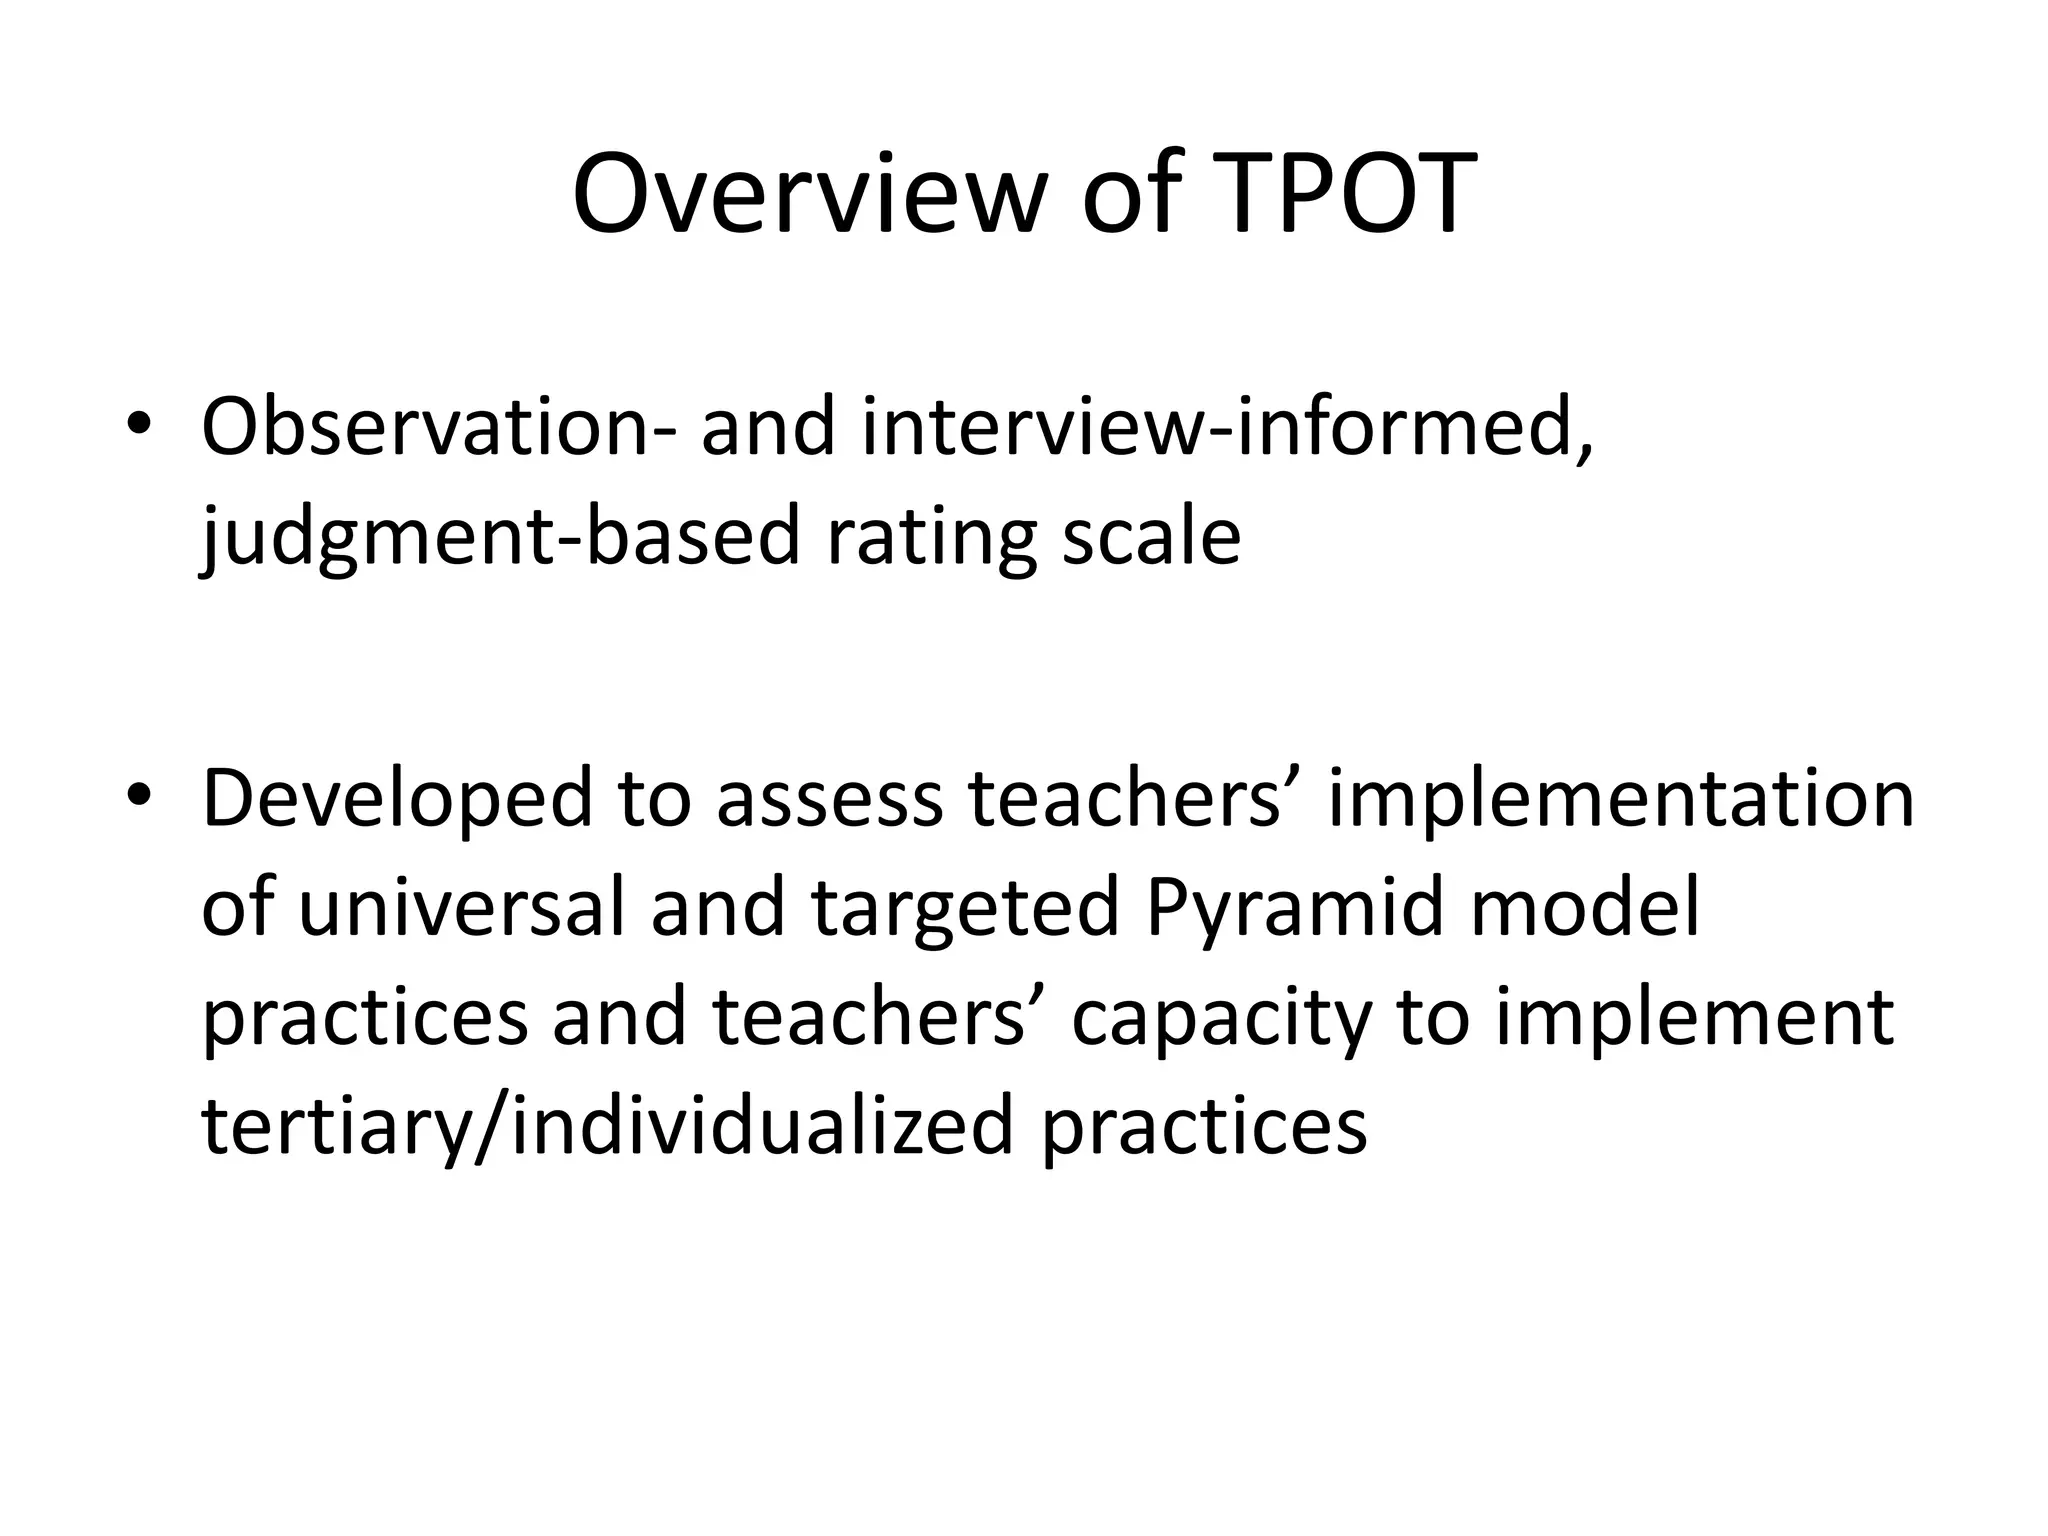

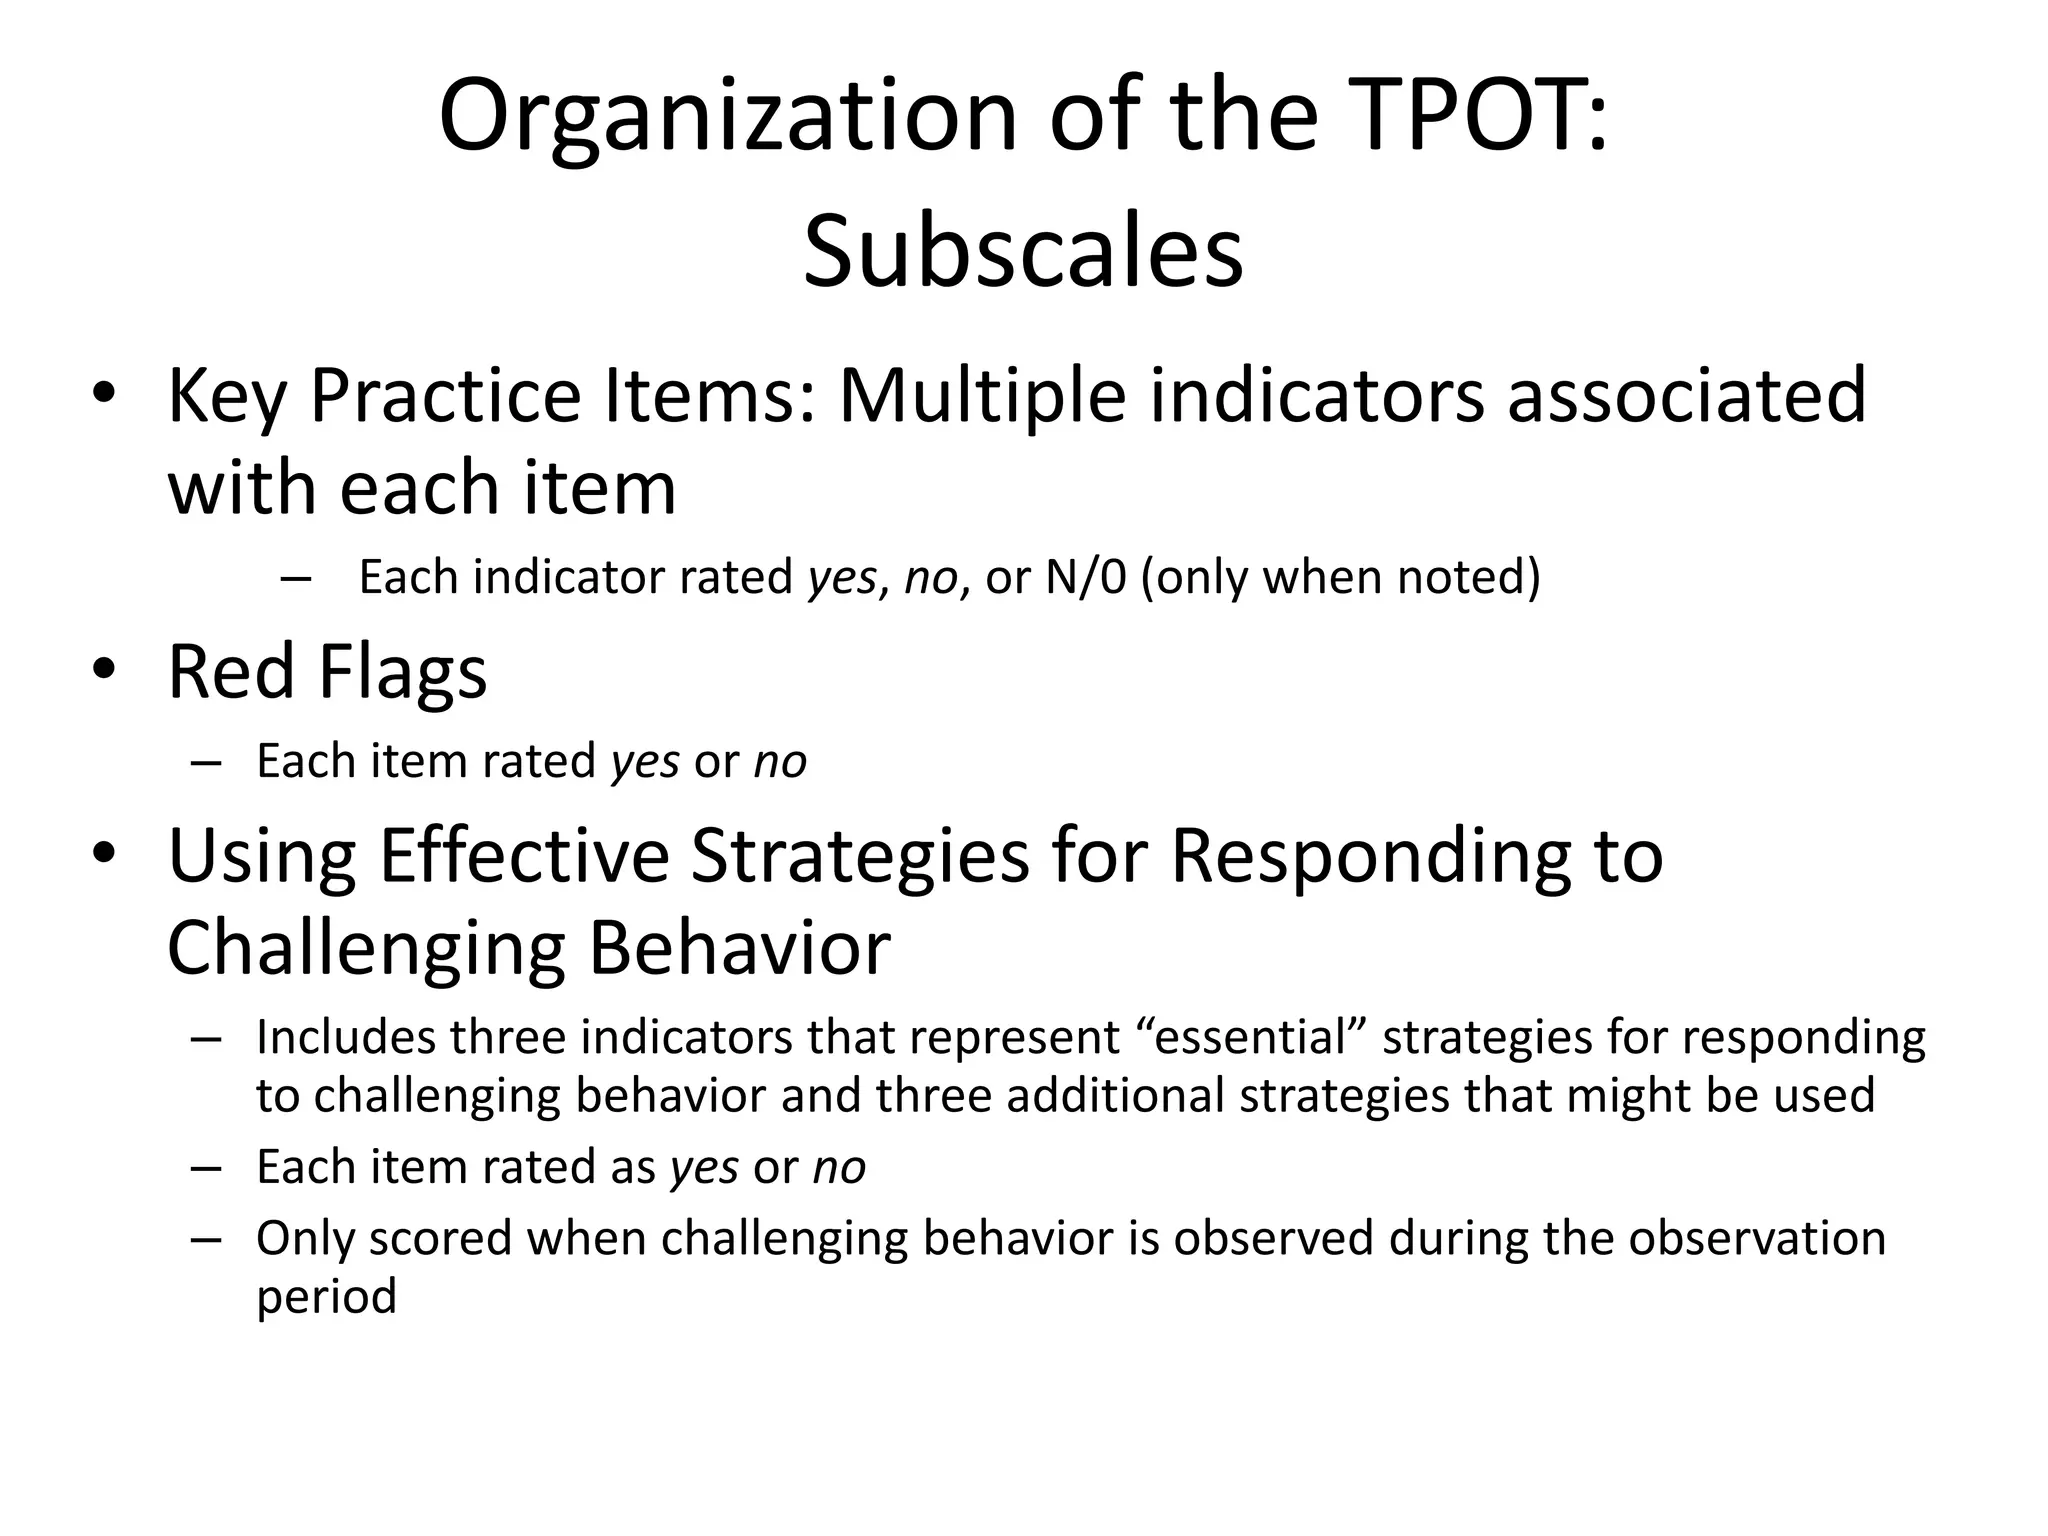
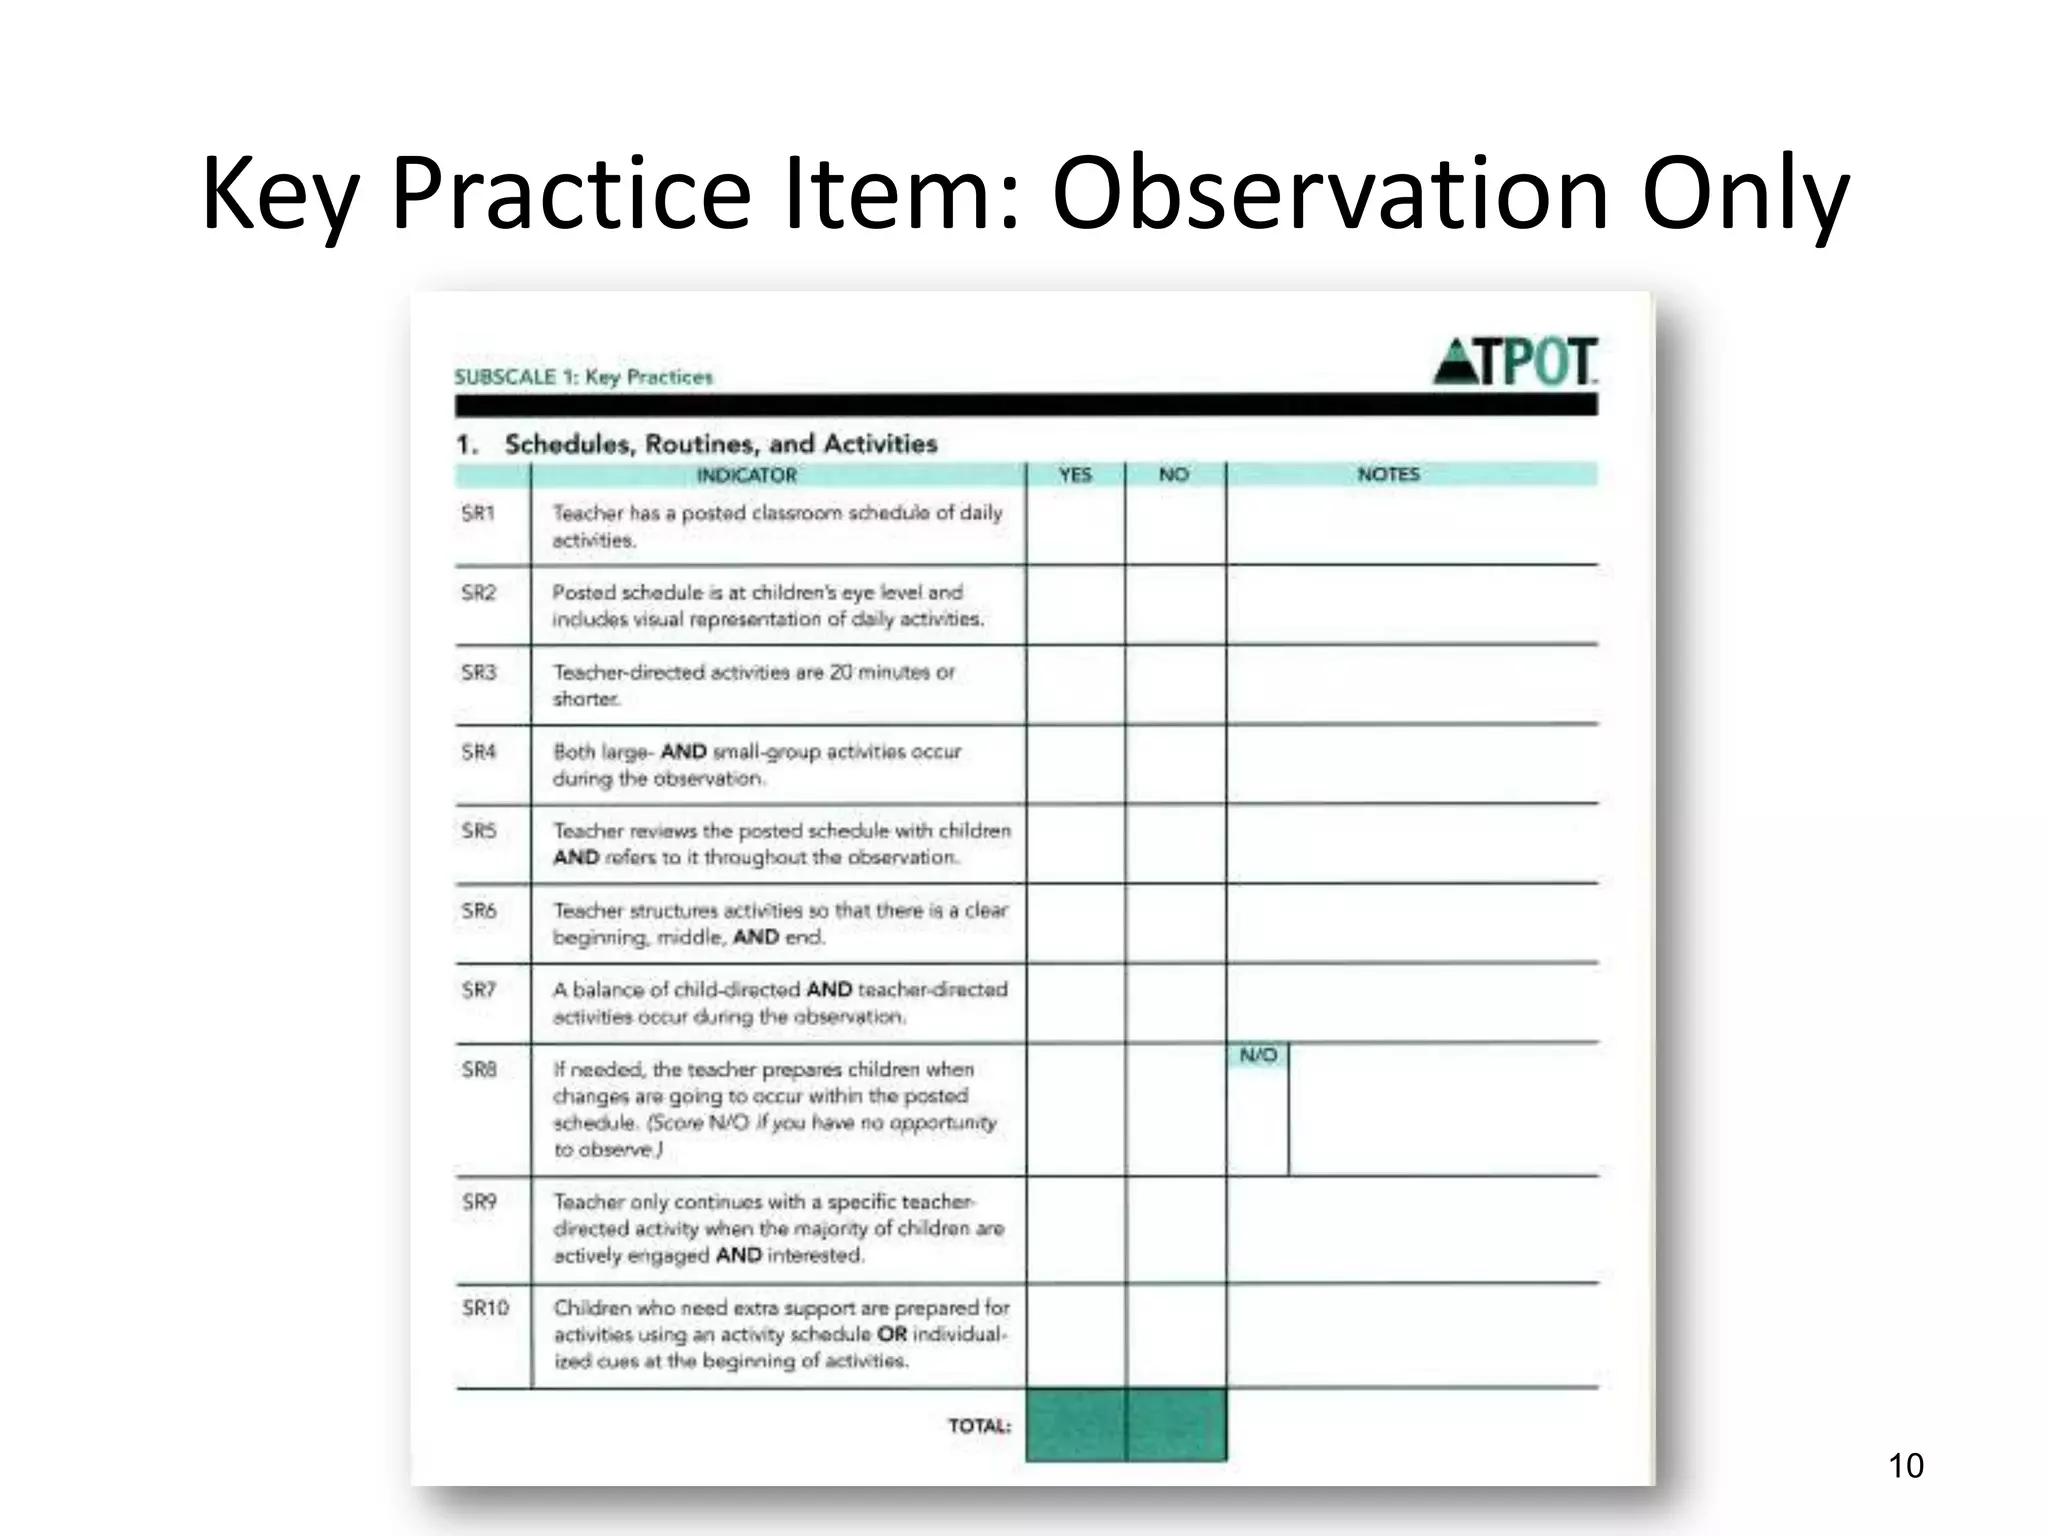
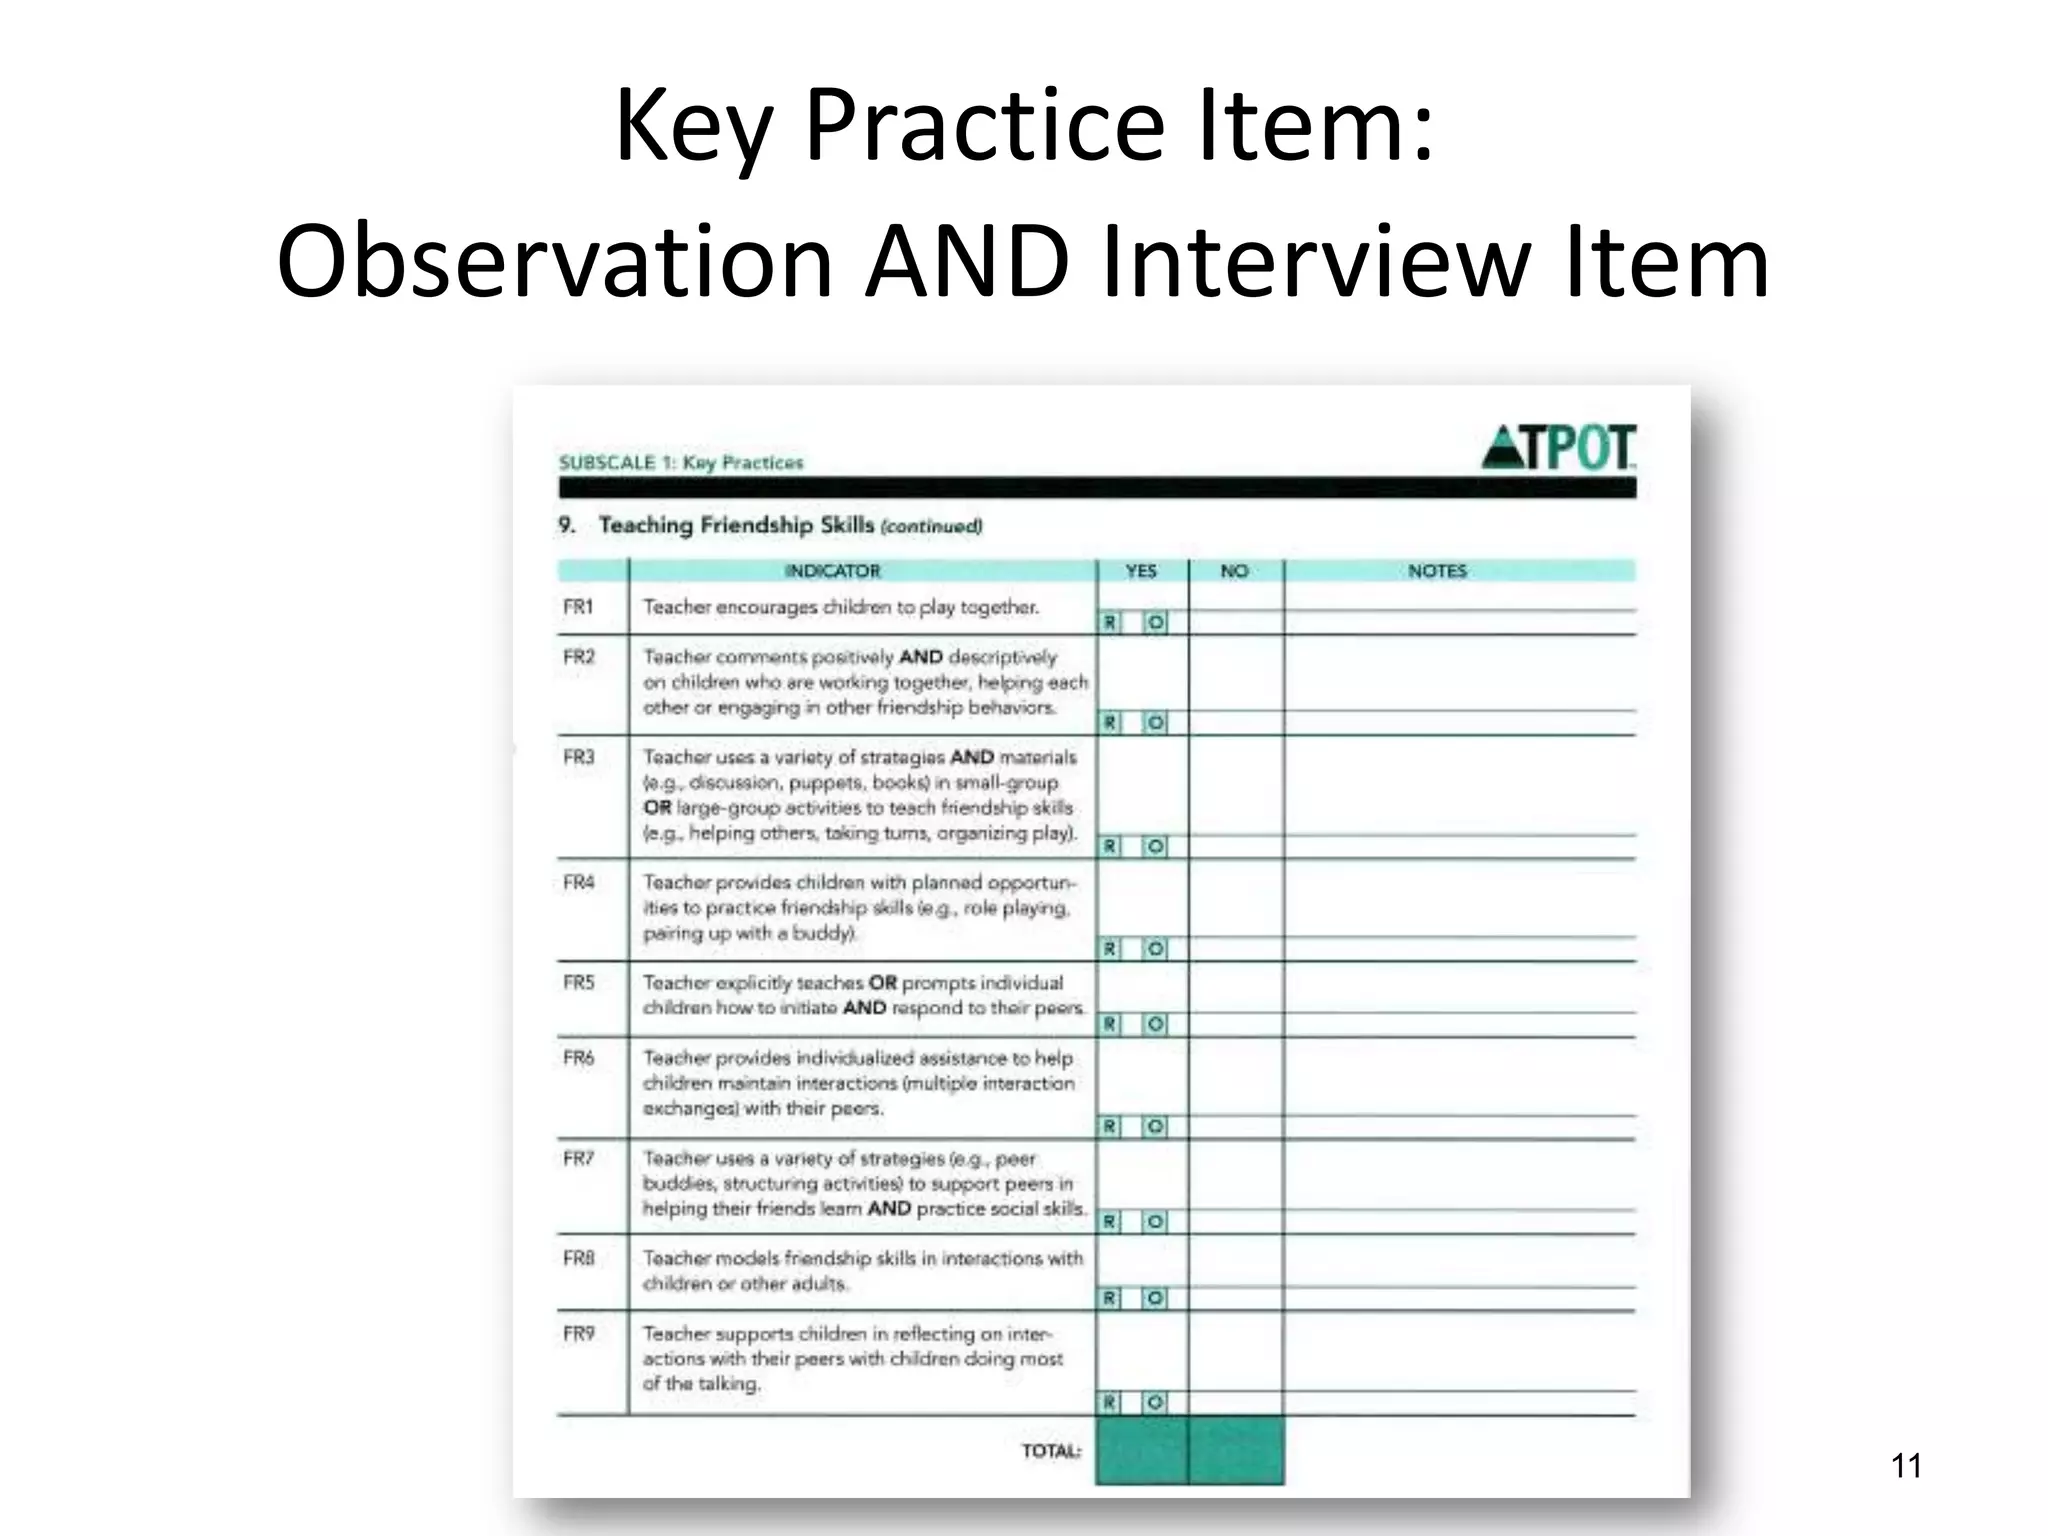

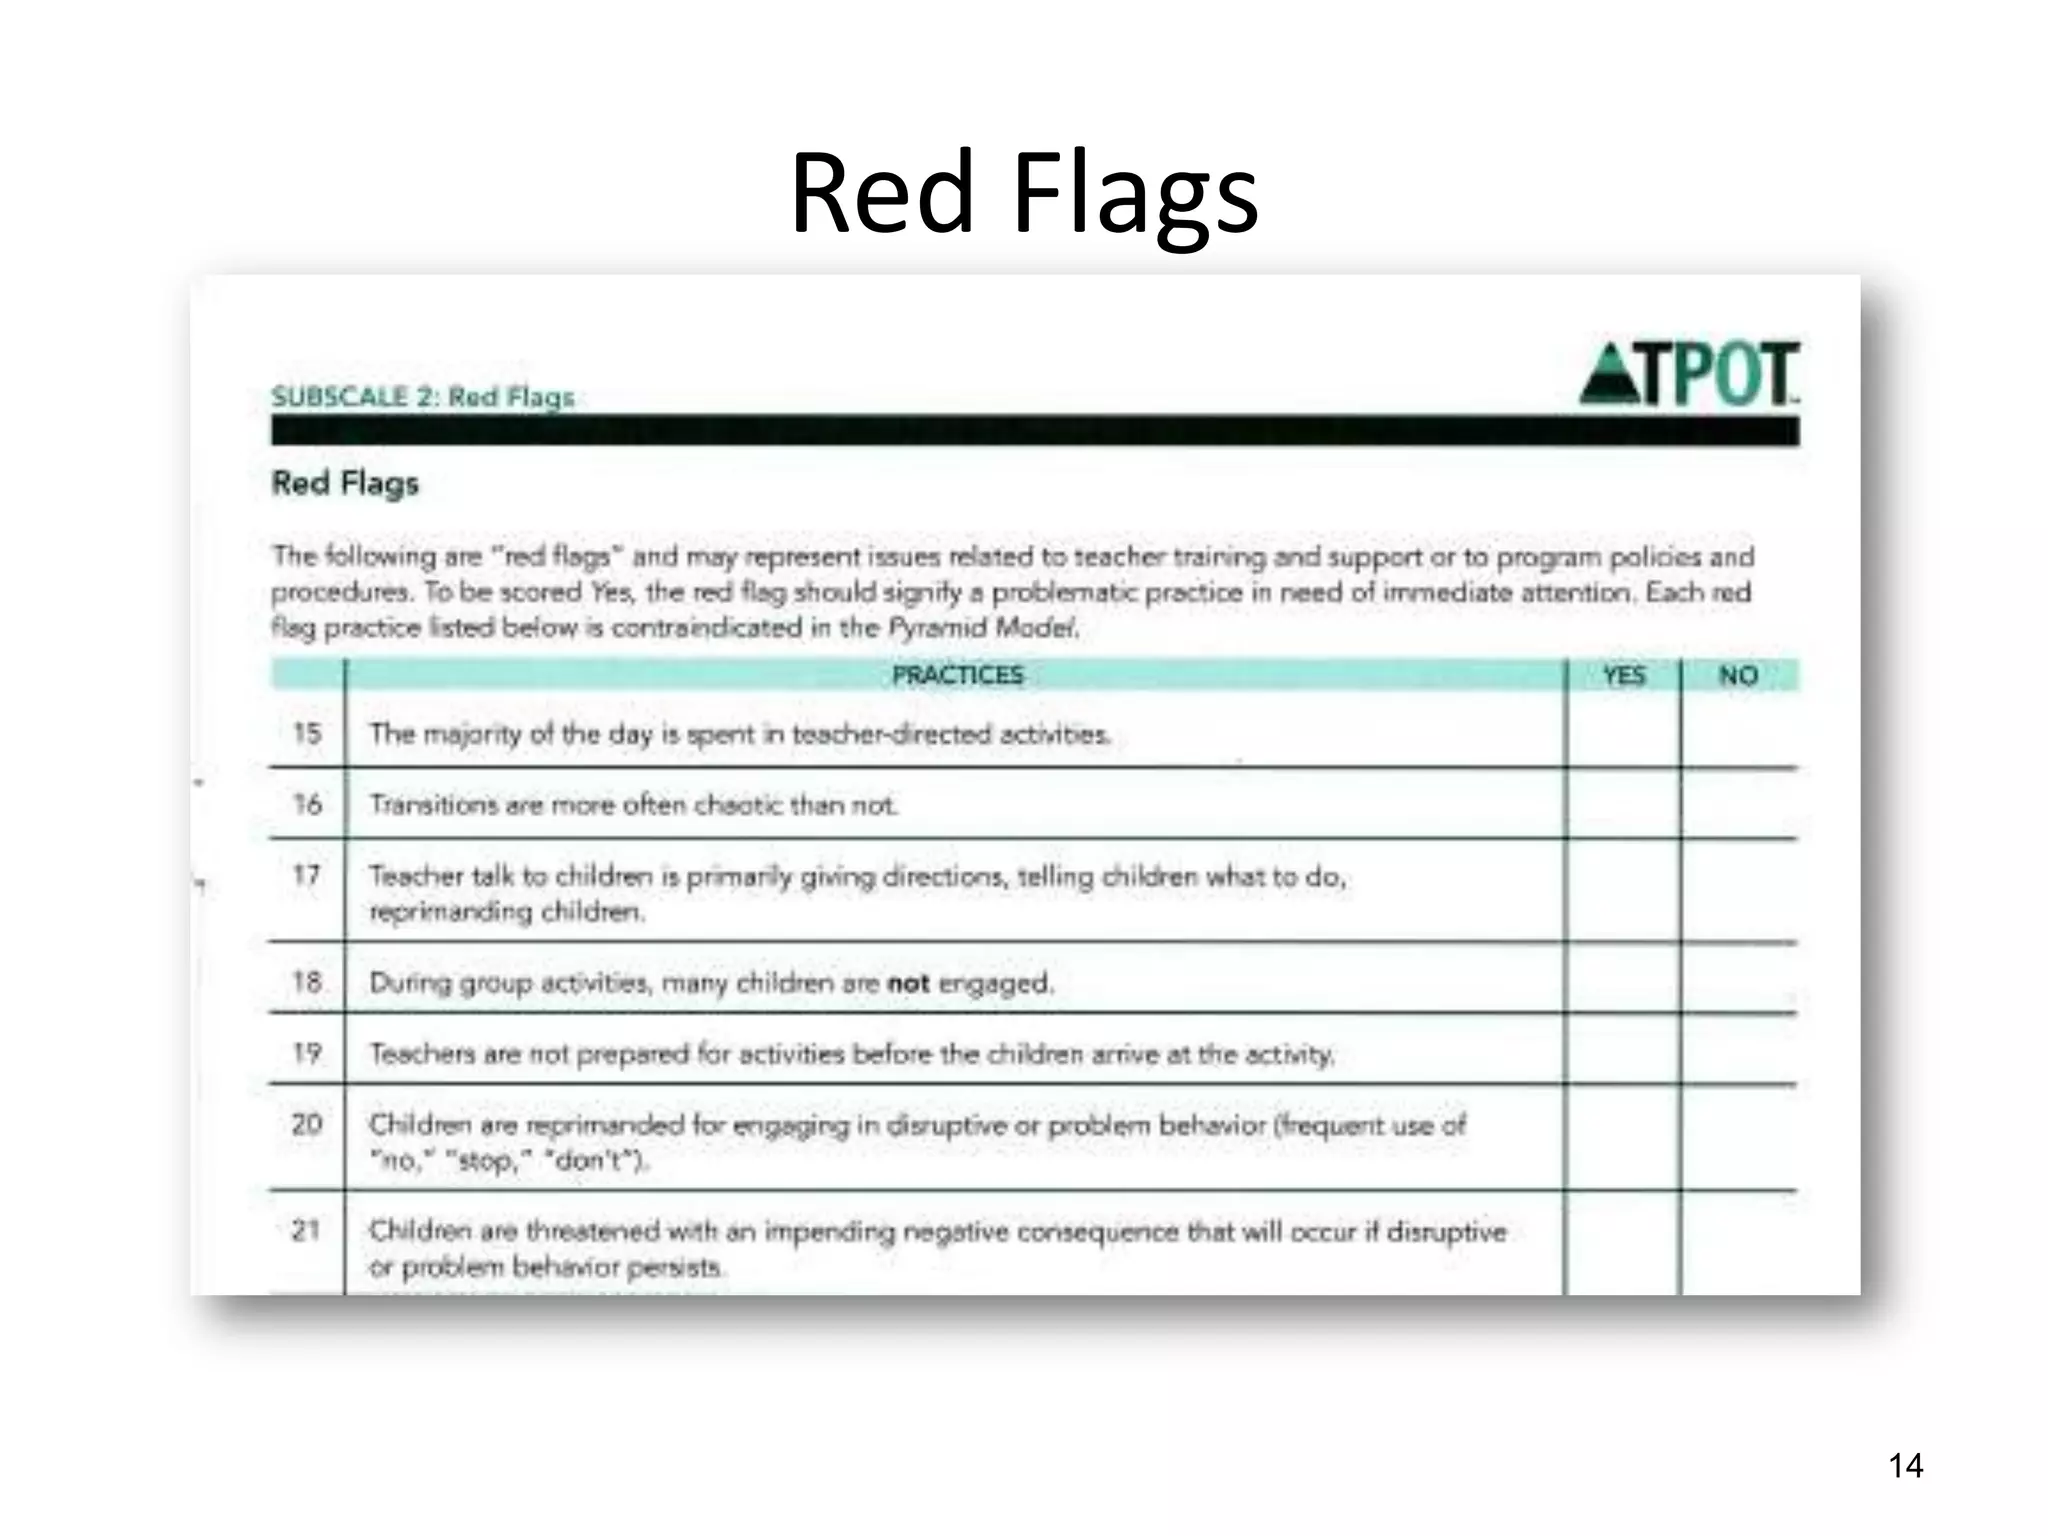


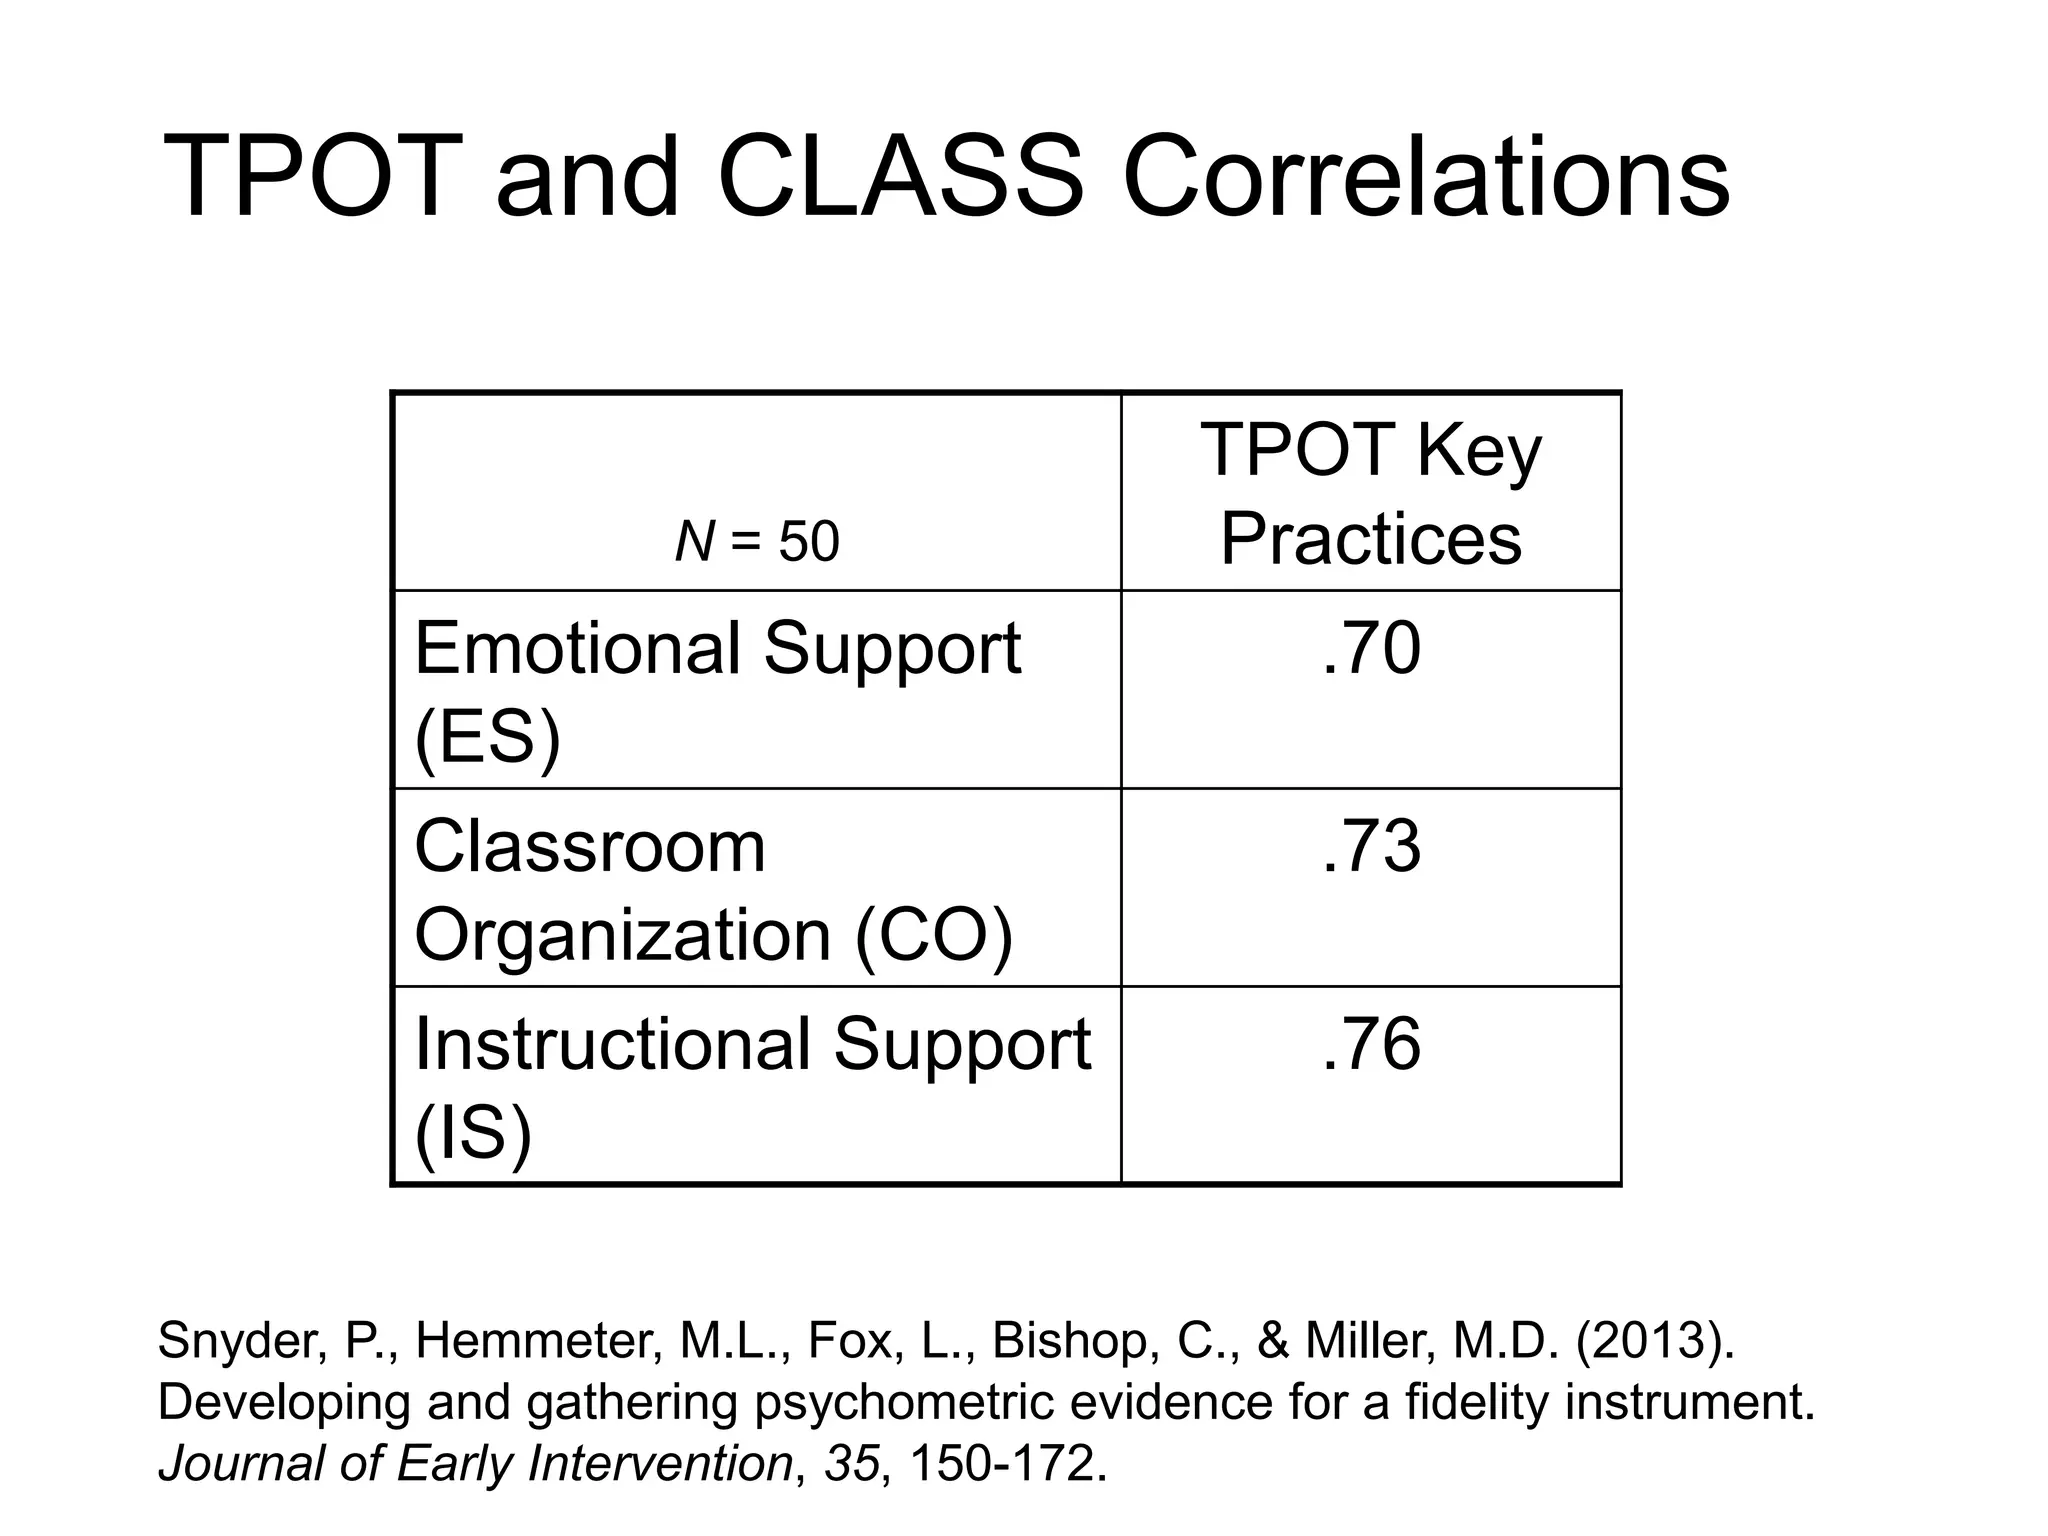
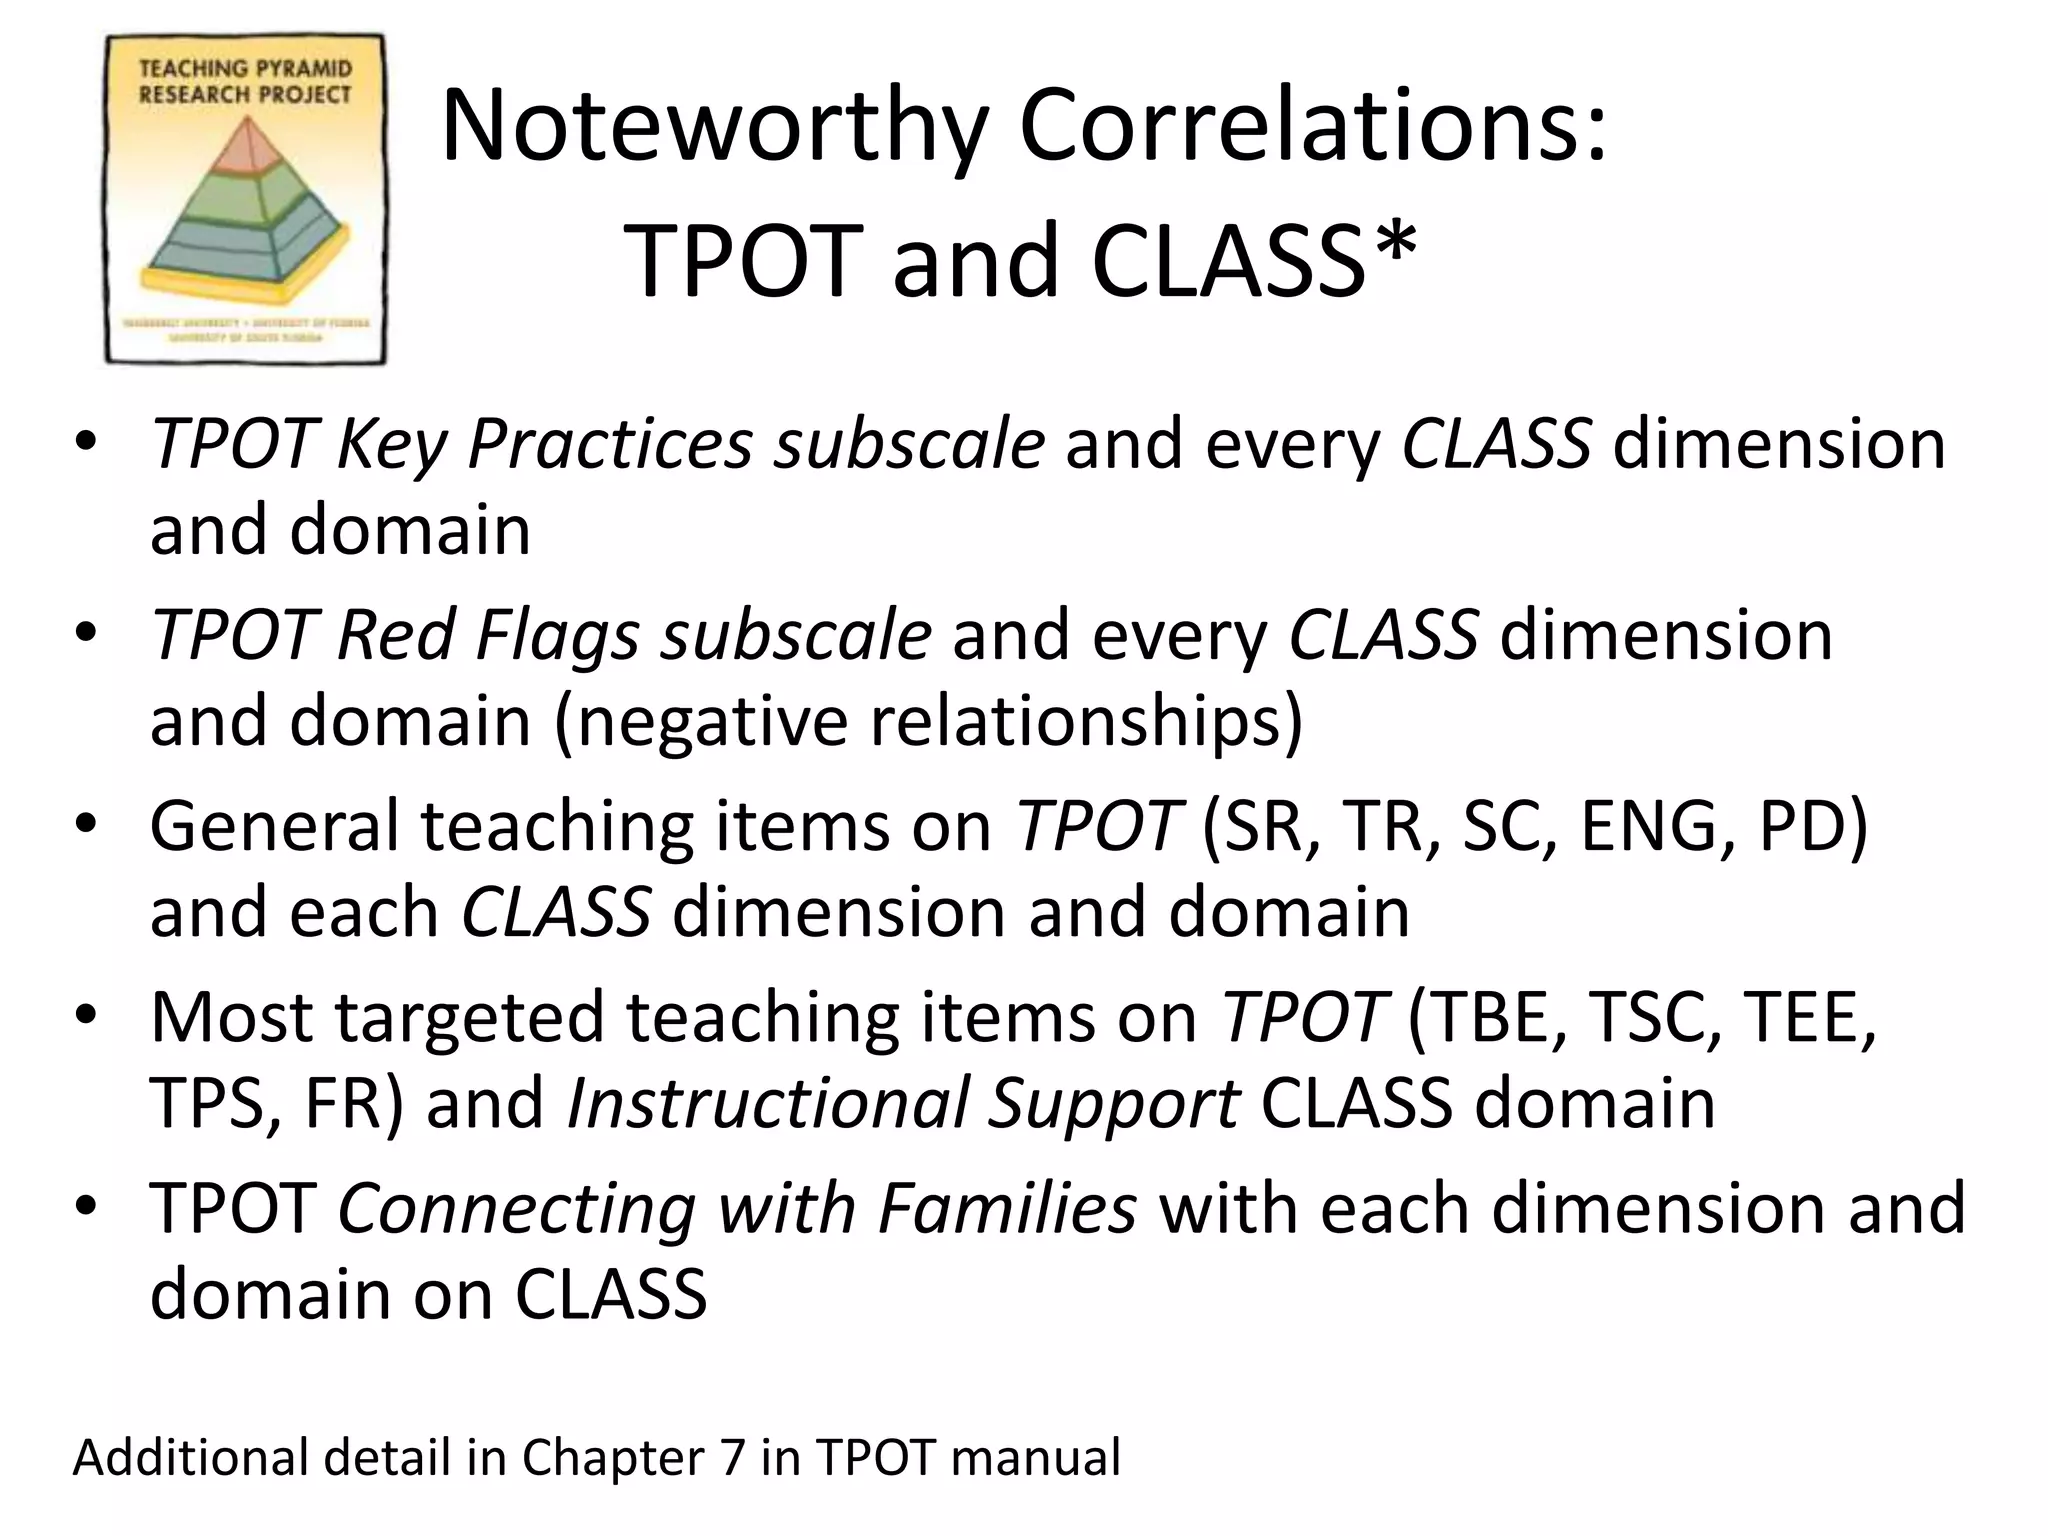
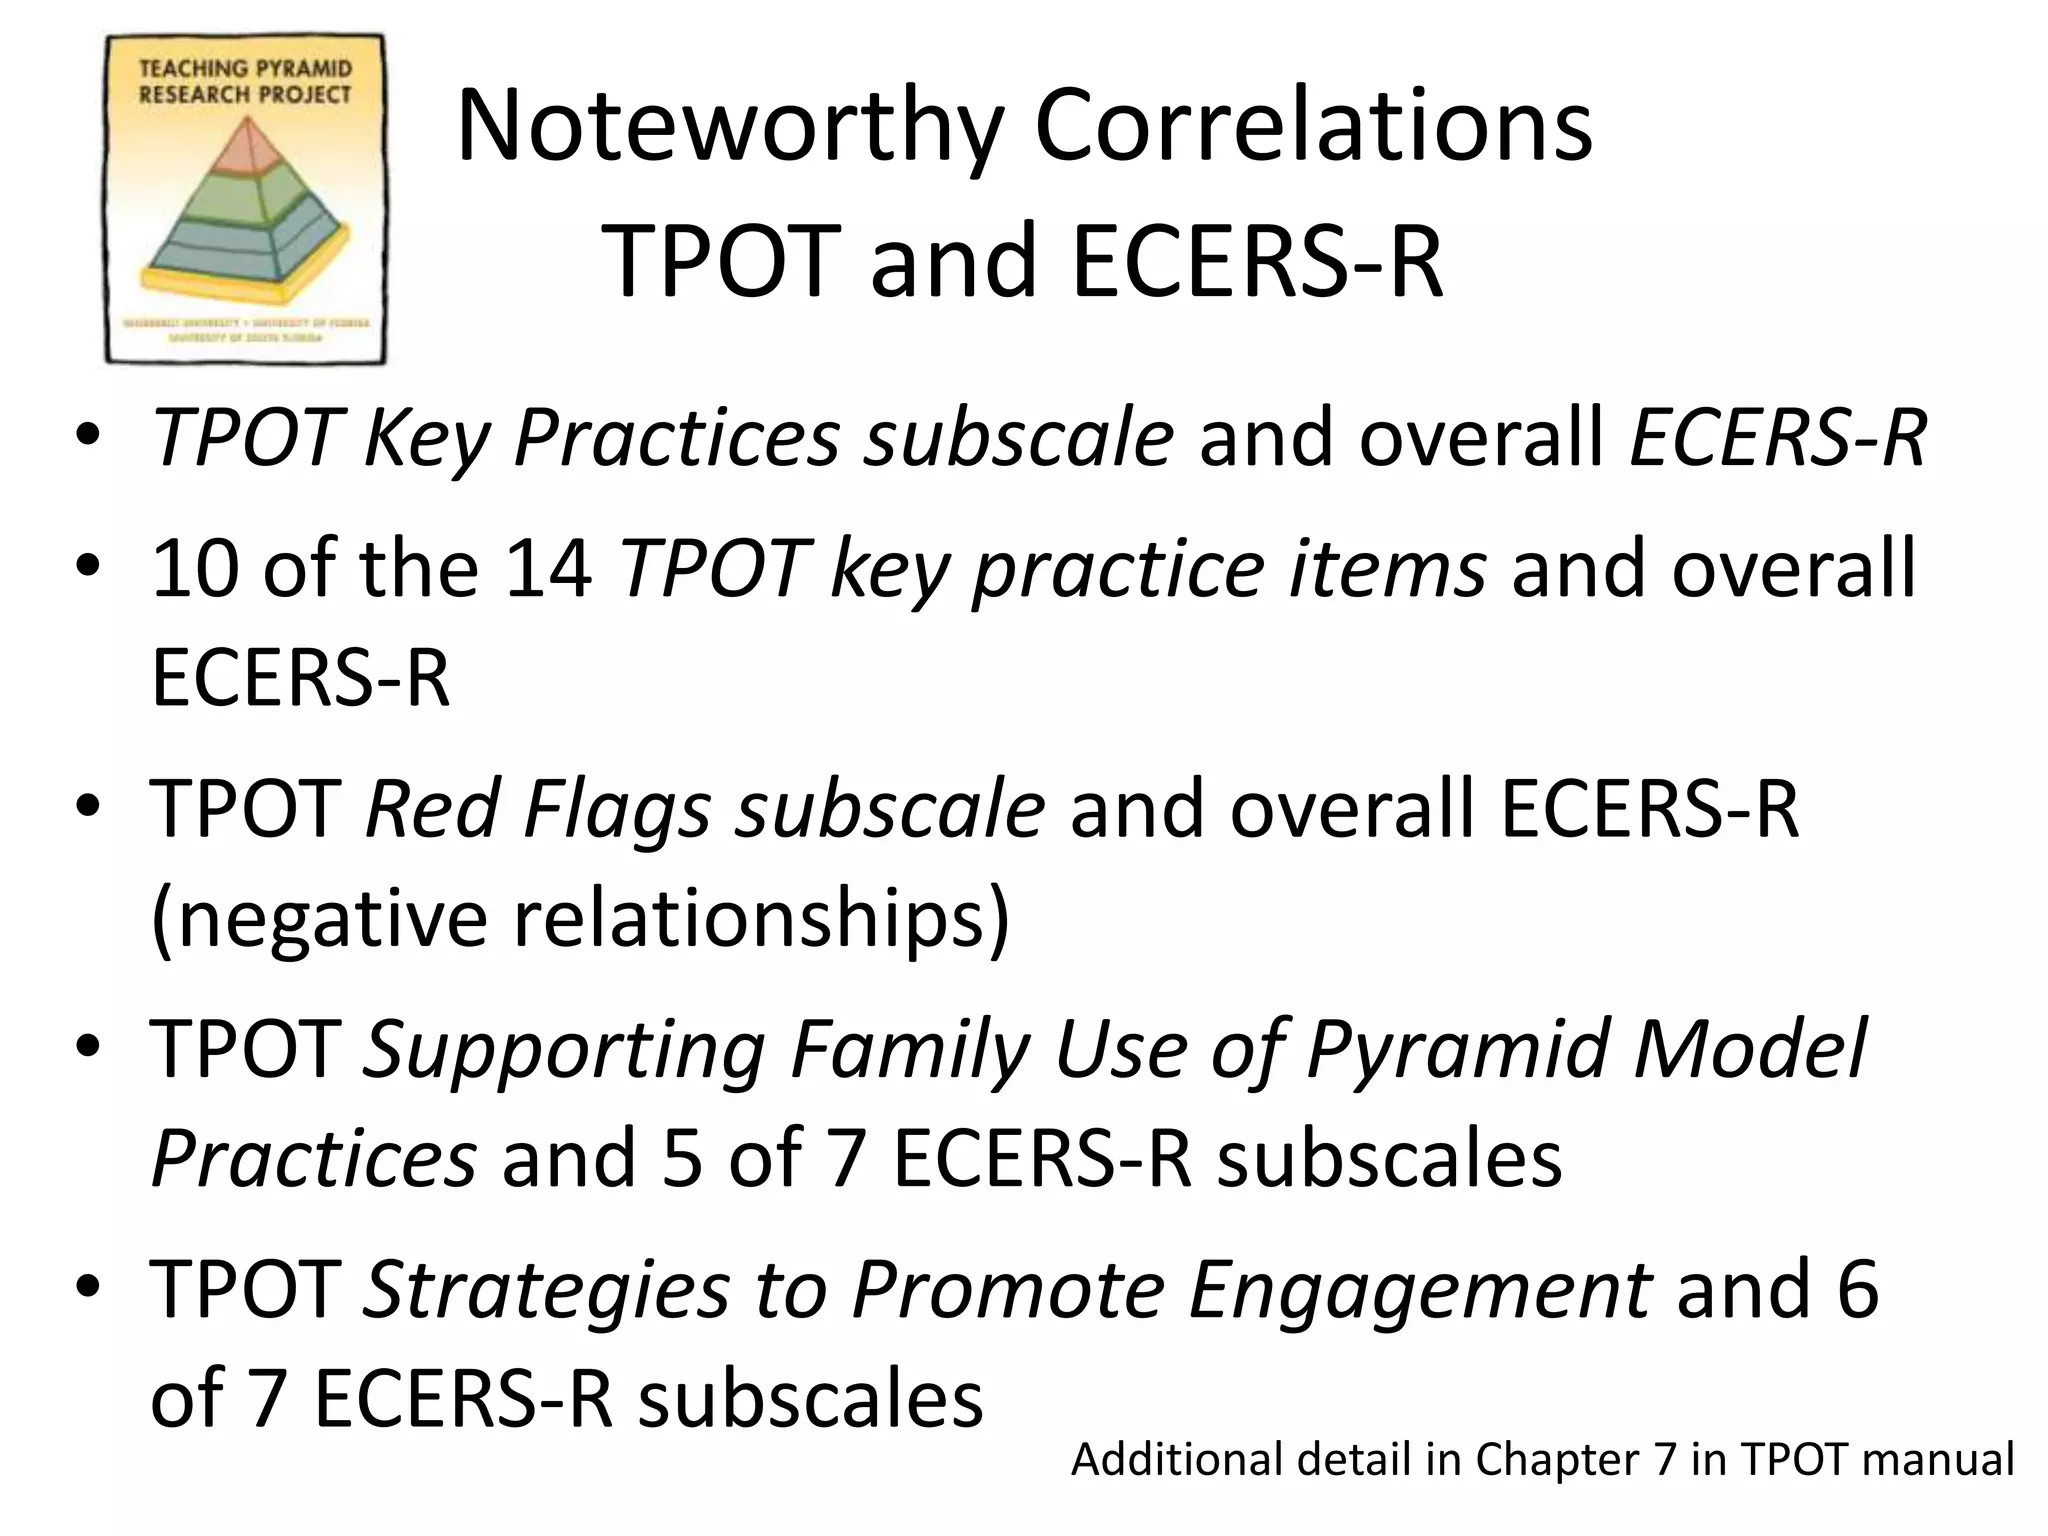
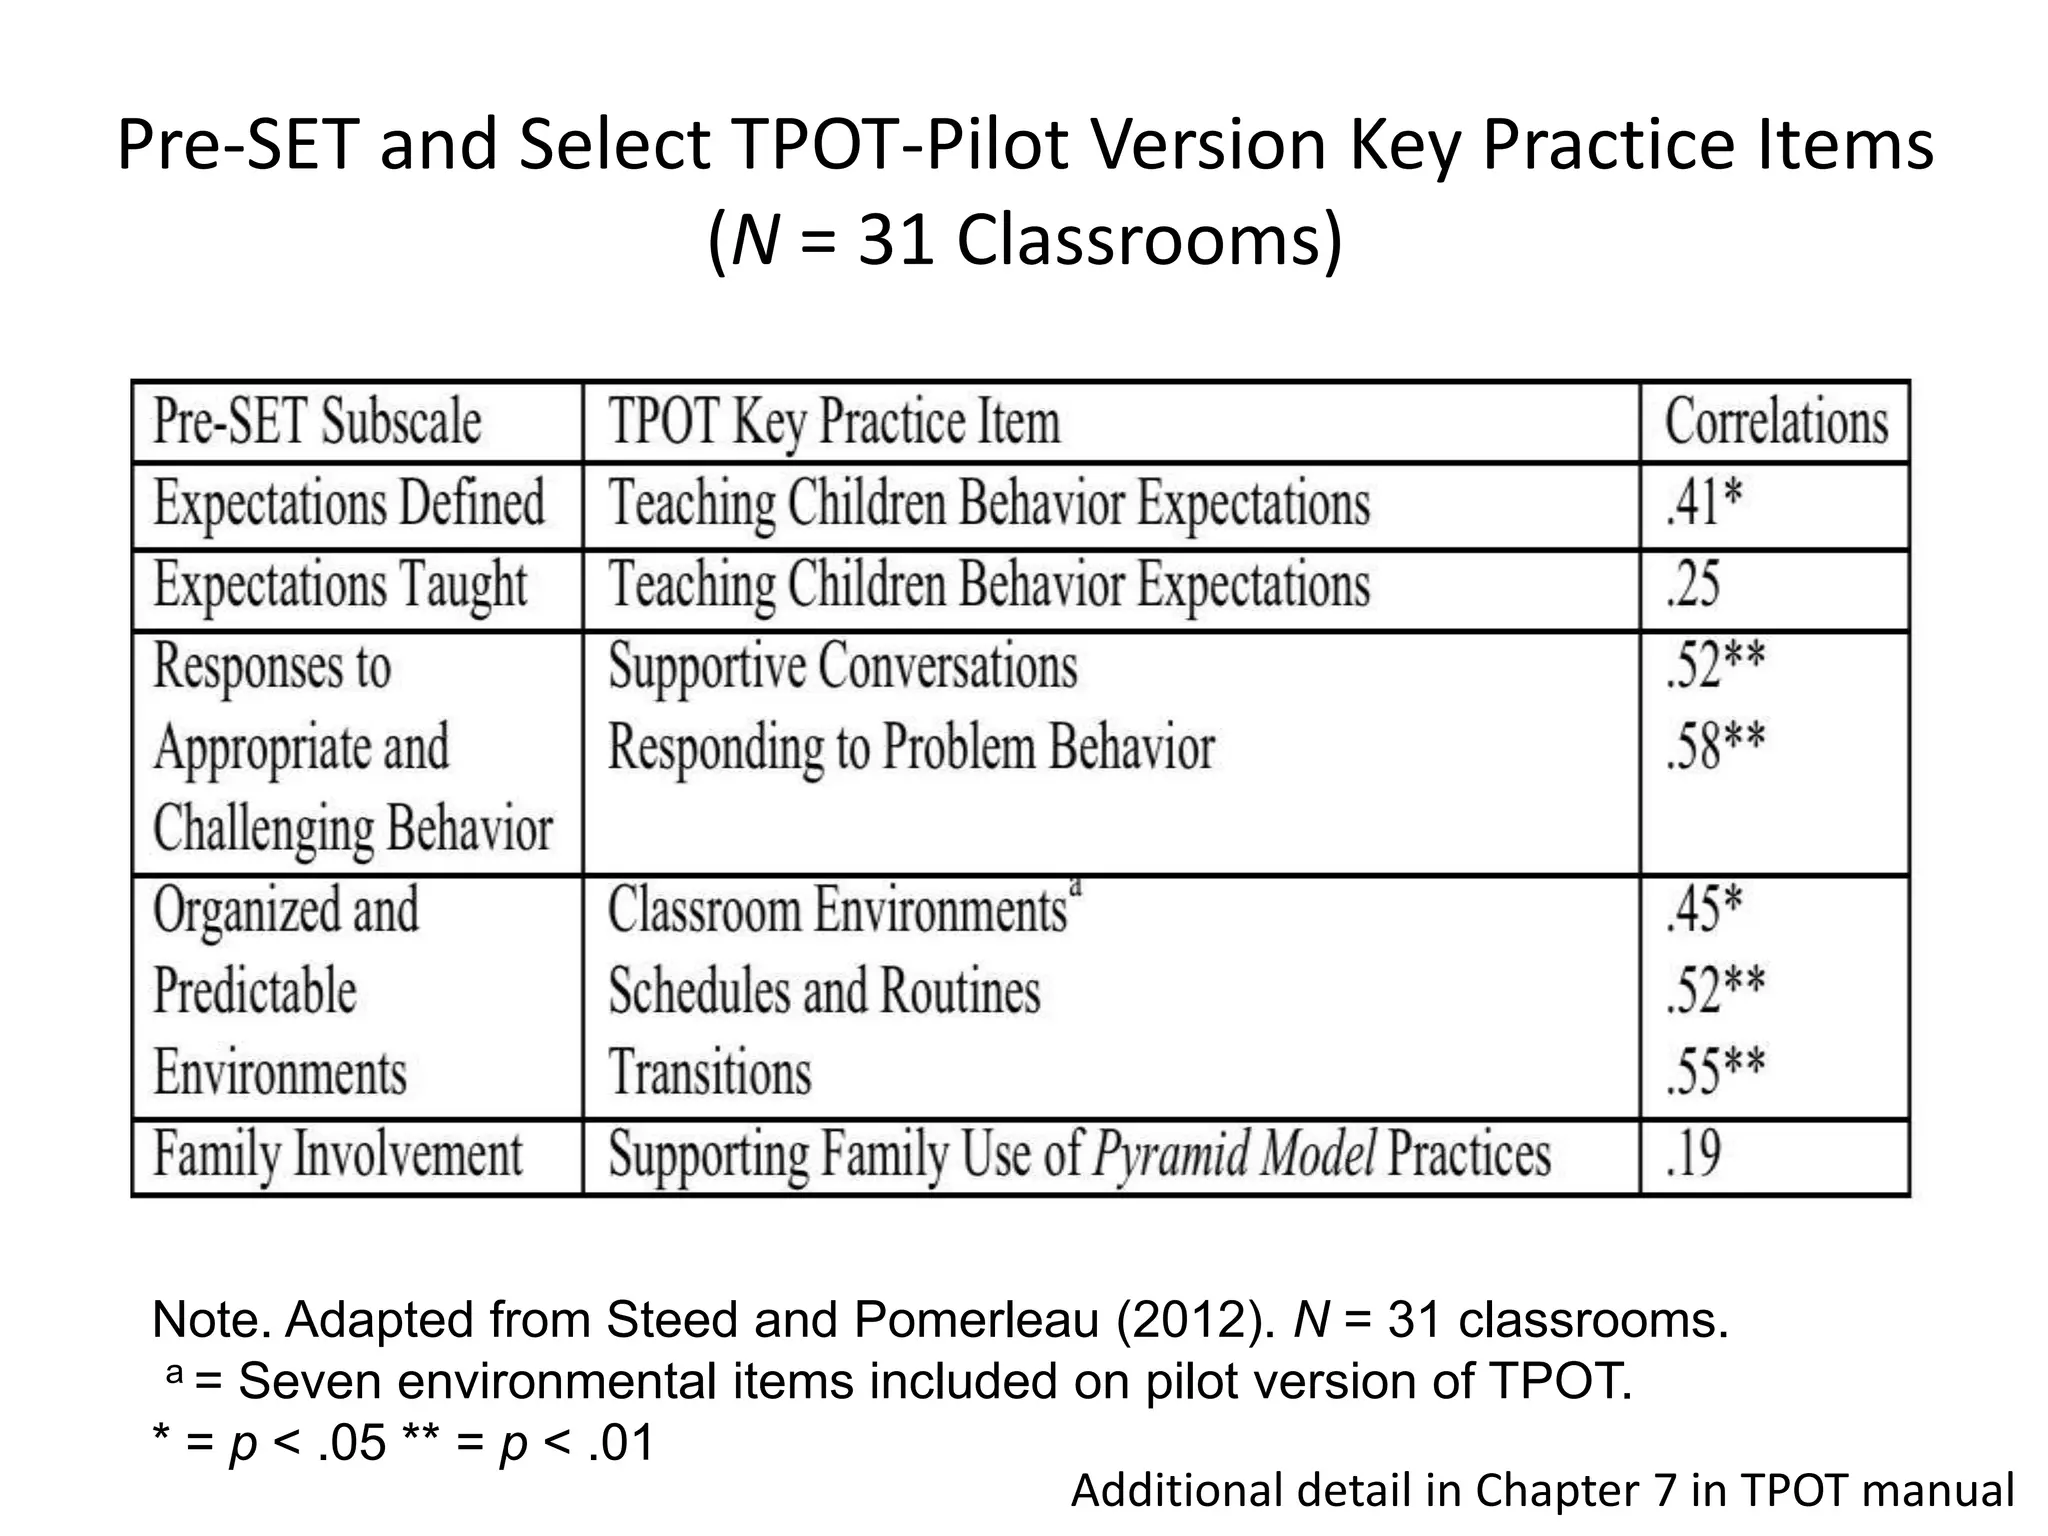
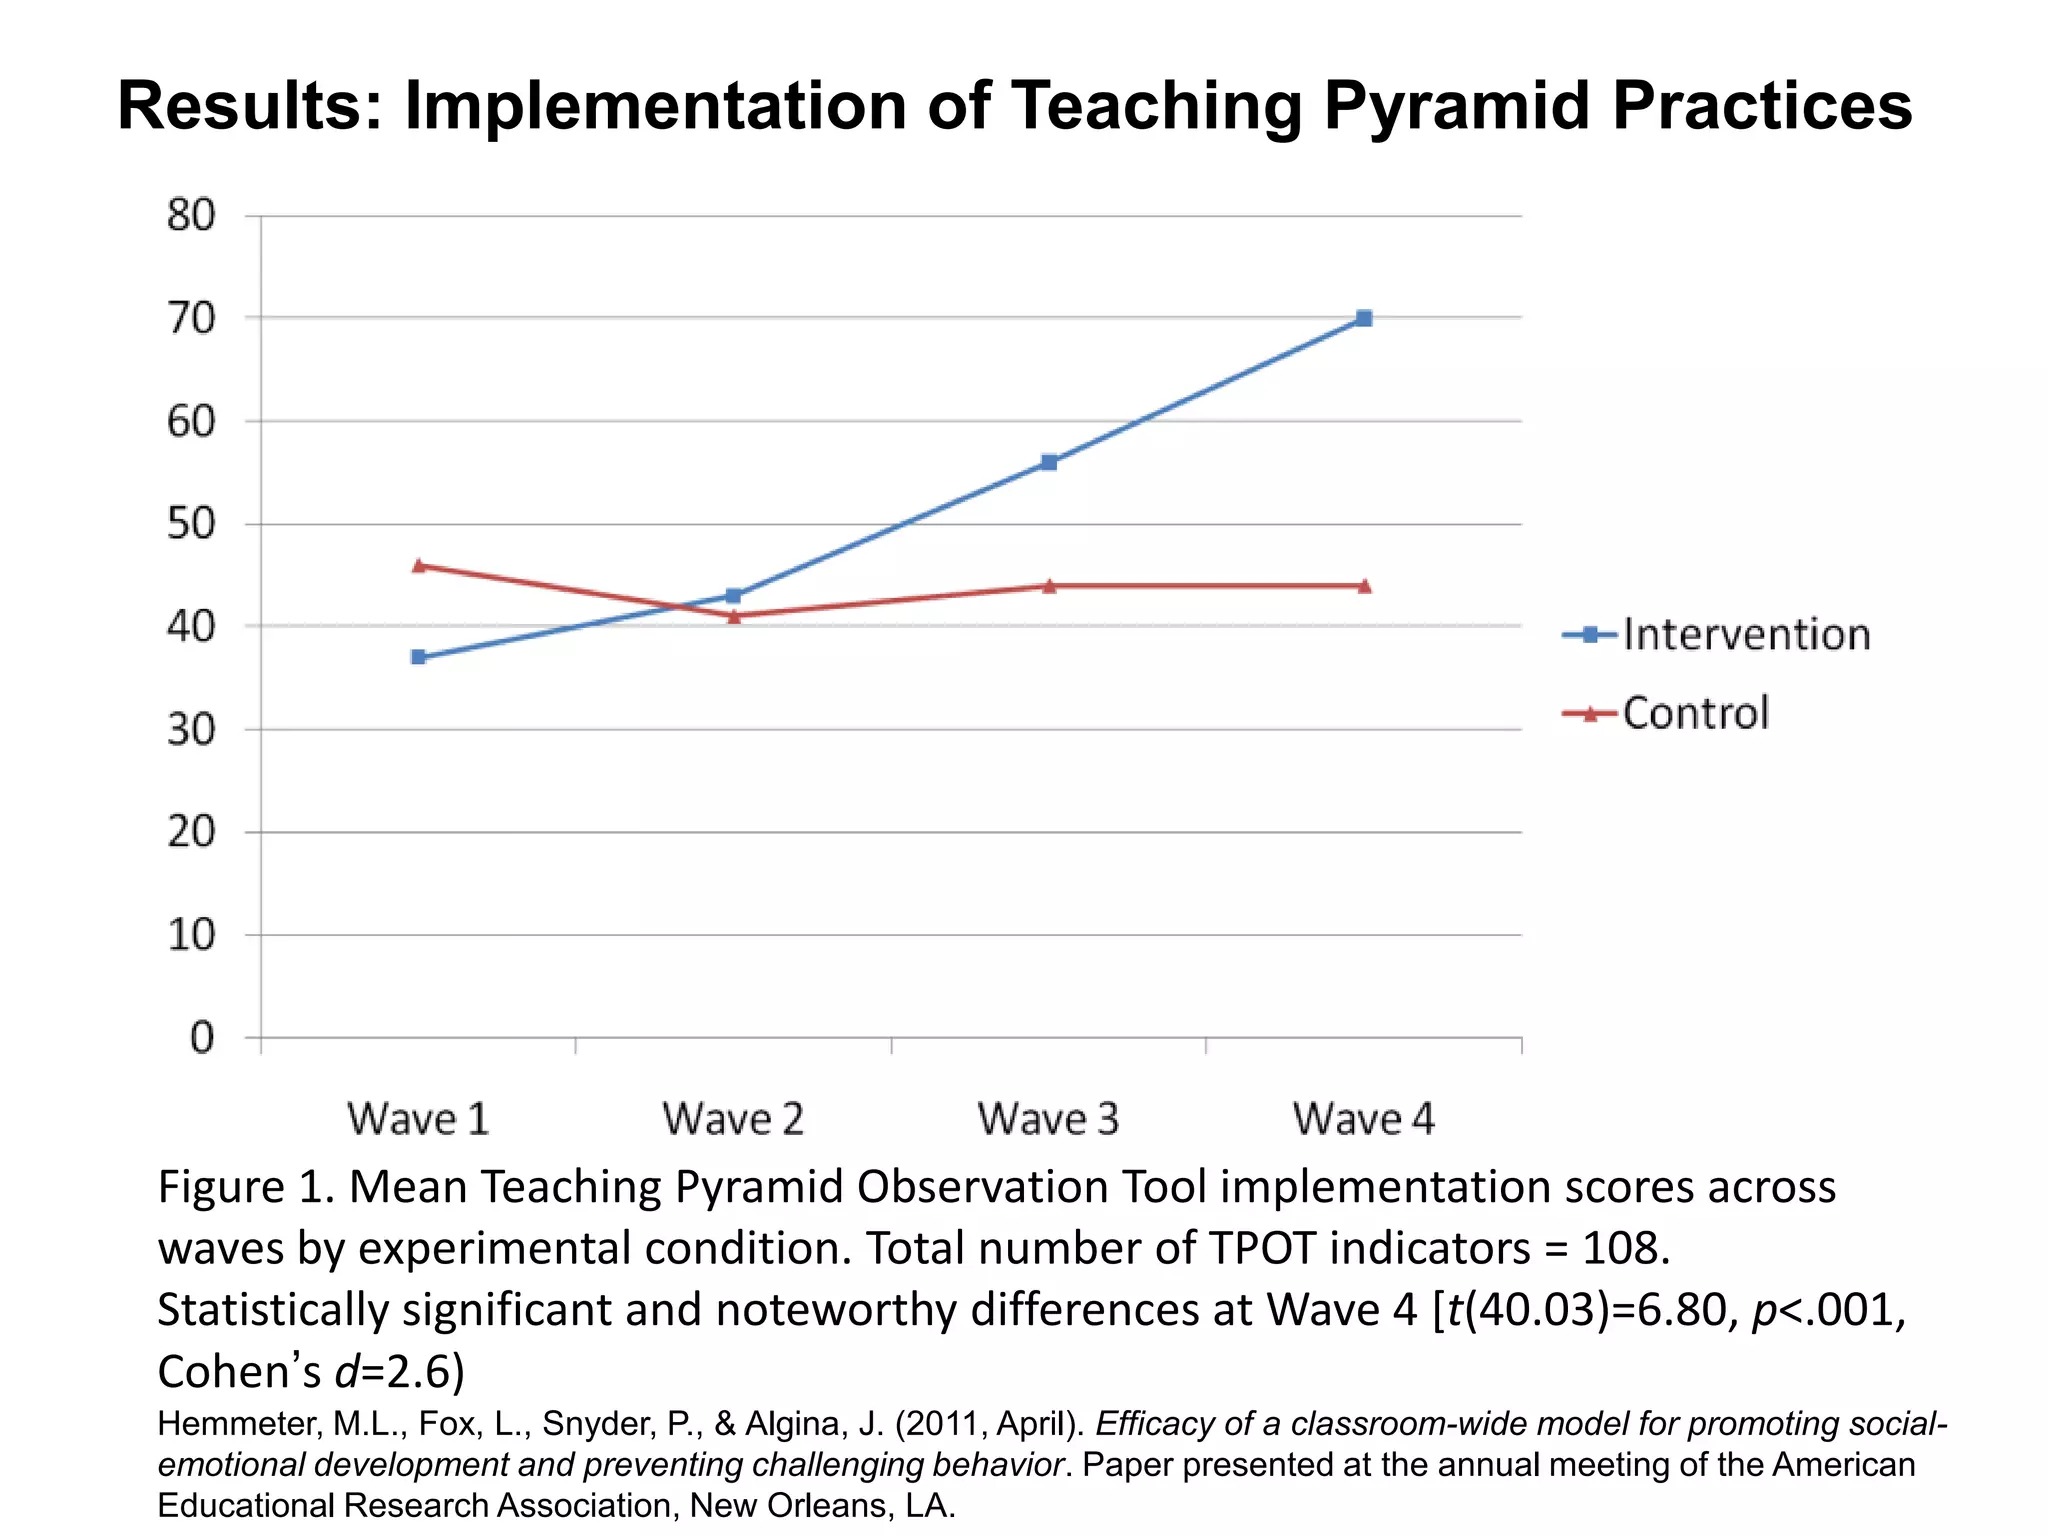


The Teaching Pyramid Observation Tool (TPOT) is an observation and interview tool used to assess teachers' implementation of practices from the Pyramid model, which promotes social-emotional competence and addresses challenging behaviors. The TPOT was developed to measure fidelity of Pyramid model implementation. It provides information to describe implementation quality, compare practices across teachers, and identify training needs. The TPOT includes subscales for key practices, red flags, and strategies for responding to challenging behaviors. Studies show the TPOT has good psychometric properties and its scores correlate with other measures of classroom quality. Coaching using TPOT data can help teachers improve their Pyramid model implementation over time.


