Creating gridded cartograms: Israel and the Palestine Territories
•
3 likes•2,685 views

Presentation made by Benjamin Hennig based on a tutorial given at the University of Sheffield for the MSc in Social and Spatial Inequalities, Module GEO6016 Data, Visualisation and GIS, October 2010. http://www.viewsoftheworld.net/

Recommended
Recommended
More Related Content
What's hot
What's hot (20)
Viewers also liked
Viewers also liked (16)
Similar to Creating gridded cartograms: Israel and the Palestine Territories
Similar to Creating gridded cartograms: Israel and the Palestine Territories (20)
More from Benjamin Hennig
More from Benjamin Hennig (20)
Recently uploaded
Recently uploaded (20)
Creating gridded cartograms: Israel and the Palestine Territories
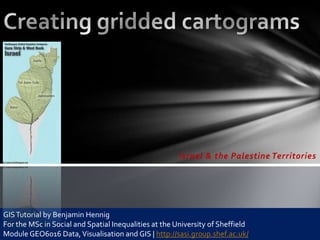
- 1. Israel & the Palestine Territories GIS Tutorial by Benjamin Hennig For the MSc in Social and Spatial Inequalities at the University of Sheffield Module GEO6016 Data, Visualisation and GIS | http://sasi.group.shef.ac.uk/
- 2. The following tutorial will talk you through the main steps necessary to create a basic grid-based population cartogram for a selected area. The main data preparation is done using ESRI ArcMap, the cartogram transformation is performed in ScapeToad which uses a simplified approach of Gastner/Newmans density equalising cartogram algorithm. For technical details and further reading see: Hennig, B.D., Pritchard, J., Ramsden, M., and Dorling, D. (2010). Remapping the World’s Population. Visualizing data using cartograms. ArcUser 2010 (1), 66-69. Article as PDF at http://www.viewsoftheworld.net/?p=701
- 3. Data Population • Gridded Population of the World (GPWv3, http://sedac.ciesin.columbia.edu/gpw/) provided as raster image worldpop2015.img Country Shapes • ESRI Sample Data or provided as vector data world.shp • Global Administrative Boundaries (http://gadm.org/) • ...
- 4. GIS works I Preparing the area of interest: Extracting features Open world.shp Select Israel and the Palestine Territories via the selection menu (or the tools bar) Right-click the world layer and choose the Data – Export data option to create a new layer with the selected polygons
- 5. GIS works II Preparing the grid: Creating a 2.5‘‘ fishnet ArcToolbox: Data Management Tools Feature Class Create Fishnet
- 6. GIS works II Preparing the grid: Creating a 2.5‘‘ fishnet ArcToolbox: Data Management Tools Feature Class Create Fishnet Converting grid lines to polygons (ArcToolbox Data Management Tools Features Feature to Polygon)
- 7. It should work…but it doesn’t? Check the extent – Is it what you want?
- 8. GIS works IV Adding and adjusting basedata: • population raster (worldpop2015.img) • ArcToolbox: Data Management Tools Raster Raster Processing Clip)
- 9. GIS works IV Adding and adjusting basedata: • population raster (worldpop2015.img) • ArcToolbox: Data Management Tools Raster Raster Processing Clip) Converting the population raster: ArcToolbox: Conversion Tools From Raster Raster to Point
- 10. GIS works V Assigning population values to grid: ArcToolbox: Analysis Tools Overlay Spatial Join
- 11. GIS works VI Cutting out the area of interest: ArcToolbox: Analysis Tools Overlay Intersect
- 12. Creating the cartogram using ScapeToad
- 13. 1, 2, 3 – as easy as that!
- 14. …well done http://www.worldpopulationatlas.org