

Recommended
More Related Content
What's hot
What's hot (17)
Viewers also liked
Similar to P3
P3
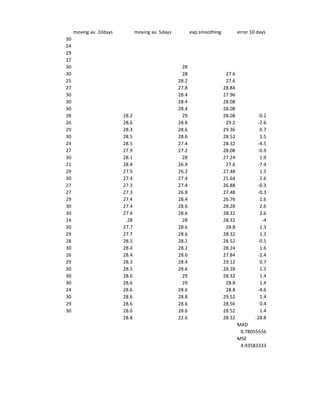
- 1. moving av. 10days moving av. 5days exp.smoothing error 10 days 30 24 29 27 30 28 30 28 27.6 25 28.2 27.6 27 27.8 28.84 30 28.4 27.96 30 28.4 28.08 30 28.4 28.08 28 28.2 29 28.08 -0.2 26 28.6 28.8 29.2 -2.6 29 28.3 28.6 29.36 0.7 30 28.5 28.6 28.52 1.5 24 28.5 27.4 28.32 -4.5 27 27.9 27.2 28.08 -0.9 30 28.1 28 27.24 1.9 21 28.4 26.4 27.6 -7.4 29 27.5 26.2 27.48 1.5 30 27.4 27.4 25.64 2.6 27 27.3 27.4 26.88 -0.3 27 27.3 26.8 27.48 -0.3 29 27.4 28.4 26.76 1.6 30 27.4 28.6 28.28 2.6 30 27.4 28.6 28.32 2.6 24 28 28 28.32 -4 30 27.7 28.6 28.8 2.3 29 27.7 28.6 28.32 1.3 28 28.5 28.2 28.52 -0.5 30 28.4 28.2 28.24 1.6 26 28.4 28.6 27.84 -2.4 29 28.3 28.4 29.12 0.7 30 28.5 28.6 28.28 1.5 30 28.6 29 28.32 1.4 30 28.6 29 28.8 1.4 24 28.6 28.6 28.8 -4.6 30 28.6 28.8 29.52 1.4 29 28.6 28.6 28.56 0.4 30 28.6 28.6 28.52 1.4 28.8 22.6 28.32 -28.8 MAD 0.78055556 MSE 4.93583333
- 2. error 5 days error exp MAD error 10 days error10^2 error 5 days error5^2 2 -0.2 0.04 2 4 2 2.4 -2.6 6.76 2 4 -3.2 -2.6 0.7 0.49 -3.2 10.24 -0.8 -1.84 1.5 2.25 -0.8 0.64 1.6 2.04 -4.5 20.25 1.6 2.56 1.6 1.92 -0.9 0.81 1.6 2.56 1.6 1.92 1.9 3.61 1.6 2.56 -1 -0.08 -7.4 54.76 -1 1 -2.8 -3.2 1.5 2.25 -2.8 7.84 0.4 -0.36 2.6 6.76 0.4 0.16 1.4 1.48 -0.3 0.09 1.4 1.96 -3.4 -4.32 -0.3 0.09 -3.4 11.56 -0.2 -1.08 1.6 2.56 -0.2 0.04 2 2.76 2.6 6.76 2 4 -5.4 -6.6 2.6 6.76 -5.4 29.16 2.8 1.52 -4 16 2.8 7.84 2.6 4.36 2.3 5.29 2.6 6.76 -0.4 0.12 1.3 1.69 -0.4 0.16 0.2 -0.48 -0.5 0.25 0.2 0.04 0.6 2.24 1.6 2.56 0.6 0.36 1.4 1.72 -2.4 5.76 1.4 1.96 1.4 1.68 0.7 0.49 1.4 1.96 -4 -4.32 1.5 2.25 -4 16 1.4 1.2 1.4 1.96 1.4 1.96 0.4 0.68 1.4 1.96 0.4 0.16 -0.2 -0.52 -4.6 21.16 -0.2 0.04 1.8 1.76 1.4 1.96 1.8 3.24 -2.6 -1.84 0.4 0.16 -2.6 6.76 0.6 -0.12 1.4 1.96 0.6 0.36 1.4 1.72 1.4 1.96 1 1.68 1 1 1 1.2 1 1 -4.6 -4.8 -4.6 21.16 1.2 0.48 1.2 1.44 0.4 0.44 0.4 0.16 1.4 1.48 1.4 1.96 -22.6 -28.32 MAD MAD 0.58333333 0.80228571 MSE MSE 4.40444444 5.81668571
- 3. error exp error exp^2 2.4 5.76 -2.6 6.76 -1.84 3.3856 2.04 4.1616 1.92 3.6864 1.92 3.6864 -0.08 0.0064 -3.2 10.24 -0.36 0.1296 1.48 2.1904 -4.32 18.6624 -1.08 1.1664 2.76 7.6176 -6.6 43.56 1.52 2.3104 4.36 19.0096 0.12 0.0144 -0.48 0.2304 2.24 5.0176 1.72 2.9584 1.68 2.8224 -4.32 18.6624 1.2 1.44 0.68 0.4624 -0.52 0.2704 1.76 3.0976 -1.84 3.3856 -0.12 0.0144 1.72 2.9584 1.68 2.8224 1.2 1.44 -4.8 23.04 0.48 0.2304 0.44 0.1936 1.48 2.1904
- 4. Real Data 40 30 20 Real Data 10 0 1 4 7 10 13 16 19 22 25 28 31 34 37 40 35 30 25 20 Forecast 5 day Avg 15 10 Real Data 5 0 1 4 7 10 13 16 19 22 25 28 31 34 37 40 As we can see from the error results and the graphics, most accur forecasting is 5 day average. It's MAD and MSE is lower than in an
- 5. 40 35 30 25 Forecast 10 day 20 Avg 15 Real Data 10 5 0 1 4 7 10 13 16 19 22 25 28 31 34 37 40 40 35 30 25 Forecast Exp 20 Smooth 15 Real Data 10 5 0 1 4 7 10 13 16 19 22 25 28 31 34 37 40 r results and the graphics, most accurate method of It's MAD and MSE is lower than in any other method