DAILY COMMODITY REPORT BY EPIC RESEARCH- 17 DECEMBER 2012
20120103 pfl biofuelmarketsdaily
1. Desk: 239-390-2885
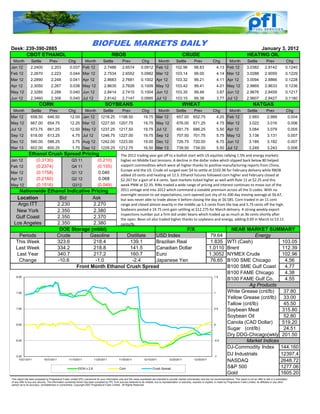
BIOFUEL MARKETS DAILY January 3, 2012
CBOT ETHANOL RBOB CRUDE HEATING OIL
Month Settle Prev Chg Month Settle Prev Chg Month Settle Prev Chg Month Settle Prev Chg
Jan 12 2.2400 2.203 0.037 Feb 12 2.7486 2.6574 0.0912 Feb 12 102.96 98.83 4.13 Feb 12 3.0382 2.9142 0.1240
Feb 12 2.2670 2.223 0.044 Mar 12 2.7534 2.6552 0.0982 Mar 12 103.14 99.00 4.14 Mar 12 3.0288 2.9059 0.1229
Mar 12 2.2890 2.248 0.041 Apr 12 2.8683 2.7681 0.1002 Apr 12 103.32 99.21 4.11 Apr 12 3.0094 2.8866 0.1228
Apr 12 2.3050 2.267 0.038 May 12 2.8635 2.7626 0.1009 May 12 103.42 99.41 4.01 May 12 2.9869 2.8633 0.1236
May 12 2.3280 2.288 0.040 Jun 12 2.8414 2.7410 0.1004 Jun 12 103.35 99.48 3.87 Jun 12 2.9676 2.8459 0.1217
Jun 12 2.3460 2.306 0.040 Jul 12 2.8142 2.7147 0.0995 Jul 12 103.15 99.38 3.77 Jul 12 2.9607 2.8427 0.1180
CORN SOYBEANS WHEAT NATGAS
Month Settle Prev Chg Month Settle Prev Chg Month Settle Prev Chg Month Settle Prev Chg
Mar 12 658.50 646.50 12.00 Jan 12 1218.25 1198.50 19.75 Mar 12 657.00 652.75 4.25 Feb 12 2.993 2.989 0.004
May 12 667.00 654.75 12.25 Mar 12 1227.50 1207.75 19.75 May 12 676.00 671.25 4.75 Mar 12 3.022 3.016 0.006
Jul 12 673.75 661.25 12.50 May 12 1237.25 1217.50 19.75 Jul 12 691.75 686.25 5.50 Apr 12 3.084 3.079 0.005
Sep 12 618.00 613.25 4.75 Jul 12 1246.75 1227.00 19.75 Sep 12 707.50 701.75 5.75 May 12 3.138 3.131 0.007
Dec 12 590.00 586.25 3.75 Aug 12 1242.00 1223.00 19.00 Dec 12 726.75 720.00 6.75 Jun 12 3.189 3.182 0.007
Mar 13 602.00 600.25 1.75 Sep 12 1229.25 1212.75 16.50 Mar 13 739.50 734.00 5.50 Jul 12 3.249 3.243 0.006
Ethanol Crush Spread Pricing The 2012 trading year got off to a bullish start with US equities rallying 1.5% and energy markets
Jan 12 (0.3130) Q3 11 (0.210) higher on Middle East tensions. A decline in the dollar index which slipped back below 80 helped
Feb 12 (0.2374) Q4 11 (0.155) support commodities which were all higher thanks to positive manufacturing reports from China,
Europe and the US. Crude oil surged over $4 to settle at $102.96 for February delivery while RBOB
Mar 12 (0.1758) Q1 12 0.040
added 10 cents and heating oil 12.5. Ethanol futures followed corn higher and February closed at
Apr 12 (0.2160) Q2 12 0.068 $2.267 for a gain of 4.4 cents. Spot markets ticked higher as well with Rule 11 at $2.25 and this
May 12 (0.1516) Q312 (0.049) week PNW at $2.35. RINs traded a wide range of pricing and interest continues to move out of the
Nationwide Ethanol Indicative Pricing 2011 vintage and into 2012 which command a sizeable premium across all the D codes. With no
overnight session to set expectations, corn opened just shy of its 200 day moving average at $6.67,
Location Bid Ask but was never able to trade above it before closing the day at $6.585. Corn traded in an 11 cent
Argo ITT 2.230 2.270 range and closed almost exactly in the middle up 5.5 cents from the low and 5.75 cents off the high.
New York 2.350 2.380 Soybeans posted a 19.75 cent gain settling at $12.275 for March delivery. A strong weekly export
inspections number put a firm bid under beans which traded up as much as 36 cents shortly after
Gulf Coast 2.350 2.370 the open. Bean oil also traded higher thanks to soybeans and energy, adding 0.69 in March to 53.11
Los Angeles 2.350 2.380 f cents/lb.
DOE Storage (mbbl) F/X NEAR MARKET SUMMARY
Periods Crude Gasoline Distillate USD Index 79.64 Energy
This Week 323.6 218.4 139.1 Brazilian Real 1.835 WTI (Cash) 103.05
Last Week 334.2 218.8 141.5 Canadian Dollar 1.0110 Brent 112.39
Last Year 340.7 217.2 160.7 Euro 1.3052 NYMEX Crude 102.96
Change -10.6 -1.0 -2.4 Japanese Yen 76.65 B100 SME Chicago 4.56
Front Month Ethanol Crush Spread B100 SME Gulf Coast 4.77
B100 FAME Chicago 4.38
8.00 1.5
B100 FAME Gulf Co. 4.55
Ag Products
7.50 1 White Grease (cnt/lb) 37.80
Yellow Grease (cnt/lb) 33.00
Tallow (cnt/lb) 45.50
7.00 0.5
Soybean Meal 315.80
Soybean Oil 52.80
6.50 0
Canola (CAD Dollar) 519.20
Sugar (cnt/lb) 24.51
Dry DDG-Chicago(wkly 201.50
6.00 -0.5 Market Indices
DJ-Commodity Index 144.160
5.50 -1
DJ Industrials 12397.4
10/21/2011 10/31/2011 11/10/2011 11/20/2011 11/30/2011 12/10/2011 12/20/2011 12/30/2011
NASDAQ 2648.72
EtOH x 2.8 Corn Crush Spread S&P 500 1277.06
Gold 1605.20
This report has been prepared by Progressive Fuels Limited (PFL) personnel for your information only and the views expressed are intended to provide market commentary and are not recommendations. This report is not an offer to sell or a solicitation
of any offer to buy any security. The information contained herein has been compiled by PFL from sources believed to be reliable, but no representation or warranty, express or implied, is made by Progressive Fuels Limited, its affiliates or any other
person as to its accuracy, completeness or correctness. Copyright 2007 Progressive Fuels Limited. All Rights Reserved.
2. PFL BIOFUEL MARKETS DAILY COMMENTARY January 3, 2012
RBOB/Ethanol/RINs
3.00 0.10
2.90 0.09
2.80 0.08
2.70 0.07
2.60 0.06
2.50 0.05
2.40 0.04
2.30 0.03
2.20 0.02
2.10 0.01
2.00 0.00
21-Oct 10-Nov 30-Nov 20-Dec
RBOB Ethanol 10 E RINs 11 E RINS
Ethanol RIN Pricing (cts/RIN) Biodiesel RIN Pricing (cts/RIN)
Year Type Bid Ask Year Type Bid Ask
2010 D6 0.10 0.15 2010 D4 131.00 136.00
2010 D3 90.00 105.00 2010 D5 60.00 70.00
2011 D6 0.32 0.40 2011 D4 124.00 127.00
2011 D3 113.00 113.00 2011 D5 78.00 82.00
2012 D6 1.70 2.20 2012 D4 153.00 156.00
2012 D3 113.00 113.00 2012 D5 90.00 95.00
D6 = Corn Ethanol RIN D4 = Biodiesel RIN
D3 = Cellulosic Ethanol RIN D5 = Advanced Biodiesel or Renewable Diesel RIN
RBOB CBOT Ethanol RBOB/Etoh Ethanol Swaps Nationwide Etoh Pricing
Month(s) Spread CBOT Location Bid Ask
Jan 12 2.7486 2.2400 (0.5086) Month(s) Bid Ask Atlanta/Doraville 2.360 2.390
Feb 12 2.7534 2.2670 (0.4864) Feb-12 2.260 2.275 Chicago Rule 11 2.240 2.270
Mar 12 2.8683 2.2890 (0.5793) Mar-12 2.300 2.315 Dallas 2.250 2.270
Apr 12 2.8635 2.3050 (0.5585) Q2 12 2.335 2.350 FOB NE BN 2.110 2.130
May 12 2.8414 2.3280 (0.5134) Q3 12 2.870 2.885 FOB NE UP 2.130 2.150
Jun 12 2.8142 2.3460 (0.4682) Q4 12 2.135 2.155 Northern California 2.350 3.370
Jul 12 2.7856 2.3550 (0.4306) Q1 13 2.130 2.150 Pacifc Northwest 2.330 2.360
Soybean Oil/Heating Oil/Biodiesl RINs
2.0000
4.30
4.10
1.8000
3.90
1.6000
3.70
3.50 1.4000
26.85
3.30
1.2000
3.10
1.0000
2.90
2.70 0.8000
21-Oct 31-Oct 10-Nov 20-Nov 30-Nov 10-Dec 20-Dec 30-Dec
BO $/gal HO 10 BD 11 BD
This report has been prepared by Progressive Fuels Limited (PFL) personnel for your information only and the views expressed are intended to provide market commentary and are not recommendations. This report is not an offer to sell or a solicitation of any
offer to buy any security. The information contained herein has been compiled by PFL from sources believed to be reliable, but no representation or warranty, express or implied, is made by Progressive Fuels Limited, its affiliates or any other person as to its
accuracy, completeness or correctness. Copyright 2007 Progressive Fuels Limited. All Rights Reserved.
3. PFL BIOFUEL MARKETS DAILY COMMENTARY January 3, 2012
ETHANOL CHART CORN
R3 2.409 660 R3 693.2
2.800 R2 2.358 650 R2 683.1
2.700 R1 2.309 640
R1 671.9
630
2.600 S1 2.175 620
S1 645.6
2.500 S2 2.133 610 S2 634.4
2.400 S3 2.093 600 S3 624.8
2.300 5DMA 2.220 590
5DMA 643.3
580
2.200
20DMA 2.167 570
20DMA 618.6
2.100
100DMA 2.577 560 100DMA 639.5
2.000 8-Nov 23-Nov 8-Dec 23-Dec
15-Nov 30-Nov 15-Dec 30-Dec
RBOB SOYBEANS
2.8
R3 2.9240 1240
R3 1285.1
2.75
R2 2.8631 R2 1261.1
1220
R1 2.8336 R1 1243.1
2.7
1200
S1 2.6685 S1 1194.4
2.65
S2 2.6177 1180 S2 1178.2
2.6
S3 2.5688 1160 S3 1151.5
2.55
5DMA 2.6943 1140
5DMA 1197.3
2.5
20DMA 2.6259 20DMA 1164.4
1120
2.45 100DMA 2.6843 100DMA 1217.7
1100
2.4
8-Nov 23-Nov 8-Dec 23-Dec
8-Nov 23-Nov 8-Dec 23-Dec
.
CRUDE WHEAT
R3 114.40 665
R3 709.5
104 R2 109.53 655 R2 698.9
102 R1 106.14 645 R1 684.4
100 S1 99.96 635
S1 631.7
625
98 S2 97.13 S2 619.8
615
96
S3 93.60 605
S3 752.2
5DMA 100.48 595
5DMA 647.1
94
20DMA 98.78 585 20DMA 620.5
92
100DMA 94.52 575 100DMA 638.6
90 565
8-Nov 20-Nov 2-Dec 14-Dec 26-Dec 8-Nov 23-Nov 8-Dec 23-Dec
HEATING OIL NATURAL GAS
3.2 R3 3.2133 R3 3.253
3.15 R2 3.1241 3.9 R2 3.151
3.1
R1 3.0767 R1 3.054
3.05 3.7
S1 3.0007 S1 2.934
3
2.95
S2 2.9641 3.5 S2 2.850
2.9 S3 2.8894 S3 2.806
3.3
2.85 5DMA 2.9537 5DMA 3.034
2.8 20DMA 2.9261 3.1 20DMA 3.182
2.75 100DMA 2.9645 100DMA 3.588
2.7 2.9
8-Nov 23-Nov 8-Dec 23-Dec 3-Nov 18-Nov 3-Dec 18-Dec 2-Jan
WEATHER
City H/L Snow showers will linger in the northern Pennsylvania and
Chicago 25/20 Upstate New York and northern New England today with some
New York 29/18 windy Mid‐Atlantic gust. The coldest air of the season so far
Houston 59/47 invades the Southeast with temperatures 5 to 20 degrees below
Los Angeles 82/54 average while the southern Plains enjoy mild, above average
temperatures. Some show showers will hit the northernmost
Washington D.C. 34/20 Idaho and northwest Montana. Aside from the spot snow
St. Louis 34/28 showers, the West will remain dry.
Naples, Florida 61/52
This report has been prepared by Progressive Fuels Limited (PFL) personnel for your information only and the views expressed are intended to provide market commentary and are
not recommendations. This report is not an offer to sell or a solicitation of any offer to buy any security. The information contained herein has been compiled by PFL from sources
believed to be reliable, but no representation or warranty, express or implied, is made by Progressive Fuels Limited, its affiliates or any other person as to its accuracy, completeness
or correctness. Copyright 2007 Progressive Fuels Limited. All Rights Reserved.