1. Desk: 239-390-2885
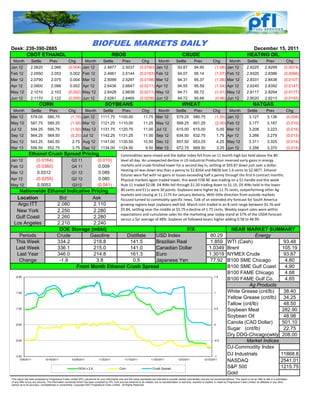
BIOFUEL MARKETS DAILY December 15, 2011
CBOT ETHANOL RBOB CRUDE HEATING OIL
Month Settle Prev Chg Month Settle Prev Chg Month Settle Prev Chg Month Settle Prev Chg
Jan 12 2.0620 2.066 (0.004) Jan 12 2.4877 2.5037 (0.0160) Jan 12 93.87 94.95 (1.08) Jan 12 2.8225 2.8299 (0.0074)
Feb 12 2.0550 2.053 0.002 Feb 12 2.4961 2.5144 (0.0183) Feb 12 94.07 95.14 (1.07) Feb 12 2.8320 2.8386 (0.0066)
Mar 12 2.0790 2.075 0.004 Mar 12 2.5099 2.5297 (0.0198) Mar 12 94.31 95.37 (1.06) Mar 12 2.8331 2.8438 (0.0107)
Apr 12 2.0900 2.088 0.002 Apr 12 2.6436 2.6647 (0.0211) Apr 12 94.55 95.59 (1.04) Apr 12 2.8245 2.8392 (0.0147)
May 12 2.1010 2.103 (0.002) May 12 2.6428 2.6639 (0.0211) May 12 94.71 95.72 (1.01) May 12 2.8117 2.8294 (0.0177)
Jun 12 2.1170 2.122 (0.005) Jun 12 2.6261 2.6469 (0.0208) Jun 12 94.72 95.68 (0.96) Jun 12 2.8020 2.8213 (0.0193)
CORN SOYBEANS WHEAT NATGAS
Month Settle Prev Chg Month Settle Prev Chg Month Settle Prev Chg Month Settle Prev Chg
Mar 12 579.00 580.75 (1.75) Jan 12 1111.75 1100.00 11.75 Mar 12 579.25 580.75 (1.50) Jan 12 3.127 3.136 (0.009)
May 12 587.75 589.25 (1.50) Mar 12 1121.25 1110.00 11.25 May 12 599.25 601.25 (2.00) Feb 12 3.177 3.187 (0.010)
Jul 12 594.25 595.75 (1.50) May 12 1131.75 1120.75 11.00 Jul 12 615.00 615.00 0.00 Mar 12 3.208 3.223 (0.015)
Sep 12 564.25 564.50 (0.25) Jul 12 1142.25 1131.25 11.00 Sep 12 634.50 632.75 1.75 Apr 12 3.266 3.279 (0.013)
Dec 12 543.25 540.50 2.75 Aug 12 1141.00 1130.50 10.50 Dec 12 657.50 653.25 4.25 May 12 3.311 3.325 (0.014)
Mar 13 556.50 552.75 3.75 Sep 12 1134.00 1124.50 9.50 Mar 13 672.75 669.50 3.25 Jun 12 3.356 3.370 (0.014)
Ethanol Crush Spread Pricing Commodities were mixed and the dollar index fell from an 11 month high but held above the 80
Jan 12 (0.0164) Q3 11 (0.010) level all day. An unexpected decline in US Industrial Production reversed early gains in energy
Feb 12 (0.0360) Q4 11 0.009 markets and crude finished lower for a second day in, settling at $93.87 down just over a dollar.
Heating oil was down less than a penny to $2.8264 and RBOB lost 1.6 cents to $2.4877. Ethanol
Mar 12 0.0312 Q1 12 0.089
futures were flat with no gains or losses exceeding half a penny through the first 6 contract months.
Apr 12 (0.0255) Q2 12 0.080 Physical markets again traded lower, this week FOB NE was trading on a $1 handle and this week
May 12 0.0053 Q312 (0.041) Rule 11 traded $2.08. D4 RINs fell through $1.20 trading down to $1.15, D5 RINs held in the lower
Nationwide Ethanol Indicative Pricing 80 cents and E11s were 30 points. Soybeans were higher by 11.75 cents, outperforming other Ag
markets and closing at 11.1175 for January delivery. With little direction from outside markets
Location Bid Ask focused turned to commodity specific news. Talk of an extended dry forecast for South America
Argo ITT 2.080 2.110 growing regions kept soybeans well bid. March corn traded in an 8 cent range between $5.76 and
New York 2.250 2.280 $5.84, settling near the middle at $5.79 a decline of 1.75 cents. Weekly export sales were within
expectations and cumulative sales for the marketing year today stand at 57% of the USDA forecast
Gulf Coast 2.260 2.280 versus a 5yr average of 48%. Soybean oil followed beans higher adding 0.58 to 48.99.
Los Angeles 2.210 2.240 f
DOE Storage (mbbl) F/X NEAR MARKET SUMMARY
Periods Crude Gasoline Distillate USD Index 80.29 Energy
This Week 334.2 218.8 141.5 Brazilian Real 1.859 WTI (Cash) 93.48
Last Week 336.1 215.0 141.0 Canadian Dollar 1.0349 Brent 105.19
Last Year 346.0 214.8 161.3 Euro 1.3019 NYMEX Crude 93.87
Change -1.9 3.8 0.5 Japanese Yen 77.92 B100 SME Chicago 4.80
Front Month Ethanol Crush Spread B100 SME Gulf Coast 4.90
B100 FAME Chicago 4.68
8.00 1.5
B100 FAME Gulf Co. 4.65
Ag Products
7.50 1 White Grease (cnt/lb) 38.40
Yellow Grease (cnt/lb) 34.25
Tallow (cnt/lb) 48.50
7.00 0.5
Soybean Meal 282.90
Soybean Oil 48.98
6.50 0
Canola (CAD Dollar) 501.10
Sugar (cnt/lb) 22.75
Dry DDG-Chicago(wkly 208.00
6.00 -0.5 Market Indices
DJ-Commodity Index
5.50 -1
DJ Industrials 11868.8
10/6/2011 10/16/2011 10/26/2011 11/5/2011 11/15/2011 11/25/2011 12/5/2011 12/15/2011
NASDAQ 2541.01
EtOH x 2.8 Corn Crush Spread S&P 500 1215.75
Gold
This report has been prepared by Progressive Fuels Limited (PFL) personnel for your information only and the views expressed are intended to provide market commentary and are not recommendations. This report is not an offer to sell or a solicitation
of any offer to buy any security. The information contained herein has been compiled by PFL from sources believed to be reliable, but no representation or warranty, express or implied, is made by Progressive Fuels Limited, its affiliates or any other
person as to its accuracy, completeness or correctness. Copyright 2007 Progressive Fuels Limited. All Rights Reserved.
2. PFL BIOFUEL MARKETS DAILY COMMENTARY December 15, 2011
RBOB/Ethanol/RINs
3.00 0.10
2.90 0.09
2.80 0.08
2.70 0.07
2.60 0.06
2.50 0.05
2.40 0.04
2.30 0.03
2.20 0.02
2.10 0.01
2.00 0.00
6-Oct 26-Oct 15-Nov 5-Dec
RBOB Ethanol 10 E RINs 11 E RINS
Ethanol RIN Pricing (cts/RIN) Biodiesel RIN Pricing (cts/RIN)
Year Type Bid Ask Year Type Bid Ask
2010 D6 0.10 0.20 2010 D4 125.00 130.00
2010 D3 90.00 105.00 2010 D5 60.00 70.00
2011 D6 0.30 0.40 2011 D4 115.00 120.00
2011 D3 113.00 113.00 2011 D5 82.00 87.00
2012 D6 3.40 3.60 2012 D4 144.00 148.00
2012 D3 113.00 113.00 2012 D5 91.00 96.00
D6 = Corn Ethanol RIN D4 = Biodiesel RIN
D3 = Cellulosic Ethanol RIN D5 = Advanced Biodiesel or Renewable Diesel RIN
RBOB CBOT Ethanol RBOB/Etoh Ethanol Swaps Nationwide Etoh Pricing
Month(s) Spread CBOT Location Bid Ask
Jan 12 2.4877 2.0620 (0.4257) Month(s) Bid Ask Atlanta/Doraville 2.240 2.270
Feb 12 2.4961 2.0550 (0.4411) Jan-12 2.050 2.650 Chicago Rule 11 2.070 2.090
Mar 12 2.5099 2.0790 (0.4309) Feb-12 2.070 2.085 Dallas 2.180 2.200
Apr 12 2.6436 2.0900 (0.5536) Q1 12 2.070 2.085 FOB NE BN 1.960 1.980
May 12 2.6428 2.1010 (0.5418) Q2 12 2.110 2.125 FOB NE UP 1.980 2.000
Jun 12 2.6261 2.1170 (0.5091) Q3 12 2.070 2.090 Northern California 2.220 2.250
Jul 12 2.6045 2.1350 (0.4695) Q4 12 1.975 1.995 Pacifc Northwest 2.250 2.270
Soybean Oil/Heating Oil/Biodiesl RINs
2.0000
4.30
4.10
1.8000
3.90
1.6000
3.70
3.50 1.4000
26.85
3.30
1.2000
3.10
1.0000
2.90
2.70 0.8000
6-Oct 16-Oct 26-Oct 5-Nov 15-Nov 25-Nov 5-Dec 15-Dec
BO $/gal HO 10 BD 11 BD
This report has been prepared by Progressive Fuels Limited (PFL) personnel for your information only and the views expressed are intended to provide market commentary and are not recommendations. This report is not an offer to sell or a solicitation of any
offer to buy any security. The information contained herein has been compiled by PFL from sources believed to be reliable, but no representation or warranty, express or implied, is made by Progressive Fuels Limited, its affiliates or any other person as to its
accuracy, completeness or correctness. Copyright 2007 Progressive Fuels Limited. All Rights Reserved.
3. PFL BIOFUEL MARKETS DAILY COMMENTARY December 15, 2011
ETHANOL CHART CORN
R3 2.217 660 R3 609.5
2.800 R2 2.171 650 R2 600.6
2.700 R1 2.126 640
R1 590.8
630
2.600 S1 2.002 620
S1 567.6
2.500 S2 1.964 610 S2 557.8
2.400 S3 1.927 600 S3 549.3
2.300 5DMA 2.094 590
5DMA 582.6
580
2.200
20DMA 2.357 570
20DMA 595.3
2.100
100DMA 2.646 560 100DMA 643.2
2.000 24-Oct 8-Nov 23-Nov 8-Dec
31-Oct 15-Nov 30-Nov 15-Dec
RBOB SOYBEANS
2.8
R3 2.6465 1300
R3 1172.7
2.75
R2 2.5914 1280 R2 1150.9
R1 2.5646 1260 R1 1134.4
2.7
S1 2.4152 1240 S1 1090.0
2.65 1220
S2 2.3692 S2 1075.2
2.6 1200
S3 2.3250 1180
S3 1050.8
2.55
5DMA 2.5394 1160 5DMA 1112.3
2.5
20DMA 2.5697 1140 20DMA 1132.4
2.45 100DMA 2.6960 1120 100DMA 1228.6
1100
2.4
24-Oct 8-Nov 23-Nov 8-Dec
24-Oct 8-Nov 23-Nov 8-Dec
.
CRUDE WHEAT
R3 104.30 665
R3 625.5
102
R2 99.86 655 R2 616.2
R1 96.77 645 R1 603.4
97 S1 91.14 635
S1 557.0
625
S2 88.56 S2 546.5
615
92 S3 85.34 605
S3 752.2
5DMA 96.57 595
5DMA 583.4
87 20DMA 97.82 585 20DMA 592.7
100DMA 9349.00 575 100DMA 641.1
82 565
24-Oct 5-Nov 17-Nov 29-Nov 11-Dec 24-Oct 8-Nov 23-Nov 8-Dec
HEATING OIL NATURAL GAS
3.2 R3 2.9852 R3 3.399
3.15 R2 2.9023 3.9 R2 3.292
3.1 R1 2.8582 3.8 R1 3.191
3.05
S1 2.7877 3.7 S1 3.066
3
S2 2.7537 3.6 S2 2.978
S3 2.6843 3.5 S3 2.932
2.95
5DMA 2.8730 3.4 5DMA 3.223
2.9
20DMA 2.9557 3.3
20DMA 3.396
2.85 3.2
100DMA 2.9811 100DMA 3.711
2.8 3.1
24-Oct 8-Nov 23-Nov 8-Dec 19-Oct 3-Nov 18-Nov 3-Dec
WEATHER
City H/L A rainy and snowy wintery mix is expected in the Northeast today as a
Chicago 47/26 system moves in with the interior area with the most impact. Rain will
New York 59/45 stretch from the Rio Grande Valley through the Tennessee Valley and into
the Southern Appalachians today and into tonight with warmer than
Houston 76/54 average temperatures expected for the South. The Ohio Valley expects
Los Angeles 63/45 some windy and rainy weather today and into tonight with mild
temperatures for the day in the Mississippi Valley into the Plains. Rain
Washington D.C. 60/47 showers are expected to spread from the Pacific Northwest and Northern
St. Louis 53/29 California Coast southward to Southern California and the Lower Colorado
Naples, Florida 80/60 Valley tonight.
This report has been prepared by Progressive Fuels Limited (PFL) personnel for your information only and the views expressed are intended to provide market commentary and are
not recommendations. This report is not an offer to sell or a solicitation of any offer to buy any security. The information contained herein has been compiled by PFL from sources
believed to be reliable, but no representation or warranty, express or implied, is made by Progressive Fuels Limited, its affiliates or any other person as to its accuracy, completeness
or correctness. Copyright 2007 Progressive Fuels Limited. All Rights Reserved.