2014, REPORT, Mongolia Economy outlook 2014, Asian Development Bank
•
0 likes•365 views

REPORT

Recommended
Recommended
More Related Content
What's hot
What's hot (19)
Viewers also liked
Viewers also liked (20)
Similar to 2014, REPORT, Mongolia Economy outlook 2014, Asian Development Bank
Similar to 2014, REPORT, Mongolia Economy outlook 2014, Asian Development Bank (20)
More from The Business Council of Mongolia
More from The Business Council of Mongolia (20)
Recently uploaded
Recently uploaded (20)
2014, REPORT, Mongolia Economy outlook 2014, Asian Development Bank
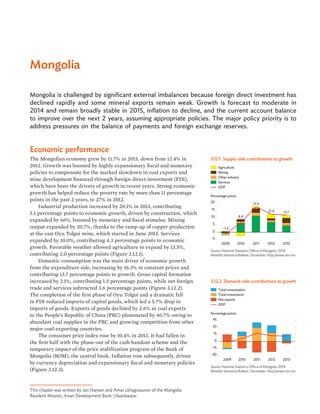
- 1. This chapter was written by Jan Hansen and Amar Lkhagvasuren of the Mongolia Resident Mission, Asian Development Bank, Ulaanbaatar. Mongolia Mongolia is challenged by significant external imbalances because foreign direct investment has declined rapidly and some mineral exports remain weak. Growth is forecast to moderate in 2014 and remain broadly stable in 2015, inflation to decline, and the current account balance to improve over the next 2 years, assuming appropriate policies. The major policy priority is to address pressures on the balance of payments and foreign exchange reserves. Economic performance The Mongolian economy grew by 11.7% in 2013, down from 12.4% in 2012. Growth was boosted by highly expansionary fiscal and monetary policies to compensate for the marked slowdown in coal exports and mine development financed through foreign direct investment (FDI), which have been the drivers of growth in recent years. Strong economic growth has helped reduce the poverty rate by more than 11 percentage points in the past 2 years, to 27% in 2012. Industrial production increased by 20.1% in 2013, contributing 5.1 percentage points to economic growth, driven by construction, which expanded by 66%, boosted by monetary and fiscal stimulus. Mining output expanded by 20.7%, thanks to the ramp-up of copper production at the vast Oyu Tolgoi mine, which started in June 2013. Services expanded by 10.0%, contributing 4.3 percentage points to economic growth. Favorable weather allowed agriculture to expand by 13.5%, contributing 2.0 percentage points (Figure 3.12.1). Domestic consumption was the main driver of economic growth from the expenditure side, increasing by 16.3% in constant prices and contributing 13.7 percentage points to growth. Gross capital formation increased by 2.1%, contributing 1.5 percentage points, while net foreign trade and services subtracted 3.6 percentage points (Figure 3.12.2). The completion of the first phase of Oyu Tolgoi and a dramatic fall in FDI reduced imports of capital goods, which led a 5.7% drop in imports of goods. Exports of goods declined by 2.6% as coal exports to the People’s Republic of China (PRC) plummeted by 40.7% owing to abundant coal supplies in the PRC and growing competition from other major coal-exporting countries. The consumer price index rose by 10.4% in 2013. It had fallen in the first half with the phase-out of the cash handout scheme and the temporary impact of the price stabilization program of the Bank of Mongolia (BOM), the central bank. Inflation rose subsequently, driven by currency depreciation and expansionary fiscal and monetary policies (Figure 3.12.3). 3.12.1 Supply-side contributions to growth Percentage points Mining Other industry Services GDP –1.3 6.4 17.5 12.4 11.7 –5 0 5 10 15 20 2009 2010 2011 2012 2013 Agriculture Source: National Statistics Office of Mongolia. 2014. Monthly Statistical Bulletin. December. http://www.nso.mn 3.12.2 Demand-side contributions to growth Percentage points Total consumption Total investments Net exports GDP –30 –15 0 15 30 45 2009 2010 2011 2012 2013 Source: National Statistics Office of Mongolia. 2014. Monthly Statistical Bulletin. December. http://www.nso.mn
- 2. Economic trends and prospects in developing Asia: East Asia Mongolia 147 Fiscal policy became more expansionary in 2013 as the consolidated, on- and off-budget fiscal deficit widened to 11.1% of GDP from 10.9% in 2012. Excluding off budget spending, the cash deficit amounted to 1.4% of GDP, lower than the 7.4% recorded in 2012, and the structural deficit reached 1.7%, within the 2% ceiling of the Fiscal Stability Law (FSL). Actual government revenue increased by 19.6%, less than the budgeted (and highly optimistic) amount. Revenue shortages and implementation challenges reduced public investment expenditure by 5.1%, holding the increase in government expenditure to a mere 3.1% (Figure 3.12.4). The Development Bank of Mongolia (DBM) has become the main source of financing for off-budget spending, providing an amount equal to 9.6% of GDP in 2013 mainly for projects such as roads that do not generate revenue. The main source of DBM financing is proceeds from the Chinggis bond and a 5-year, $580 million euro bond issued in 2012, and the $290 million Samurai bond issued in December 2013. DBM debt is guaranteed by the government and so a contingent liability for the budget. The ratio of public debt to GDP rose from 35.9% in 2010 to 63.0% in 2012, and likely remained broadly unchanged in 2013, though no official data are yet available. The external debt component equaled 48.3% of GDP in 2012. A debt sustainability analysis conducted in 2013 by the International Monetary Fund found Mongolia at moderate risk of debt distress, assuming a strong policy scenario—no longer at low risk, as found by previous analyses. Public debt sustainability has been impaired by the rising share of borrowing at commercial rates since 2012. To cushion the impact of declining FDI and boost credit growth, the BOM cut the policy rate three times in 2013 by a total of 275 basis points to 10.5%. It injected liquidity equal to 17.1% of GDP, including for onlending to selected sectors through price stabilization and mortgage programs at subsidized interest rates. Bank credit increased as a result by 41.0% year on year in 2013 and by 54.3% year on year to January 2014. Broad money (M2) increased by 19.3% and 36.6% year on year during the same periods (Figure 3.12.5). These policies are widely seen as important factors behind balance-of-payment (BOP) pressures starting last year. Capitalization and liquidity in the banking system have improved, but vulnerabilities remain. Weakness in bank supervision, inadequate provisioning, high loan concentration (especially in construction), dollarization, and a high and rising ratio of credit to deposits (at 103% in February 2014) have heightened the risk of bank distress. Corporate governance needs to be strengthened in the banking sector. The current account deficit narrowed in 2013 to $3.2 billion, or 27.4% of GDP, from 32.6% in 2012 (Figure 3.12.6). The trade deficit improved to 18.1% of GDP from 22.8% in 2012 as the decline in imports outpaced that of exports, but the services and transfers balance worsened. Since mid-2013, the trade and current account deficits have both narrowed as currency depreciation strengthened export competitiveness and constrained imports—and as exports were boosted by the start of production at the Oyu Tolgoi mine. FDI plunged by about 55% in 2013 because of uncertainties arising from changes in the investment law, slower growth in the PRC, the completion of the first phase of Oyu 3.12.3 Monthly inflation % Headline Core 0 6 12 18 Jan 2014 JulJan 2013 JulJan 2012 JulJan 2011 Source: Bank of Mongolia. 2014. Statistical Bulletin. January. http://www.mongolbank.mn 3.12.4 Fiscal indicators % year on year % of GDP –70 –35 0 35 70 –10 –5 0 5 10 201420132012201120102009 Budget estimate Revenue Spending Structural balance Budget balance Source: National Statistical Office. 2014. Monthly Statistical Bulletin. http://www.nso.mn 3.12.5 Money supply and total bank lending %, year on year –20 0 20 40 60 80 2013201220112010 Money supply Total bank lending Source: Bank of Mongolia. http://www.mongolbank.mn
- 3. 148 Asian Development Outlook 2014 Tolgoi, and delays in the expected commencement of the mine’s second phase. Foreign exchange reserves almost halved in 2013, falling by $1.9 billion to $2.2 billion, or 4 months of imports. They increased to $2.4 billion in January after the DBM issued a $290 million samurai bond 90% guaranteed by the Japan Bank for International Cooperation. The Mongolian togrog has depreciated by 27% against the US dollar since early 2013 as capital inflows ebbed and market sentiment weakened over prolonged debate surrounding Oyu Tolgoi issues and over uncertainty regarding the regulatory framework for foreign investment. The nominal effective exchange rate of the togrog fell by 15.5%, but the real effective exchange rate fell by only 7.2% as inflation in Mongolia exceeded that of its trading partners (Figure 3.12.7). In October 2013, the parliament enacted a new comprehensive investment law, which aims to encourage FDI over the medium-term by leveling the playing field for foreign and domestic investors and ensuring a stable legal environment for investment. Under the law, the category of “strategic investor” no longer applies, and private foreign investors need only register with a state agency, rather than seek government approval. Economic prospects Medium-term prospects remain promising, with growth expected in the double digits after a dip in 2014, given Mongolia’s potential to develop its natural resources. Economic growth is forecast at 9.5% in 2014, driven in particular by the start of copper production at the Oyu Tolgoi open pit in June of last year. Growth in non-mineral output is expected to be held back by the tighter economic policy, which will be needed to reduce high domestic demand and so relieve BOP pressures. In particular, the overall budgetary deficit including off-budget outlays is expected to be lower than in 2013, as the DBM curtails investment expenditure and as BOM liquidity injections are expected to begin their phaseout this year. Economic growth is expected to pick up slightly to 10% in 2015, spurred by further development in mining, including the possible development of the Oyu Tolgoi underground mine and an expansion of coal production from the Tavan Tolgoi mine (Figure 3.12.8). Non-mining growth is expected to accelerate as restrictive economic policies are eased and FDI flows are assumed to partly recover. Inflation in 2014 is expected to increase to 11%, driven by the lagged effect of expansionary monetary policy in 2013 and the recent depreciation of the togrog. Inflationary pressure in 2015 is expected to ease, assuming a tightening of economic policy in 2014 and a more stable exchange rate, with inflation falling to 8% consistent with BOM monetary policy (Figure 3.12.9). The current account deficit is forecast to fall to 20% of GDP in 2014 and 15% in 2015 as the trade balance improves. Exports are expected to grow following the start of Oyu Tolgoi production last year, and as new mining projects come onstream. The recent exchange rate depreciation and the expected tightening of economic policy will further constrain domestic absorption and dampen imports. The new investment law and 3.12.6 External balance indicators % of GDP Current account balance Goods & services, net Income, net Transfers, net Foreign direct investment 2009 2010 2011 2012 2013 –60 –30 0 30 60 Sources: National Statistical Office. http://www.nso.mn; Bank of Mongolia. http://www.mongolbank.mn 3.12.7 Exchange rate MNT/$ Dec 2000 = 100 Monthly average 1,200 1,400 1,600 1,800 100 120 140 160 Jan 2014 Jan 2013 Jan 2012 Jan 2011 Jan 2010 Jan 2009 Real effective Source: Bank of Mongolia. http://www.mongolbank.mn (accessed 17 March 2014). 3.12.8 GDP growth –6 0 6 12 18 2015201420132012201120102009 % 5-year moving average Forecast Source: Asian Development Outlook database. 3.12.9 Inflation 0 5 10 15 2015201420132012201120102009 % 5-year moving average Forecast Source: Asian Development Outlook database.
- 4. Economic trends and prospects in developing Asia: East Asia Mongolia 149 the planned second phase of Oyu Tolgoi development are expected to support a recovery in FDI inflows, further stabilizing the BOP. Mongolia’s economic prospects are subject to downside risks from an uncertain external environment and the continuation of expansionary economic policies at a time when the BOP is under pressure. The PRC is the main destination for Mongolia’s exports, accepting about 87% of them in 2013. Mongolia is thus highly vulnerable as the PRC rebalances from investment-led growth toward greater reliance of consumption, which may initially dampen demand for Mongolia’s exports. Environmental concerns in the PRC may also reduce coal consumption. Further, substantial increase in global supplies and growing competition are putting Mongolia’s mineral exports on an uncertain growth trajectory. Future trends in Mongolia’s major export prices are also uncertain (Figure 3.12.10). On the domestic front, the continuation of current monetary and fiscal policies will inevitably perpetuate BOP and inflationary pressures, requiring significant real economic adjustments that may curtail growth. Policy challenge—safeguarding macroeconomic and financial stability The main policy challenge is to adjust unsustainable macroeconomic policies to relieve BOP pressure, contain inflation, and reduce the risk of severe distress in the financial sector. Negative shocks to FDI and coal exports have intensified BOP pressures since mid-2012. These pressures have been compounded by highly expansionary fiscal and monetary policies that have spurred substantial credit expansion and debt accumulation, as well as boosted demand for imports. While current foreign exchange reserves are broadly adequate, the declining trend is not sustainable. The resumption of significant foreign capital inflows may take some time despite the adoption of the new investment law. Current policy offers little room to strengthen financial buffers to cope with possible external shocks. Mongolia needs to change course to mitigate its vulnerability to external shocks. Addressing these challenges requires a comprehensive package of economic policy reforms, but improvements to monetary management and fiscal policy are the most urgent. Monetary policy should focus on macroeconomic and financial stability. The priority should be to gradually phase out the BOM’s quasi-fiscal lending programs—or, if they are considered high priority, include them in the budget. Procyclical fiscal policy is a major concern, although the discipline of the FSL, if adhered to in practice and in spirit, would reduce the scope for such a policy. Needed fiscal reforms include reprioritizing and reducing public expenditure, incorporating DBM off-budget expenditure into the budget (thereby subjecting it to the FSL), and developing a medium-term fiscal framework to reduce the consolidated, on- and off-budget deficit to the law’s 2% ceiling. Expenditure reform should include improving the quality of public investment expenditure, which has come under strain in view of the rapid increase in public investment. 3.12.10 Global prices of main exports 50 120 190 260 330 Jan 2014 Jan 2013 Jan 2012 Jan 2011 Jan 2010 Jan 2009 Iron ore Gold Copper Coal Jan 2009 = 100 Source: World Bank. Commodity Price Data (Pink Sheet). http://econ.worldbank.org (accessed 17 March 2014). 3.12.1 Selected economic indicators (%) 2014 2015 GDP growth 9.5 10.0 Inflation 11.0 8.0 Current account balance (share of GDP) –20.0 –15.0 Source: ADB estimates.