Ukraine Economic Update, April 2017
•
0 likes•97 views

The Ukrainian economy recovered modestly by 2.3% in 2016, with a bumper agriculture harvest leading to stronger growth of 4.8 percent in the fourth quarter. Decisive reforms in the face of unprecedented shocks in 2014 and 2015 helped to stabilize confidence. As a result, real GDP grew modestly by 2.3 percent in 2016 after contracting by a cumulative 16 percent in the previous two years. Signs of stronger growth of 4.8 percent (y-o-y) emerged in the fourth quarter of 2016. The recovery was supported by a bumper harvest, with agriculture growing by 6 percent in 2016 overall and 18.4 percent (y-o-y) in the fourth quarter.

Recommended
Recommended
More Related Content
What's hot
What's hot (20)
Similar to Ukraine Economic Update, April 2017
Similar to Ukraine Economic Update, April 2017 (20)
More from Eirhub
More from Eirhub (20)
Recently uploaded
Recently uploaded (20)
Ukraine Economic Update, April 2017
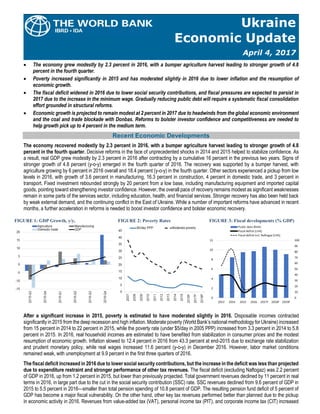
- 1. Ukraine Economic Update April 4, 2017 The economy grew modestly by 2.3 percent in 2016, with a bumper agriculture harvest leading to stronger growth of 4.8 percent in the fourth quarter. Poverty increased significantly in 2015 and has moderated slightly in 2016 due to lower inflation and the resumption of economic growth. The fiscal deficit widened in 2016 due to lower social security contributions, and fiscal pressures are expected to persist in 2017 due to the increase in the minimum wage. Gradually reducing public debt will require a systematic fiscal consolidation effort grounded in structural reforms. Economic growth is projected to remain modest at 2 percent in 2017 due to headwinds from the global economic environment and the coal and trade blockade with Donbas. Reforms to bolster investor confidence and competitiveness are needed to help growth pick up to 4 percent in the medium term. Recent Economic Developments The economy recovered modestly by 2.3 percent in 2016, with a bumper agriculture harvest leading to stronger growth of 4.8 percent in the fourth quarter. Decisive reforms in the face of unprecedented shocks in 2014 and 2015 helped to stabilize confidence. As a result, real GDP grew modestly by 2.3 percent in 2016 after contracting by a cumulative 16 percent in the previous two years. Signs of stronger growth of 4.8 percent (y-o-y) emerged in the fourth quarter of 2016. The recovery was supported by a bumper harvest, with agriculture growing by 6 percent in 2016 overall and 18.4 percent (y-o-y) in the fourth quarter. Other sectors experienced a pickup from low levels in 2016, with growth of 3.6 percent in manufacturing, 16.3 percent in construction, 4 percent in domestic trade, and 3 percent in transport. Fixed investment rebounded strongly by 20 percent from a low base, including manufacturing equipment and imported capital goods, pointing toward strengthening investor confidence. However, the overall pace of recovery remains modest as significant weaknesses remain in some parts of the services sector, including education, health, and financial services. Stronger recovery has also been held back by weak external demand, and the continuing conflict in the East of Ukraine. While a number of important reforms have advanced in recent months, a further acceleration in reforms is needed to boost investor confidence and bolster economic recovery. FIGURE 1: GDP Growth, y/y, FIGURE 2: Poverty Rates FIGURE 3: Fiscal developments (% GDP) After a significant increase in 2015, poverty is estimated to have moderated slightly in 2016. Disposable incomes contracted significantly in 2015 from the deep recession and high inflation. Moderate poverty (World Bank’s national methodology for Ukraine) increased from 15 percent in 2014 to 22 percent in 2015, while the poverty rate (under $5/day in 2005 PPP) increased from 3.3 percent in 2014 to 5.8 percent in 2015. In 2016, real household incomes are estimated to have benefited from stabilization in consumer prices and the modest resumption of economic growth. Inflation slowed to 12.4 percent in 2016 from 43.3 percent at end-2015 due to exchange rate stabilization and prudent monetary policy, while real wages increased 11.6 percent (y-o-y) in December 2016. However, labor market conditions remained weak, with unemployment at 9.9 percent in the first three quarters of 2016. The fiscal deficit increased in 2016 due to lower social security contributions, but the increase in the deficit was less than projected due to expenditure restraint and stronger performance of other tax revenues. The fiscal deficit (excluding Naftogaz) was 2.2 percent of GDP in 2016, up from 1.2 percent in 2015, but lower than previously projected. Total government revenues declined by 11 percent in real terms in 2016, in large part due to the cut in the social security contribution (SSC) rate. SSC revenues declined from 9.6 percent of GDP in 2015 to 5.5 percent in 2016—smaller than total pension spending of 10.8 percent of GDP. The resulting pension fund deficit of 5 percent of GDP has become a major fiscal vulnerability. On the other hand, other key tax revenues performed better than planned due to the pickup in economic activity in 2016. Revenues from value-added tax (VAT), personal income tax (PIT), and corporate income tax (CIT) increased
- 2. by 7.6, 13.1, and 25.7 percent, respectively, in real terms. The authorities also implemented expenditure restraint measures in 2016. Pensions spending declined 21.8 percent in real terms due to continued limited indexation (and advance payment of January 2016 pensions in December 2015), while spending on goods and services declined by 9 percent. Capital expenditures increased due to greater resources at the local level through decentralization, while social assistance spending increased due to a further increase in coverage of the housing and utilities subsidies (HUS) program. The Naftogaz deficit was reduced to zero in 2016 from 1 percent in 2015. Public and guaranteed debt increased to 81 percent of GDP due to the recapitalization of PrivatBank in December 2016. The current account deficit widened to 3.8 percent GDP in 2016 due to an increase in imports of intermediate and investment goods. Despite a significant reduction of imports of gas and other minerals, the merchandize trade deficit doubled in 2016 due to an increase in imports of intermediate and investment goods. Higher FDI inflows—mainly related to bank recapitalization—were sufficient to cover the current account deficit in 2016. International reserves grew to $15.5 billion—equal to 3.4 months of imports. Outlook The outlook for economic growth remains modest due to significant external and internal headwinds, but renewed reform momentum could support higher growth going forward. Significant headwinds remain in accelerating reforms in a complex political environment. In addition, the conflict in the east of Ukraine has escalated since end-January 2017. The coal and trade blockade with the uncontrolled areas in Donbas is expected to negatively impact two key sectors—steel production and electricity generation. On the positive side, there are encouraging signs of progress in a number of important reform areas. The recovery should also benefit from improving terms of trade. Growth is projected at 2 in 2017 and 3.5 percent in 2018. This projection assumes no resolution in the trade blockade before the end of the year, with reduced exports of steel, disruptions in electricity generation, and diversification of coal supplies and higher exports of iron ore over time. Growth of 4 percent or more in the medium term will require accelerating implementation of politically difficult reforms to address longstanding structural challenges. Reforms to boost private sector competitiveness, together with the real depreciation of recent years, should help support exports, while reforms to create fiscal space can unlock public investment, and reforms in the banking sector can permit a gradual resumption of lending. The outlook is subject to risks, including an escalation of the conflict, further deterioration in the external environment, and difficulty to advance reforms in a complex political environment. The fiscal outlook remains challenging—addressing macroeconomic vulnerabilities will require systematic fiscal consolidation underpinned by structural reforms. Despite a significant reduction in fiscal imbalances over the last two years, medium term fiscal pressures remain significant. In 2017, the fiscal deficit is projected to widen to 3.1 percent of GDP due to an increase in the minimum wage and the large deficit of the Pension fund. Public and publicly guaranteed debt is projected to reach 89 percent of GDP in 2017. In order to address macroeconomic vulnerabilities and gradually reduce public debt, the fiscal framework targets a reduction of the deficit to 2 percent of GDP by 2020. Achieving this target will require systematic fiscal consolidation anchored by reforms to the tax, pensions and social assistance systems. In addition, reforms are needed to improve the efficiency and effectiveness of health and education expenditures. Without such a systematic fiscal consolidation effort, Ukraine will need to rely on more ad hoc revenues measures and expenditure cuts, along with more domestic borrowing, which would undermine debt sustainability and development outcomes. External vulnerabilities are expected to persist. Lower steel exports and higher coal imports due to the trade blockade are expected to further widen the current account deficit to 4.1 percent of GDP in 2017. Ukraine will require significant external financing to meet repayments on external debt of banks and corporates amounting about $7 billion per year during 2017-2019. Maintaining cooperation with the IMF and other official creditors will be important to meet external financing needs, bolster international reserves, and bolster investor confidence. Contact info: Faruk Khan (fkhan5@worldbank.org), Karlis Smits (ksmits@worldbank.org) and Anastasia Golovach (agolovach@worldbank.org), (380 44) 490 66 71 www.worldbank.org/ua Table 1: Key Economic Indicators 2012 2013 2014 2015 2016 2017p 2018p 2019p Nominal GDP, UAH billion 1,405 1,465 1,587 1,980 2,383 2,735 3,085 3,450 Real GDP, % change 0.2 0.0 -6.6 -9.8 2.3 2.0 3.5 4.0 Consumption, % change 7.4 5.2 -6.2 -15.9 1.4 3.1 2.8 3.3 Fixed Investment, % change 5.0 -8.4 -24.0 -9.2 20.1 15.4 7.9 7.7 Export, % change -5.6 -8.1 -14.2 -13.2 -1.6 1.6 3.0 5.0 Import, % change 3.8 -3.5 -22.1 -17.9 8.4 1.7 1.6 6.7 GDP deflator, % change 8.1 3.1 14.8 38.4 17.1 12.5 9.0 7.5 CPI, % change eop -0.2 0.5 24.9 43.3 12.4 10.2 7.0 6.0 Current Account Balance, % GDP -8.2 -9.2 -3.5 -0.2 -3.8 -4.1 -3.0 -3.3 External debt, % GDP 76.6 78.6 97.6 131.5 129.6 131.6 125.4 107.5 Budget revenues, % GDP 44.5 43.6 40.3 42.1 38.4 38.8 38.9 39.0 Budget expenditures, % GDP 48.9 48.4 44.8 43.2 40.6 41.9 41.5 41.4 Fiscal balance, % GDP -4.4 -4.8 -4.5 -1.2 -2.2 -3.1 -2.6 -2.4 Consolidated deficit, including Nagtogaz, % -5.5 -6.7 -10.1 -2.1 -2.3 -3.1 -2.6 -2.4 Public and Guaranteed Debt, % GDP 36.6 40.6 70.3 79.4 81.2 88.8 83.5 75.9 Source: Ukrainian Authorities, WB projections