SlideShare a Scribd company logo
1 of 75
Download to read offline
©2014 International Monetary Fund
IMF Country Report No. 14/64
MONGOLIA
2013 ARTICLE IV CONSULTATION—STAFF REPORT; PRESS RELEASE
AND STATEMENT BY THE EXECUTIVE DIRECTOR FOR MONGOLIA
Under Article IV of the IMF’s Articles of Agreement, the IMF holds bilateral discussions with
members, usually every year. In the context of the 2013 Article IV consultation with Mongolia,
the following documents have been released and are included in this package:
 Staff Report for the 2013 Article IV consultation, prepared by a staff team of the IMF,
for Executive Board’s consideration on November 15, 2013, following discussions that ended
on September 24, 2013, with the officials of Mongolia on economic developments and policies.
Based on information available at the time of these discussions, the staff report was completed
on November 1, 2013.
 Informational Annex prepared by the IMF.
 Debt Sustainability Analysis prepared by the staffs of the IMF and the World Bank.
 Press Release summarizing the views of the Executive Board as expressed during its
November 15, 2013 consideration of the staff report that concluded the Article IV consultation
with Mongolia.
 Statement by the Executive Director for Mongolia.
The policy of publication of staff reports and other documents allows for the deletion of
market-sensitive information.
Copies of this report are available to the public from
International Monetary Fund  Publication Services
700 19th
Street, N.W.  Washington, D.C. 20431
Telephone: (202) 623-7430  Telefax: (202) 623-7201
E-mail: publications@imf.org Internet: http://www.imf.org
International Monetary Fund
Washington, D.C.
March 2014
MONGOLIA
STAFF REPORT FOR THE 2013 ARTICLE IV CONSULTATION
KEY ISSUES
Overview. Mongolia has made impressive progress in developing its economy over the
past decade. Medium-term prospects remain promising given Mongolia’s large natural
resource endowment, but macroeconomic policies have become unsustainably loose.
The resulting balance of payments (BOP) pressures have been compounded by negative
shocks to FDI and coal exports.
Outlook and Risks. Staff expect the economy to grow by 12 percent this year and
9½ percent in 2014, buoyed by the start of production at the Oyu Tolgoi (OT) copper
and gold mine. Over the past two years, nonmining growth has been boosted by fiscal
and monetary stimulus. In view of the uncertain external environment, Mongolia needs
to change course to reduce its vulnerability to external shocks. Gross international
reserves are still adequate for precautionary purposes, but they have been supported by
external borrowing and the declining trend in net international reserves observed this
year is not sustainable.
Policies. Securing sustainable growth while addressing macroeconomic risks requires a
package of fiscal adjustment, unwinding of the monetary stimulus provided this year,
and continued exchange rate flexibility. Banking sector vulnerabilities and weaknesses in
the business climate also need to be addressed.
 Some encouraging steps are being taken to tighten fiscal policy in the remainder of
2013 and by basing the 2014 budget on more realistic revenue projections. However,
including off-budget spending by the Development Bank of Mongolia (DBM) the
overall fiscal deficit in 2013 will likely again be over 10 percent of GDP.
Implementation of the Fiscal Stability Law (FSL) is an urgent priority, with DBM
spending to be included in the budget. Public investment projects should be
reprioritized in view of constraints on absorptive and implementation capacity.
 The Bank of Mongolia (BOM)’s large monetary stimulus, through its so-called “price
stabilization program,” mortgage program, and liquidity injection, distorts markets
and is bound to ratchet up inflation. The programs should be phased out and the
BOM should focus on further strengthening the monetary policy framework while
maintaining the increased exchange rate flexibility observed in recent months.
 Banking sector vulnerabilities need to be addressed. They stem from weaknesses in
banking supervision, inadequate provisioning, high levels of loan concentration and
dollarization, and a high and rising credit-to-deposit ratio.
 The government should build on the recent passage of the new investment law to
further improve the business climate and encourage FDI inflows.
November 1, 2013
MONGOLIA
2 INTERNATIONAL MONETARY FUND
Approved By
Markus Rodlauer and
Masato Miyazaki
Discussions were held in Ulaanbaatar during September 10–24, 2013.
The staff team comprised Messrs. Almekinders (head) and Yu (both
APD), Ms. Kinoshita (OAP, who is in charge of the local office), and
Messrs. Min (FAD), Quill (MCM), and Shin (OAP). Messrs. Rodlauer
(APD), Yoon, and Moon (both OED) joined the last days of the mission.
The team was assisted by Mses. Ardak, Khulan, and Selenge in the
local office. Ms. Tolentino, Mr. George, and Ms. Choi (APD) assisted in
the preparation of this report.
CONTENTS
RECENT ECONOMIC DEVELOPMENTS AND OUTLOOK ________________________________________ 4 
A. Introduction _____________________________________________________________________________________4 
B. Expansionary Policies and External Shocks Are Pressuring the BOP _____________________________5 
C. Outlook and Risks _______________________________________________________________________________7 
POLICY DISCUSSIONS __________________________________________________________________________ 10 
A. Fiscal Policy____________________________________________________________________________________ 10 
B. Monetary and Exchange Rate Policy___________________________________________________________ 11 
C. Financial Sector Issues_________________________________________________________________________ 13 
D. Structural Reforms and Statistics ______________________________________________________________ 14 
STAFF APPRAISAL ______________________________________________________________________________ 15 
BOXES
1. The Recent Failure of Savings Bank____________________________________________________________ 17 
2. Price Stabilization Program, Mortgage Program and Liquidity Injection_______________________ 18 
3. The Monetary Policy Stance ___________________________________________________________________ 19 
4. Exchange Rate Assessment ____________________________________________________________________ 20 
5. Financial Soundness Indicators and Bank Stress Tests _________________________________________ 21 
FIGURES
1. Real Sector Developments_____________________________________________________________________ 22 
2. Fiscal and Monetary Sector Developments ____________________________________________________ 23 
3. External Sector Developments _________________________________________________________________ 24 
4. Inclusive Growth Indicators ____________________________________________________________________ 25 
TABLES
1. Strong Policy and Weak Policy Scenarios, 2010–18______________________________________________8 
2. Selected Economic and Financial Indicators, 2009-14 _________________________________________ 26 
MONGOLIA
INTERNATIONAL MONETARY FUND 3
3. Summary Operations of the General Government, 2009–14___________________________________ 27 
4. Statement of Operations and Stock Positions of the General Government, 2009–14__________ 28 
5. Monetary Aggregates, 2009–14 _______________________________________________________________ 29 
6. Balance of Payments, 2011–18_________________________________________________________________ 30 
7. Selected Economic and Financial Indicators, 2009-18 _________________________________________ 31 
8. Financial Soundness Indicators of the Banking Sector_________________________________________ 32 
APPENDIXES
I. Risk Assessment Matrix_________________________________________________________________________ 33 
II. Mongolia’s New Fiscal Framework Anchored by the Fiscal Stability Law ______________________ 34 
MONGOLIA
4 INTERNATIONAL MONETARY FUND
RECENT ECONOMIC DEVELOPMENTS AND OUTLOOK
A. Introduction
1. Mongolia has made impressive progress in developing its economy (Figure 1). Spearheaded
by foreign direct investment (FDI)-financed development of the mining sector, per capita income has
increased five-fold, to more than US$3,000, over the past decade. Medium-term prospects are
promising as mining output is projected to expand further over the next five years. Foreign investors’
optimism about Mongolia’s prospects was illustrated by successful international bond issuances in
2012. A private mining company, a private bank, the state-owned Development Bank (DBM), and the
sovereign (the US$1.5 billion “Chinggis” bond) raised a total of US$3 billion (30 percent of GDP).
2. The strong growth of the economy has helped reduce poverty. Over the past two years,
poverty has declined by more than 11 percentage points, to 27 percent of the population in 2012.
However, indicators for inequality and unemployment suggest that there is scope to make growth
more inclusive, despite relatively high social spending compared to Mongolia’s peers (Figure 4).
3. However, macroeconomic policies have been unsustainably loose the past two years.
Government expenditure increased by 70 percent in real terms between 2010 and 2012, with
growing importance of off-budget spending. In late-2012, the BOM embarked on a major monetary
stimulus, which added to growing BOP pressures. During 2012 and the first half of 2013, BOP
pressures were mostly reflected in a decline in the BOM’s Net International Reserves (NIR). In recent
months, the exchange rate has become more flexible. Capitalization and liquidity of the banking
system have improved. However, dollarization remains high and the provisioning regime for
commercial banks lags Asian peers.
4. This year’s consultation focused on the need to adjust macroeconomic policies to rein in
domestic demand growth, curtail balance of payments pressures, and contain inflation. In
particular, discussions centered on the implementation of the 2010 Fiscal Stability Law (FSL)—which
has now become effective and which prescribes a 2 percent of GDP limit on the structural fiscal
deficit (Appendix II) 1
—as well as the need for a significant correction in the monetary policy stance.
1
The new fiscal framework implied by the 2010 Fiscal Stability Law (FSL) was adopted in the aftermath of the 2008/09
balance of payments (BOP) crisis. It focuses on prudent natural resource management, taking into account absorptive
capacity constraints—in particular, macroeconomic stability and overheating concerns, and concerns about the
efficiency of scaled-up public investments, as well as intergenerational concerns. The framework was designed with
substantial input from the IMF (FAD), consistent with the principles and international experience summarized in the
2012 IMF Policy Paper on Macroeconomic Policy Frameworks for Resource-Rich Developing Countries. In turn, that
paper noted that the Mongolian fiscal policy framework anchored by the FSL constitutes a relevant example for other
middle- and low-income countries with large revenue from nonrenewable resources.
Staff Recommendations Made in the Context of the Last Two Article IV Consultations
 Scale back the growth of total government spending in view of inflation and BOP pressures.
 Take off-budget spending into account when determining the macro-economically sustainable
level of total government spending.
 Monetary easing should be contingent on demand pressures abating and prudent fiscal policy.
 BOP pressures should be reflected more in movements in the exchange rate.
 Continue efforts to strengthen the soundness and resilience of the banking system.
MONGOLIA
INTERNATIONAL MONETARY FUND 5
Other key topics included a renewed focus on financial sector risks—illustrated by the recent failure
of Savings Bank (Box 1)—and structural reforms to clarify the investment regime and boost non-
mining growth. Staff liaised with Mongolia’s bilateral and multilateral development partners. While
noting Mongolia’s longer-term infrastructure needs, they shared the staff’s concerns about the
unsustainably loose macroeconomic policies.
5. A new government took over in 2012. The June 2012 parliamentary elections were won by
the opposition Democratic Party, which formed a coalition government with three smaller parties
and appointed a new central bank governor. With the June 2013 reelection of President Elbegdorj,
the Democratic Party now essentially controls government for the next three years.
B. Expansionary Policies and External Shocks Are Pressuring the BOP
6. The Mongolian economy has continued to grow very rapidly. The economy expanded by
12½ percent in 2012 and by 11½ percent in the first half of 2013. Growth has been buoyed by a
relatively mild winter boosting agriculture and highly expansionary fiscal and monetary policies. The
latter have been deployed to compensate for the marked slowdown in coal exports and FDI-financed
mining development—key drivers of growth in recent years.
7. However, BOP pressures have intensified and inflation is bound to rise:
 Negative shocks to FDI and coal exports increased BOP pressures from mid-2012 onwards.
These pressures have been compounded by highly expansionary fiscal and monetary policies
that are boosting the demand for non-mining imports.
 Inflation fell to a two-year low of 7 percent in July thanks to moderating food prices and the
Bank of Mongolia’s (BOM) price stabilization program. However, the depreciation of the togrog
of the past three months is likely to push up inflation in the coming months.
8. Monetary policy has been highly expansionary. To cushion the impact of declining FDI and
to boost credit growth, the BOM took a two-pronged approach: it cut the policy rate three times by
a total of 275 basis points to 10.5 percent; and it lent substantial sums to banks at below-market
rates, including for on-lending to selected sectors through the price stabilization and mortgage
programs (Box 2). If it wasn’t for a large decline in its international reserves, the BOM’s balance sheet
and hence reserve money would have more than doubled in just 6 months. Commercial banks have
been taking advantage of the large provision of cheap BOM funding, and private sector credit
growth accelerated to 47 percent in August (y/y).
9. Fiscal policy has remained highly expansionary.
 The overall fiscal deficit (including DBM operations) rose to 10.9 percent of GDP in 2012,
6 percent of GDP higher than in 2011:
 The 2012 budget outturn recorded a deficit of 7.5 percent of GDP. Revenue growth
decelerated on declining FDI inflows. On-budget expenditures rose by 20 percent, in part
due to large increases in civil servants’ wages.
MONGOLIA
6 INTERNATIONAL MONETARY FUND
 Off-budget spending by the government-owned DBM amounted to 3.4 percent of GDP in
2012. This spending should also be included in the assessment of the fiscal policy stance.
The DBM’s debt is guaranteed by the government and has to be serviced by the
government budget. A large part of DBM spending is on non-revenue-generating public
investment projects such as roads. For several of the “revenue-generating projects” there is
a substantial risk that the DBM will not be repaid, e.g. the US$200 million it has provided to
the loss-making state-owned coal producer Erdenes Tavan Tolgoi.
 Government spending continued to rise sharply during the first 8 months of 2013.
Spending by the budget was unchanged from a year ago. However, including the more than
MNT 1 trillion (6½ percent of GDP) spending by the DBM, total government spending rose by
30 percent compared to the same period last year.
 Public debt has been rising rapidly. Excluding an additional foreign bond issuance under
discussion, public debt is projected to reach 67 percent of GDP by the end of 2013, up from
39 percent just two years ago. Moreover, the cost and risk profile of the public debt have
become less favorable. The share of concessional loans has declined, the bulk of the debt is
denominated in foreign currency, and substantial refinancing risk has emerged for 2017. The
IMF/World Bank Debt Sustainability Analysis (DSA) now indicates that Mongolia is at moderate
risk of debt distress.
10. BOP pressures caused by the external shocks and expansionary policies have been
absorbed by BOM foreign exchange sales financed from external borrowing and, more
recently, increased exchange rate flexibility. Gross international reserves currently amount to
US$2.4 billion (about 3.7 months of prospective imports), about the same level as a year ago.
External borrowing has helped keep reserves at this level. For instance, the government deposited
the sovereign “Chinggis” bond proceeds at the BOM. This helped to raise the BOM’s Gross
International Reserves (GIR) to a record US$4.1 billion at end-2012. As a result of persistent sales of
foreign exchange in the spot and forward market, GIR subsequently fell to US$2.4 billion (Figure 3).
Over the past year, the exchange rate has depreciated by 22 percent vis-à-vis the U.S. dollar, with
most of this occurring in the last four months.
11. International financial markets are becoming more concerned about developments in
Mongolia. The key selling points for Mongolia’s successful maiden sovereign bond issuance in late-
2012 were the new fiscal policy framework anchored by the FSL becoming operational in 2013 and
the imminent start of exports from the Oyu Tolgoi (OT) copper mine. However, sentiment
subsequently suffered with downward pressures on international reserves, the uncertain external
outlook, and the Savings Bank failure. By mid-September, as yields on relatively risky assets rose in
anticipation of the US Federal Reserve System starting to taper its asset purchases, Mongolia’s
sovereign spread had widened about 140 basis points more than the average for emerging markets
since the issuance. With the postponement of “Fed tapering”, the “excess spread” has narrowed
again (Figure 3).
MONGOLIA
INTERNATIONAL MONETARY FUND 7
C. Outlook and Risks
12. The near-term outlook for growth is favorable but inflation will likely rise.
 Growth is projected to remain in or near double digits in 2013 and 2014. Mineral GDP will
be boosted by the start of commercial operations at the Oyu Tolgoi (OT) copper mine and
expansion of coal production from the Tavan Tolgoi (TT) mine. Non-mineral GDP growth is
projected at 11 percent in 2013, supported by expansionary monetary and fiscal policies. Non-
mineral GDP growth in 2014 depends in part on the pace of DBM disbursements for
investments in public investment projects and the extent to which the BOM’s stimulus
programs are continued.
 Inflation is projected to move above 10 percent and remain there through late-2014. In
the context of continued strong growth of domestic demand, and notwithstanding the BOM’s
continued operation of the price stabilization program, the depreciation of the exchange rate
observed in recent months will likely spill over into higher inflation.
13. However, continuation of current policies could lead to a highly vulnerable situation.
The important policy decisions facing the authorities are highlighted by a comparison of a “strong
policy scenario” with a “weak policy scenario” (see Table 1 on next page):
 In the strong policy scenario, which is quantified in more detail in Tables 2–7, the medium-term
budget framework is consistent with the FSL. On-budget fiscal operations observe the FSL
starting with a 2014 budget based on realistic revenue projections. The off-budget program of
public investment projects is phased out by the end of 2015. To help ease demand and BOP
pressures further, the BOM’s stimulus programs are phased out by mid-2014.
 The weak policy scenario illustrates the risks of a continuation of current policies amid
continued weakness of FDI inflows and coal exports. In this scenario, it takes the government
two more years to bring on-budget fiscal operations in line with the FSL. In addition, the
government continues to pursue its development strategy through the implementation of off-
budget public investment projects. This would be broadly in line with the medium-term budget
framework for 2014-16 which was approved in May and envisages continued large
international bond issuances. Finally, the BOM’s stimulus measures are phased out only
gradually (by 2015). In this scenario, non-mining growth in 2014 would be higher than in the
strong policy scenario. However, Mongolia would run a progressively more serious risk of a
BOP crisis. In case of crisis, the required large adjustment of absorption would cause a
cumulative non-mining output loss of about 20 percentage points, compared to the strong
policy scenario, over a 4 year horizon (calibrated on cross-country experiences summarized in
WP/08/224 and the Board Paper on “Assessing Reserve Adequacy”). The larger exchange rate
depreciation (compared to the strong policy scenario) would add to inflationary pressures. The
implications of the weak policy scenario for key indicators of public external debt public are
illustrated in the Debt-Sustainability Analysis.
14. In addition to the risks posed by the continuation of current policies, the outlook is subject to
other downside near- and medium-term risks (see Risk Assessment Matrix, Appendix I):
2010 2011 2012 Strong policy scenario
2013 2014 2015 2016 2017 2018 2013 2014 2015 2016 2017 2018
Real sector (change in percent)
Real GDP growth 6.4 17.5 12.3 11.8 9.6 7.0 5.2 8.5 6.0 11.8 12.1 -2.6 -1.2 3.2 1.2
Mineral growth 3.6 7.3 8.9 16.1 33.4 7.2 -2.1 14.9 1.8 16.1 33.4 7.2 -2.1 14.9 1.8
Non-mineral growth 7.0 19.7 12.9 11.0 5.0 7.0 7.0 7.0 7.0 11.0 8.0 -5.0 -1.0 0.0 1.0
Consumer prices (end-period) 14.3 9.4 14.2 11.7 11.0 7.4 6.7 6.6 5.5 11.7 14.3 11.7 5.0 5.5 5.4
Fiscal accounts (in percent of GDP, unless otherwise indicated)
Overall balance (in percent of GDP) 1/ 0.5 -4.8 -10.9 -13.5 -7.4 -3.8 -1.7 -1.8 -2.0 -13.5 -13.1 -10.1 -7.6 -5.1 -4.7
Structural balance (FSL, in percent of GDP) 1/ … -6.9 -11.5 -13.7 -7.5 -4.2 -2.0 -2.0 -2.0 -13.7 -13.3 -10.5 -8.0 -5.3 -4.7
Non-mineral balance (In percent of non-mineral GDP) -13.6 -17.8 -20.7 -22.8 -15.9 -11.3 -9.6 -10.7 -10.6 -22.8 -23.4 -21.6 -20.3 -19.4 -19.4
Non-mineral revenue (In percent of non-mineral GDP) 33.8 39.3 36.5 35.1 35.0 34.8 34.0 33.8 32.6 35.1 34.8 36.0 35.9 37.0 36.9
Total expenditure (In percent of non-mineral GDP) 47.4 57.1 57.2 57.9 50.9 46.1 43.6 44.5 43.1 57.9 58.2 57.6 56.2 56.4 56.3
Total public debt (in percent of GDP) 35.9 38.8 63.0 67.3 65.8 60.4 55.9 52.4 50.1 67.3 72.9 78.1 81.1 79.9 79.0
of which: Domestic debt 5.1 10.9 14.7 15.5 15.1 15.5 16.3 16.2 16.6 15.5 14.7 15.6 16.8 17.5 18.4
External debt 30.8 27.9 48.3 51.8 50.7 44.9 39.6 36.2 33.4 51.8 58.1 62.5 64.3 62.4 60.6
NPV of public debt 54.6 58.6 58.0 53.3 49.5 46.4 44.7 58.6 63.9 68.9 72.1 70.9 70.4
Monetary accounts (Change in percent)
Broad money 61.6 37.1 18.8 17.1 28.8 29.5 30.0
Reserve money 29.2 75.5 30.5 12.2 11.9 44.7 29.1
Credit to the private sector 21.5 72.3 24.1 40.9 16.1 54.1 33.6
External accounts
Current account balance (percent of GDP) -14.9 -31.7 -32.8 -31.6 -20.3 -18.3 -21.5 -15.3 -14.6 -31.6 -22.2 -14.1 -16.2 -9.9 -8.7
Gross official reserves (in millions of U.S. dollars) 2,490 2,630 4,126 2,214 2,290 2,178 2,369 2,592 2,821 2,244 755 116 308 532 758
(in months of imports) 3.9 3.9 6.5 3.4 3.3 3.0 3.0 3.2 3.2 3.4 1.2 0.2 0.5 0.8 1.0
Memorandum items:
Nominal GDP (in billions of togrogs) 8,415 11,088 13,944 16,691 20,352 23,513 26,258 30,358 34,125 16,691 21,692 24,167 25,668 28,126 29,952
Nominal GDP (in millions of U.S. dollars) 6,244 8,709 10,258 10,982 11,417 12,494 13,286 14,701 15,918 10,982 10,927 10,227 10,086 10,586 10,815
Government expenditure (in billions of togrog) 3,081 4,997 6,494 8,000 8,205 8,636 9,382 10,943 12,104 8,000 9,883 10,468 10,998 11,700 12,439
Government expenditure (growth in percent) 32 62 30 23 3 5 9 17 11 23 24 6 5 6 6
DBM spending (in percent of GDP) … … 3.4 9.0 5.5 2.2 0.0 0.0 0.0 9.0 11.3 8.5 5.9 3.3 2.6
Sources: Mongolian authorities; and IMF staff calculations.
1/ Includes DBM spending.
Table 1. Strong Policy and Weak Policy Scenarios, 2010–18
Weak policy scenario
MONGOLIA
8INTERNATIONALMONETARYFUND
MONGOLIA
INTERNATIONAL MONETARY FUND 9
 Spillovers from weakening external demand for commodities could further dampen mining
export revenues. Advanced economies will eventually exit from the very supportive
monetary policies implemented in recent years. China’s economy is expected to rebalance
away from a mostly investment-based growth model toward a more consumption-based
growth model. Both these factors will likely have significant spillovers globally and especially
in the region. China accounts for more than 90 percent of Mongolia’s exports and the recent
World Economic Outlook identifies Mongolia as one of the most vulnerable countries to a
rebalancing of demand in China. Slowing growth in China would affect Mongolia via trade
and FDI channels.
 External shocks and/or the continuation of current policies could expose vulnerabilities in the
banking system, exacerbating a negative shock to growth and financial stability.
15. Mongolia’s medium-term prospects remain promising. Mongolia’s large natural resource
endowment and its proximity to the fastest-growing economies in the world provide ample
opportunities for development. The start of copper production at the OT open pit mine, the
development of the OT underground mine, and the ramp up of coal production from the TT mine
are projected to keep the growth of mineral GDP at about 16 percent per annum, on average,
during 2013-17. Activity outside the mining sector is also projected to remain buoyant, although this
would need to be supported by continued reforms to strengthen the foundation of the economy
and the business climate.
Authorities’ Views
16. The authorities expressed optimism about continued strong growth alongside a
strengthening of the BOP in the course of 2014 and over the medium term. The centerpiece of
their development strategy was scaled-up public investment, including in transportation
infrastructure, financed by foreign borrowing, to be sustained by continued rapid economic growth
and a recovery of export earnings. They pointed at their achievements, despite the external shocks,
including continued double-digit economic growth, buoyed by sharply rising domestic investments,
with inflation kept at manageable levels. The authorities projected the economy to grow by
15 percent per annum, on average, during 2013-2016. They expected mining and non-mining
output to record average annual growth of 32 percent and 11 percent, respectively.
17. The authorities acknowledged the downside risks to the external outlook but indicated
they were taking steps to address prevailing BOP pressures. Government spending was being
curtailed for the remainder of the year (¶22). The BOM was discussing plans to unwind some of the
monetary stimulus (¶30). The recent exchange rate depreciation was dampening the demand for
imports (¶31). And Parliament passed a new Investment Law aimed at boosting FDI and domestic
investment (¶38). New foreign borrowing in the coming months and an anticipated rebound in coal
exports starting in the last quarter of this year would help holding immediate BOP pressures at bay.
On that basis, the authorities did not consider necessary at this time an additional package of
macroeconomic adjustments and reforms as outlined in the “strong policy scenario.”
MONGOLIA
10 INTERNATIONAL MONETARY FUND
POLICY DISCUSSIONS
18. Notwithstanding Mongolia’s promising medium-term prospects, macroeconomic
policies are on an unsustainable path and need to be adjusted to rein in domestic demand
growth, curtail balance of payments pressures, and contain inflation. The discussions centered
on the need for a package of fiscal adjustment, unwinding of the monetary stimulus, and continued
exchange rate flexibility. Banking sector vulnerabilities and uncertainties surrounding the foreign
investment regime also need to be addressed.
A. Fiscal Policy
19. Some encouraging steps have recently been taken to tighten fiscal policy. These steps
would moderate spending growth during the remainder of 2013 and provide a good foundation for
the preparation of the 2014 budget:
 The Minister of Finance announced plans to reduce budgetary spending by almost
MNT 1 trillion (6 percent of GDP) so as to keep the 2013 budget within the FSL’s 2 percent of
GDP ceiling for the structural fiscal deficit.
 During the remainder of 2013, the DBM will not receive additional funding from the Chinggis-
bond proceeds currently held by the government at the BOM. The DBM would pay out the cash
it currently has on hand (MNT 0.4 trillion) on ongoing public investment projects.
 The Ministry of Finance has initiated work on the 2014 budget based on a relatively
conservative projection for government revenue.
20. However, given the sustained BOP pressures and the uncertain outlook, staff argued
that further steps were needed. Even with the measures listed above, the fiscal deficit including
DBM operations in 2013 would top last year’s level (10.9 percent of GDP) and public debt (including
BOM external borrowing) would reach about 67 percent of GDP. This raises doubts about the
consistency of fiscal policy with the FSL
 DBM operations should be included in the budget starting with the 2014 budget. The DBM was
founded after the FSL was adopted, and the FSL is not clear about whether the structural deficit
rule applies to public sector off-budget activities. Lack of clarity on this issue in the FSL has led
to off-budget public sector activities being excluded from the rule. However, the main purpose
of the FSL is “ensuring fiscal stability” (Article 1), and the law envisages comprehensive coverage
of public debt (Article 4.1.8). On that basis, off-budget activities through the DBM should be
reflected in the calculation of all FSL requirements.
 An ambitious and credible fiscal consolidation plan should be drawn up, consistent with the FSL.
Budget operations and the operations of the DBM taken together should meet the 2 percent of
GDP ceiling for the structural deficit in due course. Given the sustained BOP pressures, the
planned adjustment needs to be adequately frontloaded, spearheaded by streamlining
MONGOLIA
INTERNATIONAL MONETARY FUND 11
subsidies and transfers and reprioritizing capital spending. Even so, the overall deficit (including
DBM operations) and the public debt would likely exceed the FSL limits in the next 2–3 years,
which should be transparently explained to Parliament. Over the medium term, and given also
current economic conditions and vulnerabilities, the FSL ceilings for the deficit and public debt
remain appropriate and should anchor adjustments to a sustainable policy path.
 DBM spending should be re-phased and re-prioritized. DBM spending is projected to amount to
9 percent of GDP in 2013 and has contributed considerably to BOP pressures. To help ease
these pressures, the Ministry of Economic Development and the DBM should prepare a
prioritized list of capital expenditure items in their portfolios and only implement the projects
with the highest payoff in terms of contributions to medium-term growth.
 The Social Welfare Law (SWL) should be implemented. The 2012 SWL envisages replacing
existing costly universal cash transfers with means-tested benefits that would reach the poorest
households. This would help increase fiscal flexibility and reduce inequality.
21. The set up of a sovereign wealth fund (SWF) should be completed. The establishment of
a SWF would be an important complement to the FSL’s countercyclical fiscal policy. Technical work
on setting up a SWF should be finalized, building on technical assistance provided by the World
Bank and the IMF.
Authorities’ Views
22. The authorities confirmed their commitment to observe the 2 percent of GDP ceiling
for the structural deficit for on-budget operations in 2013 and 2014. Cuts of current and capital
spending for the rest of the year had been decided through a Cabinet Resolution and would be
reflected in a supplementary 2013 budget to be discussed by Parliament in November. Discussions
on the 2014 budget had started based on realistic revenue projections.
23. They noted that DBM spending represented a key policy instrument to boost growth in
the short- and medium term. DBM spending was approved by parliament and bringing it on-
budget could be done in different ways. In view of the uncertain economic outlook, the authorities
were not ready to commit to a target date by which the overall fiscal deficit including DBM
operations would observe the 2 percent of GDP structural deficit ceiling. They were looking to issue
another international bond to finance additional DBM spending until an expected pick up in exports
and growth would kick in. The authorities expressed an interest in further discussing with staff the
appropriateness of the FSL debt and deficit ceilings and the treatment of DBM operations under
those ceilings.
B. Monetary and Exchange Rate Policy
24. The monetary policy framework has been strengthened. Earlier this year, the BOM
introduced a policy interest rate corridor. The auctioning of treasury bills was modernized. And the
adoption of the new Securities Law should facilitate secondary market trading of treasury bills. These
measures are important in strengthening the interest rate channel of monetary policy.
MONGOLIA
12 INTERNATIONAL MONETARY FUND
25. However, the large monetary and quasi-fiscal stimulus provided through three new
BOM programs creates risks and distortions, and should be unwound. The three programs
loosen the monetary policy stance, creating inflationary and BOP pressures (Box 3). They also
heighten banking sector vulnerabilities and could give rise to contingent liabilities for the public
sector (Box 2).
26. Exchange rate flexibility has increased in recent months. The floating exchange rate
regime and auction system should be maintained. Intervention should be limited to smoothing
excessive exchange rate volatility. To support medium- and long-term external stability and the
exchange rate regime, appropriate fiscal and monetary policies are key, along the lines
recommended above.
27. The real exchange rate is assessed to be moderately overvalued, even in the strong
policy scenario which assumes a tightening of monetary and fiscal policy (Box 4). The
overvaluation, and the risk of a further large adjustment of the nominal exchange rate, would
become more pronounced in case the loose fiscal and monetary policy implemented so far this year
continued. This assessment takes into account the full development of the OT and TT mines. While
the current account is projected to continue to show a large deficit over the five-year projection
period, the long-term prospects are favorable, as the current account is expected to gradually move
to a surplus.
28. Even though international reserves have been
on a downward trajectory, they are still adequate for
precautionary purposes based on traditional
assessment criteria. A recently developed risk-based
metric of reserve adequacy (see SM/11/31) suggests
that Mongolia may need to hold more reserves than it
currently does. Moreover, the declining trend in net
international reserves—taking into account the deposits
taken from commercial banks and the BOM’s increasing
foreign liabilities—is not sustainable, underscoring the
need for policy adjustment.
Authorities’ Views
29. The authorities explained that countercyclical monetary policy had been implemented
to prevent a serious economic downturn and a credit crunch. They noted that Mongolia faced a
difficult economic outlook in late-2012, owing to the negative shocks to FDI and coal exports. The
BOM’s stimulus programs had succeeded in reviving demand and supporting growth while keeping
inflation on a downward trajectory.
30. The intention is to phase out the monetary stimulus programs over time. The BOM
deposits placed with commercial banks would be pulled back in the coming months. The new
mortgages sold by banks would be taken off their books through securitization operations, and
0
500
1,000
1,500
2,000
2,500
3,000
3,500
0
500
1,000
1,500
2,000
2,500
3,000
3,500
Import Cover Broad Money Short-term debt Risk Metric
Reserves Assessed Under Different Approaches
(In millions of U.S. dollars)
Implied GIR
Actual GIR at end-September 2013
100 percent of
short-term debt20 percent of
broadmoney
150 percent of
metric coverage
3 months
ofimports
MONGOLIA
INTERNATIONAL MONETARY FUND 13
banks would be obliged to repay the freed-up funds to the BOM. The authorities were confident
that the implications for banking-sector liquidity were manageable and that refinancing risks were
not an issue, pointing at commercial banks’ large holdings of central bank bills. The BOM would
continue to operate the price stabilization program pending the development of market-based,
efficient warehouse financing with private-sector participation.
31. The authorities reaffirmed their commitment to the floating exchange rate regime. They
expressed broad agreement with staff’s assessment of the exchange rate and reserve adequacy.
While the exchange rate depreciation in July and August was due to a string of bad news, including
with regard to the ongoing discussions among OT shareholders, the authorities noted that its
dampening effect on import demand was already visible.
C. Financial Sector Issues
32. Good progress has been made in strengthening banks’ capitalization and liquidity, and
reported non-performing loans are low (Box 5). The higher capital adequacy ratio (CAR) of
14 percent for the four largest, systemically important banks that was achieved by mid-2013 is
providing welcome additional buffers. Moreover, the higher minimum paid-in capital requirement
(MNT 16 billion) and higher Tier 1 capital ratio (9 percent) are helpful for the relatively more
vulnerable small- and medium-size banks.
33. Nevertheless, as illustrated by the recent failure of Savings Bank, the banking sector
harbors significant vulnerabilities. There is a need to strengthen corporate governance practices
and enforcement of regulations, including single borrower limits. Mongolia’s loan-to-deposit ratio
and level of dollarization are among the highest in Asia. Surging credit growth is likely to have
posed a challenge to prudent underwriting practices and supervision. The currency depreciation of
the past four months could adversely affect credit quality of foreign currency-denominated loans. In
light of the relatively undiversified nature of the economy, the banking system also remains
vulnerable to a downturn in the mining sector and a deceleration of government spending.
34. To contain financial sector risks, the regulatory and supervisory framework should be
strengthened further:
 The BOM should strictly enforce the existing prudential regulations and continue to improve
prudential indicators. The existing lending limits on a single borrower and a bank-related party
should be rigorously enforced. Focus should also be on strengthening underwriting practices as
well as on addressing deficiencies in loan classifications and NPL recognition. The BOM should
consider phasing in a more forward-looking provisioning scheme that takes into account the
risks of losses on performing loans.
 The newly expanded State Bank should be recapitalized promptly and plans should be
developed toward its privatization.
 The supervisory and bank resolution regimes should be enhanced. Following up on the
implementation of the 2010 FSAP recommendations, a strategic plan should be developed to
MONGOLIA
14 INTERNATIONAL MONETARY FUND
implement a robust supervisory regime and strengthen the bank resolution framework. In
addition, there is a need to develop a legal framework for prompt corrective actions that
mandates progressively stronger supervisory actions as a bank’s capital declines. The recently
established Deposit Insurance Corporation and the BOM, in collaboration with other appropriate
entities, should develop a comprehensive framework to address standalone resolution
requirements, as well as a systemic financial crisis.
 Lending dollarization should be discouraged. Mongolia’s relatively high dollarization, in
conjunction with the relatively small size of non-mining exports, suggests that the non-bank
private sector may have a considerable foreign currency mismatch with attendant risks. Yet the
2010 FSAP recommendation to establish guidelines for foreign exchange lending still has to be
followed up. Ideally, banks should only be allowed to lend in foreign currency to hedged
borrowers. Alternatively, consideration could be given to additional prudential measures such as
higher risk weights on foreign currency-denominated loans and caps on individual banks’
foreign currency loan-to-deposit ratio.
35. Efforts to strengthen the Anti-Money Laundering/Countering the Financing of
Terrorism (AML/CFT) framework need to be stepped up. In October 2013, the Financial Action
Task Force (FATF) designated Mongolia as a jurisdiction not making sufficient progress in implementing
the agreed action plan to enhance its AML/CFT framework. There is a risk that, absent sufficient
progress by February 2014, the country will be placed on the FATF blacklist, which would lead to
heightened due diligence from foreign financial institutions regarding transactions with Mongolia.
Authorities’ Views
36. The authorities expressed broad satisfaction with their management of financial sector
risks. Following the failure of Savings Bank there were no more banks under a Supervisory Action
Plan. Adequate safeguards had been built into the mortgage program (e.g. minimum down-
payment requirements and maximum loan-to-value ratios). The authorities also pointed out that the
bulk of unhedged foreign-currency loans were to larger, more-diversified corporations who they
considered able to internalize the foreign currency risk. They further noted that the timing was not
right to adjust the provisioning regime.
D. Structural Reforms and Statistics
37. Efforts to improve the business climate and trade integration should continue.
Mongolia ranks relatively high in the World Bank’s Doing Business Survey. However, there is scope
to further streamline procedures and strengthen policy frameworks to boost private-sector-led non-
mineral growth. For instance, trading across borders, getting electricity and dealing with
construction permits remain relatively cumbersome.
38. Adoption of a new Investment Law on October 3 is a major milestone in the authorities’
quest to revive domestic and foreign direct investment. The recent extraordinary session of
Parliament discussed a package of 5 laws aimed at boosting investment and gold exports by
streamlining and stabilizing rules and procedures for domestic and foreign investors. These
MONGOLIA
INTERNATIONAL MONETARY FUND 15
discussions have been brought to fruition through the recent adoption of the new Investment Law
and the Investment Fund Law.
39. Efforts to strengthen macroeconomics statistics should continue. Good progress is
being made in upgrading national accounts and balance of payments statistics, building on
recommendations made by technical assistance experts. Timely release of data on DBM spending is
needed to facilitate comprehensive assessments of the fiscal policy stance.
STAFF APPRAISAL
40. Mongolia continues to be one of the fastest growing economies in Asia. Growth in 2012
and the first half of 2013 was buoyed by the development of new large mining projects, a relatively
mild winter boosting agriculture, and highly expansionary fiscal and monetary policies. Inflation fell
to a two-year low in July thanks to moderating food prices and the BOM’s price stabilization
program. Poverty continued to decline in 2012.
41. However, BOP pressures have been intensifying and inflation is bound to rise again. To
cushion the impact on domestic activity of declining FDI and coal exports, monetary and fiscal policy
have been loosened markedly. Through mid-year, the resulting BOP pressures were met by
intervention, supported by large sovereign and BOM external borrowing. More recently, the
exchange rate has been allowed to depreciate, which will likely push up inflation in the coming
months.
42. A continuation of current policies could lead to a highly vulnerable situation. The near-
term outlook for growth is favorable. However, continued elevated fiscal spending, including
through off-budget public investment projects, and failure to rein in credit growth could heighten
risks to the economy and the financial sector. Given Mongolia’s exposure to external shocks, this
could necessitate a costly and painful adjustment down the road. In particular, the outlook is subject
to risks from the uncertain outlook for external demand for commodities which could negatively
impact Mongolia via trade and FDI channels. There is also a risk that vulnerabilities in the banking
system could be exposed, which could exacerbate a negative shock to growth and financial stability.
The IMF/World Bank Debt Sustainability Analysis (DSA) now indicates that Mongolia is at a
moderate risk of debt distress.
43. Putting the economy on a sustainable path requires implementation of a package of
fiscal and monetary adjustment in the context of a flexible exchange rate regime, as outlined
in the “strong policy scenario”. In this regard, some encouraging steps have been taken in recent
months, particularly in the areas of fiscal policy and exchange rate policy. This signals a good start
by the authorities to initiate the “strong policy scenario,” provided the monetary expansion and off-
budget fiscal operations are reined in.
44. An ambitious and credible fiscal consolidation plan should be drawn up. Recently
announced steps would moderate spending growth during the remainder of 2013 and provide a
solid foundation for the preparation of the 2014 budget. However, further measures are urgently
MONGOLIA
16 INTERNATIONAL MONETARY FUND
needed. Even with the announced steps, this year’s fiscal deficit (including DBM operations) will still
be very large and public debt, including external borrowing by the Bank of Mongolia, will reach
about 67 percent of GDP this year, up from 39 percent of GDP in 2011. This raises doubts about the
consistency of fiscal policy with the FSL. Budget operations and the operations of the DBM taken
together should meet the 2 percent of GDP ceiling for the structural deficit over the next 2-3 years.
Given the sustained BOP pressures, the planned adjustment needs to be adequately frontloaded,
spearheaded by streamlining subsidies and transfers and reprioritizing capital spending.
45. Reform of the fiscal policy framework should continue. Implementation of the SWL
would enhance fiscal flexibility and efficiency and reduce inequality. Establishment of a SWF would
be an important complement to the FSL’s countercyclical fiscal policy framework.
46. The large monetary stimulus provided by the BOM should be unwound. The three BOM
programs that have been launched over the past year have unduly loosened the monetary policy
stance, creating inflationary and BOP pressures. Moreover, they create important distortions,
heighten banking sector vulnerabilities, and could give rise to contingent liabilities for the public
sector.
47. The increased exchange rate flexibility observed in recent months has helped absorb
some of the BOP pressures. The floating exchange rate regime and auction system should be
maintained, and intervention should be limited to smoothing excessive exchange rate volatility.
While gross reserves remain adequate for precautionary purposes, net international reserves are on
a downward trajectory that is not sustainable The real exchange rate is assessed to be moderately
overvalued, even in a strong policy scenario which assumes a tightening of monetary and fiscal
policy.
48. Efforts to contain financial sector risks should continue. Building on progress in
strengthening banks’ capitalization and liquidity, the BOM should strictly enforce existing prudential
regulations, including single-borrower limits. Focus should also be on strengthening underwriting
practices, loan classifications, and NPL recognition. The BOM should consider phasing in a more
forward-looking provisioning scheme that takes into account the risks of losses on performing
loans. Lending dollarization should be discouraged. The bank resolution regime should be
enhanced, and a legal framework developed for prompt corrective actions that mandates
progressively stronger supervisory actions as a bank’s capital declines. Efforts to strengthen the
AML/CFT framework need to be stepped up to avoid blacklisting by the FATF.
49. Mongolia’s medium-term prospects remain promising. Mongolia’s large natural resource
endowment and its proximity to fast-growing economies provide ample opportunities for
development. Mining GDP is projected to expand rapidly during the next five years thanks to large
mining projects coming on stream. The sustained growth of activity outside the mining sector would
need to be supported by continued reforms to strengthen the business climate, building on the
government’s recent success in passing a new investment law. Efforts to strengthen macroeconomic
statistics should continue.
50. It is recommended that the next Article IV consultation take place on the standard 12-month
cycle.
MONGOLIA
INTERNATIONAL MONETARY FUND 17
Box 1. The Recent Failure of Savings Bank1
The Bank of Mongolia (BOM) announced on July 22 that it had intervened Savings Bank. Privately-
owned Savings Bank accounted for 8 percent of total banking assets (fifth-largest in the country). Reflecting
its historically broad branch network, it processed over half of government financial services transactions
including payments of pensions, child allowances, and subsidies. The intervention included the appointment
of a receiver and transfer of most of the bank’s assets and liabilities to State Bank, a government-owned
bank established in 2009 to manage assets and liabilities from two failed banks.
Savings Bank’s failure underscores the need to strengthen banking supervision. In its announcement,
the BOM indicated that the Savings Bank had faced financial difficulties since 2011. The BOM linked the
failure to loans to related interests of the bank’s only shareholder and indicated that the matter would be
turned over to relevant law enforcement agencies. The related-party loans in this instance exceeded capital
by more than 2 times (compared to the 20 percent of capital limitation on loans to any related parties, and
the 5 percent limitation on loans to related parties of the bank).
The failure’s impact on macro-financial stability appears to be well-contained. The BOM reports that
deposit outflows subsequent to the merger were minimal (including in State Bank). While market observers
have highlighted that the unexpected nature of the intervention could undermine confidence in the system
as a whole, the BOM notes that the Savings Bank had been under a special supervisory program since 2011.
A recapitalization of State Bank in the amount of MNT 205 billion is planned. Accordingly, the Deposit
Insurance Corporation would provide these funds to State Bank in the form of financial support and share
purchases, financed from a loan from the BOM. This would restore the bank’s CAR to 18 percent, the level
before it received the assets and assumed the liabilities of the failed Savings Bank. The authorities expressed
a commitment to privatize the State Bank as soon as possible.
_________
1
Prepared by John Quill (MCM).
MONGOLIA
18 INTERNATIONAL MONETARY FUND
Box 2. Price Stabilization Program, Mortgage Program and Liquidity Injection
Over the past year, the BOM has attempted to reduce inflation and spur economic growth using
unconventional methods. However, the exceptionally large monetary and quasi-fiscal stimulus provided
through various programs risk ratcheting up inflation, adding to BOP pressures, and heightening banking
sector vulnerabilities.
The total planned allocation under the three programs is equivalent to MNT 3.4 trillion (20 percent
of GDP). By end-August, about MNT 3 trillion had been disbursed, causing the BOM’s Net Domestic Assets
to rise by more than 100 percent of end-2012 reserve money and raising reserve money growth to 34
percent (y/y):
 Price Stabilization Program (PSP). Under this program, launched in late-2012, the BOM provides low-
cost funding to corporations whose price-setting behavior has a significant impact on the CPI (e.g.
wholesale distributors of meat, flour and imported petroleum products). By end-August, about MNT 0.6
trillion had been channeled through banks, which are charged 0.5-4 percent and, in turn, can charge
their corporate customers up to 7 percent.
 Liquidity injection. Through August, the BOM provided banks MNT 900 billion in the form of one-year
time deposits at 7 percent interest to reverse the downward trend in lending growth.
 Mortgage program and housing support supply loans. In mid-June, the BOM launched a MNT 1.1 trillion
mortgage lending program, aimed to provide low-cost mortgage loans to qualified consumers. Funding
under this program was provided to banks at 4 percent interest, and on-lent by banks through 20-year
mortgages at 8 percent interest. In addition, the BOM has provided about MNT 0.4 trillion housing
supply support to construction companies and real estate developers.
Besides adding to inflationary and BOP pressures, the programs heighten banking sector
vulnerabilities. They could also give rise to contingent liabilities for the public sector:
 Owing to the lending rate caps, the banks cannot adequately price credit risk.
 The mortgage lending and liquidity injection programs create refinancing risk for the banks, in case the
BOM withdraws from the programs.
 Risks are exacerbated by the fact that loans issued under the programs are exempt from prudential
ratios, in particular the single large exposure and related-lending limits. This worsens moral hazard and
adverse selection.
 Under the mortgage lending program, credit risk is envisaged to be transferred away from the banking
system through mortgage-backed securities (MBSs) issued by the Mongolian Mortgage Corporation
(MIK) without recourse to the banks. However, in that case the risks would be borne by the potential
MBS investors. In view of the subsidized mortgage lending rates, yields on the MBSs may well be too
low to attract private investors. Hence, the MBSs would likely remain in the public sector (e.g. BOM,
government, or the Social Insurance Fund), giving rise to contingent liabilities.
The social objectives pursued by the programs (e.g. making housing more affordable) and efforts to address
supply bottlenecks to curb inflation would be best pursued through structural reforms and the government
budget. Loans should be transparently priced at market interest, with subsidies provided from the budget.
MONGOLIA
INTERNATIONAL MONETARY FUND 19
0
0.5
1
1.5
2
2.5
3
3.5
1 2 3 4 5 6 7 8 9 10 11 12 13 14 15 16 17 18 19 20
Impulse Response of EMP to Reserve Money
and Credit Growth (1 Cholesky SD)
Reserve money growth Credit growth
-120
-70
-20
30
80
-40
-30
-20
-10
0
10
20
30
Jan-09
May-09
Sep-09
Jan-10
May-10
Sep-10
Jan-11
May-11
Sep-11
Jan-12
May-12
Sep-12
Jan-13
May-13
EMP(3mma)
Credit Growth (y/y, RHS)
Reserve money growth(y/y, RHS)
Sources: Mongolian authorities; and IMF staff estimates.
Exchange Market Pressure Index and Credit Growth
Box 3. The Monetary Policy Stance1
An analysis of exchange market pressures and Taylor-type rules suggests that the recent monetary easing
implemented through the stimulus programs discussed in Box 2 has been excessive and distortionary.
Monetary easing contributing to exchange market pressures.
During the first 9 months of 2013, the nominal exchange rate of the togrog depreciated by 19 percent, and gross
international reserves declined by 35 percent.
 The chart below shows a clear correlation between an index of exchange market pressures (EMP)
2
and credit
growth. Specifically, the EMP index started to show sustained depreciation pressures after credit growth
accelerated from early 2012. Depreciation pressures intensified from early 2013 with the acceleration of credit
growth triggered by the BOM stimulus programs.
 A clear empirical association is found between developments in credit growth and reserve money growth on the
one hand and the path of the EMP index on the other hand. In particular, a one standard deviation increase in
reserve money is associated with an increase in the EMP index by 3½ standard deviations after about
5 months. Similarly, a one standard deviation increase in credit growth is associated with an increase in the
EMP index by 2 standard deviations after 6 months.
An assessment of policy interest rates based on
Taylor-type rules.
 Mongolia-specific estimates of Taylor-type rules
indicate that the BOM’s monetary policy has been
accommodative in recent years. The BOM has
typically responded actively to overheating
pressures. However, the policy-rate responses to
rising inflationary pressures have been less forceful
than implied by the Taylor rule. In other words,
when inflation increased, real policy interest rates
have typically tended to fall.
 The interest rates set by the BOM for the monetary stimulus programs deviate substantially from the levels
implied by Mongolia-specific estimates of Taylor-type rules. In particular, the interest rate implied by the
Taylor-type rule for Mongolia is about 11–12 percent in 2013Q3, while the interest rates charged by the BOM
on loans under the price stabilization program, mortgage program, and time deposits are around 1, 4, and
7 percent, respectively. The large deviation of BOM lending rates from the rate implied by the Taylor-rule is
likely to raise external, inflationary, and financial risks and distorts the signal of the BOM’s headline policy
rate.
_________
1
Prepared by Jiangyan Yu (APD).
2
The EMP index is calculated as the sum of the exchange rate depreciation and the change in reserves (in percent of
reserve money). A positive value of the index indicates pressure for depreciation or a loss of reserves.
0
2
4
6
8
10
12
14
16
18
2012M1
2012M2
2012M3
2012M4
2012M5
2012M6
2012M7
2012M8
2012M9
2012M10
2012M11
2012M12
2013M1
2013M2
2013M3
2013M4
2013M5
2013M6
2013M7
Actual and Implied Interest Rates
Actural interest rate Implied interest rate BOM Deposit
PSP loans Mortgage program
MONGOLIA
20 INTERNATIONAL MONETARY FUND
Box 4. Exchange Rate Assessment1
Staff’s assessment based on the “strong policy scenario” is that the togrog is moderately overvalued despite the
recent real depreciation. This assessment underscores the importance of increased exchange rate flexibility—as
observed in the past four months—supported by tighter fiscal and monetary policy. Structural reforms aimed at
improving the business climate and trade integration should be pursued with a view to narrowing the medium-
term non-mining current account deficit. In the “weak policy scenario” the overvaluation would be considerably
higher.
 Macro balance approach. On the basis of trade elasticities estimated by Tokarick (2009), the exchange
rate would need to depreciate by 12 percent in real
terms to close the gap between the medium-term
CA deficit in the “strong policy scenario” (15 percent
of GDP) and the medium-term norm (a deficit of
7 percent of GDP). In case of looser fiscal policy than
the path implied by the FSL and continued monetary
easing, the CA deficit would be wider and the
overvaluation correspondingly larger.
 Equilibrium exchange rate approach. The real
exchange rate of the togrog is 12 percent more
appreciated than the “equilibrium exchange rate”
determined on the basis of a panel regression on a
set of macroeconomic fundamentals, including net
foreign assets, relative productivity, terms of trade,
and government consumption.
 External sustainability (ES) approach. The BOM
estimates that the FDI and portfolio inflows have
pushed Mongolia’s international investment position
(IIP) to a net liability position of 126 percent of GDP
in 2012. Only a 1 percent real depreciation of the
togrog would be needed to stabilize Mongolia’s IIP
at this low level. Over time, as Mongolia moves
through the mining investment cycle, its IIP can be
expected to improve. In that case, the estimated
overvaluation of the togrog according to the ES
approach can be expected to rise.
_________
1
Prepared by Jiangyan Yu (APD).
Estimates of Overvaluation of the Togrog
Estimated
Overvaluation
Approach (in percent)
Macro balance 12
Equilibrium exchange rate 12
External sustainability 1
Source: IMF staff estimates.
60
70
80
90
100
110
120
130
140
150
60
70
80
90
100
110
120
130
140
150
Jan-05
Jul-05
Jan-06
Jul-06
Jan-07
Jul-07
Jan-08
Jul-08
Jan-09
Jul-09
Jan-10
Jul-10
Jan-11
Jul-11
Jan-12
Jul-12
Jan-13
Jul-13
REER NEER
Sources: Mongolian authorities; and IMF staff estimates.
Exchange rates of the togrog
(Index, 2005=100, Jan. 2005-Sept. 2013; an increase is an appreciation)
MONGOLIA
INTERNATIONAL MONETARY FUND 21
0
20
40
60
80
100
120
140
Dec. 2010 Latest 1/
Sources: IFS, IMF; and IMF staff calculations.
1/ Latest: August 2013 (Mongolia), April 2013 (Nepal), March 2013 (Indonesia, PNG,
Bangladesh, Cambodia, Lao P.D.R.), February 2013 (Philippines), December 2012 (India, Sri
Lanka, Vietnam).
Loan-to-Deposit Ratio
(In percent)
8
10
12
14
16
18
20
Mongolia Philippines Malaysia Indonesia India
CAR Tier1 ratio
Capital Adequacy of Asian Banks
(In percent, at end-2012)
Sources: Mongolian authorities; Haver Analytics; and IMF staff estimates.
0
10
20
30
40
50
60
70
80
90
100
Mongolia Vietnam 1/ Philippines 1/ Lao PDR Cambodia
2007
Latest
Sources: Mongolian authorities; CEIC; and IMF staff estimates.
1/ Latest: September 2013 (Mongolia), December 2011 (Vietnam), March 2013 (Philippines,
Cambodia), and December 2012 (Lao PDR); the first observation for the Philippines is March 2008.
Foreign Currency Deposits to Broad Money
(In percent)
Box 5. Financial Soundness Indicators and Bank Stress Tests1
Financial soundness indicators improved in 2012
(Table 8). The capital adequacy ratio reached 16 percent
of risk-weighted assets at the end of 2012, and Tier 1
capital rose to more than 11 percent. NPLs (including
past due loans) declined to 3.8 percent of total loans.
However, banking sector vulnerabilities remain
significant. Bank credit remains highly concentrated in a
few sectors. Unlike in many other Asian countries which
have been strengthening their rules and regulations for
provisioning, provisioning requirements for performing
loans remain zero in Mongolia. On the back of the
BOM’s stimulus programs, the loan-to-deposit ratio has
surged beyond levels seen in Mongolia’s Asian peers.
Dollarization remains higher than in most other Asian
countries, potentially giving rise to foreign currency
mismatches in the non-bank private sector.
Stress tests illustrate prevailing credit risk. As
expected, tentative stress tests on bank-by-bank data for
general credit risk, sectoral concentration risk and large
exposure risk suggest that the banking system would be
substantially affected by shocks related to these risks. In
a severe stress scenario, simulating the effect of a broad-
based shock to credit quality similar to 2008/09,
15 percent of performing loans deteriorate to
substandard, 15 percent of substandard loans
downgrade to doubtful, 25 percent of doubtful loans
deteriorate to loss, and five percent of performing loans
deteriorate to loss. In this scenario, two of the 14 banks
become insolvent and four others banks see their CAR
fall below 8 percent, implying substantial recapitalization
needs.
Liquidity risk appears limited while data limitations
preclude an adequate assessment of exchange rate
risk:
 In a scenario where deposits are withdrawn for five
consecutive days at a rate increasing to 10 percent
of deposits on the fifth day, all banks continue to
observe the 25 percent minimum liquidity ratio. In a severe scenario similar to the experience in 2008/09 with
the daily deposit withdrawal rising to 20 percent of total deposits, one small bank becomes illiquid.
 In a scenario with a 20 percent depreciation of the togrog vis-à-vis the U.S. dollar, one small bank sees its
capital reduced below the minimum requirement. One small bank and one large bank would need such a
recapitalization in case of a 50 percent depreciation. It should be noted that the latter two scenarios do not
incorporate the potential indirect impact of the depreciation on loan quality through balance sheet effects
affecting unhedged foreign currency borrowers.
_________
1
Prepared by Jongsoon Shin (OAP).
MONGOLIA
22 INTERNATIONAL MONETARY FUND
-10
-5
0
5
10
15
20
25
-10
-5
0
5
10
15
20
25
2008Q1
2008Q2
2008Q3
2008Q4
2009Q1
2009Q2
2009Q3
2009Q4
2010Q1
2010Q2
2010Q3
2010Q4
2011Q1
2011Q2
2011Q3
2011Q4
2012Q1
2012Q2
2012Q3
2012Q4
2013Q1
2013Q2
Agriculture
Non-miningindustry
Services
Net taxes
Mining industry
GDP at market prices (y/y growth)
Sources: Mongolian authorities.
Real GDP Growth
(Contribution and year-on-year percentage change, 2008Q1-2013Q2)
Figure 1. Real Sector Developments
The economy expanded by 11½ percent during the first half of 2013
despite slowing FDI inflows and exports.
Mongolia’s growth has been impressive.
Growth reaccelerated to 14.3 percent (y/y) in the second
quarter of 2013 from 7.2 percent (y/y) in the first quarter.
FDI inflows are down 46 percent so far this year.
Coal export volumes are down 20 percent so far this year.
However, they appear to be bottoming out.
The nominal exchange rate has depreciated 22 percent over
the past 12 months, despite sustained BOM interventions.
Aided by a deceleration of food prices, inflation has come
down and stood at 8.4 percent in September (y/y).
-5
0
5
10
15
20
-5
0
5
10
15
20
2001
2002
2003
2004
2005
2006
2007
2008
2009
2010
2011
2012
China
Mongolia
Sources: Mongolian authorities; and IMF staff estimates.
Real GDP Growth Rate: China vs. Mongolia
(Year-on-year percent change)
0
200
400
600
800
1,000
1,200
1,400
1,600
0
200
400
600
800
1,000
1,200
1,400
1,600
2008Q1
2008Q2
2008Q3
2008Q4
2009Q1
2009Q2
2009Q3
2009Q4
2010Q1
2010Q2
2010Q3
2010Q4
2011Q1
2011Q2
2011Q3
2011Q4
2012Q1
2012Q2
2012Q3
2012Q4
2013Q1
2013Q2
2013Q3
Foreign Direct Investment 1/
(In millions of U.S. dollars, 2008 Q1- 2013 Q3)
Source: Mongolian authorities; and IMF staff estimates.
1/ Observation for the third quarter of 2013 is a projection based on outturns for July and August.
-60
-40
-20
0
20
40
60
80
100
120
-60
-40
-20
0
20
40
60
80
100
120
Jan-11
Apr-11
Jul-11
Oct-11
Jan-12
Apr-12
Jul-12
Oct-12
Jan-13
Apr-13
Jul-13
volume growth (y/y, 3mma)
volume growth (y/y, 12mma)
Sources: Mongolian authorities; and IMF staff estimates.
Coal Export Volume
(Change, in percent, January 2011-September2013)
1,300
1,350
1,400
1,450
1,500
1,550
1,600
1,650
1,700
1,750-80
-60
-40
-20
0
20
40
60
80
100
Nov-11
Jan-12
Mar-12
May-12
Jul-12
Sep-12
Nov-12
Jan-13
Mar-13
May-13
Jul-13
Sep-13
Nov-13
Total Intervention sales (in US$m, LHS)
of which: Intervention conducted in RMB (in US$m, LHS)
MNT/US$-exchange rate (RHS, inverted scale)
Sources: Mongolian authorities.
MNT/US$-rate and BOM Foreign Exchange Sales
(November 1, 2011-November 1, 2013)
-5
0
5
10
15
20
25
30
35
40
-5
0
5
10
15
20
25
30
35
40
Dec-07
Mar-08
Jun-08
Sep-08
Dec-08
Mar-09
Jun-09
Sep-09
Dec-09
Mar-10
Jun-10
Sep-10
Dec-10
Mar-11
Jun-11
Sep-11
Dec-11
Mar-12
Jun-12
Sep-12
Dec-12
Mar-13
Jun-13
Sep-13
Non-food items (contribution to headline CPI)
Food items (contribution to headline CPI)
Headline CPI (y/y)
Non-food CPI (y/y)
Food CPI (y/y)
Sources: Mongolian authorities; and IMF staff estimates.
Consumer Price Inflation
(in percent, December 2007-September 2013)
MONGOLIA
INTERNATIONAL MONETARY FUND 23
0
10
20
30
40
50
60
70
0
10
20
30
40
50
60
70
2005 2006 2007 2008 2009 2010 2011 2012
Nominal public debt
NPV of public debt
Public Debt
(in percent of GDP)
Sources: Mongolian authorities; and IMF staff esimates.
70
80
90
100
110
120
130
140
70
80
90
100
110
120
130
140
Dec-07
Mar-08
Jun-08
Sep-08
Dec-08
Mar-09
Jun-09
Sep-09
Dec-09
Mar-10
Jun-10
Sep-10
Dec-10
Mar-11
Jun-11
Sep-11
Dec-11
Mar-12
Jun-12
Sep-12
Dec-12
Mar-13
Jun-13
Sep-13
8-year average
Headline Loan-To-Deposit Ratio
Commercial Banks' Loan-To-Deposit (L/D) Ratio
(Dec. 2007-Sep. 2013)
Sources: Mongolian authorities; and IMF staff estimates.
Figure 2. Fiscal and Monetary Sector Developments
Fiscal and monetary policies have been expansionary over the past two years.
Including DBM spending, the overall fiscal deficit reached
10.9 percent of GDP in 2012.
The nonmineral fiscal deficit exceeded the 2008 high.
Spending exceeded 57 percent of non-mineral GDP in 2012
The Chinggis bond (US$1.5bn) and DBM bond (US$0.6bn)
raised public debt.
The growth of private sector credit accelerated to 48 percent
in September (y/y). Deposit growth stood at 20 percent (y/y)
Banks’ loan-to-deposit ratio has now risen substantially
above the longer-term average.
-15
-10
-5
0
5
10
-15
-10
-5
0
5
10
2005 2006 2007 2008 2009 2010 2011 2012
On-budget overall balance
Increase in deficit owing to DBM spending
Sources: Mongolian authorities; and IMF staff estimates.
Fiscal Balance
(in percent of GDP)
-25
-20
-15
-10
-5
0
-25
-20
-15
-10
-5
0
2005 2006 2007 2008 2009 2010 2011 2012
Nonmineral (NM) on-budget balance
Larger NM deficit due to DBM spending
Sources: Mongolian authorities; and IMF staff estimates.
Nonmineral Fiscal Balance
(in percent of nonmineral GDP)
0
10
20
30
40
50
60
70
0
10
20
30
40
50
60
70
2005 2006 2007 2008 2009 2010 2011 2012
Nonmineral revenue
On-budget expenditure
DBM spending 1/
Sources: Mongolian authorities; and IMF staff estimates.
1/The Development Bank of Mongolia provided loans of US$ 190 million for nonrevenue-generatingpublic
investment projectssuch as roads ("socialbenefit projects") in 2012. Thebudget will need to repay these loans.
Nonmineral Revenue and Expenditure
(in percent of nonmineral GDP)
-40
-20
0
20
40
60
80
100
120
140
-40
-20
0
20
40
60
80
100
120
140
Dec-07
Mar-08
Jun-08
Sep-08
Dec-08
Mar-09
Jun-09
Sep-09
Dec-09
Mar-10
Jun-10
Sep-10
Dec-10
Mar-11
Jun-11
Sep-11
Dec-11
Mar-12
Jun-12
Sep-12
Dec-12
Mar-13
Jun-13
Sep-13
Credit
Deposits
Sources: Mongolian authorities; and IMF staff estimates.
Bank Credit and Deposits
(Quarter-on-quarter change, in percent (saar), Dec. 2007-Sep. 2013)
MONGOLIA
24 INTERNATIONAL MONETARY FUND
Figure 3. External Sector Developments
Expansionary policies have kept the trade deficit over US$2 billion.
Imports continue to contract, in line with the decline in FDI.
Export growth has turned positive on the start of operations
of the OT open pit mine.
The 12-month trade deficit remains over US$2 billion…
…and the current account remains significantly in deficit
even as imports for the FDI-financed OT mine wind down.
International bond proceeds raised reserves in late-2012.
Since then there has been a rapid loss of reserves.
Mongolia’s sovereign spread is now about 140 basis points
wider than the average for emerging market economies.
Stock prices of 3 mining companies operating mostly in
Mongolia (MMC, TRQ, and South Gobi) have slumped.
-60
-40
-20
0
20
40
60
80
100
120
140
-60
-40
-20
0
20
40
60
80
100
120
140
Dec-07
Mar-08
Jun-08
Sep-08
Dec-08
Mar-09
Jun-09
Sep-09
Dec-09
Mar-10
Jun-10
Sep-10
Dec-10
Mar-11
Jun-11
Sep-11
Dec-11
Mar-12
Jun-12
Sep-12
Dec-12
Mar-13
Jun-13
Sep-13
Exports
Imports
Sources: Mongolian authorities; and IMF staff estimates.
Imports and Exports
(Twelve-month percentage change in 3mma, Dec. 2007-Sept. 2013)
-6,000
-5,000
-4,000
-3,000
-2,000
-1,000
01,000
2,000
3,000
4,000
5,000
6,000
7,000
8,000
Dec-07
Mar-08
Jun-08
Sep-08
Dec-08
Mar-09
Jun-09
Sep-09
Dec-09
Mar-10
Jun-10
Sep-10
Dec-10
Mar-11
Jun-11
Sep-11
Dec-11
Mar-12
Jun-12
Sep-12
Dec-12
Mar-13
Jun-13
Sep-13
Trade balance (RHS, inverted scale)
Exports (LHS)
Imports (LHS)
Trade Balance
(12-month rolling sums, in US$m, Dec. 2007- Sept . 2013)
Sources: Mongolian authorities; and IMF staff estimates.
-40
-35
-30
-25
-20
-15
-10
-5
0
5
10
-4,000
-3,500
-3,000
-2,500
-2,000
-1,500
-1,000
-500
0
500
1,000
2003 2004 2005 2006 2007 2008 2009 2010 2011 2012
Transfers, net
Income, net
Goods and services, net
Current account
Current account (RHS, in percent of GDP)
Current Account
(In millions of U.S. dollars, 2003-2012)
Sources: Mongolian authorities; and IMF staff estimates.
0
500
1,000
1,500
2,000
2,500
3,000
3,500
4,000
4,500
Jan-09
Apr-09
Jul-09
Oct-09
Jan-10
Apr-10
Jul-10
Oct-10
Jan-11
Apr-11
Jul-11
Oct-11
Jan-12
Apr-12
Jul-12
Oct-12
Jan-13
Apr-13
Jul-13
Oct-13
GIR (BOM definition)
Sources: Mongolian authorities.
Gross International Reserves
(In millions of U.S. dollars, Jan. 1, 2009 - Oct. 30, 2013)
0
100
200
300
400
500
600
700
0
100
200
300
400
500
600
700
Jan-12
Feb-12
Mar-12
Apr-12
May-12
Jun-12
Jul-12
Aug-12
Sep-12
Oct-12
Nov-12
Dec-12
Jan-13
Feb-13
Mar-13
Apr-13
May-13
Jun-13
Jul-13
Aug-13
Sep-13
Oct-13
Mongolia Philippines
Emerging mrkts. (EMEs) Sri Lanka
Vietnam Mongolia spread over EMEs
Source: Bloomberg LP.
JP Morgan EMBI Global Sovereign Spreads
(in basis points, January 1, 2012-October 30, 2013)
0
20
40
60
80
100
120
140
160
0
20
40
60
80
100
120
140
160
Jan-08 Jan-09 Jan-10 Jan-11 Jan-12 Jan-13
Mong. Mining Corp. (MMC, in HK)
Turquoise Hill (TRQ, in Toronto)
South Gobi (in HK)
Rio Tinto (London)
Sources: Bloomberg LP.; and IMF staff estimates.
Stock Prices for Mining Companies
(Index, January 1, 2011=100, Jan. 1, 2008-Oct. 30, 2013)
Return since Jan.1, 2011
(in percent) _
MMC (coal) -86
TRQ (copper) -77
South Gobi(coal) -91
Rio Tinto (diverse) -27
Copper price -26
MONGOLIA
INTERNATIONAL MONETARY FUND 25
-6 -4 -2 0 2 4
Pakistan
China
Vietnam
Chile
Thailand
Colombia
Peru
Sri Lanka
Mongolia
Source: IMF, WEO.
Change in Unemployment Rate, 2007-12
(In percentage points)
0.0
0.1
0.2
0.3
0.4
0.5
0.6
0.7
0.8
0.9
Chile
Kazakhstan
Peru
SriLanka
Mongolia
India
LaoP.D.R.
Cambodia
Pakistan
Bangladesh
Myanmar
Nepal
HDI, 2012 Average HDI (1990-2012)
Source: Human Development Report 2012 (UNDP).
Human Development Index (HDI)
-10
0
10
20
30
40
50
60
70
-10
0
10
20
30
40
50
60
70
Myanmar
Mongolia
SriLanka
Pakistan
Vietnam
India
Bangladesh
Cambodia
Peru
Chile
Source: IMF, WEO database.
Highest
Lowest
Inflation, 1995-2012
(In percent, average)
-12 -10 -8 -6 -4 -2 0 2 4 6
-12 -10 -8 -6 -4 -2 0 2 4 6
Lao P.D.R. (2002-2008)
Mongolia (2002-2008)
India (2005-2010)
Pakistan (2002-2008)
Bangladesh (2000-2010)
Vietnam (2002-2008)
Chile (2003-2009)
Sri Lanka (2002-2010)
Cambodia (2004-2009)
Kazachstan (2002-2009)
Peru (2002-2010)
Nepal (2003-2010)
Source: World Development Indicators.
Change in Gini Index
(in Gini points)
Bangladesh
Cambodia
Chile
India
KazakhstanLao P.D.R.
Mongolia
Nepal
Pakistan
Peru
2
3
4
5
6
0 1 2 3 4 5
Education
Healthcare
Public Expenditure on Health Care and Education
(In percent of GDP, 2011 or latest available year)
Source: World Development Indicators.
Figure 4. Inclusive Growth Indicators
Poverty and unemployment show encouraging trends but rising inequality suggests that there is
scope to make growth more inclusive.
Poverty continued to decline in 2012, owing to rapid growth Unemployment rate also declined with high growth.
However, inequality has been on the rise… …despite relatively high social spending.
Mongolia has relatively high human capital.. But inflation volatility remains high, hurting the poor.
MONGOLIA
26 INTERNATIONAL MONETARY FUND
Nominal GDP (2012): US$10,258 million 1/ Quota: SDR 51.1 million
Population, end-year (2011): 2.8 million Outstanding use of IMF resources: SDR 57.49 million
Per capita GDP (2012): US$3,651 1/ (as of September 30, 2013)
Poverty incidence (2012): 27.4 percent 2/
Proj. Proj.
2009 2010 2011 2012 2013 2014
Real sector
Real GDP growth -1.3 6.4 17.5 12.3 11.8 9.6
Mineral 5.8 3.6 7.3 8.9 16.1 33.4
Non-mineral -2.7 7.0 19.7 12.9 11.0 5.0
Consumer prices (period average) 6.3 10.2 7.7 15.0 9.7 11.1
Consumer prices (end-period) 1.9 14.3 9.4 14.2 11.7 11.0
GDP deflator 1.8 20.0 12.1 12.0 7.4 11.0
General government budget
Revenue and grants 30.3 37.1 40.3 35.7 34.4 32.9
Expenditure and net lending 35.5 36.6 45.1 46.6 47.9 40.3
Current balance 2.8 9.8 11.0 3.7 6.7 8.7
Primary balance -4.7 1.0 -4.4 -10.0 -11.1 -4.6
Overall balance (including grants) -5.2 0.5 -4.8 -10.9 -13.5 -7.4
Non-mineral overall balance -13.0 -10.5 -14.0 -16.9 -18.9 -12.6
Structural balance 3/ … … -6.9 -11.5 -13.7 -7.5
Money and credit
Broad money 26.9 61.6 37.1 18.8 17.1 28.8
Private credit 0.4 21.5 72.3 24.1 40.9 16.1
Interest rate on 7-day central bank bills, end-period (percent) 10.00 11.00 12.25 13.25 … …
Balance of payments
Current account balance (including official transfers) -410 -931 -2,759 -3,362 -3,470 -2,319
(In percent of GDP) -9.0 -14.9 -31.7 -32.8 -31.6 -20.3
(In percent of GDP, excluding mining related imports) -5.8 -5.7 -3.0 -7.2 -14.1 -4.6
Trade balance -194 -278 -993 -1,553 -1,425 -267
Exports 1,876 2,899 4,817 4,385 4,193 5,435
Imports -2,070 -3,177 -5,810 -5,938 -5,618 -5,702
Foreign direct investment 496 1,574 4,620 4,408 2,032 1,199
Gross official international reserves (end-period) 1,145 2,490 2,630 4,126 2,214 2,290
(In months of next year's imports of goods and services) 3.5 3.9 3.9 6.5 3.4 3.3
Trade prices
Export prices (US$, percent change) -8.1 23.8 39.5 -12.0 -14.9 -5.9
Import prices (US$, percent change) -36.3 27.9 31.6 1.0 -2.4 -4.4
Terms of trade (percent change) 44.3 -3.3 6.0 -12.8 -12.8 -1.6
Public and publicly guaranteed debt
Total public debt 48.5 35.9 38.8 63.0 67.3 65.8
Domestic debt 3.4 5.1 10.9 14.7 15.5 15.1
External debt 45.2 30.8 27.9 48.3 51.8 50.7
(In millions of U.S. dollars) 2,064 2,061 2,219 4,837 4,988 5,636
Exchange rate
Togrogs per U.S. dollar (end of period) 1,443 1,257 1,396 1,392 ... ...
Togrogs per U.S. dollar (period average) 1,441 1,348 1,273 1,359 ... ...
Nominal effective exchange rate (period average; percent change) -15.8 3.4 3.1 -5.1 ... ...
Real effective exchange rate (period average; percent change) -11.2 11.2 8.6 2.9 ... ...
Nominal GDP (in billions of togrogs) 6,591 8,415 11,088 13,944 16,691 20,352
Sources: Mongolian authorities; and IMF staff projections.
1/ Estimate, based on period average exchange rate.
2/ Based on the 2012 Household Socio-Economic Survey.
3/ As defined in the Fiscal Stability Law (FSL), which uses smoothed instead of actual commodity prices to calculate revenue.
Table 2. Mongolia: Selected Economic and Financial Indicators, 2009–14 (Strong Policy Scenario)
(In millions of US$)
(Percent change)
(In percent of GDP)
(Percent change)
(In percent of GDP)
MONGOLIA
INTERNATIONAL MONETARY FUND 27
2014
2009 2010 2011 Budget Est. Budget Proj. Proj.
Total revenue and grants 1,994 3,122 4,468 6,326 4,976 7,238 5,746 6,706
Current revenue 1,973 3,078 4,455 6,325 4,941 7,237 5,737 6,694
Tax revenue and social security contributions 1,621 2,688 3,909 5,255 4,291 6,631 4,988 5,801
Income taxes 520 975 919 1,048 895 1,300 1,195 1,346
Social security contributions 264 331 473 520 674 732 792 848
Sales tax and VAT 326 579 1,114 1,786 1,297 1,940 1,438 1,744
Excise taxes 167 269 294 361 312 595 454 532
Customs duties and export taxes 116 193 337 592 327 575 354 422
Other taxes 228 341 772 948 786 1,489 755 910
Non-tax revenue 352 390 545 1,071 650 606 748 893
Capital revenue and grants 21 44 14 1 35 1 10 12
Total expenditure and net lending 2,337 3,081 4,997 6,468 6,494 7,445 8,000 8,205
Current expenditure 1,788 2,257 3,236 4,525 4,428 4,906 4,624 4,931
Wages and salaries 576 648 802 1,230 1,197 1,406 1,406 1,420
Purchase of goods and services 394 519 702 864 855 1,074 976 1,047
Subsidies to public enterprises 36 81 123 109 127 186 169 181
Transfers 753 967 1,572 2,129 2,123 1,842 1,675 1,712
Interest payments 30 42 37 192 126 398 398 570
Capital expenditure and net lending 548 824 1,761 1,943 2,065 2,539 3,376 3,274
Capital expenditure 461 591 1,281 2,001 1,784 2,489 2,576 2,696
Domestically-financed 434 577 1,229 1,818 1,428 2,119 1,619 2,066
Foreign-financed 27 13 51 183 356 370 957 630
o/w DBM/Chinggis bond social benefit projects 258 750 562
Net lending 88 233 480 -58 282 50 800 579
o/w DBM/Chinggis on-lending 217 750 562
Overall balance (incl. grants) -343 42 -529 -142 -1,518 -206 -2,254 -1,499
Non-mineral overall balance -857 -882 -1,555 -1,258 -2,352 -1,295 -3,152 -2,556
Structural balance … … -770 -464 -1,605 -376 -2,288 -1,529
Financing 343 -42 529 142 1,640 206 2,254 1,499
Foreign (net) 219 31 199 130 3,044 413 380 1,155
Domestic (net) 124 -73 330 12 -1,404 -207 1,874 344
Privatization receipts (valuation adj.) -1 3 14 98 1 20 0 0
Domestic bank financing (net) 198 -112 95 -286 -1,694 39 1,958 729
Domestic non-bank financing (net) -73 36 461 522 376 -95 -50 -355
Stabilization fund accumulation 0 0 -241 -322 -87 -170 -34 -30
Total revenue and grants 30.3 37.1 40.3 45.4 35.7 41.0 34.4 32.9
Current revenue 29.9 36.6 40.2 45.4 35.4 41.0 34.4 32.9
Tax revenue and social security contributions 24.6 31.9 35.3 37.7 30.8 37.6 29.9 28.5
Non-tax revenue 5.3 4.6 4.9 7.7 4.7 3.4 4.5 4.4
Capital revenue and grants 0.3 0.5 0.1 0.0 0.3 0.0 0.1 0.1
Total expenditure and net lending 35.5 36.6 45.1 46.4 46.6 42.2 47.9 40.3
Current expenditure 27.1 26.8 29.2 32.4 31.8 27.8 27.7 24.2
Of which: Wages and salaries 8.7 7.7 7.2 8.8 8.6 8.0 8.4 7.0
Capital expenditure and net lending 8.3 9.8 15.9 13.9 14.8 14.4 20.2 16.1
Overall balance (incl. grants) -5.2 0.5 -4.8 -1.0 -10.9 -1.2 -13.5 -7.4
Non-mineral overall balance (incl. grants) -13.0 -10.5 -14.0 -9.0 -16.9 -7.3 -18.9 -12.6
Structural balance … … -6.9 -3.3 -11.5 -2.0 -13.7 -7.5
Financing 5.2 -0.5 4.8 1.0 11.8 1.2 13.5 7.4
Foreign (net) 3.3 0.4 1.8 0.9 21.8 2.3 2.3 5.7
Domestic (net) 1.9 -0.9 3.0 0.1 -10.1 -1.2 11.2 1.7
Banking system (net) 3.0 -1.3 0.9 -2.1 -12.1 0.2 11.7 3.6
Non-bank -1.1 0.5 4.3 4.5 2.7 -0.4 -0.3 -1.7
Stabilization fund accumulation 0.0 0.0 -2.2 -2.3 -0.6 -1.0 -0.2 -0.1
Memorandum items (in percent of GDP unlesss defined otherwise):
Off-budget spending from DBM/Chinggis bonds … … … … 3.4 … 9.0 5.5
Structural balance (FSL definition: excluding off-budget spending) … … -6.9 … -8.1 … -4.7 -2.0
Mineral revenue 7.8 11.0 9.3 8.0 6.0 6.2 5.4 5.2
Non-mineral revenue (in percent of non-mineral GDP) 27.9 33.8 39.3 45.9 36.5 44.5 35.1 35.0
Total expenditure (in percent of non-mineral GDP) 44.0 47.4 57.1 57.0 57.2 53.9 57.9 50.9
Non-mineral overall balance (in percent of non-mineral GDP) -16.2 -13.6 -17.8 -11.1 -20.7 -9.4 -22.8 -15.9
Nominal GDP (in billions of togrogs) 6,591 8,415 11,088 13,944 13,944 17,649 16,691 20,352
Copper price (Market, US$ per ton) 5,165 7,538 8,823 8,657 7,959 8,152 7,185 6,855
(Structural, US$ per ton) … … 5,709 6,461 5,868 6,329 5,933 6,066
Primary spending (change in percent) -6 32 63 27 28 11 19 0
Sources: Mongolian authorities; and IMF staff projections.
Table 3. Mongolia: Summary Operations of the General Government, 2009–14 (Strong Policy Scenario)
20132012
(In billions of togrogs)
(In percent of GDP)
MONGOLIA
28 INTERNATIONAL MONETARY FUND
2009 2010 2011 2012 2013 2014
Revenue 1,990 3,065 4,458 4,965 5,737 6,694
Expenditure 2,247 2,813 4,468 6,201 7,191 7614.6
Expense 1,792 2,254 3,199 4,428 4,624 4,931
Net acquisition of nonfinancial assets 455 559 1,269 1,773 2,566 2,684
Operating balance 198 811 1,259 537 1,112 1,763
Net lending/borrowing (overall balance) -257 252 -49 -1,358 -1,454 -921
Net acquisition of financial assets 205 175 707 368 834 608
Net incurrence of liabilities 462 -77 756 1,726 2,288 1,529
Domestic 162 30 557 -1,318 1,908 374
Foreign 300 -107 199 3,044 380 1,155
Revenue 30.2 36.4 40.2 35.6 34.4 32.9
Income tax 7.9 11.6 8.3 6.4 7.2 6.6
VAT 4.9 6.9 10.1 9.3 8.6 8.6
Excise tax 2.5 3.2 2.7 2.2 2.7 2.6
Customs and import duty 1.7 2.3 3.0 2.3 2.1 2.1
Royalty 2.2 2.4 5.3 4.0 2.7 2.8
Social contributions 3.9 3.8 4.3 4.8 4.7 4.2
Others 7.0 6.2 6.6 6.5 6.3 6.1
Expense 27.2 26.8 28.9 31.8 27.7 24.2
Compensation of employees 8.8 7.7 7.2 8.6 8.4 7.0
Use of goods and services 5.9 6.2 6.3 6.1 5.8 5.1
Interest 0.4 0.5 0.0 0.9 2.4 2.8
Subsidies 0.6 1.0 1.1 0.9 1.0 0.9
Social benefit 11.5 11.4 14.2 15.2 10.0 8.4
Net acquisition of nonfinancial assets 6.9 6.6 11.4 12.7 15.4 13.2
Operating balance 3.0 9.6 11.4 3.9 6.7 8.7
Net lending/borrowing (overall balance) -3.9 3.0 -0.4 -9.7 -8.7 -4.5
Net acquisition of financial assets 3.1 2.1 6.4 2.6 5.0 3.0
Policy lending 1.3 2.8 4.3 2.0 4.8 2.8
Stabilization fund 0.0 0.0 2.2 0.6 0.2 0.1
Net incurrence of liabilities 7.0 -0.9 6.8 12.4 13.7 7.5
Domestic 2.5 0.4 5.0 -9.4 11.4 1.8
Foreign 4.5 -1.3 1.8 21.8 2.3 5.7
Stock positions:
Net financial worth -0.3 2.8 1.6 -8.4 -15.8 -17.4
Financial assets 59.4 48.6 43.3 37.0 35.9 32.5
Currency and deposits 20.4 16.3 14.5 12.2 10.4 8.7
Securities other than shares 0.1 0.1 0.1 0.0 0.0 0.0
Loans 28.4 24.1 22.6 20.0 21.5 20.5
Shares and other equity 0.0 0.0 -0.1 -0.1 -0.1 -0.1
Other accounts receivable 10.4 8.2 6.2 4.9 4.1 3.4
Liabilities 59.7 45.8 41.6 45.5 51.7 49.9
Securities other than shares 11.3 8.5 9.3 33.0 29.9 29.8
Loans 45.0 34.7 30.3 10.9 20.5 19.0
Other accounts payable 3.4 2.6 2.0 1.6 1.3 1.1
Sources: Mongolian authorities; and IMF staff projections.
Table 4. Mongolia: Statement of Operations and Stock Positions of the General Government,
2009–14 (Strong Policy Scenario)
(In billions of togrogs)
(In percent of GDP)
Proj.
MONGOLIA
INTERNATIONAL MONETARY FUND 29
Proj. Proj.
2009 2010 2011 2012 2013 2014
Monetary survey
Broad money 2,880 4,655 6,381 7,582 8,878 11,434
Currency 285 390 519 606 591 662
Deposits 2,595 4,266 5,862 6,976 8,287 10,772
Net foreign assets 1,520 2,728 3,057 4,615 1,460 1,740
Net domestic assets 1,359 1,927 3,324 2,967 7,418 9,694
Domestic credit 1,987 2,448 4,295 3,984 8,780 11,072
Net credit to government -717 -836 -1,364 -3,042 -1,119 -419
Claims on non-banks 2,704 3,284 5,660 7,026 9,899 11,492
Other items, net -627 -521 -971 -1,017 -1,362 -1,379
Monetary authorities
Reserve money 733 947 1,662 2,168 2,432 2,722
Net foreign assets 1,526 2,518 3,034 5,155 2,287 2,564
BOM defined reserves 1,652 2,628 3,153 5,744 3,836 4,195
Other assets, net -126 -110 -119 -588 -1,549 -1,631
Net domestic assets -793 -1,571 -1,372 -2,987 146 158
Net credit to government -265 -493 -708 -2,776 -1,497 -912
Claims on deposit money banks 198 131 342 401 2,394 2,122
Minus: Central bank bills (net) 393 1,101 879 752 900 1,201
Other items, net -333 -109 -127 141 149 149
Memorandum items:
Annual broad money growth 26.9 61.6 37.1 18.8 17.1 28.8
Annual reserve money growth 26.4 29.2 75.5 30.5 12.2 11.9
Velocity 1.7 1.8 1.7 1.8 1.9 1.8
Claims on non-banks growth 0.4 21.5 72.3 24.1 40.9 16.1
Claims on non-banks (in percent of GDP) 54.5 39.0 51.0 50.4 59.3 56.5
Total loans/deposits 104.2 77.0 96.5 100.7 119.5 106.7
Sources: Mongolian authorities; and IMF staff projections.
Table 5. Mongolia: Monetary Aggregates, 2009−14 (Strong Policy Scenario)
(In billions of togrog, end of period)
(In percent, unless otherwise indicated)
MONGOLIA
30 INTERNATIONAL MONETARY FUND
2011 2012 2013 2014 2015 2016 2017 2018
(In millions of U.S. dollars, unless otherwise indicated)
Current account balance (including official grants) -2,759 -3,362 -3,470 -2,319 -2,283 -2,855 -2,251 -2,328
Trade balance -993 -1,553 -1,425 -267 -19 -435 234 146
Exports 4,817 4,385 4,193 5,435 6,129 5,987 7,038 7,304
Mineral export 1/ 4,302 4,032 3,868 5,128 5,807 5,658 6,700 6,956
Non-mineral export 515 353 325 307 322 329 338 348
Imports -5,810 -5,938 -5,618 -5,702 -6,148 -6,422 -6,804 -7,158
Oil imports -1,135 -1,393 -1,430 -1,479 -1,570 -1,668 -1,781 -1,872
Food imports -476 -565 -534 -547 -591 -627 -682 -724
For investment in mining 2/ -2,493 -2,627 -1,923 -1,798 -1,874 -1,777 -1,706 -1,679
Other -1,706 -1,353 -1,731 -1,878 -2,113 -2,350 -2,636 -2,883
Services, net -1,161 -1,100 -1,236 -1,089 -1,135 -1,234 -1,306 -1,282
Income, net -843 -948 -956 -1,107 -1,274 -1,332 -1,327 -1,341
Current transfers 244 237 147 145 145 146 148 149
General government 3/ 24 34 22 19 18 18 19 20
Other sectors 220 203 125 126 127 128 129 130
Of which: Workers remittances 58 41 104 104 105 106 106 107
Capital and financial account 2,864 4,929 1,651 2,456 2,174 3,045 2,475 2,558
Capital account 114 120 124 128 132 136 140 144
Financial account 2,750 4,809 1,527 2,328 2,042 2,910 2,335 2,414
Direct investment 4,620 4,408 2,032 1,199 1,437 1,661 1,838 1,990
Portfolio investment 77 2,325 634 764 936 947 1,121 881
Trade credits, net -406 53 21 -42 -54 -61 -60 -70
Currency and deposits, net -2,012 -2,473 -2,286 -1,344 -1,229 -1,224 -1,202 -1,195
Loans, net 469 496 1,273 835 334 986 508 823
Other, net 2 0 -147 915 619 601 129 -15
Errors and omissions 38 -36 0 0 0 0 0 0
Overall balance 144 1,531 -1,820 137 -109 191 223 229
Financing -144 -1,531 1,820 -137 109 -191 -223 -229
Gross official reserves (- increase) -140 -1,497 1,912 -76 112 -191 -223 -229
Use of IMF credit (+) -4 -35 -92 -61 -3 0 0 0
Memoranda items:
Current account balance (in percent of GDP) -31.7 -32.8 -31.6 -20.3 -18.3 -21.5 -15.3 -14.6
Gross official reserves (end-period) 2,630 4,126 2,214 2,290 2,178 2,369 2,592 2,821
(In months of next year's imports of goods and se 3.9 6.5 3.4 3.3 3.0 3.0 3.2 3.2
Copper price (in U.S. dollars per ton) 8,823 7,959 7,185 6,855 6,921 6,975 7,031 7,091
Oil price (in U.S. dollars per barrel) 104 105 102 98 93 90 87 85
Gold price (in U.S. dollars per troy oz.) 1,569 1,669 1,386 1,251 1,267 1,284 1,308 1,336
Nominal GDP (in millions of U.S. dollars) 8,709 10,258 10,982 11,417 12,494 13,286 14,701 15,918
Sources: Mongolian authorities; and IMF staff projections.
1/ Including copper, coal, gold and others.
2/ This covers Oyu Tolgoi copper project and Tavan Tolgoi coal project.
3/ Starting in 2009, investment-related grants have been reclassified in the capital account per BPM5.
Table 6. Mongolia: Balance of Payments, 2011–18 (Strong Policy Scenario)
Projections
MONGOLIA
INTERNATIONAL MONETARY FUND 31
2009 2010 2011 2012 2013 2014 2015 2016 2017 2018
Real sector
Nominal GDP (in billions of togrogs) 6,591 8,415 11,088 13,944 16,691 20,352 23,513 26,258 30,358 34,125
Per capita GDP (in US$) 2/ 1,684 2,261 3,097 3,595 3,791 3,883 4,187 4,386 4,782 5,147
Real GDP growth (percent change) -1.3 6.4 17.5 12.3 11.8 9.6 7.0 5.2 8.5 6.0
Mineral real GDP growth 5.8 3.6 7.3 8.9 16.1 33.4 7.2 -2.1 14.9 1.8
Non-mineral real GDP growth -2.7 7.0 19.7 12.9 11.0 5.0 7.0 7.0 7.0 7.0
GDP deflator (percent change) 1.8 20.0 12.1 12.0 7.4 11.0 8.0 6.2 6.6 6.0
Consumer prices 1.9 14.3 9.4 14.2 11.7 11.0 7.4 6.7 6.6 5.5
(End-period; percent change)
General government accounts
Total revenue and grants 30.3 37.1 40.3 35.7 34.4 32.9 32.9 34.0 34.2 33.5
Mineral revenue 7.8 11.0 9.3 6.0 5.4 5.2 5.2 6.1 6.8 6.7
Non-mineral revenue 22.4 26.1 31.0 29.7 29.0 27.8 27.7 27.9 27.4 26.8
Total expenditure and net lending 35.5 36.6 45.1 46.6 47.9 40.3 36.7 35.7 36.0 35.5
Primary balance -4.7 1.0 -4.4 -10.0 -11.1 -4.6 -0.9 1.2 1.1 0.6
Overall balance -5.2 0.5 -4.8 -10.9 -13.5 -7.4 -3.8 -1.7 -1.8 -2.0
Non-mineral overall balance -13.0 -10.5 -14.0 -16.9 -18.9 -12.6 -9.0 -7.9 -8.6 -8.7
Structural balance … … -6.9 -11.5 -13.7 -7.5 -4.2 -2.0 -2.0 -2.0
Non-mineral revenue and grants 28.2 34.4 39.3 36.7 35.1 35.0 34.8 34.0 33.8 32.6
Total expenditure and net lending 44.0 47.4 57.1 57.2 57.9 50.9 46.1 43.6 44.5 43.1
Non-mineral overall balance -16.2 -13.6 -17.8 -20.7 -22.8 -15.9 -11.3 -9.6 -10.7 -10.6
Monetary sector
Broad money (percent change) 26.9 61.6 37.1 18.8 17.1 28.8
Velocity (GDP/M2) 2.3 1.8 1.7 1.8 1.9 1.8
Balance of payments
Current account balance -9.0 -14.9 -31.7 -32.8 -31.6 -20.3 -18.3 -21.5 -15.3 -14.6
Gross official reserves (in millions of US$) 1,145 2,490 2,630 4,126 2,214 2,290 2,178 2,369 2,592 2,821
(In months of next year's imports of 3.5 3.9 3.9 6.5 3.4 3.3 3.0 3.0 3.2 3.2
goods and services)
Debt indicators
Total public debt 48.5 35.9 38.8 63.0 67.3 65.8 60.4 55.9 52.4 50.1
Domestic public debt 3/ 3.4 5.1 10.9 14.7 15.5 15.1 15.5 16.3 16.2 16.6
External public debt 45.2 30.8 27.9 48.3 51.8 50.7 44.9 39.6 36.2 33.4
(In millions of US$) 2,064 2,061 2,219 4,837 4,988 5,636 5,466 5,145 5,204 5,239
Memorandum items:
Copper prices (US$ per ton) 5,165 7,538 8,823 7,959 7,185 6,855 6,921 6,975 7,031 7,091
Gold prices (US$ per ounce) 973 1,225 1,569 1,669 1,386 1,251 1,267 1,284 1,308 1,336
Sources: Mongolian authorities; and IMF staff projections.
1/ The medium-term projections are based on the assumption that the Fiscal Stability Law will be adhered to starting from 2014.
Table 7. Mongolia: Selected Economic and Financial Indicators, 2009-18 1/ (Strong Policy Scenario)
(In percent of GDP, unless otherwise indicated)
(In percent of non-mineral GDP )
2/ Based on period average exchange rate, and population (end of year).
(In percent of GDP, unless indicated otherwise)
Projections
3/ Includes the expected fiscalization cost of bank restructuring, the financing of the government's equity share in Oyu Tolgoi, and the Oyu Tolgoi
tax prepayment.
MONGOLIA
32 INTERNATIONAL MONETARY FUND
2007 2008 2009 2010 2011 2012
Capital adequacy
Regulatory capital to risk-weighted assets 14.0 11.6 5.5 16.2 15.0 16.1
Regulatory Tier I capital to risk-weighted assets 11.8 8.7 2.3 11.9 11.0 11.6
Total capital (in billions of Mongolian togrogs) 372 342 177 632 950 1,266
Sectoral distribution of lending 2/
Agriculture 7.6 2.6 5.8 4.4 3.0 2.7
Construction 15.6 14.5 14.4 10.8 11.8 11.5
Manufacturing 13.0 14.5 15.5 14.1 11.3 11.5
Mining 6.3 6.4 13.2 12.0 12.0 13.0
Real estate activities 1.7 5.4 7.1 13.6 14.1 14.0
Wholesale and retail trade 29.2 22.7 18.0 18.6 17.0 16.4
Other 26.5 33.8 26.0 26.5 30.8 30.9
Asset quality
Non-performing loans (NPL) to gross loans 3/ 3.2 7.1 20.0 6.7 3.1 2.2
Non-performing loans (NPL), incl. past due loans, to gross loans 4/ 5.3 10.6 24.5 9.7 4.4 3.8
Provisions to NPL 3/ 87.1 75.8 67.4 62.4 69.1 75.2
Provisions to NPL (incl. past due loans) 4/ 53.1 50.9 55.0 43.2 48.2 43.2
NPL net of provisions to capital 3/ 2.4 13.7 99.8 12.5 5.5 2.9
NPL (incl. past due loans) net of provisions to capital 4/ 14.5 41.5 169.0 27.2 13.1 11.5
Earnings and profitability
Return on assets (before tax) 2.5 -1.5 -5.6 1.8 2.9 2.3
Return on equity (before tax) 21.2 -21.2 -131.9 11.2 18.6 15.2
Interest margin to gross income 42.3 11.7 14.6 12.9 11.2 12.2
Non-interest expenses to gross income 46.5 74.2 90.0 72.7 75.1 73.2
Personnel expenses to non-interest expenses 20.4 11.8 9.1 7.2 5.6 6.5
Liquidity
Liquid assets to total assets 28.1 21.8 36.9 44.1 32.1 29.2
Liquid assets to short-term liabilities 27.4 23.9 41.3 53.3 37.6 34.2
Foreign currency loans to total loans 23.0 33.6 38.6 33.7 32.3 32.6
Foreign currency deposits to total deposits 25.4 25.3 34.4 32.4 27.1 29.3
Sources: Mongolian authorities; and IMF staff estimates.
1/ From 2010 onwards, the FSIs exclude Anod, Zoos, and Post Bank.
2/ The sectoral distribution of loans is taken from the quarterly loan report of the Bank of Mongolia, based on a survey.
3/ NPLs according to the new regulation (introduced in 2004), i.e. past due loans are not included.
4/ NPLs according to the old regulation, i.e. past due loans are included.
Table 8. Mongolia: Financial Soundness Indicators of the Banking Sector 1/
MONGOLIA
INTERNATIONAL MONETARY FUND 33
Appendix I. Risk Assessment Matrix */
Source of Risks Likelihood Impacts Recommended Policy Response
Continued fiscal expansion M-H H. Continued fiscal expansion could
intensify overheating pressures,
undermine debt sustainability, and lead
to macroeconomic instability.
Substantial fiscal consolidation is needed to
bring fiscal policy back on track. Specifically,
over time, expenditures should be
reprioritized and reduced, consistent with the
FSL ceilings.
Highly accommodative
monetary policy
M-H H. Loose monetary policy conducted
through non-market based quantitative
easing and quasi-fiscal activity risks
ratcheting up inflation expectation,
distorting financial markets, and delaying
structural reforms required to address
supply-side bottlenecks. Persistent official
foreign exchange sales during the first
half of 2013 caused a rapid decline in
foreign exchange reserves.
The BOM’s programs of monetary easing
(price stabilization program, placement of
12-month term deposits at commercial banks
and mortgage lending program) should be
phased out. Monetary operations should be
conducted mainly through open market
operations. The BOM should continue to limit
foreign exchange interventions to smoothing
operations.
Financial stability risk M-H M-H. The banking sector harbors
significant vulnerabilities arising from
highly concentrated loan portfolios,
inadequate provisioning, substantial
dollarization and high loan-to-deposit
ratios.
Banking supervision and regulation need to
be strengthened in line with FSAP
recommendations. Dollarization needs to be
discouraged and the provisioning regime
strengthened.
Business environment and
political risks
M H. Foreign investors' uncertainty about
the business climate could impede FDI
inflows.
Build on the recent adoption of the new
Investment Law to strengthen the business
climate and stimulate FDI inflows.
Sharp slowdown in growth in
China and/or sustained
decline in commodity prices
M H. Slumping coal prices could cause
closures of some mines. The uncertain
outlook for commodity prices could hold
back FDI inflows in the mining sector.
Policies should be geared toward building
resilience against external shocks and realizing
inclusive growth via diversification of the
economy.
Protracted economic and
financial volatility, especially
for emerging markets
H M. Uncertainty in the global financing
environment could stall foreign financing
to Mongolia, causing delays to major
mining projects and negatively impacting
growth.
Building policy buffers, including prudent
macroeconomic and financial policies, would
help reduce economic volatility caused by
fluctuations of capital flows.
Protracted period of slower
European growth
H M. Weakening global demand could
adversely affect current and capital flows.
Policies should be geared toward building
policy buffers and resilience against external
shocks.
Domestic
External
*/ The Risk Assessment Matrix (RAM) shows events that could materially alter the baseline path (the scenario most likely to materialize in the view
of IMF staff). The relative likelihood of risks listed is the staff's subjective assessment of the risks surrounding the baseline ("low" is meant to
indicate a probability below 10 percent, "medium" a probability between 10 and 30 percent, and "high" a probability of 30 percent or more). The
RAM reflects staff views on the source of risks and overall level of concern as of the time of discussions with the authorities.
03.2014, REPORT, 2013 Article IV staff report for Mongolia, International Monetary Fund

More Related Content

What's hot

Budjet deficit of Bangladesh 2016-17
Budjet deficit of Bangladesh 2016-17Budjet deficit of Bangladesh 2016-17
Budjet deficit of Bangladesh 2016-17Jasfia Khanam Fama
 
External debt, economic growth and investment in nigeria
External debt, economic growth and investment in nigeriaExternal debt, economic growth and investment in nigeria
External debt, economic growth and investment in nigeriaAlexander Decker
 
Economic condition analysis of bangladesh......niloy.....
Economic condition analysis of bangladesh......niloy.....Economic condition analysis of bangladesh......niloy.....
Economic condition analysis of bangladesh......niloy.....Niloy Saha
 
How to pull Pakistan out of heavy debt?
How to pull Pakistan out of heavy debt?How to pull Pakistan out of heavy debt?
How to pull Pakistan out of heavy debt?Zulqarnayn Awan
 
Assignment on Current Economic Conditions
Assignment on Current Economic ConditionsAssignment on Current Economic Conditions
Assignment on Current Economic ConditionsAnurag Verma
 
External debt and economic growth
External debt and economic growthExternal debt and economic growth
External debt and economic growthArshad Ali, PhD
 
China macroeconomy
China macroeconomyChina macroeconomy
China macroeconomygarimayadav7
 
Trends in the main macroeconomics indicators of Bangladesh
  Trends in the main macroeconomics  indicators of Bangladesh  Trends in the main macroeconomics  indicators of Bangladesh
Trends in the main macroeconomics indicators of BangladeshFahad Aziz
 
The overall economic condition of bangladesh
The overall economic condition of bangladeshThe overall economic condition of bangladesh
The overall economic condition of bangladeshTanvir777
 
Comunicado G20, MdeFinanzas, Moscú
Comunicado G20, MdeFinanzas, MoscúComunicado G20, MdeFinanzas, Moscú
Comunicado G20, MdeFinanzas, MoscúManfredNolte
 
Centre for policy dialogue cpd analysis national budget fy2015 16 june 2015
Centre for policy dialogue cpd analysis national budget fy2015 16 june 2015Centre for policy dialogue cpd analysis national budget fy2015 16 june 2015
Centre for policy dialogue cpd analysis national budget fy2015 16 june 2015Centre for Policy Dialogue (CPD)
 
The analysis of the budget for Education sector in Bangladesh
The analysis of the budget for Education sector in BangladeshThe analysis of the budget for Education sector in Bangladesh
The analysis of the budget for Education sector in BangladeshRabiul Alam Hamon
 
2012, REPORT, Transition Report 2011 (Mongolia data), EBRD and the Economic R...
2012, REPORT, Transition Report 2011 (Mongolia data), EBRD and the Economic R...2012, REPORT, Transition Report 2011 (Mongolia data), EBRD and the Economic R...
2012, REPORT, Transition Report 2011 (Mongolia data), EBRD and the Economic R...The Business Council of Mongolia
 
Impact of IMF loan on Pakistan's economy: In long run and short run
Impact of IMF loan on Pakistan's economy: In long run and short runImpact of IMF loan on Pakistan's economy: In long run and short run
Impact of IMF loan on Pakistan's economy: In long run and short runAyesha Majid
 
Major economic indicators of Banladesh in mid 2015
Major economic indicators of Banladesh in mid 2015Major economic indicators of Banladesh in mid 2015
Major economic indicators of Banladesh in mid 2015Zahidul Islam
 
Resource curse, Mining boom, Mongolia
Resource curse, Mining boom, MongoliaResource curse, Mining boom, Mongolia
Resource curse, Mining boom, MongoliaSharkhuu Munkhbat
 
01.2012, REPORT, Managing Mongolia's Resource Boom, Asel Isakova, Alexander P...
01.2012, REPORT, Managing Mongolia's Resource Boom, Asel Isakova, Alexander P...01.2012, REPORT, Managing Mongolia's Resource Boom, Asel Isakova, Alexander P...
01.2012, REPORT, Managing Mongolia's Resource Boom, Asel Isakova, Alexander P...The Business Council of Mongolia
 

What's hot (20)

Budjet deficit of Bangladesh 2016-17
Budjet deficit of Bangladesh 2016-17Budjet deficit of Bangladesh 2016-17
Budjet deficit of Bangladesh 2016-17
 
World Economic Situation and Prospects 2013 - Update as of mid-2013
World Economic Situation and Prospects 2013 - Update as of mid-2013World Economic Situation and Prospects 2013 - Update as of mid-2013
World Economic Situation and Prospects 2013 - Update as of mid-2013
 
External debt, economic growth and investment in nigeria
External debt, economic growth and investment in nigeriaExternal debt, economic growth and investment in nigeria
External debt, economic growth and investment in nigeria
 
Economic condition analysis of bangladesh......niloy.....
Economic condition analysis of bangladesh......niloy.....Economic condition analysis of bangladesh......niloy.....
Economic condition analysis of bangladesh......niloy.....
 
How to pull Pakistan out of heavy debt?
How to pull Pakistan out of heavy debt?How to pull Pakistan out of heavy debt?
How to pull Pakistan out of heavy debt?
 
Assignment on Current Economic Conditions
Assignment on Current Economic ConditionsAssignment on Current Economic Conditions
Assignment on Current Economic Conditions
 
External debt and economic growth
External debt and economic growthExternal debt and economic growth
External debt and economic growth
 
China macroeconomy
China macroeconomyChina macroeconomy
China macroeconomy
 
CPD Budget Proposal FY2016
CPD Budget Proposal FY2016CPD Budget Proposal FY2016
CPD Budget Proposal FY2016
 
Trends in the main macroeconomics indicators of Bangladesh
  Trends in the main macroeconomics  indicators of Bangladesh  Trends in the main macroeconomics  indicators of Bangladesh
Trends in the main macroeconomics indicators of Bangladesh
 
The overall economic condition of bangladesh
The overall economic condition of bangladeshThe overall economic condition of bangladesh
The overall economic condition of bangladesh
 
Comunicado G20, MdeFinanzas, Moscú
Comunicado G20, MdeFinanzas, MoscúComunicado G20, MdeFinanzas, Moscú
Comunicado G20, MdeFinanzas, Moscú
 
Centre for policy dialogue cpd analysis national budget fy2015 16 june 2015
Centre for policy dialogue cpd analysis national budget fy2015 16 june 2015Centre for policy dialogue cpd analysis national budget fy2015 16 june 2015
Centre for policy dialogue cpd analysis national budget fy2015 16 june 2015
 
The analysis of the budget for Education sector in Bangladesh
The analysis of the budget for Education sector in BangladeshThe analysis of the budget for Education sector in Bangladesh
The analysis of the budget for Education sector in Bangladesh
 
Weekly Market Review - January 03, 2014
Weekly Market Review - January 03, 2014Weekly Market Review - January 03, 2014
Weekly Market Review - January 03, 2014
 
2012, REPORT, Transition Report 2011 (Mongolia data), EBRD and the Economic R...
2012, REPORT, Transition Report 2011 (Mongolia data), EBRD and the Economic R...2012, REPORT, Transition Report 2011 (Mongolia data), EBRD and the Economic R...
2012, REPORT, Transition Report 2011 (Mongolia data), EBRD and the Economic R...
 
Impact of IMF loan on Pakistan's economy: In long run and short run
Impact of IMF loan on Pakistan's economy: In long run and short runImpact of IMF loan on Pakistan's economy: In long run and short run
Impact of IMF loan on Pakistan's economy: In long run and short run
 
Major economic indicators of Banladesh in mid 2015
Major economic indicators of Banladesh in mid 2015Major economic indicators of Banladesh in mid 2015
Major economic indicators of Banladesh in mid 2015
 
Resource curse, Mining boom, Mongolia
Resource curse, Mining boom, MongoliaResource curse, Mining boom, Mongolia
Resource curse, Mining boom, Mongolia
 
01.2012, REPORT, Managing Mongolia's Resource Boom, Asel Isakova, Alexander P...
01.2012, REPORT, Managing Mongolia's Resource Boom, Asel Isakova, Alexander P...01.2012, REPORT, Managing Mongolia's Resource Boom, Asel Isakova, Alexander P...
01.2012, REPORT, Managing Mongolia's Resource Boom, Asel Isakova, Alexander P...
 

Viewers also liked

14.10.2010 Company showcase Bulgan Alt Group, Erdenebilguun Gan-Och
14.10.2010 Company showcase Bulgan Alt Group, Erdenebilguun Gan-Och14.10.2010 Company showcase Bulgan Alt Group, Erdenebilguun Gan-Och
14.10.2010 Company showcase Bulgan Alt Group, Erdenebilguun Gan-OchThe Business Council of Mongolia
 
19.06.2013 Impact of regional developments on Mongolia’s coal market, Matthew...
19.06.2013 Impact of regional developments on Mongolia’s coal market, Matthew...19.06.2013 Impact of regional developments on Mongolia’s coal market, Matthew...
19.06.2013 Impact of regional developments on Mongolia’s coal market, Matthew...The Business Council of Mongolia
 
30.10.2012 Erdenes Tavan Tolgoi – a world class coking coal project going to ...
30.10.2012 Erdenes Tavan Tolgoi – a world class coking coal project going to ...30.10.2012 Erdenes Tavan Tolgoi – a world class coking coal project going to ...
30.10.2012 Erdenes Tavan Tolgoi – a world class coking coal project going to ...The Business Council of Mongolia
 
11.08.2010 What investors in Mongolia need to know, Mr. Jim Dwyer
11.08.2010 What investors in Mongolia need to know, Mr. Jim Dwyer11.08.2010 What investors in Mongolia need to know, Mr. Jim Dwyer
11.08.2010 What investors in Mongolia need to know, Mr. Jim DwyerThe Business Council of Mongolia
 
08.09.2011 Update on Oyu Tolgoi Project, Mr. Cameron McRae
08.09.2011 Update on Oyu Tolgoi Project, Mr. Cameron McRae08.09.2011 Update on Oyu Tolgoi Project, Mr. Cameron McRae
08.09.2011 Update on Oyu Tolgoi Project, Mr. Cameron McRaeThe Business Council of Mongolia
 
22.03.2011 Introducing key project opportunities in the Mongolian mining sect...
22.03.2011 Introducing key project opportunities in the Mongolian mining sect...22.03.2011 Introducing key project opportunities in the Mongolian mining sect...
22.03.2011 Introducing key project opportunities in the Mongolian mining sect...The Business Council of Mongolia
 
04.09.2014, Banking and Mining Sector, Mr. Amarbayasgalan.E
04.09.2014, Banking and Mining Sector, Mr. Amarbayasgalan.E04.09.2014, Banking and Mining Sector, Mr. Amarbayasgalan.E
04.09.2014, Banking and Mining Sector, Mr. Amarbayasgalan.EThe Business Council of Mongolia
 
30.10.2012 Frontier enterprising GE's experience with building business in Mo...
30.10.2012 Frontier enterprising GE's experience with building business in Mo...30.10.2012 Frontier enterprising GE's experience with building business in Mo...
30.10.2012 Frontier enterprising GE's experience with building business in Mo...The Business Council of Mongolia
 
28.03.2014, Lessons learnt from japan and the first steps for applying it in...
 28.03.2014, Lessons learnt from japan and the first steps for applying it in... 28.03.2014, Lessons learnt from japan and the first steps for applying it in...
28.03.2014, Lessons learnt from japan and the first steps for applying it in...The Business Council of Mongolia
 
23.05.2012, PRESENTATION, Russian coking coal developments and leading Mongol...
23.05.2012, PRESENTATION, Russian coking coal developments and leading Mongol...23.05.2012, PRESENTATION, Russian coking coal developments and leading Mongol...
23.05.2012, PRESENTATION, Russian coking coal developments and leading Mongol...The Business Council of Mongolia
 
2012.05.23 Азийг ирээдүйд эрчим хүчээр хангах нь, Жон Лий
2012.05.23 Азийг ирээдүйд эрчим хүчээр хангах нь, Жон Лий2012.05.23 Азийг ирээдүйд эрчим хүчээр хангах нь, Жон Лий
2012.05.23 Азийг ирээдүйд эрчим хүчээр хангах нь, Жон ЛийThe Business Council of Mongolia
 
2012, PRESENTATION, Bronze fox copper gold project, Abdullo Kurbanov
2012, PRESENTATION, Bronze fox copper gold project, Abdullo Kurbanov2012, PRESENTATION, Bronze fox copper gold project, Abdullo Kurbanov
2012, PRESENTATION, Bronze fox copper gold project, Abdullo KurbanovThe Business Council of Mongolia
 

Viewers also liked (20)

14.10.2010 Company showcase Bulgan Alt Group, Erdenebilguun Gan-Och
14.10.2010 Company showcase Bulgan Alt Group, Erdenebilguun Gan-Och14.10.2010 Company showcase Bulgan Alt Group, Erdenebilguun Gan-Och
14.10.2010 Company showcase Bulgan Alt Group, Erdenebilguun Gan-Och
 
19.06.2013 Impact of regional developments on Mongolia’s coal market, Matthew...
19.06.2013 Impact of regional developments on Mongolia’s coal market, Matthew...19.06.2013 Impact of regional developments on Mongolia’s coal market, Matthew...
19.06.2013 Impact of regional developments on Mongolia’s coal market, Matthew...
 
09.01.2009, NEWSWIRE, Issue 52
09.01.2009, NEWSWIRE, Issue 5209.01.2009, NEWSWIRE, Issue 52
09.01.2009, NEWSWIRE, Issue 52
 
30.10.2012 Erdenes Tavan Tolgoi – a world class coking coal project going to ...
30.10.2012 Erdenes Tavan Tolgoi – a world class coking coal project going to ...30.10.2012 Erdenes Tavan Tolgoi – a world class coking coal project going to ...
30.10.2012 Erdenes Tavan Tolgoi – a world class coking coal project going to ...
 
28.07.2010 Khushuut Coal Project Update, Dennis Price
28.07.2010 Khushuut Coal Project Update, Dennis Price28.07.2010 Khushuut Coal Project Update, Dennis Price
28.07.2010 Khushuut Coal Project Update, Dennis Price
 
13.05.2011, NEWSWIRE, Issue 167
13.05.2011, NEWSWIRE, Issue 16713.05.2011, NEWSWIRE, Issue 167
13.05.2011, NEWSWIRE, Issue 167
 
11.08.2010 What investors in Mongolia need to know, Mr. Jim Dwyer
11.08.2010 What investors in Mongolia need to know, Mr. Jim Dwyer11.08.2010 What investors in Mongolia need to know, Mr. Jim Dwyer
11.08.2010 What investors in Mongolia need to know, Mr. Jim Dwyer
 
16.10.2014, Global CEO Survey 2014, Matthew Pottle
16.10.2014, Global CEO Survey 2014,  Matthew Pottle16.10.2014, Global CEO Survey 2014,  Matthew Pottle
16.10.2014, Global CEO Survey 2014, Matthew Pottle
 
08.09.2011 Update on Oyu Tolgoi Project, Mr. Cameron McRae
08.09.2011 Update on Oyu Tolgoi Project, Mr. Cameron McRae08.09.2011 Update on Oyu Tolgoi Project, Mr. Cameron McRae
08.09.2011 Update on Oyu Tolgoi Project, Mr. Cameron McRae
 
22.03.2011 Introducing key project opportunities in the Mongolian mining sect...
22.03.2011 Introducing key project opportunities in the Mongolian mining sect...22.03.2011 Introducing key project opportunities in the Mongolian mining sect...
22.03.2011 Introducing key project opportunities in the Mongolian mining sect...
 
31.10.2013 Ovoot coking coal project, David Paull
31.10.2013 Ovoot coking coal project, David Paull31.10.2013 Ovoot coking coal project, David Paull
31.10.2013 Ovoot coking coal project, David Paull
 
04.09.2014, Banking and Mining Sector, Mr. Amarbayasgalan.E
04.09.2014, Banking and Mining Sector, Mr. Amarbayasgalan.E04.09.2014, Banking and Mining Sector, Mr. Amarbayasgalan.E
04.09.2014, Banking and Mining Sector, Mr. Amarbayasgalan.E
 
30.10.2012 Frontier enterprising GE's experience with building business in Mo...
30.10.2012 Frontier enterprising GE's experience with building business in Mo...30.10.2012 Frontier enterprising GE's experience with building business in Mo...
30.10.2012 Frontier enterprising GE's experience with building business in Mo...
 
28.03.2014, Lessons learnt from japan and the first steps for applying it in...
 28.03.2014, Lessons learnt from japan and the first steps for applying it in... 28.03.2014, Lessons learnt from japan and the first steps for applying it in...
28.03.2014, Lessons learnt from japan and the first steps for applying it in...
 
23.05.2012, PRESENTATION, Russian coking coal developments and leading Mongol...
23.05.2012, PRESENTATION, Russian coking coal developments and leading Mongol...23.05.2012, PRESENTATION, Russian coking coal developments and leading Mongol...
23.05.2012, PRESENTATION, Russian coking coal developments and leading Mongol...
 
24.05.2013 low of mongolia on the securities market
24.05.2013 low of mongolia on the securities market24.05.2013 low of mongolia on the securities market
24.05.2013 low of mongolia on the securities market
 
2012.05.23 Азийг ирээдүйд эрчим хүчээр хангах нь, Жон Лий
2012.05.23 Азийг ирээдүйд эрчим хүчээр хангах нь, Жон Лий2012.05.23 Азийг ирээдүйд эрчим хүчээр хангах нь, Жон Лий
2012.05.23 Азийг ирээдүйд эрчим хүчээр хангах нь, Жон Лий
 
2012, PRESENTATION, Bronze fox copper gold project, Abdullo Kurbanov
2012, PRESENTATION, Bronze fox copper gold project, Abdullo Kurbanov2012, PRESENTATION, Bronze fox copper gold project, Abdullo Kurbanov
2012, PRESENTATION, Bronze fox copper gold project, Abdullo Kurbanov
 
21.04.2016 usukhbayar (mandal insurance)
21.04.2016 usukhbayar (mandal insurance)21.04.2016 usukhbayar (mandal insurance)
21.04.2016 usukhbayar (mandal insurance)
 
Risk forum 2016 Introduction & Agenda
Risk forum 2016 Introduction & AgendaRisk forum 2016 Introduction & Agenda
Risk forum 2016 Introduction & Agenda
 

Similar to 03.2014, REPORT, 2013 Article IV staff report for Mongolia, International Monetary Fund

Monthly Business Review - March 2013
Monthly Business Review - March 2013Monthly Business Review - March 2013
Monthly Business Review - March 2013Mehedi Hasan
 
03.2010, REPORT, Mongolia Monthly Economic Update, World Bank
03.2010, REPORT, Mongolia Monthly Economic Update, World Bank03.2010, REPORT, Mongolia Monthly Economic Update, World Bank
03.2010, REPORT, Mongolia Monthly Economic Update, World BankThe Business Council of Mongolia
 
12.10.2012, PRESENTATION, Outlook for the Mongolian Economy, Jan Hansen
12.10.2012, PRESENTATION, Outlook for the Mongolian Economy, Jan Hansen12.10.2012, PRESENTATION, Outlook for the Mongolian Economy, Jan Hansen
12.10.2012, PRESENTATION, Outlook for the Mongolian Economy, Jan HansenThe Business Council of Mongolia
 
10.12.2012, ADB: Outlook for the Mongolian Economy, Jan Hansen and Enerelt En...
10.12.2012, ADB: Outlook for the Mongolian Economy, Jan Hansen and Enerelt En...10.12.2012, ADB: Outlook for the Mongolian Economy, Jan Hansen and Enerelt En...
10.12.2012, ADB: Outlook for the Mongolian Economy, Jan Hansen and Enerelt En...The Business Council of Mongolia
 
07.2013, REPORT, Selected Macroeconomic Indicators for Mongolia, Internationa...
07.2013, REPORT, Selected Macroeconomic Indicators for Mongolia, Internationa...07.2013, REPORT, Selected Macroeconomic Indicators for Mongolia, Internationa...
07.2013, REPORT, Selected Macroeconomic Indicators for Mongolia, Internationa...The Business Council of Mongolia
 
Current State of the Indian EconomyCautious optimism for the.docx
Current State of the Indian EconomyCautious optimism for the.docxCurrent State of the Indian EconomyCautious optimism for the.docx
Current State of the Indian EconomyCautious optimism for the.docxfaithxdunce63732
 
State of economy 2013
State of economy 2013State of economy 2013
State of economy 2013Nikhil Jain
 
The Republic of the Philippines - Good Governance is Good Economics
The Republic of the Philippines - Good Governance is Good EconomicsThe Republic of the Philippines - Good Governance is Good Economics
The Republic of the Philippines - Good Governance is Good EconomicsWesley Ong
 
Cambodia's outlook brief for 2013 possibilities and policy priorities for s...
Cambodia's outlook brief for 2013   possibilities and policy priorities for s...Cambodia's outlook brief for 2013   possibilities and policy priorities for s...
Cambodia's outlook brief for 2013 possibilities and policy priorities for s...Solina Yean
 
Etude PwC sur les opérations de fusions et acquisitions dans le secteur banca...
Etude PwC sur les opérations de fusions et acquisitions dans le secteur banca...Etude PwC sur les opérations de fusions et acquisitions dans le secteur banca...
Etude PwC sur les opérations de fusions et acquisitions dans le secteur banca...PwC France
 
Protifolon Issue 1: Impact of global financial crisis on the economy of Bangl...
Protifolon Issue 1: Impact of global financial crisis on the economy of Bangl...Protifolon Issue 1: Impact of global financial crisis on the economy of Bangl...
Protifolon Issue 1: Impact of global financial crisis on the economy of Bangl...Md Masum Billah
 
Final stability report2014
Final stability report2014Final stability report2014
Final stability report2014MehediHasan885
 
2012. REPORT, Risk report for Mongolia 2012, Mongolia Economic Forum
2012. REPORT, Risk report for Mongolia 2012, Mongolia Economic Forum2012. REPORT, Risk report for Mongolia 2012, Mongolia Economic Forum
2012. REPORT, Risk report for Mongolia 2012, Mongolia Economic ForumThe Business Council of Mongolia
 
Change in monetary policy last 5 years in Bangladesh
Change in monetary policy last 5 years in Bangladesh Change in monetary policy last 5 years in Bangladesh
Change in monetary policy last 5 years in Bangladesh Ifte Tanim
 
Article 4 for BD by IMF.pdf
Article 4 for BD by IMF.pdfArticle 4 for BD by IMF.pdf
Article 4 for BD by IMF.pdfMohammadUllahSAS
 
A Study on Mumbai Circle_Research Project Paper
A Study on Mumbai Circle_Research Project PaperA Study on Mumbai Circle_Research Project Paper
A Study on Mumbai Circle_Research Project PaperJayant Rao
 

Similar to 03.2014, REPORT, 2013 Article IV staff report for Mongolia, International Monetary Fund (20)

Monthly Business Review - March 2013
Monthly Business Review - March 2013Monthly Business Review - March 2013
Monthly Business Review - March 2013
 
Fmi españa
Fmi españaFmi españa
Fmi españa
 
03.2010, REPORT, Mongolia Monthly Economic Update, World Bank
03.2010, REPORT, Mongolia Monthly Economic Update, World Bank03.2010, REPORT, Mongolia Monthly Economic Update, World Bank
03.2010, REPORT, Mongolia Monthly Economic Update, World Bank
 
12.10.2012, PRESENTATION, Outlook for the Mongolian Economy, Jan Hansen
12.10.2012, PRESENTATION, Outlook for the Mongolian Economy, Jan Hansen12.10.2012, PRESENTATION, Outlook for the Mongolian Economy, Jan Hansen
12.10.2012, PRESENTATION, Outlook for the Mongolian Economy, Jan Hansen
 
10.12.2012, ADB: Outlook for the Mongolian Economy, Jan Hansen and Enerelt En...
10.12.2012, ADB: Outlook for the Mongolian Economy, Jan Hansen and Enerelt En...10.12.2012, ADB: Outlook for the Mongolian Economy, Jan Hansen and Enerelt En...
10.12.2012, ADB: Outlook for the Mongolian Economy, Jan Hansen and Enerelt En...
 
07.2013, REPORT, Selected Macroeconomic Indicators for Mongolia, Internationa...
07.2013, REPORT, Selected Macroeconomic Indicators for Mongolia, Internationa...07.2013, REPORT, Selected Macroeconomic Indicators for Mongolia, Internationa...
07.2013, REPORT, Selected Macroeconomic Indicators for Mongolia, Internationa...
 
Current State of the Indian EconomyCautious optimism for the.docx
Current State of the Indian EconomyCautious optimism for the.docxCurrent State of the Indian EconomyCautious optimism for the.docx
Current State of the Indian EconomyCautious optimism for the.docx
 
State of economy 2013
State of economy 2013State of economy 2013
State of economy 2013
 
The Republic of the Philippines - Good Governance is Good Economics
The Republic of the Philippines - Good Governance is Good EconomicsThe Republic of the Philippines - Good Governance is Good Economics
The Republic of the Philippines - Good Governance is Good Economics
 
Cambodia's outlook brief for 2013 possibilities and policy priorities for s...
Cambodia's outlook brief for 2013   possibilities and policy priorities for s...Cambodia's outlook brief for 2013   possibilities and policy priorities for s...
Cambodia's outlook brief for 2013 possibilities and policy priorities for s...
 
Etude PwC sur les opérations de fusions et acquisitions dans le secteur banca...
Etude PwC sur les opérations de fusions et acquisitions dans le secteur banca...Etude PwC sur les opérations de fusions et acquisitions dans le secteur banca...
Etude PwC sur les opérations de fusions et acquisitions dans le secteur banca...
 
Follow-up to and implementation of the Monterrey Consensus and Doha Declarati...
Follow-up to and implementation of the Monterrey Consensus and Doha Declarati...Follow-up to and implementation of the Monterrey Consensus and Doha Declarati...
Follow-up to and implementation of the Monterrey Consensus and Doha Declarati...
 
Protifolon Issue 1: Impact of global financial crisis on the economy of Bangl...
Protifolon Issue 1: Impact of global financial crisis on the economy of Bangl...Protifolon Issue 1: Impact of global financial crisis on the economy of Bangl...
Protifolon Issue 1: Impact of global financial crisis on the economy of Bangl...
 
Final stability report2014
Final stability report2014Final stability report2014
Final stability report2014
 
2012. REPORT, Risk report for Mongolia 2012, Mongolia Economic Forum
2012. REPORT, Risk report for Mongolia 2012, Mongolia Economic Forum2012. REPORT, Risk report for Mongolia 2012, Mongolia Economic Forum
2012. REPORT, Risk report for Mongolia 2012, Mongolia Economic Forum
 
Change in monetary policy last 5 years in Bangladesh
Change in monetary policy last 5 years in Bangladesh Change in monetary policy last 5 years in Bangladesh
Change in monetary policy last 5 years in Bangladesh
 
IMF Staff Report 2016 - Zimbabwe Dollar - Article 4
IMF Staff Report 2016 - Zimbabwe Dollar - Article 4IMF Staff Report 2016 - Zimbabwe Dollar - Article 4
IMF Staff Report 2016 - Zimbabwe Dollar - Article 4
 
Article 4 for BD by IMF.pdf
Article 4 for BD by IMF.pdfArticle 4 for BD by IMF.pdf
Article 4 for BD by IMF.pdf
 
21.04.2016 cameron (founding president of ins)
21.04.2016 cameron (founding president of ins)21.04.2016 cameron (founding president of ins)
21.04.2016 cameron (founding president of ins)
 
A Study on Mumbai Circle_Research Project Paper
A Study on Mumbai Circle_Research Project PaperA Study on Mumbai Circle_Research Project Paper
A Study on Mumbai Circle_Research Project Paper
 

More from The Business Council of Mongolia

N. Chimguundari economic corridor and investment research center Nov 12
N. Chimguundari economic corridor and investment research center Nov 12N. Chimguundari economic corridor and investment research center Nov 12
N. Chimguundari economic corridor and investment research center Nov 12The Business Council of Mongolia
 

More from The Business Council of Mongolia (20)

Three Camel Lodge 3 days itinerary
Three Camel Lodge 3 days itineraryThree Camel Lodge 3 days itinerary
Three Camel Lodge 3 days itinerary
 
Three Camel Lodge 4 days itinerary
Three Camel Lodge 4 days itineraryThree Camel Lodge 4 days itinerary
Three Camel Lodge 4 days itinerary
 
BCM Macroeconomic Updates January 2020
BCM Macroeconomic Updates January 2020BCM Macroeconomic Updates January 2020
BCM Macroeconomic Updates January 2020
 
Digital Enterprise 2019
Digital Enterprise 2019Digital Enterprise 2019
Digital Enterprise 2019
 
Faro Foundation presentation
Faro Foundation presentationFaro Foundation presentation
Faro Foundation presentation
 
Business Council of Mongolia presentation
Business Council of Mongolia presentationBusiness Council of Mongolia presentation
Business Council of Mongolia presentation
 
National Development Association of Mongolia presentation
National Development Association of Mongolia presentationNational Development Association of Mongolia presentation
National Development Association of Mongolia presentation
 
Gobi Green Energy Gankhuyag
Gobi Green Energy GankhuyagGobi Green Energy Gankhuyag
Gobi Green Energy Gankhuyag
 
Ch.Anar Competitiveness of the fintech sector
Ch.Anar Competitiveness of the fintech sectorCh.Anar Competitiveness of the fintech sector
Ch.Anar Competitiveness of the fintech sector
 
A.Bilguun Competitiveness of Mongolia's resource sector
A.Bilguun Competitiveness of Mongolia's resource sectorA.Bilguun Competitiveness of Mongolia's resource sector
A.Bilguun Competitiveness of Mongolia's resource sector
 
B.Lakshmi EPCRC Competitiveness of Mongolia
B.Lakshmi EPCRC Competitiveness of MongoliaB.Lakshmi EPCRC Competitiveness of Mongolia
B.Lakshmi EPCRC Competitiveness of Mongolia
 
Munkhzorig - Digital Transformation
Munkhzorig - Digital TransformationMunkhzorig - Digital Transformation
Munkhzorig - Digital Transformation
 
Tseesuren - Data is the Key for Innovation
Tseesuren - Data is the Key for InnovationTseesuren - Data is the Key for Innovation
Tseesuren - Data is the Key for Innovation
 
System analysis study on the Constitution of Mongolia
System analysis study on the Constitution of MongoliaSystem analysis study on the Constitution of Mongolia
System analysis study on the Constitution of Mongolia
 
Kincora Copper March 2019
Kincora Copper March 2019Kincora Copper March 2019
Kincora Copper March 2019
 
Erdenes Mongol presentation
Erdenes Mongol presentationErdenes Mongol presentation
Erdenes Mongol presentation
 
Tatsuya Hamada presentation
Tatsuya Hamada presentationTatsuya Hamada presentation
Tatsuya Hamada presentation
 
BCM Monthly Meeting BCM updates January 30, 2019
BCM Monthly Meeting BCM updates January 30, 2019BCM Monthly Meeting BCM updates January 30, 2019
BCM Monthly Meeting BCM updates January 30, 2019
 
N. Chimguundari economic corridor and investment research center Nov 12
N. Chimguundari economic corridor and investment research center Nov 12N. Chimguundari economic corridor and investment research center Nov 12
N. Chimguundari economic corridor and investment research center Nov 12
 
Procurement mca-compact-ii-presentation-bcm
Procurement mca-compact-ii-presentation-bcmProcurement mca-compact-ii-presentation-bcm
Procurement mca-compact-ii-presentation-bcm
 

Recently uploaded

Call Girls in DELHI Cantt, ( Call Me )-8377877756-Female Escort- In Delhi / Ncr
Call Girls in DELHI Cantt, ( Call Me )-8377877756-Female Escort- In Delhi / NcrCall Girls in DELHI Cantt, ( Call Me )-8377877756-Female Escort- In Delhi / Ncr
Call Girls in DELHI Cantt, ( Call Me )-8377877756-Female Escort- In Delhi / Ncrdollysharma2066
 
Banana Powder Manufacturing Plant Project Report 2024 Edition.pptx
Banana Powder Manufacturing Plant Project Report 2024 Edition.pptxBanana Powder Manufacturing Plant Project Report 2024 Edition.pptx
Banana Powder Manufacturing Plant Project Report 2024 Edition.pptxgeorgebrinton95
 
Intro to BCG's Carbon Emissions Benchmark_vF.pdf
Intro to BCG's Carbon Emissions Benchmark_vF.pdfIntro to BCG's Carbon Emissions Benchmark_vF.pdf
Intro to BCG's Carbon Emissions Benchmark_vF.pdfpollardmorgan
 
Marketing Management Business Plan_My Sweet Creations
Marketing Management Business Plan_My Sweet CreationsMarketing Management Business Plan_My Sweet Creations
Marketing Management Business Plan_My Sweet Creationsnakalysalcedo61
 
(8264348440) 🔝 Call Girls In Hauz Khas 🔝 Delhi NCR
(8264348440) 🔝 Call Girls In Hauz Khas 🔝 Delhi NCR(8264348440) 🔝 Call Girls In Hauz Khas 🔝 Delhi NCR
(8264348440) 🔝 Call Girls In Hauz Khas 🔝 Delhi NCRsoniya singh
 
RE Capital's Visionary Leadership under Newman Leech
RE Capital's Visionary Leadership under Newman LeechRE Capital's Visionary Leadership under Newman Leech
RE Capital's Visionary Leadership under Newman LeechNewman George Leech
 
Islamabad Escorts | Call 03274100048 | Escort Service in Islamabad
Islamabad Escorts | Call 03274100048 | Escort Service in IslamabadIslamabad Escorts | Call 03274100048 | Escort Service in Islamabad
Islamabad Escorts | Call 03274100048 | Escort Service in IslamabadAyesha Khan
 
Investment analysis and portfolio management
Investment analysis and portfolio managementInvestment analysis and portfolio management
Investment analysis and portfolio managementJunaidKhan750825
 
BEST Call Girls In Old Faridabad ✨ 9773824855 ✨ Escorts Service In Delhi Ncr,
BEST Call Girls In Old Faridabad ✨ 9773824855 ✨ Escorts Service In Delhi Ncr,BEST Call Girls In Old Faridabad ✨ 9773824855 ✨ Escorts Service In Delhi Ncr,
BEST Call Girls In Old Faridabad ✨ 9773824855 ✨ Escorts Service In Delhi Ncr,noida100girls
 
Call Girls In ⇛⇛Chhatarpur⇚⇚. Brings Offer Delhi Contact Us 8377877756
Call Girls In ⇛⇛Chhatarpur⇚⇚. Brings Offer Delhi Contact Us 8377877756Call Girls In ⇛⇛Chhatarpur⇚⇚. Brings Offer Delhi Contact Us 8377877756
Call Girls In ⇛⇛Chhatarpur⇚⇚. Brings Offer Delhi Contact Us 8377877756dollysharma2066
 
Call Girls in Mehrauli Delhi 💯Call Us 🔝8264348440🔝
Call Girls in Mehrauli Delhi 💯Call Us 🔝8264348440🔝Call Girls in Mehrauli Delhi 💯Call Us 🔝8264348440🔝
Call Girls in Mehrauli Delhi 💯Call Us 🔝8264348440🔝soniya singh
 
Catalogue ONG NƯỚC uPVC - HDPE DE NHAT.pdf
Catalogue ONG NƯỚC uPVC - HDPE DE NHAT.pdfCatalogue ONG NƯỚC uPVC - HDPE DE NHAT.pdf
Catalogue ONG NƯỚC uPVC - HDPE DE NHAT.pdfOrient Homes
 
Call Girls In Radisson Blu Hotel New Delhi Paschim Vihar ❤️8860477959 Escorts...
Call Girls In Radisson Blu Hotel New Delhi Paschim Vihar ❤️8860477959 Escorts...Call Girls In Radisson Blu Hotel New Delhi Paschim Vihar ❤️8860477959 Escorts...
Call Girls In Radisson Blu Hotel New Delhi Paschim Vihar ❤️8860477959 Escorts...lizamodels9
 
Tech Startup Growth Hacking 101 - Basics on Growth Marketing
Tech Startup Growth Hacking 101  - Basics on Growth MarketingTech Startup Growth Hacking 101  - Basics on Growth Marketing
Tech Startup Growth Hacking 101 - Basics on Growth MarketingShawn Pang
 
NewBase 22 April 2024 Energy News issue - 1718 by Khaled Al Awadi (AutoRe...
NewBase  22 April  2024  Energy News issue - 1718 by Khaled Al Awadi  (AutoRe...NewBase  22 April  2024  Energy News issue - 1718 by Khaled Al Awadi  (AutoRe...
NewBase 22 April 2024 Energy News issue - 1718 by Khaled Al Awadi (AutoRe...Khaled Al Awadi
 
Case study on tata clothing brand zudio in detail
Case study on tata clothing brand zudio in detailCase study on tata clothing brand zudio in detail
Case study on tata clothing brand zudio in detailAriel592675
 
(8264348440) 🔝 Call Girls In Keshav Puram 🔝 Delhi NCR
(8264348440) 🔝 Call Girls In Keshav Puram 🔝 Delhi NCR(8264348440) 🔝 Call Girls In Keshav Puram 🔝 Delhi NCR
(8264348440) 🔝 Call Girls In Keshav Puram 🔝 Delhi NCRsoniya singh
 
A.I. Bot Summit 3 Opening Keynote - Perry Belcher
A.I. Bot Summit 3 Opening Keynote - Perry BelcherA.I. Bot Summit 3 Opening Keynote - Perry Belcher
A.I. Bot Summit 3 Opening Keynote - Perry BelcherPerry Belcher
 
Vip Female Escorts Noida 9711199171 Greater Noida Escorts Service
Vip Female Escorts Noida 9711199171 Greater Noida Escorts ServiceVip Female Escorts Noida 9711199171 Greater Noida Escorts Service
Vip Female Escorts Noida 9711199171 Greater Noida Escorts Serviceankitnayak356677
 
Call Girls Miyapur 7001305949 all area service COD available Any Time
Call Girls Miyapur 7001305949 all area service COD available Any TimeCall Girls Miyapur 7001305949 all area service COD available Any Time
Call Girls Miyapur 7001305949 all area service COD available Any Timedelhimodelshub1
 

Recently uploaded (20)

Call Girls in DELHI Cantt, ( Call Me )-8377877756-Female Escort- In Delhi / Ncr
Call Girls in DELHI Cantt, ( Call Me )-8377877756-Female Escort- In Delhi / NcrCall Girls in DELHI Cantt, ( Call Me )-8377877756-Female Escort- In Delhi / Ncr
Call Girls in DELHI Cantt, ( Call Me )-8377877756-Female Escort- In Delhi / Ncr
 
Banana Powder Manufacturing Plant Project Report 2024 Edition.pptx
Banana Powder Manufacturing Plant Project Report 2024 Edition.pptxBanana Powder Manufacturing Plant Project Report 2024 Edition.pptx
Banana Powder Manufacturing Plant Project Report 2024 Edition.pptx
 
Intro to BCG's Carbon Emissions Benchmark_vF.pdf
Intro to BCG's Carbon Emissions Benchmark_vF.pdfIntro to BCG's Carbon Emissions Benchmark_vF.pdf
Intro to BCG's Carbon Emissions Benchmark_vF.pdf
 
Marketing Management Business Plan_My Sweet Creations
Marketing Management Business Plan_My Sweet CreationsMarketing Management Business Plan_My Sweet Creations
Marketing Management Business Plan_My Sweet Creations
 
(8264348440) 🔝 Call Girls In Hauz Khas 🔝 Delhi NCR
(8264348440) 🔝 Call Girls In Hauz Khas 🔝 Delhi NCR(8264348440) 🔝 Call Girls In Hauz Khas 🔝 Delhi NCR
(8264348440) 🔝 Call Girls In Hauz Khas 🔝 Delhi NCR
 
RE Capital's Visionary Leadership under Newman Leech
RE Capital's Visionary Leadership under Newman LeechRE Capital's Visionary Leadership under Newman Leech
RE Capital's Visionary Leadership under Newman Leech
 
Islamabad Escorts | Call 03274100048 | Escort Service in Islamabad
Islamabad Escorts | Call 03274100048 | Escort Service in IslamabadIslamabad Escorts | Call 03274100048 | Escort Service in Islamabad
Islamabad Escorts | Call 03274100048 | Escort Service in Islamabad
 
Investment analysis and portfolio management
Investment analysis and portfolio managementInvestment analysis and portfolio management
Investment analysis and portfolio management
 
BEST Call Girls In Old Faridabad ✨ 9773824855 ✨ Escorts Service In Delhi Ncr,
BEST Call Girls In Old Faridabad ✨ 9773824855 ✨ Escorts Service In Delhi Ncr,BEST Call Girls In Old Faridabad ✨ 9773824855 ✨ Escorts Service In Delhi Ncr,
BEST Call Girls In Old Faridabad ✨ 9773824855 ✨ Escorts Service In Delhi Ncr,
 
Call Girls In ⇛⇛Chhatarpur⇚⇚. Brings Offer Delhi Contact Us 8377877756
Call Girls In ⇛⇛Chhatarpur⇚⇚. Brings Offer Delhi Contact Us 8377877756Call Girls In ⇛⇛Chhatarpur⇚⇚. Brings Offer Delhi Contact Us 8377877756
Call Girls In ⇛⇛Chhatarpur⇚⇚. Brings Offer Delhi Contact Us 8377877756
 
Call Girls in Mehrauli Delhi 💯Call Us 🔝8264348440🔝
Call Girls in Mehrauli Delhi 💯Call Us 🔝8264348440🔝Call Girls in Mehrauli Delhi 💯Call Us 🔝8264348440🔝
Call Girls in Mehrauli Delhi 💯Call Us 🔝8264348440🔝
 
Catalogue ONG NƯỚC uPVC - HDPE DE NHAT.pdf
Catalogue ONG NƯỚC uPVC - HDPE DE NHAT.pdfCatalogue ONG NƯỚC uPVC - HDPE DE NHAT.pdf
Catalogue ONG NƯỚC uPVC - HDPE DE NHAT.pdf
 
Call Girls In Radisson Blu Hotel New Delhi Paschim Vihar ❤️8860477959 Escorts...
Call Girls In Radisson Blu Hotel New Delhi Paschim Vihar ❤️8860477959 Escorts...Call Girls In Radisson Blu Hotel New Delhi Paschim Vihar ❤️8860477959 Escorts...
Call Girls In Radisson Blu Hotel New Delhi Paschim Vihar ❤️8860477959 Escorts...
 
Tech Startup Growth Hacking 101 - Basics on Growth Marketing
Tech Startup Growth Hacking 101  - Basics on Growth MarketingTech Startup Growth Hacking 101  - Basics on Growth Marketing
Tech Startup Growth Hacking 101 - Basics on Growth Marketing
 
NewBase 22 April 2024 Energy News issue - 1718 by Khaled Al Awadi (AutoRe...
NewBase  22 April  2024  Energy News issue - 1718 by Khaled Al Awadi  (AutoRe...NewBase  22 April  2024  Energy News issue - 1718 by Khaled Al Awadi  (AutoRe...
NewBase 22 April 2024 Energy News issue - 1718 by Khaled Al Awadi (AutoRe...
 
Case study on tata clothing brand zudio in detail
Case study on tata clothing brand zudio in detailCase study on tata clothing brand zudio in detail
Case study on tata clothing brand zudio in detail
 
(8264348440) 🔝 Call Girls In Keshav Puram 🔝 Delhi NCR
(8264348440) 🔝 Call Girls In Keshav Puram 🔝 Delhi NCR(8264348440) 🔝 Call Girls In Keshav Puram 🔝 Delhi NCR
(8264348440) 🔝 Call Girls In Keshav Puram 🔝 Delhi NCR
 
A.I. Bot Summit 3 Opening Keynote - Perry Belcher
A.I. Bot Summit 3 Opening Keynote - Perry BelcherA.I. Bot Summit 3 Opening Keynote - Perry Belcher
A.I. Bot Summit 3 Opening Keynote - Perry Belcher
 
Vip Female Escorts Noida 9711199171 Greater Noida Escorts Service
Vip Female Escorts Noida 9711199171 Greater Noida Escorts ServiceVip Female Escorts Noida 9711199171 Greater Noida Escorts Service
Vip Female Escorts Noida 9711199171 Greater Noida Escorts Service
 
Call Girls Miyapur 7001305949 all area service COD available Any Time
Call Girls Miyapur 7001305949 all area service COD available Any TimeCall Girls Miyapur 7001305949 all area service COD available Any Time
Call Girls Miyapur 7001305949 all area service COD available Any Time
 

03.2014, REPORT, 2013 Article IV staff report for Mongolia, International Monetary Fund

  • 1. ©2014 International Monetary Fund IMF Country Report No. 14/64 MONGOLIA 2013 ARTICLE IV CONSULTATION—STAFF REPORT; PRESS RELEASE AND STATEMENT BY THE EXECUTIVE DIRECTOR FOR MONGOLIA Under Article IV of the IMF’s Articles of Agreement, the IMF holds bilateral discussions with members, usually every year. In the context of the 2013 Article IV consultation with Mongolia, the following documents have been released and are included in this package:  Staff Report for the 2013 Article IV consultation, prepared by a staff team of the IMF, for Executive Board’s consideration on November 15, 2013, following discussions that ended on September 24, 2013, with the officials of Mongolia on economic developments and policies. Based on information available at the time of these discussions, the staff report was completed on November 1, 2013.  Informational Annex prepared by the IMF.  Debt Sustainability Analysis prepared by the staffs of the IMF and the World Bank.  Press Release summarizing the views of the Executive Board as expressed during its November 15, 2013 consideration of the staff report that concluded the Article IV consultation with Mongolia.  Statement by the Executive Director for Mongolia. The policy of publication of staff reports and other documents allows for the deletion of market-sensitive information. Copies of this report are available to the public from International Monetary Fund  Publication Services 700 19th Street, N.W.  Washington, D.C. 20431 Telephone: (202) 623-7430  Telefax: (202) 623-7201 E-mail: publications@imf.org Internet: http://www.imf.org International Monetary Fund Washington, D.C. March 2014
  • 2. MONGOLIA STAFF REPORT FOR THE 2013 ARTICLE IV CONSULTATION KEY ISSUES Overview. Mongolia has made impressive progress in developing its economy over the past decade. Medium-term prospects remain promising given Mongolia’s large natural resource endowment, but macroeconomic policies have become unsustainably loose. The resulting balance of payments (BOP) pressures have been compounded by negative shocks to FDI and coal exports. Outlook and Risks. Staff expect the economy to grow by 12 percent this year and 9½ percent in 2014, buoyed by the start of production at the Oyu Tolgoi (OT) copper and gold mine. Over the past two years, nonmining growth has been boosted by fiscal and monetary stimulus. In view of the uncertain external environment, Mongolia needs to change course to reduce its vulnerability to external shocks. Gross international reserves are still adequate for precautionary purposes, but they have been supported by external borrowing and the declining trend in net international reserves observed this year is not sustainable. Policies. Securing sustainable growth while addressing macroeconomic risks requires a package of fiscal adjustment, unwinding of the monetary stimulus provided this year, and continued exchange rate flexibility. Banking sector vulnerabilities and weaknesses in the business climate also need to be addressed.  Some encouraging steps are being taken to tighten fiscal policy in the remainder of 2013 and by basing the 2014 budget on more realistic revenue projections. However, including off-budget spending by the Development Bank of Mongolia (DBM) the overall fiscal deficit in 2013 will likely again be over 10 percent of GDP. Implementation of the Fiscal Stability Law (FSL) is an urgent priority, with DBM spending to be included in the budget. Public investment projects should be reprioritized in view of constraints on absorptive and implementation capacity.  The Bank of Mongolia (BOM)’s large monetary stimulus, through its so-called “price stabilization program,” mortgage program, and liquidity injection, distorts markets and is bound to ratchet up inflation. The programs should be phased out and the BOM should focus on further strengthening the monetary policy framework while maintaining the increased exchange rate flexibility observed in recent months.  Banking sector vulnerabilities need to be addressed. They stem from weaknesses in banking supervision, inadequate provisioning, high levels of loan concentration and dollarization, and a high and rising credit-to-deposit ratio.  The government should build on the recent passage of the new investment law to further improve the business climate and encourage FDI inflows. November 1, 2013
  • 3. MONGOLIA 2 INTERNATIONAL MONETARY FUND Approved By Markus Rodlauer and Masato Miyazaki Discussions were held in Ulaanbaatar during September 10–24, 2013. The staff team comprised Messrs. Almekinders (head) and Yu (both APD), Ms. Kinoshita (OAP, who is in charge of the local office), and Messrs. Min (FAD), Quill (MCM), and Shin (OAP). Messrs. Rodlauer (APD), Yoon, and Moon (both OED) joined the last days of the mission. The team was assisted by Mses. Ardak, Khulan, and Selenge in the local office. Ms. Tolentino, Mr. George, and Ms. Choi (APD) assisted in the preparation of this report. CONTENTS RECENT ECONOMIC DEVELOPMENTS AND OUTLOOK ________________________________________ 4  A. Introduction _____________________________________________________________________________________4  B. Expansionary Policies and External Shocks Are Pressuring the BOP _____________________________5  C. Outlook and Risks _______________________________________________________________________________7  POLICY DISCUSSIONS __________________________________________________________________________ 10  A. Fiscal Policy____________________________________________________________________________________ 10  B. Monetary and Exchange Rate Policy___________________________________________________________ 11  C. Financial Sector Issues_________________________________________________________________________ 13  D. Structural Reforms and Statistics ______________________________________________________________ 14  STAFF APPRAISAL ______________________________________________________________________________ 15  BOXES 1. The Recent Failure of Savings Bank____________________________________________________________ 17  2. Price Stabilization Program, Mortgage Program and Liquidity Injection_______________________ 18  3. The Monetary Policy Stance ___________________________________________________________________ 19  4. Exchange Rate Assessment ____________________________________________________________________ 20  5. Financial Soundness Indicators and Bank Stress Tests _________________________________________ 21  FIGURES 1. Real Sector Developments_____________________________________________________________________ 22  2. Fiscal and Monetary Sector Developments ____________________________________________________ 23  3. External Sector Developments _________________________________________________________________ 24  4. Inclusive Growth Indicators ____________________________________________________________________ 25  TABLES 1. Strong Policy and Weak Policy Scenarios, 2010–18______________________________________________8  2. Selected Economic and Financial Indicators, 2009-14 _________________________________________ 26 
  • 4. MONGOLIA INTERNATIONAL MONETARY FUND 3 3. Summary Operations of the General Government, 2009–14___________________________________ 27  4. Statement of Operations and Stock Positions of the General Government, 2009–14__________ 28  5. Monetary Aggregates, 2009–14 _______________________________________________________________ 29  6. Balance of Payments, 2011–18_________________________________________________________________ 30  7. Selected Economic and Financial Indicators, 2009-18 _________________________________________ 31  8. Financial Soundness Indicators of the Banking Sector_________________________________________ 32  APPENDIXES I. Risk Assessment Matrix_________________________________________________________________________ 33  II. Mongolia’s New Fiscal Framework Anchored by the Fiscal Stability Law ______________________ 34 
  • 5. MONGOLIA 4 INTERNATIONAL MONETARY FUND RECENT ECONOMIC DEVELOPMENTS AND OUTLOOK A. Introduction 1. Mongolia has made impressive progress in developing its economy (Figure 1). Spearheaded by foreign direct investment (FDI)-financed development of the mining sector, per capita income has increased five-fold, to more than US$3,000, over the past decade. Medium-term prospects are promising as mining output is projected to expand further over the next five years. Foreign investors’ optimism about Mongolia’s prospects was illustrated by successful international bond issuances in 2012. A private mining company, a private bank, the state-owned Development Bank (DBM), and the sovereign (the US$1.5 billion “Chinggis” bond) raised a total of US$3 billion (30 percent of GDP). 2. The strong growth of the economy has helped reduce poverty. Over the past two years, poverty has declined by more than 11 percentage points, to 27 percent of the population in 2012. However, indicators for inequality and unemployment suggest that there is scope to make growth more inclusive, despite relatively high social spending compared to Mongolia’s peers (Figure 4). 3. However, macroeconomic policies have been unsustainably loose the past two years. Government expenditure increased by 70 percent in real terms between 2010 and 2012, with growing importance of off-budget spending. In late-2012, the BOM embarked on a major monetary stimulus, which added to growing BOP pressures. During 2012 and the first half of 2013, BOP pressures were mostly reflected in a decline in the BOM’s Net International Reserves (NIR). In recent months, the exchange rate has become more flexible. Capitalization and liquidity of the banking system have improved. However, dollarization remains high and the provisioning regime for commercial banks lags Asian peers. 4. This year’s consultation focused on the need to adjust macroeconomic policies to rein in domestic demand growth, curtail balance of payments pressures, and contain inflation. In particular, discussions centered on the implementation of the 2010 Fiscal Stability Law (FSL)—which has now become effective and which prescribes a 2 percent of GDP limit on the structural fiscal deficit (Appendix II) 1 —as well as the need for a significant correction in the monetary policy stance. 1 The new fiscal framework implied by the 2010 Fiscal Stability Law (FSL) was adopted in the aftermath of the 2008/09 balance of payments (BOP) crisis. It focuses on prudent natural resource management, taking into account absorptive capacity constraints—in particular, macroeconomic stability and overheating concerns, and concerns about the efficiency of scaled-up public investments, as well as intergenerational concerns. The framework was designed with substantial input from the IMF (FAD), consistent with the principles and international experience summarized in the 2012 IMF Policy Paper on Macroeconomic Policy Frameworks for Resource-Rich Developing Countries. In turn, that paper noted that the Mongolian fiscal policy framework anchored by the FSL constitutes a relevant example for other middle- and low-income countries with large revenue from nonrenewable resources. Staff Recommendations Made in the Context of the Last Two Article IV Consultations  Scale back the growth of total government spending in view of inflation and BOP pressures.  Take off-budget spending into account when determining the macro-economically sustainable level of total government spending.  Monetary easing should be contingent on demand pressures abating and prudent fiscal policy.  BOP pressures should be reflected more in movements in the exchange rate.  Continue efforts to strengthen the soundness and resilience of the banking system.
  • 6. MONGOLIA INTERNATIONAL MONETARY FUND 5 Other key topics included a renewed focus on financial sector risks—illustrated by the recent failure of Savings Bank (Box 1)—and structural reforms to clarify the investment regime and boost non- mining growth. Staff liaised with Mongolia’s bilateral and multilateral development partners. While noting Mongolia’s longer-term infrastructure needs, they shared the staff’s concerns about the unsustainably loose macroeconomic policies. 5. A new government took over in 2012. The June 2012 parliamentary elections were won by the opposition Democratic Party, which formed a coalition government with three smaller parties and appointed a new central bank governor. With the June 2013 reelection of President Elbegdorj, the Democratic Party now essentially controls government for the next three years. B. Expansionary Policies and External Shocks Are Pressuring the BOP 6. The Mongolian economy has continued to grow very rapidly. The economy expanded by 12½ percent in 2012 and by 11½ percent in the first half of 2013. Growth has been buoyed by a relatively mild winter boosting agriculture and highly expansionary fiscal and monetary policies. The latter have been deployed to compensate for the marked slowdown in coal exports and FDI-financed mining development—key drivers of growth in recent years. 7. However, BOP pressures have intensified and inflation is bound to rise:  Negative shocks to FDI and coal exports increased BOP pressures from mid-2012 onwards. These pressures have been compounded by highly expansionary fiscal and monetary policies that are boosting the demand for non-mining imports.  Inflation fell to a two-year low of 7 percent in July thanks to moderating food prices and the Bank of Mongolia’s (BOM) price stabilization program. However, the depreciation of the togrog of the past three months is likely to push up inflation in the coming months. 8. Monetary policy has been highly expansionary. To cushion the impact of declining FDI and to boost credit growth, the BOM took a two-pronged approach: it cut the policy rate three times by a total of 275 basis points to 10.5 percent; and it lent substantial sums to banks at below-market rates, including for on-lending to selected sectors through the price stabilization and mortgage programs (Box 2). If it wasn’t for a large decline in its international reserves, the BOM’s balance sheet and hence reserve money would have more than doubled in just 6 months. Commercial banks have been taking advantage of the large provision of cheap BOM funding, and private sector credit growth accelerated to 47 percent in August (y/y). 9. Fiscal policy has remained highly expansionary.  The overall fiscal deficit (including DBM operations) rose to 10.9 percent of GDP in 2012, 6 percent of GDP higher than in 2011:  The 2012 budget outturn recorded a deficit of 7.5 percent of GDP. Revenue growth decelerated on declining FDI inflows. On-budget expenditures rose by 20 percent, in part due to large increases in civil servants’ wages.
  • 7. MONGOLIA 6 INTERNATIONAL MONETARY FUND  Off-budget spending by the government-owned DBM amounted to 3.4 percent of GDP in 2012. This spending should also be included in the assessment of the fiscal policy stance. The DBM’s debt is guaranteed by the government and has to be serviced by the government budget. A large part of DBM spending is on non-revenue-generating public investment projects such as roads. For several of the “revenue-generating projects” there is a substantial risk that the DBM will not be repaid, e.g. the US$200 million it has provided to the loss-making state-owned coal producer Erdenes Tavan Tolgoi.  Government spending continued to rise sharply during the first 8 months of 2013. Spending by the budget was unchanged from a year ago. However, including the more than MNT 1 trillion (6½ percent of GDP) spending by the DBM, total government spending rose by 30 percent compared to the same period last year.  Public debt has been rising rapidly. Excluding an additional foreign bond issuance under discussion, public debt is projected to reach 67 percent of GDP by the end of 2013, up from 39 percent just two years ago. Moreover, the cost and risk profile of the public debt have become less favorable. The share of concessional loans has declined, the bulk of the debt is denominated in foreign currency, and substantial refinancing risk has emerged for 2017. The IMF/World Bank Debt Sustainability Analysis (DSA) now indicates that Mongolia is at moderate risk of debt distress. 10. BOP pressures caused by the external shocks and expansionary policies have been absorbed by BOM foreign exchange sales financed from external borrowing and, more recently, increased exchange rate flexibility. Gross international reserves currently amount to US$2.4 billion (about 3.7 months of prospective imports), about the same level as a year ago. External borrowing has helped keep reserves at this level. For instance, the government deposited the sovereign “Chinggis” bond proceeds at the BOM. This helped to raise the BOM’s Gross International Reserves (GIR) to a record US$4.1 billion at end-2012. As a result of persistent sales of foreign exchange in the spot and forward market, GIR subsequently fell to US$2.4 billion (Figure 3). Over the past year, the exchange rate has depreciated by 22 percent vis-à-vis the U.S. dollar, with most of this occurring in the last four months. 11. International financial markets are becoming more concerned about developments in Mongolia. The key selling points for Mongolia’s successful maiden sovereign bond issuance in late- 2012 were the new fiscal policy framework anchored by the FSL becoming operational in 2013 and the imminent start of exports from the Oyu Tolgoi (OT) copper mine. However, sentiment subsequently suffered with downward pressures on international reserves, the uncertain external outlook, and the Savings Bank failure. By mid-September, as yields on relatively risky assets rose in anticipation of the US Federal Reserve System starting to taper its asset purchases, Mongolia’s sovereign spread had widened about 140 basis points more than the average for emerging markets since the issuance. With the postponement of “Fed tapering”, the “excess spread” has narrowed again (Figure 3).
  • 8. MONGOLIA INTERNATIONAL MONETARY FUND 7 C. Outlook and Risks 12. The near-term outlook for growth is favorable but inflation will likely rise.  Growth is projected to remain in or near double digits in 2013 and 2014. Mineral GDP will be boosted by the start of commercial operations at the Oyu Tolgoi (OT) copper mine and expansion of coal production from the Tavan Tolgoi (TT) mine. Non-mineral GDP growth is projected at 11 percent in 2013, supported by expansionary monetary and fiscal policies. Non- mineral GDP growth in 2014 depends in part on the pace of DBM disbursements for investments in public investment projects and the extent to which the BOM’s stimulus programs are continued.  Inflation is projected to move above 10 percent and remain there through late-2014. In the context of continued strong growth of domestic demand, and notwithstanding the BOM’s continued operation of the price stabilization program, the depreciation of the exchange rate observed in recent months will likely spill over into higher inflation. 13. However, continuation of current policies could lead to a highly vulnerable situation. The important policy decisions facing the authorities are highlighted by a comparison of a “strong policy scenario” with a “weak policy scenario” (see Table 1 on next page):  In the strong policy scenario, which is quantified in more detail in Tables 2–7, the medium-term budget framework is consistent with the FSL. On-budget fiscal operations observe the FSL starting with a 2014 budget based on realistic revenue projections. The off-budget program of public investment projects is phased out by the end of 2015. To help ease demand and BOP pressures further, the BOM’s stimulus programs are phased out by mid-2014.  The weak policy scenario illustrates the risks of a continuation of current policies amid continued weakness of FDI inflows and coal exports. In this scenario, it takes the government two more years to bring on-budget fiscal operations in line with the FSL. In addition, the government continues to pursue its development strategy through the implementation of off- budget public investment projects. This would be broadly in line with the medium-term budget framework for 2014-16 which was approved in May and envisages continued large international bond issuances. Finally, the BOM’s stimulus measures are phased out only gradually (by 2015). In this scenario, non-mining growth in 2014 would be higher than in the strong policy scenario. However, Mongolia would run a progressively more serious risk of a BOP crisis. In case of crisis, the required large adjustment of absorption would cause a cumulative non-mining output loss of about 20 percentage points, compared to the strong policy scenario, over a 4 year horizon (calibrated on cross-country experiences summarized in WP/08/224 and the Board Paper on “Assessing Reserve Adequacy”). The larger exchange rate depreciation (compared to the strong policy scenario) would add to inflationary pressures. The implications of the weak policy scenario for key indicators of public external debt public are illustrated in the Debt-Sustainability Analysis. 14. In addition to the risks posed by the continuation of current policies, the outlook is subject to other downside near- and medium-term risks (see Risk Assessment Matrix, Appendix I):
  • 9. 2010 2011 2012 Strong policy scenario 2013 2014 2015 2016 2017 2018 2013 2014 2015 2016 2017 2018 Real sector (change in percent) Real GDP growth 6.4 17.5 12.3 11.8 9.6 7.0 5.2 8.5 6.0 11.8 12.1 -2.6 -1.2 3.2 1.2 Mineral growth 3.6 7.3 8.9 16.1 33.4 7.2 -2.1 14.9 1.8 16.1 33.4 7.2 -2.1 14.9 1.8 Non-mineral growth 7.0 19.7 12.9 11.0 5.0 7.0 7.0 7.0 7.0 11.0 8.0 -5.0 -1.0 0.0 1.0 Consumer prices (end-period) 14.3 9.4 14.2 11.7 11.0 7.4 6.7 6.6 5.5 11.7 14.3 11.7 5.0 5.5 5.4 Fiscal accounts (in percent of GDP, unless otherwise indicated) Overall balance (in percent of GDP) 1/ 0.5 -4.8 -10.9 -13.5 -7.4 -3.8 -1.7 -1.8 -2.0 -13.5 -13.1 -10.1 -7.6 -5.1 -4.7 Structural balance (FSL, in percent of GDP) 1/ … -6.9 -11.5 -13.7 -7.5 -4.2 -2.0 -2.0 -2.0 -13.7 -13.3 -10.5 -8.0 -5.3 -4.7 Non-mineral balance (In percent of non-mineral GDP) -13.6 -17.8 -20.7 -22.8 -15.9 -11.3 -9.6 -10.7 -10.6 -22.8 -23.4 -21.6 -20.3 -19.4 -19.4 Non-mineral revenue (In percent of non-mineral GDP) 33.8 39.3 36.5 35.1 35.0 34.8 34.0 33.8 32.6 35.1 34.8 36.0 35.9 37.0 36.9 Total expenditure (In percent of non-mineral GDP) 47.4 57.1 57.2 57.9 50.9 46.1 43.6 44.5 43.1 57.9 58.2 57.6 56.2 56.4 56.3 Total public debt (in percent of GDP) 35.9 38.8 63.0 67.3 65.8 60.4 55.9 52.4 50.1 67.3 72.9 78.1 81.1 79.9 79.0 of which: Domestic debt 5.1 10.9 14.7 15.5 15.1 15.5 16.3 16.2 16.6 15.5 14.7 15.6 16.8 17.5 18.4 External debt 30.8 27.9 48.3 51.8 50.7 44.9 39.6 36.2 33.4 51.8 58.1 62.5 64.3 62.4 60.6 NPV of public debt 54.6 58.6 58.0 53.3 49.5 46.4 44.7 58.6 63.9 68.9 72.1 70.9 70.4 Monetary accounts (Change in percent) Broad money 61.6 37.1 18.8 17.1 28.8 29.5 30.0 Reserve money 29.2 75.5 30.5 12.2 11.9 44.7 29.1 Credit to the private sector 21.5 72.3 24.1 40.9 16.1 54.1 33.6 External accounts Current account balance (percent of GDP) -14.9 -31.7 -32.8 -31.6 -20.3 -18.3 -21.5 -15.3 -14.6 -31.6 -22.2 -14.1 -16.2 -9.9 -8.7 Gross official reserves (in millions of U.S. dollars) 2,490 2,630 4,126 2,214 2,290 2,178 2,369 2,592 2,821 2,244 755 116 308 532 758 (in months of imports) 3.9 3.9 6.5 3.4 3.3 3.0 3.0 3.2 3.2 3.4 1.2 0.2 0.5 0.8 1.0 Memorandum items: Nominal GDP (in billions of togrogs) 8,415 11,088 13,944 16,691 20,352 23,513 26,258 30,358 34,125 16,691 21,692 24,167 25,668 28,126 29,952 Nominal GDP (in millions of U.S. dollars) 6,244 8,709 10,258 10,982 11,417 12,494 13,286 14,701 15,918 10,982 10,927 10,227 10,086 10,586 10,815 Government expenditure (in billions of togrog) 3,081 4,997 6,494 8,000 8,205 8,636 9,382 10,943 12,104 8,000 9,883 10,468 10,998 11,700 12,439 Government expenditure (growth in percent) 32 62 30 23 3 5 9 17 11 23 24 6 5 6 6 DBM spending (in percent of GDP) … … 3.4 9.0 5.5 2.2 0.0 0.0 0.0 9.0 11.3 8.5 5.9 3.3 2.6 Sources: Mongolian authorities; and IMF staff calculations. 1/ Includes DBM spending. Table 1. Strong Policy and Weak Policy Scenarios, 2010–18 Weak policy scenario MONGOLIA 8INTERNATIONALMONETARYFUND
  • 10. MONGOLIA INTERNATIONAL MONETARY FUND 9  Spillovers from weakening external demand for commodities could further dampen mining export revenues. Advanced economies will eventually exit from the very supportive monetary policies implemented in recent years. China’s economy is expected to rebalance away from a mostly investment-based growth model toward a more consumption-based growth model. Both these factors will likely have significant spillovers globally and especially in the region. China accounts for more than 90 percent of Mongolia’s exports and the recent World Economic Outlook identifies Mongolia as one of the most vulnerable countries to a rebalancing of demand in China. Slowing growth in China would affect Mongolia via trade and FDI channels.  External shocks and/or the continuation of current policies could expose vulnerabilities in the banking system, exacerbating a negative shock to growth and financial stability. 15. Mongolia’s medium-term prospects remain promising. Mongolia’s large natural resource endowment and its proximity to the fastest-growing economies in the world provide ample opportunities for development. The start of copper production at the OT open pit mine, the development of the OT underground mine, and the ramp up of coal production from the TT mine are projected to keep the growth of mineral GDP at about 16 percent per annum, on average, during 2013-17. Activity outside the mining sector is also projected to remain buoyant, although this would need to be supported by continued reforms to strengthen the foundation of the economy and the business climate. Authorities’ Views 16. The authorities expressed optimism about continued strong growth alongside a strengthening of the BOP in the course of 2014 and over the medium term. The centerpiece of their development strategy was scaled-up public investment, including in transportation infrastructure, financed by foreign borrowing, to be sustained by continued rapid economic growth and a recovery of export earnings. They pointed at their achievements, despite the external shocks, including continued double-digit economic growth, buoyed by sharply rising domestic investments, with inflation kept at manageable levels. The authorities projected the economy to grow by 15 percent per annum, on average, during 2013-2016. They expected mining and non-mining output to record average annual growth of 32 percent and 11 percent, respectively. 17. The authorities acknowledged the downside risks to the external outlook but indicated they were taking steps to address prevailing BOP pressures. Government spending was being curtailed for the remainder of the year (¶22). The BOM was discussing plans to unwind some of the monetary stimulus (¶30). The recent exchange rate depreciation was dampening the demand for imports (¶31). And Parliament passed a new Investment Law aimed at boosting FDI and domestic investment (¶38). New foreign borrowing in the coming months and an anticipated rebound in coal exports starting in the last quarter of this year would help holding immediate BOP pressures at bay. On that basis, the authorities did not consider necessary at this time an additional package of macroeconomic adjustments and reforms as outlined in the “strong policy scenario.”
  • 11. MONGOLIA 10 INTERNATIONAL MONETARY FUND POLICY DISCUSSIONS 18. Notwithstanding Mongolia’s promising medium-term prospects, macroeconomic policies are on an unsustainable path and need to be adjusted to rein in domestic demand growth, curtail balance of payments pressures, and contain inflation. The discussions centered on the need for a package of fiscal adjustment, unwinding of the monetary stimulus, and continued exchange rate flexibility. Banking sector vulnerabilities and uncertainties surrounding the foreign investment regime also need to be addressed. A. Fiscal Policy 19. Some encouraging steps have recently been taken to tighten fiscal policy. These steps would moderate spending growth during the remainder of 2013 and provide a good foundation for the preparation of the 2014 budget:  The Minister of Finance announced plans to reduce budgetary spending by almost MNT 1 trillion (6 percent of GDP) so as to keep the 2013 budget within the FSL’s 2 percent of GDP ceiling for the structural fiscal deficit.  During the remainder of 2013, the DBM will not receive additional funding from the Chinggis- bond proceeds currently held by the government at the BOM. The DBM would pay out the cash it currently has on hand (MNT 0.4 trillion) on ongoing public investment projects.  The Ministry of Finance has initiated work on the 2014 budget based on a relatively conservative projection for government revenue. 20. However, given the sustained BOP pressures and the uncertain outlook, staff argued that further steps were needed. Even with the measures listed above, the fiscal deficit including DBM operations in 2013 would top last year’s level (10.9 percent of GDP) and public debt (including BOM external borrowing) would reach about 67 percent of GDP. This raises doubts about the consistency of fiscal policy with the FSL  DBM operations should be included in the budget starting with the 2014 budget. The DBM was founded after the FSL was adopted, and the FSL is not clear about whether the structural deficit rule applies to public sector off-budget activities. Lack of clarity on this issue in the FSL has led to off-budget public sector activities being excluded from the rule. However, the main purpose of the FSL is “ensuring fiscal stability” (Article 1), and the law envisages comprehensive coverage of public debt (Article 4.1.8). On that basis, off-budget activities through the DBM should be reflected in the calculation of all FSL requirements.  An ambitious and credible fiscal consolidation plan should be drawn up, consistent with the FSL. Budget operations and the operations of the DBM taken together should meet the 2 percent of GDP ceiling for the structural deficit in due course. Given the sustained BOP pressures, the planned adjustment needs to be adequately frontloaded, spearheaded by streamlining
  • 12. MONGOLIA INTERNATIONAL MONETARY FUND 11 subsidies and transfers and reprioritizing capital spending. Even so, the overall deficit (including DBM operations) and the public debt would likely exceed the FSL limits in the next 2–3 years, which should be transparently explained to Parliament. Over the medium term, and given also current economic conditions and vulnerabilities, the FSL ceilings for the deficit and public debt remain appropriate and should anchor adjustments to a sustainable policy path.  DBM spending should be re-phased and re-prioritized. DBM spending is projected to amount to 9 percent of GDP in 2013 and has contributed considerably to BOP pressures. To help ease these pressures, the Ministry of Economic Development and the DBM should prepare a prioritized list of capital expenditure items in their portfolios and only implement the projects with the highest payoff in terms of contributions to medium-term growth.  The Social Welfare Law (SWL) should be implemented. The 2012 SWL envisages replacing existing costly universal cash transfers with means-tested benefits that would reach the poorest households. This would help increase fiscal flexibility and reduce inequality. 21. The set up of a sovereign wealth fund (SWF) should be completed. The establishment of a SWF would be an important complement to the FSL’s countercyclical fiscal policy. Technical work on setting up a SWF should be finalized, building on technical assistance provided by the World Bank and the IMF. Authorities’ Views 22. The authorities confirmed their commitment to observe the 2 percent of GDP ceiling for the structural deficit for on-budget operations in 2013 and 2014. Cuts of current and capital spending for the rest of the year had been decided through a Cabinet Resolution and would be reflected in a supplementary 2013 budget to be discussed by Parliament in November. Discussions on the 2014 budget had started based on realistic revenue projections. 23. They noted that DBM spending represented a key policy instrument to boost growth in the short- and medium term. DBM spending was approved by parliament and bringing it on- budget could be done in different ways. In view of the uncertain economic outlook, the authorities were not ready to commit to a target date by which the overall fiscal deficit including DBM operations would observe the 2 percent of GDP structural deficit ceiling. They were looking to issue another international bond to finance additional DBM spending until an expected pick up in exports and growth would kick in. The authorities expressed an interest in further discussing with staff the appropriateness of the FSL debt and deficit ceilings and the treatment of DBM operations under those ceilings. B. Monetary and Exchange Rate Policy 24. The monetary policy framework has been strengthened. Earlier this year, the BOM introduced a policy interest rate corridor. The auctioning of treasury bills was modernized. And the adoption of the new Securities Law should facilitate secondary market trading of treasury bills. These measures are important in strengthening the interest rate channel of monetary policy.
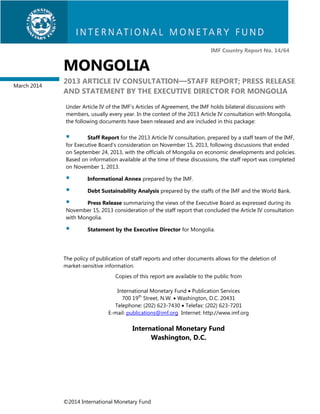
  • 13. MONGOLIA 12 INTERNATIONAL MONETARY FUND 25. However, the large monetary and quasi-fiscal stimulus provided through three new BOM programs creates risks and distortions, and should be unwound. The three programs loosen the monetary policy stance, creating inflationary and BOP pressures (Box 3). They also heighten banking sector vulnerabilities and could give rise to contingent liabilities for the public sector (Box 2). 26. Exchange rate flexibility has increased in recent months. The floating exchange rate regime and auction system should be maintained. Intervention should be limited to smoothing excessive exchange rate volatility. To support medium- and long-term external stability and the exchange rate regime, appropriate fiscal and monetary policies are key, along the lines recommended above. 27. The real exchange rate is assessed to be moderately overvalued, even in the strong policy scenario which assumes a tightening of monetary and fiscal policy (Box 4). The overvaluation, and the risk of a further large adjustment of the nominal exchange rate, would become more pronounced in case the loose fiscal and monetary policy implemented so far this year continued. This assessment takes into account the full development of the OT and TT mines. While the current account is projected to continue to show a large deficit over the five-year projection period, the long-term prospects are favorable, as the current account is expected to gradually move to a surplus. 28. Even though international reserves have been on a downward trajectory, they are still adequate for precautionary purposes based on traditional assessment criteria. A recently developed risk-based metric of reserve adequacy (see SM/11/31) suggests that Mongolia may need to hold more reserves than it currently does. Moreover, the declining trend in net international reserves—taking into account the deposits taken from commercial banks and the BOM’s increasing foreign liabilities—is not sustainable, underscoring the need for policy adjustment. Authorities’ Views 29. The authorities explained that countercyclical monetary policy had been implemented to prevent a serious economic downturn and a credit crunch. They noted that Mongolia faced a difficult economic outlook in late-2012, owing to the negative shocks to FDI and coal exports. The BOM’s stimulus programs had succeeded in reviving demand and supporting growth while keeping inflation on a downward trajectory. 30. The intention is to phase out the monetary stimulus programs over time. The BOM deposits placed with commercial banks would be pulled back in the coming months. The new mortgages sold by banks would be taken off their books through securitization operations, and 0 500 1,000 1,500 2,000 2,500 3,000 3,500 0 500 1,000 1,500 2,000 2,500 3,000 3,500 Import Cover Broad Money Short-term debt Risk Metric Reserves Assessed Under Different Approaches (In millions of U.S. dollars) Implied GIR Actual GIR at end-September 2013 100 percent of short-term debt20 percent of broadmoney 150 percent of metric coverage 3 months ofimports
  • 14. MONGOLIA INTERNATIONAL MONETARY FUND 13 banks would be obliged to repay the freed-up funds to the BOM. The authorities were confident that the implications for banking-sector liquidity were manageable and that refinancing risks were not an issue, pointing at commercial banks’ large holdings of central bank bills. The BOM would continue to operate the price stabilization program pending the development of market-based, efficient warehouse financing with private-sector participation. 31. The authorities reaffirmed their commitment to the floating exchange rate regime. They expressed broad agreement with staff’s assessment of the exchange rate and reserve adequacy. While the exchange rate depreciation in July and August was due to a string of bad news, including with regard to the ongoing discussions among OT shareholders, the authorities noted that its dampening effect on import demand was already visible. C. Financial Sector Issues 32. Good progress has been made in strengthening banks’ capitalization and liquidity, and reported non-performing loans are low (Box 5). The higher capital adequacy ratio (CAR) of 14 percent for the four largest, systemically important banks that was achieved by mid-2013 is providing welcome additional buffers. Moreover, the higher minimum paid-in capital requirement (MNT 16 billion) and higher Tier 1 capital ratio (9 percent) are helpful for the relatively more vulnerable small- and medium-size banks. 33. Nevertheless, as illustrated by the recent failure of Savings Bank, the banking sector harbors significant vulnerabilities. There is a need to strengthen corporate governance practices and enforcement of regulations, including single borrower limits. Mongolia’s loan-to-deposit ratio and level of dollarization are among the highest in Asia. Surging credit growth is likely to have posed a challenge to prudent underwriting practices and supervision. The currency depreciation of the past four months could adversely affect credit quality of foreign currency-denominated loans. In light of the relatively undiversified nature of the economy, the banking system also remains vulnerable to a downturn in the mining sector and a deceleration of government spending. 34. To contain financial sector risks, the regulatory and supervisory framework should be strengthened further:  The BOM should strictly enforce the existing prudential regulations and continue to improve prudential indicators. The existing lending limits on a single borrower and a bank-related party should be rigorously enforced. Focus should also be on strengthening underwriting practices as well as on addressing deficiencies in loan classifications and NPL recognition. The BOM should consider phasing in a more forward-looking provisioning scheme that takes into account the risks of losses on performing loans.  The newly expanded State Bank should be recapitalized promptly and plans should be developed toward its privatization.  The supervisory and bank resolution regimes should be enhanced. Following up on the implementation of the 2010 FSAP recommendations, a strategic plan should be developed to
  • 15. MONGOLIA 14 INTERNATIONAL MONETARY FUND implement a robust supervisory regime and strengthen the bank resolution framework. In addition, there is a need to develop a legal framework for prompt corrective actions that mandates progressively stronger supervisory actions as a bank’s capital declines. The recently established Deposit Insurance Corporation and the BOM, in collaboration with other appropriate entities, should develop a comprehensive framework to address standalone resolution requirements, as well as a systemic financial crisis.  Lending dollarization should be discouraged. Mongolia’s relatively high dollarization, in conjunction with the relatively small size of non-mining exports, suggests that the non-bank private sector may have a considerable foreign currency mismatch with attendant risks. Yet the 2010 FSAP recommendation to establish guidelines for foreign exchange lending still has to be followed up. Ideally, banks should only be allowed to lend in foreign currency to hedged borrowers. Alternatively, consideration could be given to additional prudential measures such as higher risk weights on foreign currency-denominated loans and caps on individual banks’ foreign currency loan-to-deposit ratio. 35. Efforts to strengthen the Anti-Money Laundering/Countering the Financing of Terrorism (AML/CFT) framework need to be stepped up. In October 2013, the Financial Action Task Force (FATF) designated Mongolia as a jurisdiction not making sufficient progress in implementing the agreed action plan to enhance its AML/CFT framework. There is a risk that, absent sufficient progress by February 2014, the country will be placed on the FATF blacklist, which would lead to heightened due diligence from foreign financial institutions regarding transactions with Mongolia. Authorities’ Views 36. The authorities expressed broad satisfaction with their management of financial sector risks. Following the failure of Savings Bank there were no more banks under a Supervisory Action Plan. Adequate safeguards had been built into the mortgage program (e.g. minimum down- payment requirements and maximum loan-to-value ratios). The authorities also pointed out that the bulk of unhedged foreign-currency loans were to larger, more-diversified corporations who they considered able to internalize the foreign currency risk. They further noted that the timing was not right to adjust the provisioning regime. D. Structural Reforms and Statistics 37. Efforts to improve the business climate and trade integration should continue. Mongolia ranks relatively high in the World Bank’s Doing Business Survey. However, there is scope to further streamline procedures and strengthen policy frameworks to boost private-sector-led non- mineral growth. For instance, trading across borders, getting electricity and dealing with construction permits remain relatively cumbersome. 38. Adoption of a new Investment Law on October 3 is a major milestone in the authorities’ quest to revive domestic and foreign direct investment. The recent extraordinary session of Parliament discussed a package of 5 laws aimed at boosting investment and gold exports by streamlining and stabilizing rules and procedures for domestic and foreign investors. These
  • 16. MONGOLIA INTERNATIONAL MONETARY FUND 15 discussions have been brought to fruition through the recent adoption of the new Investment Law and the Investment Fund Law. 39. Efforts to strengthen macroeconomics statistics should continue. Good progress is being made in upgrading national accounts and balance of payments statistics, building on recommendations made by technical assistance experts. Timely release of data on DBM spending is needed to facilitate comprehensive assessments of the fiscal policy stance. STAFF APPRAISAL 40. Mongolia continues to be one of the fastest growing economies in Asia. Growth in 2012 and the first half of 2013 was buoyed by the development of new large mining projects, a relatively mild winter boosting agriculture, and highly expansionary fiscal and monetary policies. Inflation fell to a two-year low in July thanks to moderating food prices and the BOM’s price stabilization program. Poverty continued to decline in 2012. 41. However, BOP pressures have been intensifying and inflation is bound to rise again. To cushion the impact on domestic activity of declining FDI and coal exports, monetary and fiscal policy have been loosened markedly. Through mid-year, the resulting BOP pressures were met by intervention, supported by large sovereign and BOM external borrowing. More recently, the exchange rate has been allowed to depreciate, which will likely push up inflation in the coming months. 42. A continuation of current policies could lead to a highly vulnerable situation. The near- term outlook for growth is favorable. However, continued elevated fiscal spending, including through off-budget public investment projects, and failure to rein in credit growth could heighten risks to the economy and the financial sector. Given Mongolia’s exposure to external shocks, this could necessitate a costly and painful adjustment down the road. In particular, the outlook is subject to risks from the uncertain outlook for external demand for commodities which could negatively impact Mongolia via trade and FDI channels. There is also a risk that vulnerabilities in the banking system could be exposed, which could exacerbate a negative shock to growth and financial stability. The IMF/World Bank Debt Sustainability Analysis (DSA) now indicates that Mongolia is at a moderate risk of debt distress. 43. Putting the economy on a sustainable path requires implementation of a package of fiscal and monetary adjustment in the context of a flexible exchange rate regime, as outlined in the “strong policy scenario”. In this regard, some encouraging steps have been taken in recent months, particularly in the areas of fiscal policy and exchange rate policy. This signals a good start by the authorities to initiate the “strong policy scenario,” provided the monetary expansion and off- budget fiscal operations are reined in. 44. An ambitious and credible fiscal consolidation plan should be drawn up. Recently announced steps would moderate spending growth during the remainder of 2013 and provide a solid foundation for the preparation of the 2014 budget. However, further measures are urgently
  • 17. MONGOLIA 16 INTERNATIONAL MONETARY FUND needed. Even with the announced steps, this year’s fiscal deficit (including DBM operations) will still be very large and public debt, including external borrowing by the Bank of Mongolia, will reach about 67 percent of GDP this year, up from 39 percent of GDP in 2011. This raises doubts about the consistency of fiscal policy with the FSL. Budget operations and the operations of the DBM taken together should meet the 2 percent of GDP ceiling for the structural deficit over the next 2-3 years. Given the sustained BOP pressures, the planned adjustment needs to be adequately frontloaded, spearheaded by streamlining subsidies and transfers and reprioritizing capital spending. 45. Reform of the fiscal policy framework should continue. Implementation of the SWL would enhance fiscal flexibility and efficiency and reduce inequality. Establishment of a SWF would be an important complement to the FSL’s countercyclical fiscal policy framework. 46. The large monetary stimulus provided by the BOM should be unwound. The three BOM programs that have been launched over the past year have unduly loosened the monetary policy stance, creating inflationary and BOP pressures. Moreover, they create important distortions, heighten banking sector vulnerabilities, and could give rise to contingent liabilities for the public sector. 47. The increased exchange rate flexibility observed in recent months has helped absorb some of the BOP pressures. The floating exchange rate regime and auction system should be maintained, and intervention should be limited to smoothing excessive exchange rate volatility. While gross reserves remain adequate for precautionary purposes, net international reserves are on a downward trajectory that is not sustainable The real exchange rate is assessed to be moderately overvalued, even in a strong policy scenario which assumes a tightening of monetary and fiscal policy. 48. Efforts to contain financial sector risks should continue. Building on progress in strengthening banks’ capitalization and liquidity, the BOM should strictly enforce existing prudential regulations, including single-borrower limits. Focus should also be on strengthening underwriting practices, loan classifications, and NPL recognition. The BOM should consider phasing in a more forward-looking provisioning scheme that takes into account the risks of losses on performing loans. Lending dollarization should be discouraged. The bank resolution regime should be enhanced, and a legal framework developed for prompt corrective actions that mandates progressively stronger supervisory actions as a bank’s capital declines. Efforts to strengthen the AML/CFT framework need to be stepped up to avoid blacklisting by the FATF. 49. Mongolia’s medium-term prospects remain promising. Mongolia’s large natural resource endowment and its proximity to fast-growing economies provide ample opportunities for development. Mining GDP is projected to expand rapidly during the next five years thanks to large mining projects coming on stream. The sustained growth of activity outside the mining sector would need to be supported by continued reforms to strengthen the business climate, building on the government’s recent success in passing a new investment law. Efforts to strengthen macroeconomic statistics should continue. 50. It is recommended that the next Article IV consultation take place on the standard 12-month cycle.
  • 18. MONGOLIA INTERNATIONAL MONETARY FUND 17 Box 1. The Recent Failure of Savings Bank1 The Bank of Mongolia (BOM) announced on July 22 that it had intervened Savings Bank. Privately- owned Savings Bank accounted for 8 percent of total banking assets (fifth-largest in the country). Reflecting its historically broad branch network, it processed over half of government financial services transactions including payments of pensions, child allowances, and subsidies. The intervention included the appointment of a receiver and transfer of most of the bank’s assets and liabilities to State Bank, a government-owned bank established in 2009 to manage assets and liabilities from two failed banks. Savings Bank’s failure underscores the need to strengthen banking supervision. In its announcement, the BOM indicated that the Savings Bank had faced financial difficulties since 2011. The BOM linked the failure to loans to related interests of the bank’s only shareholder and indicated that the matter would be turned over to relevant law enforcement agencies. The related-party loans in this instance exceeded capital by more than 2 times (compared to the 20 percent of capital limitation on loans to any related parties, and the 5 percent limitation on loans to related parties of the bank). The failure’s impact on macro-financial stability appears to be well-contained. The BOM reports that deposit outflows subsequent to the merger were minimal (including in State Bank). While market observers have highlighted that the unexpected nature of the intervention could undermine confidence in the system as a whole, the BOM notes that the Savings Bank had been under a special supervisory program since 2011. A recapitalization of State Bank in the amount of MNT 205 billion is planned. Accordingly, the Deposit Insurance Corporation would provide these funds to State Bank in the form of financial support and share purchases, financed from a loan from the BOM. This would restore the bank’s CAR to 18 percent, the level before it received the assets and assumed the liabilities of the failed Savings Bank. The authorities expressed a commitment to privatize the State Bank as soon as possible. _________ 1 Prepared by John Quill (MCM).
  • 19. MONGOLIA 18 INTERNATIONAL MONETARY FUND Box 2. Price Stabilization Program, Mortgage Program and Liquidity Injection Over the past year, the BOM has attempted to reduce inflation and spur economic growth using unconventional methods. However, the exceptionally large monetary and quasi-fiscal stimulus provided through various programs risk ratcheting up inflation, adding to BOP pressures, and heightening banking sector vulnerabilities. The total planned allocation under the three programs is equivalent to MNT 3.4 trillion (20 percent of GDP). By end-August, about MNT 3 trillion had been disbursed, causing the BOM’s Net Domestic Assets to rise by more than 100 percent of end-2012 reserve money and raising reserve money growth to 34 percent (y/y):  Price Stabilization Program (PSP). Under this program, launched in late-2012, the BOM provides low- cost funding to corporations whose price-setting behavior has a significant impact on the CPI (e.g. wholesale distributors of meat, flour and imported petroleum products). By end-August, about MNT 0.6 trillion had been channeled through banks, which are charged 0.5-4 percent and, in turn, can charge their corporate customers up to 7 percent.  Liquidity injection. Through August, the BOM provided banks MNT 900 billion in the form of one-year time deposits at 7 percent interest to reverse the downward trend in lending growth.  Mortgage program and housing support supply loans. In mid-June, the BOM launched a MNT 1.1 trillion mortgage lending program, aimed to provide low-cost mortgage loans to qualified consumers. Funding under this program was provided to banks at 4 percent interest, and on-lent by banks through 20-year mortgages at 8 percent interest. In addition, the BOM has provided about MNT 0.4 trillion housing supply support to construction companies and real estate developers. Besides adding to inflationary and BOP pressures, the programs heighten banking sector vulnerabilities. They could also give rise to contingent liabilities for the public sector:  Owing to the lending rate caps, the banks cannot adequately price credit risk.  The mortgage lending and liquidity injection programs create refinancing risk for the banks, in case the BOM withdraws from the programs.  Risks are exacerbated by the fact that loans issued under the programs are exempt from prudential ratios, in particular the single large exposure and related-lending limits. This worsens moral hazard and adverse selection.  Under the mortgage lending program, credit risk is envisaged to be transferred away from the banking system through mortgage-backed securities (MBSs) issued by the Mongolian Mortgage Corporation (MIK) without recourse to the banks. However, in that case the risks would be borne by the potential MBS investors. In view of the subsidized mortgage lending rates, yields on the MBSs may well be too low to attract private investors. Hence, the MBSs would likely remain in the public sector (e.g. BOM, government, or the Social Insurance Fund), giving rise to contingent liabilities. The social objectives pursued by the programs (e.g. making housing more affordable) and efforts to address supply bottlenecks to curb inflation would be best pursued through structural reforms and the government budget. Loans should be transparently priced at market interest, with subsidies provided from the budget.
  • 20. MONGOLIA INTERNATIONAL MONETARY FUND 19 0 0.5 1 1.5 2 2.5 3 3.5 1 2 3 4 5 6 7 8 9 10 11 12 13 14 15 16 17 18 19 20 Impulse Response of EMP to Reserve Money and Credit Growth (1 Cholesky SD) Reserve money growth Credit growth -120 -70 -20 30 80 -40 -30 -20 -10 0 10 20 30 Jan-09 May-09 Sep-09 Jan-10 May-10 Sep-10 Jan-11 May-11 Sep-11 Jan-12 May-12 Sep-12 Jan-13 May-13 EMP(3mma) Credit Growth (y/y, RHS) Reserve money growth(y/y, RHS) Sources: Mongolian authorities; and IMF staff estimates. Exchange Market Pressure Index and Credit Growth Box 3. The Monetary Policy Stance1 An analysis of exchange market pressures and Taylor-type rules suggests that the recent monetary easing implemented through the stimulus programs discussed in Box 2 has been excessive and distortionary. Monetary easing contributing to exchange market pressures. During the first 9 months of 2013, the nominal exchange rate of the togrog depreciated by 19 percent, and gross international reserves declined by 35 percent.  The chart below shows a clear correlation between an index of exchange market pressures (EMP) 2 and credit growth. Specifically, the EMP index started to show sustained depreciation pressures after credit growth accelerated from early 2012. Depreciation pressures intensified from early 2013 with the acceleration of credit growth triggered by the BOM stimulus programs.  A clear empirical association is found between developments in credit growth and reserve money growth on the one hand and the path of the EMP index on the other hand. In particular, a one standard deviation increase in reserve money is associated with an increase in the EMP index by 3½ standard deviations after about 5 months. Similarly, a one standard deviation increase in credit growth is associated with an increase in the EMP index by 2 standard deviations after 6 months. An assessment of policy interest rates based on Taylor-type rules.  Mongolia-specific estimates of Taylor-type rules indicate that the BOM’s monetary policy has been accommodative in recent years. The BOM has typically responded actively to overheating pressures. However, the policy-rate responses to rising inflationary pressures have been less forceful than implied by the Taylor rule. In other words, when inflation increased, real policy interest rates have typically tended to fall.  The interest rates set by the BOM for the monetary stimulus programs deviate substantially from the levels implied by Mongolia-specific estimates of Taylor-type rules. In particular, the interest rate implied by the Taylor-type rule for Mongolia is about 11–12 percent in 2013Q3, while the interest rates charged by the BOM on loans under the price stabilization program, mortgage program, and time deposits are around 1, 4, and 7 percent, respectively. The large deviation of BOM lending rates from the rate implied by the Taylor-rule is likely to raise external, inflationary, and financial risks and distorts the signal of the BOM’s headline policy rate. _________ 1 Prepared by Jiangyan Yu (APD). 2 The EMP index is calculated as the sum of the exchange rate depreciation and the change in reserves (in percent of reserve money). A positive value of the index indicates pressure for depreciation or a loss of reserves. 0 2 4 6 8 10 12 14 16 18 2012M1 2012M2 2012M3 2012M4 2012M5 2012M6 2012M7 2012M8 2012M9 2012M10 2012M11 2012M12 2013M1 2013M2 2013M3 2013M4 2013M5 2013M6 2013M7 Actual and Implied Interest Rates Actural interest rate Implied interest rate BOM Deposit PSP loans Mortgage program
  • 21. MONGOLIA 20 INTERNATIONAL MONETARY FUND Box 4. Exchange Rate Assessment1 Staff’s assessment based on the “strong policy scenario” is that the togrog is moderately overvalued despite the recent real depreciation. This assessment underscores the importance of increased exchange rate flexibility—as observed in the past four months—supported by tighter fiscal and monetary policy. Structural reforms aimed at improving the business climate and trade integration should be pursued with a view to narrowing the medium- term non-mining current account deficit. In the “weak policy scenario” the overvaluation would be considerably higher.  Macro balance approach. On the basis of trade elasticities estimated by Tokarick (2009), the exchange rate would need to depreciate by 12 percent in real terms to close the gap between the medium-term CA deficit in the “strong policy scenario” (15 percent of GDP) and the medium-term norm (a deficit of 7 percent of GDP). In case of looser fiscal policy than the path implied by the FSL and continued monetary easing, the CA deficit would be wider and the overvaluation correspondingly larger.  Equilibrium exchange rate approach. The real exchange rate of the togrog is 12 percent more appreciated than the “equilibrium exchange rate” determined on the basis of a panel regression on a set of macroeconomic fundamentals, including net foreign assets, relative productivity, terms of trade, and government consumption.  External sustainability (ES) approach. The BOM estimates that the FDI and portfolio inflows have pushed Mongolia’s international investment position (IIP) to a net liability position of 126 percent of GDP in 2012. Only a 1 percent real depreciation of the togrog would be needed to stabilize Mongolia’s IIP at this low level. Over time, as Mongolia moves through the mining investment cycle, its IIP can be expected to improve. In that case, the estimated overvaluation of the togrog according to the ES approach can be expected to rise. _________ 1 Prepared by Jiangyan Yu (APD). Estimates of Overvaluation of the Togrog Estimated Overvaluation Approach (in percent) Macro balance 12 Equilibrium exchange rate 12 External sustainability 1 Source: IMF staff estimates. 60 70 80 90 100 110 120 130 140 150 60 70 80 90 100 110 120 130 140 150 Jan-05 Jul-05 Jan-06 Jul-06 Jan-07 Jul-07 Jan-08 Jul-08 Jan-09 Jul-09 Jan-10 Jul-10 Jan-11 Jul-11 Jan-12 Jul-12 Jan-13 Jul-13 REER NEER Sources: Mongolian authorities; and IMF staff estimates. Exchange rates of the togrog (Index, 2005=100, Jan. 2005-Sept. 2013; an increase is an appreciation)
  • 22. MONGOLIA INTERNATIONAL MONETARY FUND 21 0 20 40 60 80 100 120 140 Dec. 2010 Latest 1/ Sources: IFS, IMF; and IMF staff calculations. 1/ Latest: August 2013 (Mongolia), April 2013 (Nepal), March 2013 (Indonesia, PNG, Bangladesh, Cambodia, Lao P.D.R.), February 2013 (Philippines), December 2012 (India, Sri Lanka, Vietnam). Loan-to-Deposit Ratio (In percent) 8 10 12 14 16 18 20 Mongolia Philippines Malaysia Indonesia India CAR Tier1 ratio Capital Adequacy of Asian Banks (In percent, at end-2012) Sources: Mongolian authorities; Haver Analytics; and IMF staff estimates. 0 10 20 30 40 50 60 70 80 90 100 Mongolia Vietnam 1/ Philippines 1/ Lao PDR Cambodia 2007 Latest Sources: Mongolian authorities; CEIC; and IMF staff estimates. 1/ Latest: September 2013 (Mongolia), December 2011 (Vietnam), March 2013 (Philippines, Cambodia), and December 2012 (Lao PDR); the first observation for the Philippines is March 2008. Foreign Currency Deposits to Broad Money (In percent) Box 5. Financial Soundness Indicators and Bank Stress Tests1 Financial soundness indicators improved in 2012 (Table 8). The capital adequacy ratio reached 16 percent of risk-weighted assets at the end of 2012, and Tier 1 capital rose to more than 11 percent. NPLs (including past due loans) declined to 3.8 percent of total loans. However, banking sector vulnerabilities remain significant. Bank credit remains highly concentrated in a few sectors. Unlike in many other Asian countries which have been strengthening their rules and regulations for provisioning, provisioning requirements for performing loans remain zero in Mongolia. On the back of the BOM’s stimulus programs, the loan-to-deposit ratio has surged beyond levels seen in Mongolia’s Asian peers. Dollarization remains higher than in most other Asian countries, potentially giving rise to foreign currency mismatches in the non-bank private sector. Stress tests illustrate prevailing credit risk. As expected, tentative stress tests on bank-by-bank data for general credit risk, sectoral concentration risk and large exposure risk suggest that the banking system would be substantially affected by shocks related to these risks. In a severe stress scenario, simulating the effect of a broad- based shock to credit quality similar to 2008/09, 15 percent of performing loans deteriorate to substandard, 15 percent of substandard loans downgrade to doubtful, 25 percent of doubtful loans deteriorate to loss, and five percent of performing loans deteriorate to loss. In this scenario, two of the 14 banks become insolvent and four others banks see their CAR fall below 8 percent, implying substantial recapitalization needs. Liquidity risk appears limited while data limitations preclude an adequate assessment of exchange rate risk:  In a scenario where deposits are withdrawn for five consecutive days at a rate increasing to 10 percent of deposits on the fifth day, all banks continue to observe the 25 percent minimum liquidity ratio. In a severe scenario similar to the experience in 2008/09 with the daily deposit withdrawal rising to 20 percent of total deposits, one small bank becomes illiquid.  In a scenario with a 20 percent depreciation of the togrog vis-à-vis the U.S. dollar, one small bank sees its capital reduced below the minimum requirement. One small bank and one large bank would need such a recapitalization in case of a 50 percent depreciation. It should be noted that the latter two scenarios do not incorporate the potential indirect impact of the depreciation on loan quality through balance sheet effects affecting unhedged foreign currency borrowers. _________ 1 Prepared by Jongsoon Shin (OAP).
  • 23. MONGOLIA 22 INTERNATIONAL MONETARY FUND -10 -5 0 5 10 15 20 25 -10 -5 0 5 10 15 20 25 2008Q1 2008Q2 2008Q3 2008Q4 2009Q1 2009Q2 2009Q3 2009Q4 2010Q1 2010Q2 2010Q3 2010Q4 2011Q1 2011Q2 2011Q3 2011Q4 2012Q1 2012Q2 2012Q3 2012Q4 2013Q1 2013Q2 Agriculture Non-miningindustry Services Net taxes Mining industry GDP at market prices (y/y growth) Sources: Mongolian authorities. Real GDP Growth (Contribution and year-on-year percentage change, 2008Q1-2013Q2) Figure 1. Real Sector Developments The economy expanded by 11½ percent during the first half of 2013 despite slowing FDI inflows and exports. Mongolia’s growth has been impressive. Growth reaccelerated to 14.3 percent (y/y) in the second quarter of 2013 from 7.2 percent (y/y) in the first quarter. FDI inflows are down 46 percent so far this year. Coal export volumes are down 20 percent so far this year. However, they appear to be bottoming out. The nominal exchange rate has depreciated 22 percent over the past 12 months, despite sustained BOM interventions. Aided by a deceleration of food prices, inflation has come down and stood at 8.4 percent in September (y/y). -5 0 5 10 15 20 -5 0 5 10 15 20 2001 2002 2003 2004 2005 2006 2007 2008 2009 2010 2011 2012 China Mongolia Sources: Mongolian authorities; and IMF staff estimates. Real GDP Growth Rate: China vs. Mongolia (Year-on-year percent change) 0 200 400 600 800 1,000 1,200 1,400 1,600 0 200 400 600 800 1,000 1,200 1,400 1,600 2008Q1 2008Q2 2008Q3 2008Q4 2009Q1 2009Q2 2009Q3 2009Q4 2010Q1 2010Q2 2010Q3 2010Q4 2011Q1 2011Q2 2011Q3 2011Q4 2012Q1 2012Q2 2012Q3 2012Q4 2013Q1 2013Q2 2013Q3 Foreign Direct Investment 1/ (In millions of U.S. dollars, 2008 Q1- 2013 Q3) Source: Mongolian authorities; and IMF staff estimates. 1/ Observation for the third quarter of 2013 is a projection based on outturns for July and August. -60 -40 -20 0 20 40 60 80 100 120 -60 -40 -20 0 20 40 60 80 100 120 Jan-11 Apr-11 Jul-11 Oct-11 Jan-12 Apr-12 Jul-12 Oct-12 Jan-13 Apr-13 Jul-13 volume growth (y/y, 3mma) volume growth (y/y, 12mma) Sources: Mongolian authorities; and IMF staff estimates. Coal Export Volume (Change, in percent, January 2011-September2013) 1,300 1,350 1,400 1,450 1,500 1,550 1,600 1,650 1,700 1,750-80 -60 -40 -20 0 20 40 60 80 100 Nov-11 Jan-12 Mar-12 May-12 Jul-12 Sep-12 Nov-12 Jan-13 Mar-13 May-13 Jul-13 Sep-13 Nov-13 Total Intervention sales (in US$m, LHS) of which: Intervention conducted in RMB (in US$m, LHS) MNT/US$-exchange rate (RHS, inverted scale) Sources: Mongolian authorities. MNT/US$-rate and BOM Foreign Exchange Sales (November 1, 2011-November 1, 2013) -5 0 5 10 15 20 25 30 35 40 -5 0 5 10 15 20 25 30 35 40 Dec-07 Mar-08 Jun-08 Sep-08 Dec-08 Mar-09 Jun-09 Sep-09 Dec-09 Mar-10 Jun-10 Sep-10 Dec-10 Mar-11 Jun-11 Sep-11 Dec-11 Mar-12 Jun-12 Sep-12 Dec-12 Mar-13 Jun-13 Sep-13 Non-food items (contribution to headline CPI) Food items (contribution to headline CPI) Headline CPI (y/y) Non-food CPI (y/y) Food CPI (y/y) Sources: Mongolian authorities; and IMF staff estimates. Consumer Price Inflation (in percent, December 2007-September 2013)
  • 24. MONGOLIA INTERNATIONAL MONETARY FUND 23 0 10 20 30 40 50 60 70 0 10 20 30 40 50 60 70 2005 2006 2007 2008 2009 2010 2011 2012 Nominal public debt NPV of public debt Public Debt (in percent of GDP) Sources: Mongolian authorities; and IMF staff esimates. 70 80 90 100 110 120 130 140 70 80 90 100 110 120 130 140 Dec-07 Mar-08 Jun-08 Sep-08 Dec-08 Mar-09 Jun-09 Sep-09 Dec-09 Mar-10 Jun-10 Sep-10 Dec-10 Mar-11 Jun-11 Sep-11 Dec-11 Mar-12 Jun-12 Sep-12 Dec-12 Mar-13 Jun-13 Sep-13 8-year average Headline Loan-To-Deposit Ratio Commercial Banks' Loan-To-Deposit (L/D) Ratio (Dec. 2007-Sep. 2013) Sources: Mongolian authorities; and IMF staff estimates. Figure 2. Fiscal and Monetary Sector Developments Fiscal and monetary policies have been expansionary over the past two years. Including DBM spending, the overall fiscal deficit reached 10.9 percent of GDP in 2012. The nonmineral fiscal deficit exceeded the 2008 high. Spending exceeded 57 percent of non-mineral GDP in 2012 The Chinggis bond (US$1.5bn) and DBM bond (US$0.6bn) raised public debt. The growth of private sector credit accelerated to 48 percent in September (y/y). Deposit growth stood at 20 percent (y/y) Banks’ loan-to-deposit ratio has now risen substantially above the longer-term average. -15 -10 -5 0 5 10 -15 -10 -5 0 5 10 2005 2006 2007 2008 2009 2010 2011 2012 On-budget overall balance Increase in deficit owing to DBM spending Sources: Mongolian authorities; and IMF staff estimates. Fiscal Balance (in percent of GDP) -25 -20 -15 -10 -5 0 -25 -20 -15 -10 -5 0 2005 2006 2007 2008 2009 2010 2011 2012 Nonmineral (NM) on-budget balance Larger NM deficit due to DBM spending Sources: Mongolian authorities; and IMF staff estimates. Nonmineral Fiscal Balance (in percent of nonmineral GDP) 0 10 20 30 40 50 60 70 0 10 20 30 40 50 60 70 2005 2006 2007 2008 2009 2010 2011 2012 Nonmineral revenue On-budget expenditure DBM spending 1/ Sources: Mongolian authorities; and IMF staff estimates. 1/The Development Bank of Mongolia provided loans of US$ 190 million for nonrevenue-generatingpublic investment projectssuch as roads ("socialbenefit projects") in 2012. Thebudget will need to repay these loans. Nonmineral Revenue and Expenditure (in percent of nonmineral GDP) -40 -20 0 20 40 60 80 100 120 140 -40 -20 0 20 40 60 80 100 120 140 Dec-07 Mar-08 Jun-08 Sep-08 Dec-08 Mar-09 Jun-09 Sep-09 Dec-09 Mar-10 Jun-10 Sep-10 Dec-10 Mar-11 Jun-11 Sep-11 Dec-11 Mar-12 Jun-12 Sep-12 Dec-12 Mar-13 Jun-13 Sep-13 Credit Deposits Sources: Mongolian authorities; and IMF staff estimates. Bank Credit and Deposits (Quarter-on-quarter change, in percent (saar), Dec. 2007-Sep. 2013)
  • 25. MONGOLIA 24 INTERNATIONAL MONETARY FUND Figure 3. External Sector Developments Expansionary policies have kept the trade deficit over US$2 billion. Imports continue to contract, in line with the decline in FDI. Export growth has turned positive on the start of operations of the OT open pit mine. The 12-month trade deficit remains over US$2 billion… …and the current account remains significantly in deficit even as imports for the FDI-financed OT mine wind down. International bond proceeds raised reserves in late-2012. Since then there has been a rapid loss of reserves. Mongolia’s sovereign spread is now about 140 basis points wider than the average for emerging market economies. Stock prices of 3 mining companies operating mostly in Mongolia (MMC, TRQ, and South Gobi) have slumped. -60 -40 -20 0 20 40 60 80 100 120 140 -60 -40 -20 0 20 40 60 80 100 120 140 Dec-07 Mar-08 Jun-08 Sep-08 Dec-08 Mar-09 Jun-09 Sep-09 Dec-09 Mar-10 Jun-10 Sep-10 Dec-10 Mar-11 Jun-11 Sep-11 Dec-11 Mar-12 Jun-12 Sep-12 Dec-12 Mar-13 Jun-13 Sep-13 Exports Imports Sources: Mongolian authorities; and IMF staff estimates. Imports and Exports (Twelve-month percentage change in 3mma, Dec. 2007-Sept. 2013) -6,000 -5,000 -4,000 -3,000 -2,000 -1,000 01,000 2,000 3,000 4,000 5,000 6,000 7,000 8,000 Dec-07 Mar-08 Jun-08 Sep-08 Dec-08 Mar-09 Jun-09 Sep-09 Dec-09 Mar-10 Jun-10 Sep-10 Dec-10 Mar-11 Jun-11 Sep-11 Dec-11 Mar-12 Jun-12 Sep-12 Dec-12 Mar-13 Jun-13 Sep-13 Trade balance (RHS, inverted scale) Exports (LHS) Imports (LHS) Trade Balance (12-month rolling sums, in US$m, Dec. 2007- Sept . 2013) Sources: Mongolian authorities; and IMF staff estimates. -40 -35 -30 -25 -20 -15 -10 -5 0 5 10 -4,000 -3,500 -3,000 -2,500 -2,000 -1,500 -1,000 -500 0 500 1,000 2003 2004 2005 2006 2007 2008 2009 2010 2011 2012 Transfers, net Income, net Goods and services, net Current account Current account (RHS, in percent of GDP) Current Account (In millions of U.S. dollars, 2003-2012) Sources: Mongolian authorities; and IMF staff estimates. 0 500 1,000 1,500 2,000 2,500 3,000 3,500 4,000 4,500 Jan-09 Apr-09 Jul-09 Oct-09 Jan-10 Apr-10 Jul-10 Oct-10 Jan-11 Apr-11 Jul-11 Oct-11 Jan-12 Apr-12 Jul-12 Oct-12 Jan-13 Apr-13 Jul-13 Oct-13 GIR (BOM definition) Sources: Mongolian authorities. Gross International Reserves (In millions of U.S. dollars, Jan. 1, 2009 - Oct. 30, 2013) 0 100 200 300 400 500 600 700 0 100 200 300 400 500 600 700 Jan-12 Feb-12 Mar-12 Apr-12 May-12 Jun-12 Jul-12 Aug-12 Sep-12 Oct-12 Nov-12 Dec-12 Jan-13 Feb-13 Mar-13 Apr-13 May-13 Jun-13 Jul-13 Aug-13 Sep-13 Oct-13 Mongolia Philippines Emerging mrkts. (EMEs) Sri Lanka Vietnam Mongolia spread over EMEs Source: Bloomberg LP. JP Morgan EMBI Global Sovereign Spreads (in basis points, January 1, 2012-October 30, 2013) 0 20 40 60 80 100 120 140 160 0 20 40 60 80 100 120 140 160 Jan-08 Jan-09 Jan-10 Jan-11 Jan-12 Jan-13 Mong. Mining Corp. (MMC, in HK) Turquoise Hill (TRQ, in Toronto) South Gobi (in HK) Rio Tinto (London) Sources: Bloomberg LP.; and IMF staff estimates. Stock Prices for Mining Companies (Index, January 1, 2011=100, Jan. 1, 2008-Oct. 30, 2013) Return since Jan.1, 2011 (in percent) _ MMC (coal) -86 TRQ (copper) -77 South Gobi(coal) -91 Rio Tinto (diverse) -27 Copper price -26
  • 26. MONGOLIA INTERNATIONAL MONETARY FUND 25 -6 -4 -2 0 2 4 Pakistan China Vietnam Chile Thailand Colombia Peru Sri Lanka Mongolia Source: IMF, WEO. Change in Unemployment Rate, 2007-12 (In percentage points) 0.0 0.1 0.2 0.3 0.4 0.5 0.6 0.7 0.8 0.9 Chile Kazakhstan Peru SriLanka Mongolia India LaoP.D.R. Cambodia Pakistan Bangladesh Myanmar Nepal HDI, 2012 Average HDI (1990-2012) Source: Human Development Report 2012 (UNDP). Human Development Index (HDI) -10 0 10 20 30 40 50 60 70 -10 0 10 20 30 40 50 60 70 Myanmar Mongolia SriLanka Pakistan Vietnam India Bangladesh Cambodia Peru Chile Source: IMF, WEO database. Highest Lowest Inflation, 1995-2012 (In percent, average) -12 -10 -8 -6 -4 -2 0 2 4 6 -12 -10 -8 -6 -4 -2 0 2 4 6 Lao P.D.R. (2002-2008) Mongolia (2002-2008) India (2005-2010) Pakistan (2002-2008) Bangladesh (2000-2010) Vietnam (2002-2008) Chile (2003-2009) Sri Lanka (2002-2010) Cambodia (2004-2009) Kazachstan (2002-2009) Peru (2002-2010) Nepal (2003-2010) Source: World Development Indicators. Change in Gini Index (in Gini points) Bangladesh Cambodia Chile India KazakhstanLao P.D.R. Mongolia Nepal Pakistan Peru 2 3 4 5 6 0 1 2 3 4 5 Education Healthcare Public Expenditure on Health Care and Education (In percent of GDP, 2011 or latest available year) Source: World Development Indicators. Figure 4. Inclusive Growth Indicators Poverty and unemployment show encouraging trends but rising inequality suggests that there is scope to make growth more inclusive. Poverty continued to decline in 2012, owing to rapid growth Unemployment rate also declined with high growth. However, inequality has been on the rise… …despite relatively high social spending. Mongolia has relatively high human capital.. But inflation volatility remains high, hurting the poor.
  • 27. MONGOLIA 26 INTERNATIONAL MONETARY FUND Nominal GDP (2012): US$10,258 million 1/ Quota: SDR 51.1 million Population, end-year (2011): 2.8 million Outstanding use of IMF resources: SDR 57.49 million Per capita GDP (2012): US$3,651 1/ (as of September 30, 2013) Poverty incidence (2012): 27.4 percent 2/ Proj. Proj. 2009 2010 2011 2012 2013 2014 Real sector Real GDP growth -1.3 6.4 17.5 12.3 11.8 9.6 Mineral 5.8 3.6 7.3 8.9 16.1 33.4 Non-mineral -2.7 7.0 19.7 12.9 11.0 5.0 Consumer prices (period average) 6.3 10.2 7.7 15.0 9.7 11.1 Consumer prices (end-period) 1.9 14.3 9.4 14.2 11.7 11.0 GDP deflator 1.8 20.0 12.1 12.0 7.4 11.0 General government budget Revenue and grants 30.3 37.1 40.3 35.7 34.4 32.9 Expenditure and net lending 35.5 36.6 45.1 46.6 47.9 40.3 Current balance 2.8 9.8 11.0 3.7 6.7 8.7 Primary balance -4.7 1.0 -4.4 -10.0 -11.1 -4.6 Overall balance (including grants) -5.2 0.5 -4.8 -10.9 -13.5 -7.4 Non-mineral overall balance -13.0 -10.5 -14.0 -16.9 -18.9 -12.6 Structural balance 3/ … … -6.9 -11.5 -13.7 -7.5 Money and credit Broad money 26.9 61.6 37.1 18.8 17.1 28.8 Private credit 0.4 21.5 72.3 24.1 40.9 16.1 Interest rate on 7-day central bank bills, end-period (percent) 10.00 11.00 12.25 13.25 … … Balance of payments Current account balance (including official transfers) -410 -931 -2,759 -3,362 -3,470 -2,319 (In percent of GDP) -9.0 -14.9 -31.7 -32.8 -31.6 -20.3 (In percent of GDP, excluding mining related imports) -5.8 -5.7 -3.0 -7.2 -14.1 -4.6 Trade balance -194 -278 -993 -1,553 -1,425 -267 Exports 1,876 2,899 4,817 4,385 4,193 5,435 Imports -2,070 -3,177 -5,810 -5,938 -5,618 -5,702 Foreign direct investment 496 1,574 4,620 4,408 2,032 1,199 Gross official international reserves (end-period) 1,145 2,490 2,630 4,126 2,214 2,290 (In months of next year's imports of goods and services) 3.5 3.9 3.9 6.5 3.4 3.3 Trade prices Export prices (US$, percent change) -8.1 23.8 39.5 -12.0 -14.9 -5.9 Import prices (US$, percent change) -36.3 27.9 31.6 1.0 -2.4 -4.4 Terms of trade (percent change) 44.3 -3.3 6.0 -12.8 -12.8 -1.6 Public and publicly guaranteed debt Total public debt 48.5 35.9 38.8 63.0 67.3 65.8 Domestic debt 3.4 5.1 10.9 14.7 15.5 15.1 External debt 45.2 30.8 27.9 48.3 51.8 50.7 (In millions of U.S. dollars) 2,064 2,061 2,219 4,837 4,988 5,636 Exchange rate Togrogs per U.S. dollar (end of period) 1,443 1,257 1,396 1,392 ... ... Togrogs per U.S. dollar (period average) 1,441 1,348 1,273 1,359 ... ... Nominal effective exchange rate (period average; percent change) -15.8 3.4 3.1 -5.1 ... ... Real effective exchange rate (period average; percent change) -11.2 11.2 8.6 2.9 ... ... Nominal GDP (in billions of togrogs) 6,591 8,415 11,088 13,944 16,691 20,352 Sources: Mongolian authorities; and IMF staff projections. 1/ Estimate, based on period average exchange rate. 2/ Based on the 2012 Household Socio-Economic Survey. 3/ As defined in the Fiscal Stability Law (FSL), which uses smoothed instead of actual commodity prices to calculate revenue. Table 2. Mongolia: Selected Economic and Financial Indicators, 2009–14 (Strong Policy Scenario) (In millions of US$) (Percent change) (In percent of GDP) (Percent change) (In percent of GDP)
  • 28. MONGOLIA INTERNATIONAL MONETARY FUND 27 2014 2009 2010 2011 Budget Est. Budget Proj. Proj. Total revenue and grants 1,994 3,122 4,468 6,326 4,976 7,238 5,746 6,706 Current revenue 1,973 3,078 4,455 6,325 4,941 7,237 5,737 6,694 Tax revenue and social security contributions 1,621 2,688 3,909 5,255 4,291 6,631 4,988 5,801 Income taxes 520 975 919 1,048 895 1,300 1,195 1,346 Social security contributions 264 331 473 520 674 732 792 848 Sales tax and VAT 326 579 1,114 1,786 1,297 1,940 1,438 1,744 Excise taxes 167 269 294 361 312 595 454 532 Customs duties and export taxes 116 193 337 592 327 575 354 422 Other taxes 228 341 772 948 786 1,489 755 910 Non-tax revenue 352 390 545 1,071 650 606 748 893 Capital revenue and grants 21 44 14 1 35 1 10 12 Total expenditure and net lending 2,337 3,081 4,997 6,468 6,494 7,445 8,000 8,205 Current expenditure 1,788 2,257 3,236 4,525 4,428 4,906 4,624 4,931 Wages and salaries 576 648 802 1,230 1,197 1,406 1,406 1,420 Purchase of goods and services 394 519 702 864 855 1,074 976 1,047 Subsidies to public enterprises 36 81 123 109 127 186 169 181 Transfers 753 967 1,572 2,129 2,123 1,842 1,675 1,712 Interest payments 30 42 37 192 126 398 398 570 Capital expenditure and net lending 548 824 1,761 1,943 2,065 2,539 3,376 3,274 Capital expenditure 461 591 1,281 2,001 1,784 2,489 2,576 2,696 Domestically-financed 434 577 1,229 1,818 1,428 2,119 1,619 2,066 Foreign-financed 27 13 51 183 356 370 957 630 o/w DBM/Chinggis bond social benefit projects 258 750 562 Net lending 88 233 480 -58 282 50 800 579 o/w DBM/Chinggis on-lending 217 750 562 Overall balance (incl. grants) -343 42 -529 -142 -1,518 -206 -2,254 -1,499 Non-mineral overall balance -857 -882 -1,555 -1,258 -2,352 -1,295 -3,152 -2,556 Structural balance … … -770 -464 -1,605 -376 -2,288 -1,529 Financing 343 -42 529 142 1,640 206 2,254 1,499 Foreign (net) 219 31 199 130 3,044 413 380 1,155 Domestic (net) 124 -73 330 12 -1,404 -207 1,874 344 Privatization receipts (valuation adj.) -1 3 14 98 1 20 0 0 Domestic bank financing (net) 198 -112 95 -286 -1,694 39 1,958 729 Domestic non-bank financing (net) -73 36 461 522 376 -95 -50 -355 Stabilization fund accumulation 0 0 -241 -322 -87 -170 -34 -30 Total revenue and grants 30.3 37.1 40.3 45.4 35.7 41.0 34.4 32.9 Current revenue 29.9 36.6 40.2 45.4 35.4 41.0 34.4 32.9 Tax revenue and social security contributions 24.6 31.9 35.3 37.7 30.8 37.6 29.9 28.5 Non-tax revenue 5.3 4.6 4.9 7.7 4.7 3.4 4.5 4.4 Capital revenue and grants 0.3 0.5 0.1 0.0 0.3 0.0 0.1 0.1 Total expenditure and net lending 35.5 36.6 45.1 46.4 46.6 42.2 47.9 40.3 Current expenditure 27.1 26.8 29.2 32.4 31.8 27.8 27.7 24.2 Of which: Wages and salaries 8.7 7.7 7.2 8.8 8.6 8.0 8.4 7.0 Capital expenditure and net lending 8.3 9.8 15.9 13.9 14.8 14.4 20.2 16.1 Overall balance (incl. grants) -5.2 0.5 -4.8 -1.0 -10.9 -1.2 -13.5 -7.4 Non-mineral overall balance (incl. grants) -13.0 -10.5 -14.0 -9.0 -16.9 -7.3 -18.9 -12.6 Structural balance … … -6.9 -3.3 -11.5 -2.0 -13.7 -7.5 Financing 5.2 -0.5 4.8 1.0 11.8 1.2 13.5 7.4 Foreign (net) 3.3 0.4 1.8 0.9 21.8 2.3 2.3 5.7 Domestic (net) 1.9 -0.9 3.0 0.1 -10.1 -1.2 11.2 1.7 Banking system (net) 3.0 -1.3 0.9 -2.1 -12.1 0.2 11.7 3.6 Non-bank -1.1 0.5 4.3 4.5 2.7 -0.4 -0.3 -1.7 Stabilization fund accumulation 0.0 0.0 -2.2 -2.3 -0.6 -1.0 -0.2 -0.1 Memorandum items (in percent of GDP unlesss defined otherwise): Off-budget spending from DBM/Chinggis bonds … … … … 3.4 … 9.0 5.5 Structural balance (FSL definition: excluding off-budget spending) … … -6.9 … -8.1 … -4.7 -2.0 Mineral revenue 7.8 11.0 9.3 8.0 6.0 6.2 5.4 5.2 Non-mineral revenue (in percent of non-mineral GDP) 27.9 33.8 39.3 45.9 36.5 44.5 35.1 35.0 Total expenditure (in percent of non-mineral GDP) 44.0 47.4 57.1 57.0 57.2 53.9 57.9 50.9 Non-mineral overall balance (in percent of non-mineral GDP) -16.2 -13.6 -17.8 -11.1 -20.7 -9.4 -22.8 -15.9 Nominal GDP (in billions of togrogs) 6,591 8,415 11,088 13,944 13,944 17,649 16,691 20,352 Copper price (Market, US$ per ton) 5,165 7,538 8,823 8,657 7,959 8,152 7,185 6,855 (Structural, US$ per ton) … … 5,709 6,461 5,868 6,329 5,933 6,066 Primary spending (change in percent) -6 32 63 27 28 11 19 0 Sources: Mongolian authorities; and IMF staff projections. Table 3. Mongolia: Summary Operations of the General Government, 2009–14 (Strong Policy Scenario) 20132012 (In billions of togrogs) (In percent of GDP)
  • 29. MONGOLIA 28 INTERNATIONAL MONETARY FUND 2009 2010 2011 2012 2013 2014 Revenue 1,990 3,065 4,458 4,965 5,737 6,694 Expenditure 2,247 2,813 4,468 6,201 7,191 7614.6 Expense 1,792 2,254 3,199 4,428 4,624 4,931 Net acquisition of nonfinancial assets 455 559 1,269 1,773 2,566 2,684 Operating balance 198 811 1,259 537 1,112 1,763 Net lending/borrowing (overall balance) -257 252 -49 -1,358 -1,454 -921 Net acquisition of financial assets 205 175 707 368 834 608 Net incurrence of liabilities 462 -77 756 1,726 2,288 1,529 Domestic 162 30 557 -1,318 1,908 374 Foreign 300 -107 199 3,044 380 1,155 Revenue 30.2 36.4 40.2 35.6 34.4 32.9 Income tax 7.9 11.6 8.3 6.4 7.2 6.6 VAT 4.9 6.9 10.1 9.3 8.6 8.6 Excise tax 2.5 3.2 2.7 2.2 2.7 2.6 Customs and import duty 1.7 2.3 3.0 2.3 2.1 2.1 Royalty 2.2 2.4 5.3 4.0 2.7 2.8 Social contributions 3.9 3.8 4.3 4.8 4.7 4.2 Others 7.0 6.2 6.6 6.5 6.3 6.1 Expense 27.2 26.8 28.9 31.8 27.7 24.2 Compensation of employees 8.8 7.7 7.2 8.6 8.4 7.0 Use of goods and services 5.9 6.2 6.3 6.1 5.8 5.1 Interest 0.4 0.5 0.0 0.9 2.4 2.8 Subsidies 0.6 1.0 1.1 0.9 1.0 0.9 Social benefit 11.5 11.4 14.2 15.2 10.0 8.4 Net acquisition of nonfinancial assets 6.9 6.6 11.4 12.7 15.4 13.2 Operating balance 3.0 9.6 11.4 3.9 6.7 8.7 Net lending/borrowing (overall balance) -3.9 3.0 -0.4 -9.7 -8.7 -4.5 Net acquisition of financial assets 3.1 2.1 6.4 2.6 5.0 3.0 Policy lending 1.3 2.8 4.3 2.0 4.8 2.8 Stabilization fund 0.0 0.0 2.2 0.6 0.2 0.1 Net incurrence of liabilities 7.0 -0.9 6.8 12.4 13.7 7.5 Domestic 2.5 0.4 5.0 -9.4 11.4 1.8 Foreign 4.5 -1.3 1.8 21.8 2.3 5.7 Stock positions: Net financial worth -0.3 2.8 1.6 -8.4 -15.8 -17.4 Financial assets 59.4 48.6 43.3 37.0 35.9 32.5 Currency and deposits 20.4 16.3 14.5 12.2 10.4 8.7 Securities other than shares 0.1 0.1 0.1 0.0 0.0 0.0 Loans 28.4 24.1 22.6 20.0 21.5 20.5 Shares and other equity 0.0 0.0 -0.1 -0.1 -0.1 -0.1 Other accounts receivable 10.4 8.2 6.2 4.9 4.1 3.4 Liabilities 59.7 45.8 41.6 45.5 51.7 49.9 Securities other than shares 11.3 8.5 9.3 33.0 29.9 29.8 Loans 45.0 34.7 30.3 10.9 20.5 19.0 Other accounts payable 3.4 2.6 2.0 1.6 1.3 1.1 Sources: Mongolian authorities; and IMF staff projections. Table 4. Mongolia: Statement of Operations and Stock Positions of the General Government, 2009–14 (Strong Policy Scenario) (In billions of togrogs) (In percent of GDP) Proj.
  • 30. MONGOLIA INTERNATIONAL MONETARY FUND 29 Proj. Proj. 2009 2010 2011 2012 2013 2014 Monetary survey Broad money 2,880 4,655 6,381 7,582 8,878 11,434 Currency 285 390 519 606 591 662 Deposits 2,595 4,266 5,862 6,976 8,287 10,772 Net foreign assets 1,520 2,728 3,057 4,615 1,460 1,740 Net domestic assets 1,359 1,927 3,324 2,967 7,418 9,694 Domestic credit 1,987 2,448 4,295 3,984 8,780 11,072 Net credit to government -717 -836 -1,364 -3,042 -1,119 -419 Claims on non-banks 2,704 3,284 5,660 7,026 9,899 11,492 Other items, net -627 -521 -971 -1,017 -1,362 -1,379 Monetary authorities Reserve money 733 947 1,662 2,168 2,432 2,722 Net foreign assets 1,526 2,518 3,034 5,155 2,287 2,564 BOM defined reserves 1,652 2,628 3,153 5,744 3,836 4,195 Other assets, net -126 -110 -119 -588 -1,549 -1,631 Net domestic assets -793 -1,571 -1,372 -2,987 146 158 Net credit to government -265 -493 -708 -2,776 -1,497 -912 Claims on deposit money banks 198 131 342 401 2,394 2,122 Minus: Central bank bills (net) 393 1,101 879 752 900 1,201 Other items, net -333 -109 -127 141 149 149 Memorandum items: Annual broad money growth 26.9 61.6 37.1 18.8 17.1 28.8 Annual reserve money growth 26.4 29.2 75.5 30.5 12.2 11.9 Velocity 1.7 1.8 1.7 1.8 1.9 1.8 Claims on non-banks growth 0.4 21.5 72.3 24.1 40.9 16.1 Claims on non-banks (in percent of GDP) 54.5 39.0 51.0 50.4 59.3 56.5 Total loans/deposits 104.2 77.0 96.5 100.7 119.5 106.7 Sources: Mongolian authorities; and IMF staff projections. Table 5. Mongolia: Monetary Aggregates, 2009−14 (Strong Policy Scenario) (In billions of togrog, end of period) (In percent, unless otherwise indicated)
  • 31. MONGOLIA 30 INTERNATIONAL MONETARY FUND 2011 2012 2013 2014 2015 2016 2017 2018 (In millions of U.S. dollars, unless otherwise indicated) Current account balance (including official grants) -2,759 -3,362 -3,470 -2,319 -2,283 -2,855 -2,251 -2,328 Trade balance -993 -1,553 -1,425 -267 -19 -435 234 146 Exports 4,817 4,385 4,193 5,435 6,129 5,987 7,038 7,304 Mineral export 1/ 4,302 4,032 3,868 5,128 5,807 5,658 6,700 6,956 Non-mineral export 515 353 325 307 322 329 338 348 Imports -5,810 -5,938 -5,618 -5,702 -6,148 -6,422 -6,804 -7,158 Oil imports -1,135 -1,393 -1,430 -1,479 -1,570 -1,668 -1,781 -1,872 Food imports -476 -565 -534 -547 -591 -627 -682 -724 For investment in mining 2/ -2,493 -2,627 -1,923 -1,798 -1,874 -1,777 -1,706 -1,679 Other -1,706 -1,353 -1,731 -1,878 -2,113 -2,350 -2,636 -2,883 Services, net -1,161 -1,100 -1,236 -1,089 -1,135 -1,234 -1,306 -1,282 Income, net -843 -948 -956 -1,107 -1,274 -1,332 -1,327 -1,341 Current transfers 244 237 147 145 145 146 148 149 General government 3/ 24 34 22 19 18 18 19 20 Other sectors 220 203 125 126 127 128 129 130 Of which: Workers remittances 58 41 104 104 105 106 106 107 Capital and financial account 2,864 4,929 1,651 2,456 2,174 3,045 2,475 2,558 Capital account 114 120 124 128 132 136 140 144 Financial account 2,750 4,809 1,527 2,328 2,042 2,910 2,335 2,414 Direct investment 4,620 4,408 2,032 1,199 1,437 1,661 1,838 1,990 Portfolio investment 77 2,325 634 764 936 947 1,121 881 Trade credits, net -406 53 21 -42 -54 -61 -60 -70 Currency and deposits, net -2,012 -2,473 -2,286 -1,344 -1,229 -1,224 -1,202 -1,195 Loans, net 469 496 1,273 835 334 986 508 823 Other, net 2 0 -147 915 619 601 129 -15 Errors and omissions 38 -36 0 0 0 0 0 0 Overall balance 144 1,531 -1,820 137 -109 191 223 229 Financing -144 -1,531 1,820 -137 109 -191 -223 -229 Gross official reserves (- increase) -140 -1,497 1,912 -76 112 -191 -223 -229 Use of IMF credit (+) -4 -35 -92 -61 -3 0 0 0 Memoranda items: Current account balance (in percent of GDP) -31.7 -32.8 -31.6 -20.3 -18.3 -21.5 -15.3 -14.6 Gross official reserves (end-period) 2,630 4,126 2,214 2,290 2,178 2,369 2,592 2,821 (In months of next year's imports of goods and se 3.9 6.5 3.4 3.3 3.0 3.0 3.2 3.2 Copper price (in U.S. dollars per ton) 8,823 7,959 7,185 6,855 6,921 6,975 7,031 7,091 Oil price (in U.S. dollars per barrel) 104 105 102 98 93 90 87 85 Gold price (in U.S. dollars per troy oz.) 1,569 1,669 1,386 1,251 1,267 1,284 1,308 1,336 Nominal GDP (in millions of U.S. dollars) 8,709 10,258 10,982 11,417 12,494 13,286 14,701 15,918 Sources: Mongolian authorities; and IMF staff projections. 1/ Including copper, coal, gold and others. 2/ This covers Oyu Tolgoi copper project and Tavan Tolgoi coal project. 3/ Starting in 2009, investment-related grants have been reclassified in the capital account per BPM5. Table 6. Mongolia: Balance of Payments, 2011–18 (Strong Policy Scenario) Projections
  • 32. MONGOLIA INTERNATIONAL MONETARY FUND 31 2009 2010 2011 2012 2013 2014 2015 2016 2017 2018 Real sector Nominal GDP (in billions of togrogs) 6,591 8,415 11,088 13,944 16,691 20,352 23,513 26,258 30,358 34,125 Per capita GDP (in US$) 2/ 1,684 2,261 3,097 3,595 3,791 3,883 4,187 4,386 4,782 5,147 Real GDP growth (percent change) -1.3 6.4 17.5 12.3 11.8 9.6 7.0 5.2 8.5 6.0 Mineral real GDP growth 5.8 3.6 7.3 8.9 16.1 33.4 7.2 -2.1 14.9 1.8 Non-mineral real GDP growth -2.7 7.0 19.7 12.9 11.0 5.0 7.0 7.0 7.0 7.0 GDP deflator (percent change) 1.8 20.0 12.1 12.0 7.4 11.0 8.0 6.2 6.6 6.0 Consumer prices 1.9 14.3 9.4 14.2 11.7 11.0 7.4 6.7 6.6 5.5 (End-period; percent change) General government accounts Total revenue and grants 30.3 37.1 40.3 35.7 34.4 32.9 32.9 34.0 34.2 33.5 Mineral revenue 7.8 11.0 9.3 6.0 5.4 5.2 5.2 6.1 6.8 6.7 Non-mineral revenue 22.4 26.1 31.0 29.7 29.0 27.8 27.7 27.9 27.4 26.8 Total expenditure and net lending 35.5 36.6 45.1 46.6 47.9 40.3 36.7 35.7 36.0 35.5 Primary balance -4.7 1.0 -4.4 -10.0 -11.1 -4.6 -0.9 1.2 1.1 0.6 Overall balance -5.2 0.5 -4.8 -10.9 -13.5 -7.4 -3.8 -1.7 -1.8 -2.0 Non-mineral overall balance -13.0 -10.5 -14.0 -16.9 -18.9 -12.6 -9.0 -7.9 -8.6 -8.7 Structural balance … … -6.9 -11.5 -13.7 -7.5 -4.2 -2.0 -2.0 -2.0 Non-mineral revenue and grants 28.2 34.4 39.3 36.7 35.1 35.0 34.8 34.0 33.8 32.6 Total expenditure and net lending 44.0 47.4 57.1 57.2 57.9 50.9 46.1 43.6 44.5 43.1 Non-mineral overall balance -16.2 -13.6 -17.8 -20.7 -22.8 -15.9 -11.3 -9.6 -10.7 -10.6 Monetary sector Broad money (percent change) 26.9 61.6 37.1 18.8 17.1 28.8 Velocity (GDP/M2) 2.3 1.8 1.7 1.8 1.9 1.8 Balance of payments Current account balance -9.0 -14.9 -31.7 -32.8 -31.6 -20.3 -18.3 -21.5 -15.3 -14.6 Gross official reserves (in millions of US$) 1,145 2,490 2,630 4,126 2,214 2,290 2,178 2,369 2,592 2,821 (In months of next year's imports of 3.5 3.9 3.9 6.5 3.4 3.3 3.0 3.0 3.2 3.2 goods and services) Debt indicators Total public debt 48.5 35.9 38.8 63.0 67.3 65.8 60.4 55.9 52.4 50.1 Domestic public debt 3/ 3.4 5.1 10.9 14.7 15.5 15.1 15.5 16.3 16.2 16.6 External public debt 45.2 30.8 27.9 48.3 51.8 50.7 44.9 39.6 36.2 33.4 (In millions of US$) 2,064 2,061 2,219 4,837 4,988 5,636 5,466 5,145 5,204 5,239 Memorandum items: Copper prices (US$ per ton) 5,165 7,538 8,823 7,959 7,185 6,855 6,921 6,975 7,031 7,091 Gold prices (US$ per ounce) 973 1,225 1,569 1,669 1,386 1,251 1,267 1,284 1,308 1,336 Sources: Mongolian authorities; and IMF staff projections. 1/ The medium-term projections are based on the assumption that the Fiscal Stability Law will be adhered to starting from 2014. Table 7. Mongolia: Selected Economic and Financial Indicators, 2009-18 1/ (Strong Policy Scenario) (In percent of GDP, unless otherwise indicated) (In percent of non-mineral GDP ) 2/ Based on period average exchange rate, and population (end of year). (In percent of GDP, unless indicated otherwise) Projections 3/ Includes the expected fiscalization cost of bank restructuring, the financing of the government's equity share in Oyu Tolgoi, and the Oyu Tolgoi tax prepayment.
  • 33. MONGOLIA 32 INTERNATIONAL MONETARY FUND 2007 2008 2009 2010 2011 2012 Capital adequacy Regulatory capital to risk-weighted assets 14.0 11.6 5.5 16.2 15.0 16.1 Regulatory Tier I capital to risk-weighted assets 11.8 8.7 2.3 11.9 11.0 11.6 Total capital (in billions of Mongolian togrogs) 372 342 177 632 950 1,266 Sectoral distribution of lending 2/ Agriculture 7.6 2.6 5.8 4.4 3.0 2.7 Construction 15.6 14.5 14.4 10.8 11.8 11.5 Manufacturing 13.0 14.5 15.5 14.1 11.3 11.5 Mining 6.3 6.4 13.2 12.0 12.0 13.0 Real estate activities 1.7 5.4 7.1 13.6 14.1 14.0 Wholesale and retail trade 29.2 22.7 18.0 18.6 17.0 16.4 Other 26.5 33.8 26.0 26.5 30.8 30.9 Asset quality Non-performing loans (NPL) to gross loans 3/ 3.2 7.1 20.0 6.7 3.1 2.2 Non-performing loans (NPL), incl. past due loans, to gross loans 4/ 5.3 10.6 24.5 9.7 4.4 3.8 Provisions to NPL 3/ 87.1 75.8 67.4 62.4 69.1 75.2 Provisions to NPL (incl. past due loans) 4/ 53.1 50.9 55.0 43.2 48.2 43.2 NPL net of provisions to capital 3/ 2.4 13.7 99.8 12.5 5.5 2.9 NPL (incl. past due loans) net of provisions to capital 4/ 14.5 41.5 169.0 27.2 13.1 11.5 Earnings and profitability Return on assets (before tax) 2.5 -1.5 -5.6 1.8 2.9 2.3 Return on equity (before tax) 21.2 -21.2 -131.9 11.2 18.6 15.2 Interest margin to gross income 42.3 11.7 14.6 12.9 11.2 12.2 Non-interest expenses to gross income 46.5 74.2 90.0 72.7 75.1 73.2 Personnel expenses to non-interest expenses 20.4 11.8 9.1 7.2 5.6 6.5 Liquidity Liquid assets to total assets 28.1 21.8 36.9 44.1 32.1 29.2 Liquid assets to short-term liabilities 27.4 23.9 41.3 53.3 37.6 34.2 Foreign currency loans to total loans 23.0 33.6 38.6 33.7 32.3 32.6 Foreign currency deposits to total deposits 25.4 25.3 34.4 32.4 27.1 29.3 Sources: Mongolian authorities; and IMF staff estimates. 1/ From 2010 onwards, the FSIs exclude Anod, Zoos, and Post Bank. 2/ The sectoral distribution of loans is taken from the quarterly loan report of the Bank of Mongolia, based on a survey. 3/ NPLs according to the new regulation (introduced in 2004), i.e. past due loans are not included. 4/ NPLs according to the old regulation, i.e. past due loans are included. Table 8. Mongolia: Financial Soundness Indicators of the Banking Sector 1/
  • 34. MONGOLIA INTERNATIONAL MONETARY FUND 33 Appendix I. Risk Assessment Matrix */ Source of Risks Likelihood Impacts Recommended Policy Response Continued fiscal expansion M-H H. Continued fiscal expansion could intensify overheating pressures, undermine debt sustainability, and lead to macroeconomic instability. Substantial fiscal consolidation is needed to bring fiscal policy back on track. Specifically, over time, expenditures should be reprioritized and reduced, consistent with the FSL ceilings. Highly accommodative monetary policy M-H H. Loose monetary policy conducted through non-market based quantitative easing and quasi-fiscal activity risks ratcheting up inflation expectation, distorting financial markets, and delaying structural reforms required to address supply-side bottlenecks. Persistent official foreign exchange sales during the first half of 2013 caused a rapid decline in foreign exchange reserves. The BOM’s programs of monetary easing (price stabilization program, placement of 12-month term deposits at commercial banks and mortgage lending program) should be phased out. Monetary operations should be conducted mainly through open market operations. The BOM should continue to limit foreign exchange interventions to smoothing operations. Financial stability risk M-H M-H. The banking sector harbors significant vulnerabilities arising from highly concentrated loan portfolios, inadequate provisioning, substantial dollarization and high loan-to-deposit ratios. Banking supervision and regulation need to be strengthened in line with FSAP recommendations. Dollarization needs to be discouraged and the provisioning regime strengthened. Business environment and political risks M H. Foreign investors' uncertainty about the business climate could impede FDI inflows. Build on the recent adoption of the new Investment Law to strengthen the business climate and stimulate FDI inflows. Sharp slowdown in growth in China and/or sustained decline in commodity prices M H. Slumping coal prices could cause closures of some mines. The uncertain outlook for commodity prices could hold back FDI inflows in the mining sector. Policies should be geared toward building resilience against external shocks and realizing inclusive growth via diversification of the economy. Protracted economic and financial volatility, especially for emerging markets H M. Uncertainty in the global financing environment could stall foreign financing to Mongolia, causing delays to major mining projects and negatively impacting growth. Building policy buffers, including prudent macroeconomic and financial policies, would help reduce economic volatility caused by fluctuations of capital flows. Protracted period of slower European growth H M. Weakening global demand could adversely affect current and capital flows. Policies should be geared toward building policy buffers and resilience against external shocks. Domestic External */ The Risk Assessment Matrix (RAM) shows events that could materially alter the baseline path (the scenario most likely to materialize in the view of IMF staff). The relative likelihood of risks listed is the staff's subjective assessment of the risks surrounding the baseline ("low" is meant to indicate a probability below 10 percent, "medium" a probability between 10 and 30 percent, and "high" a probability of 30 percent or more). The RAM reflects staff views on the source of risks and overall level of concern as of the time of discussions with the authorities.