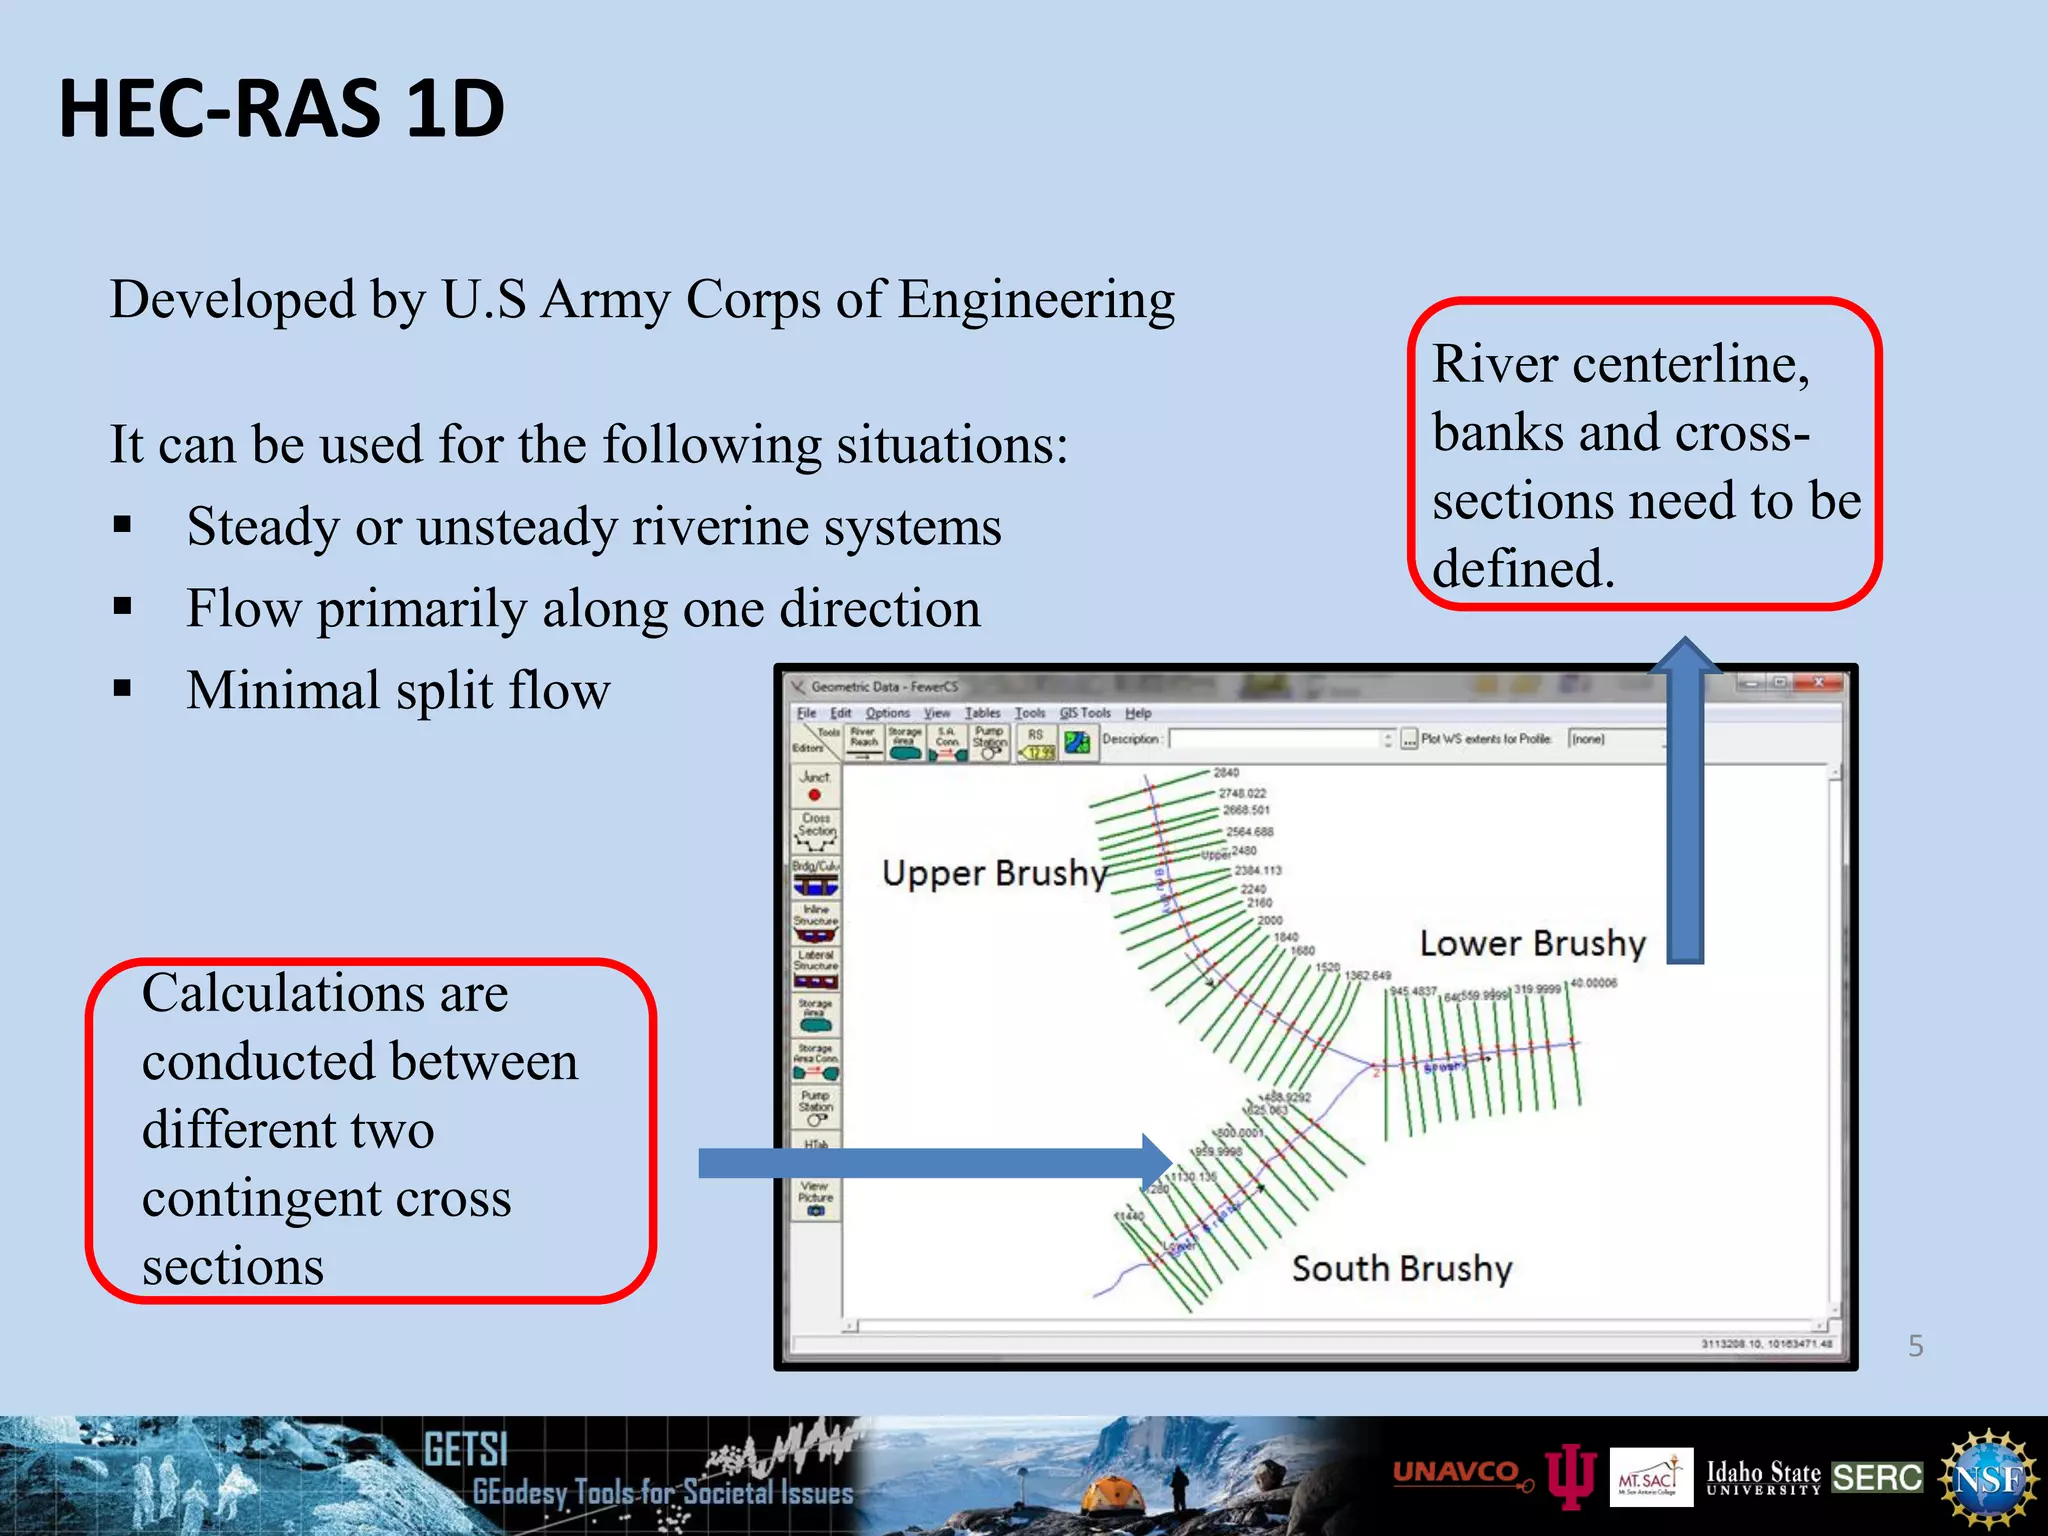
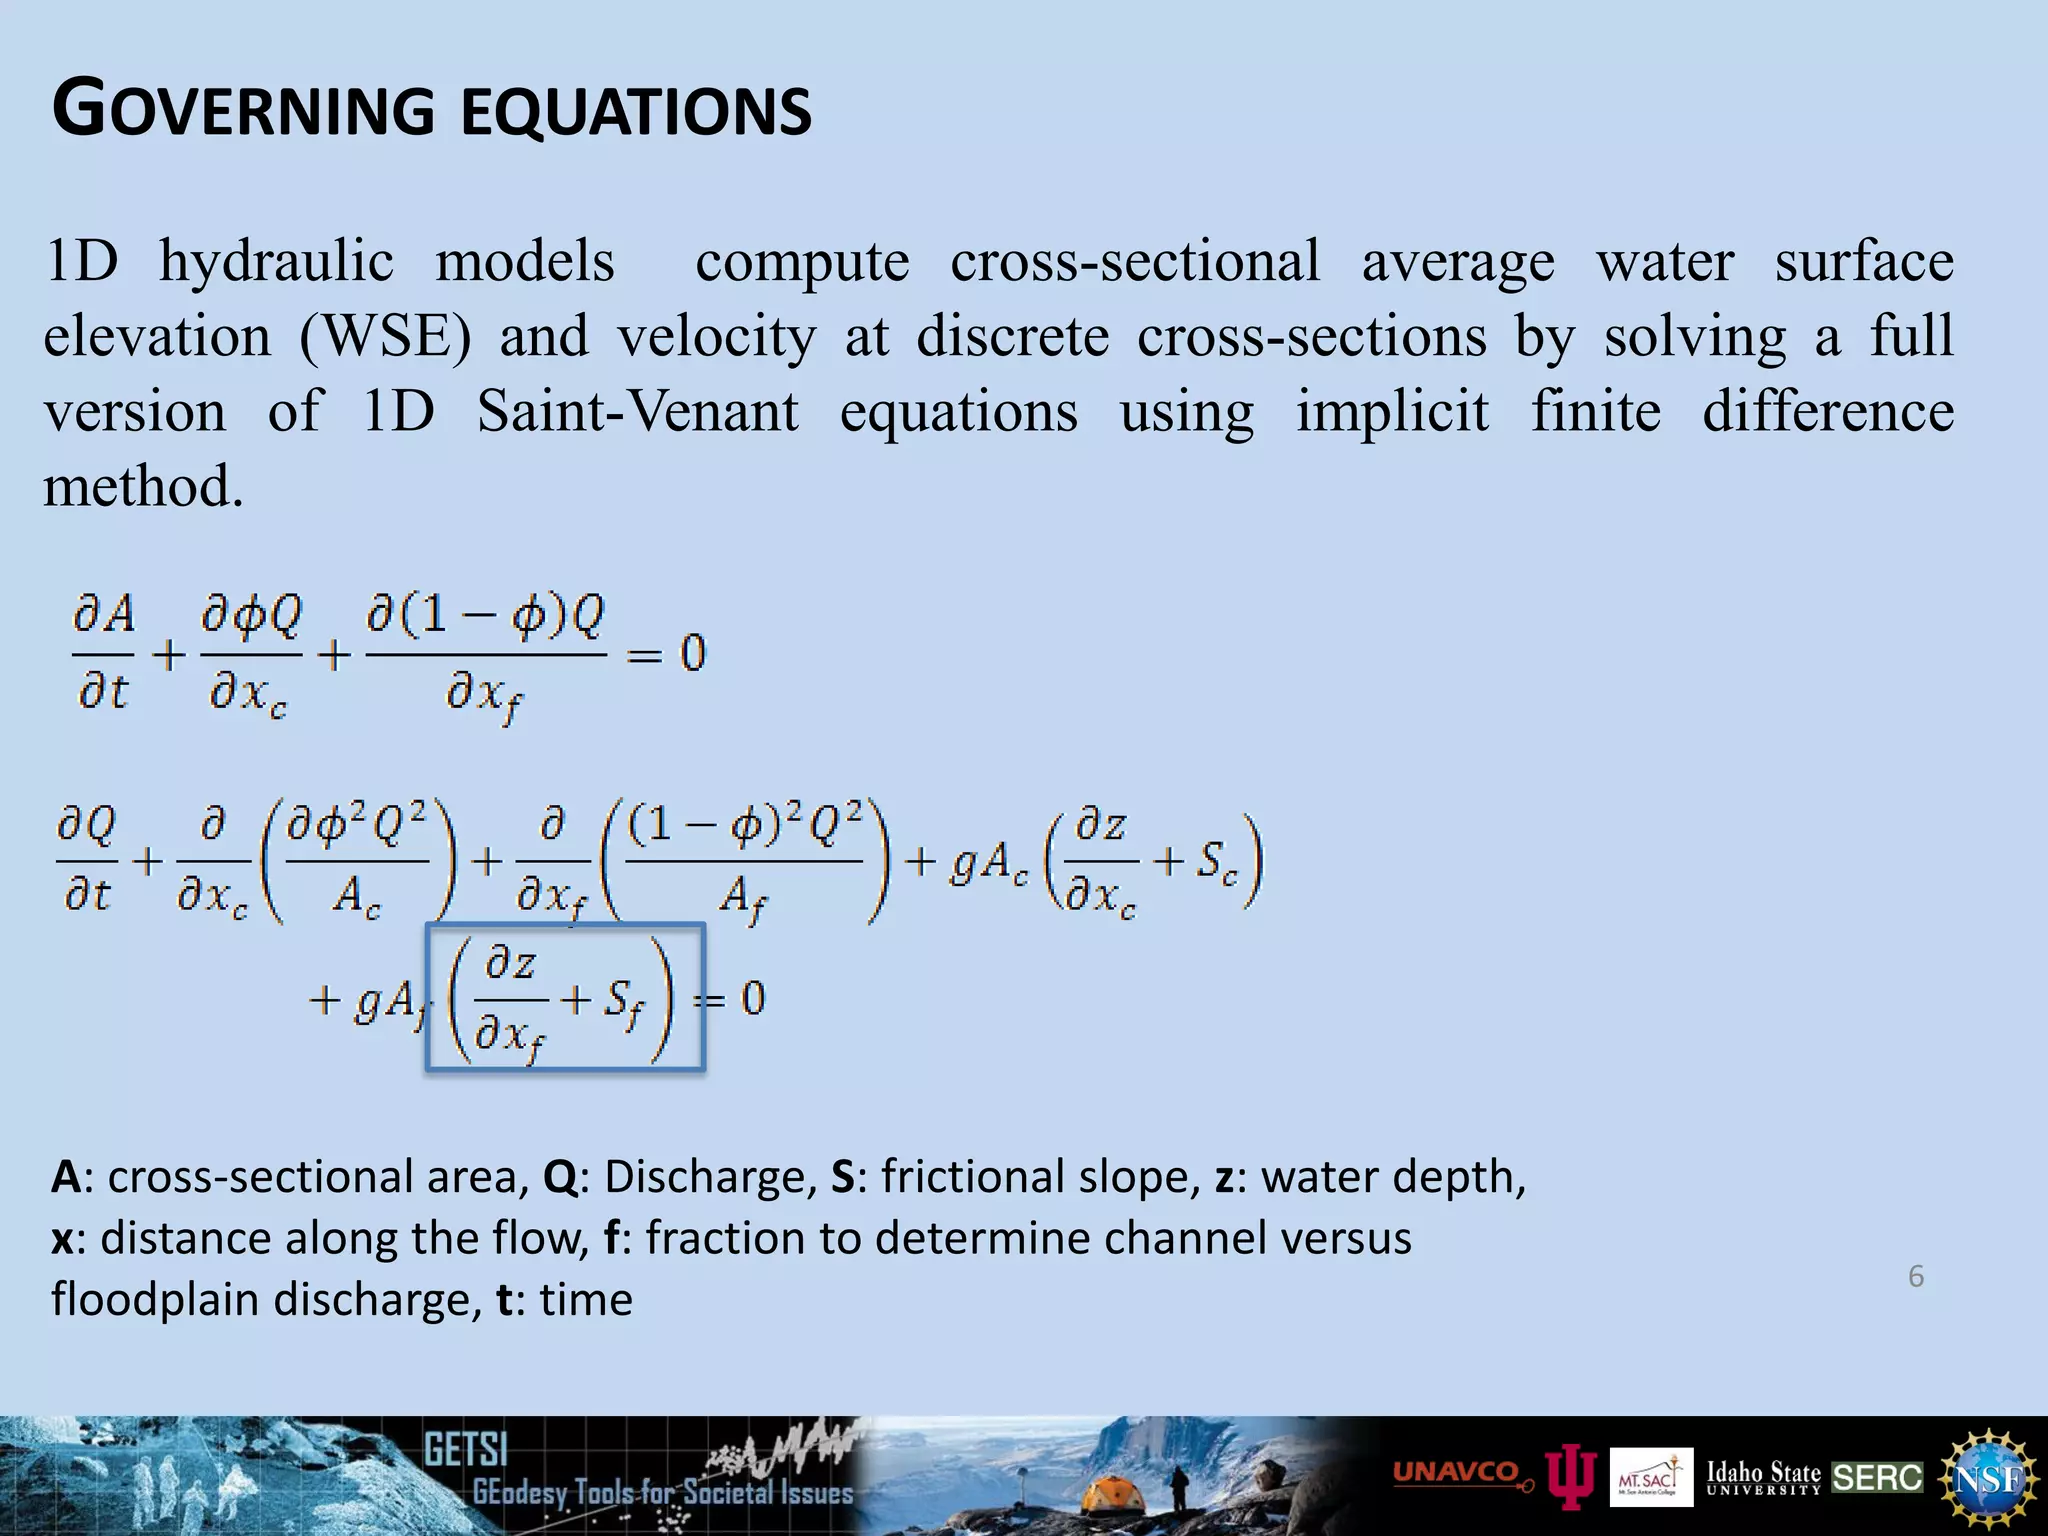
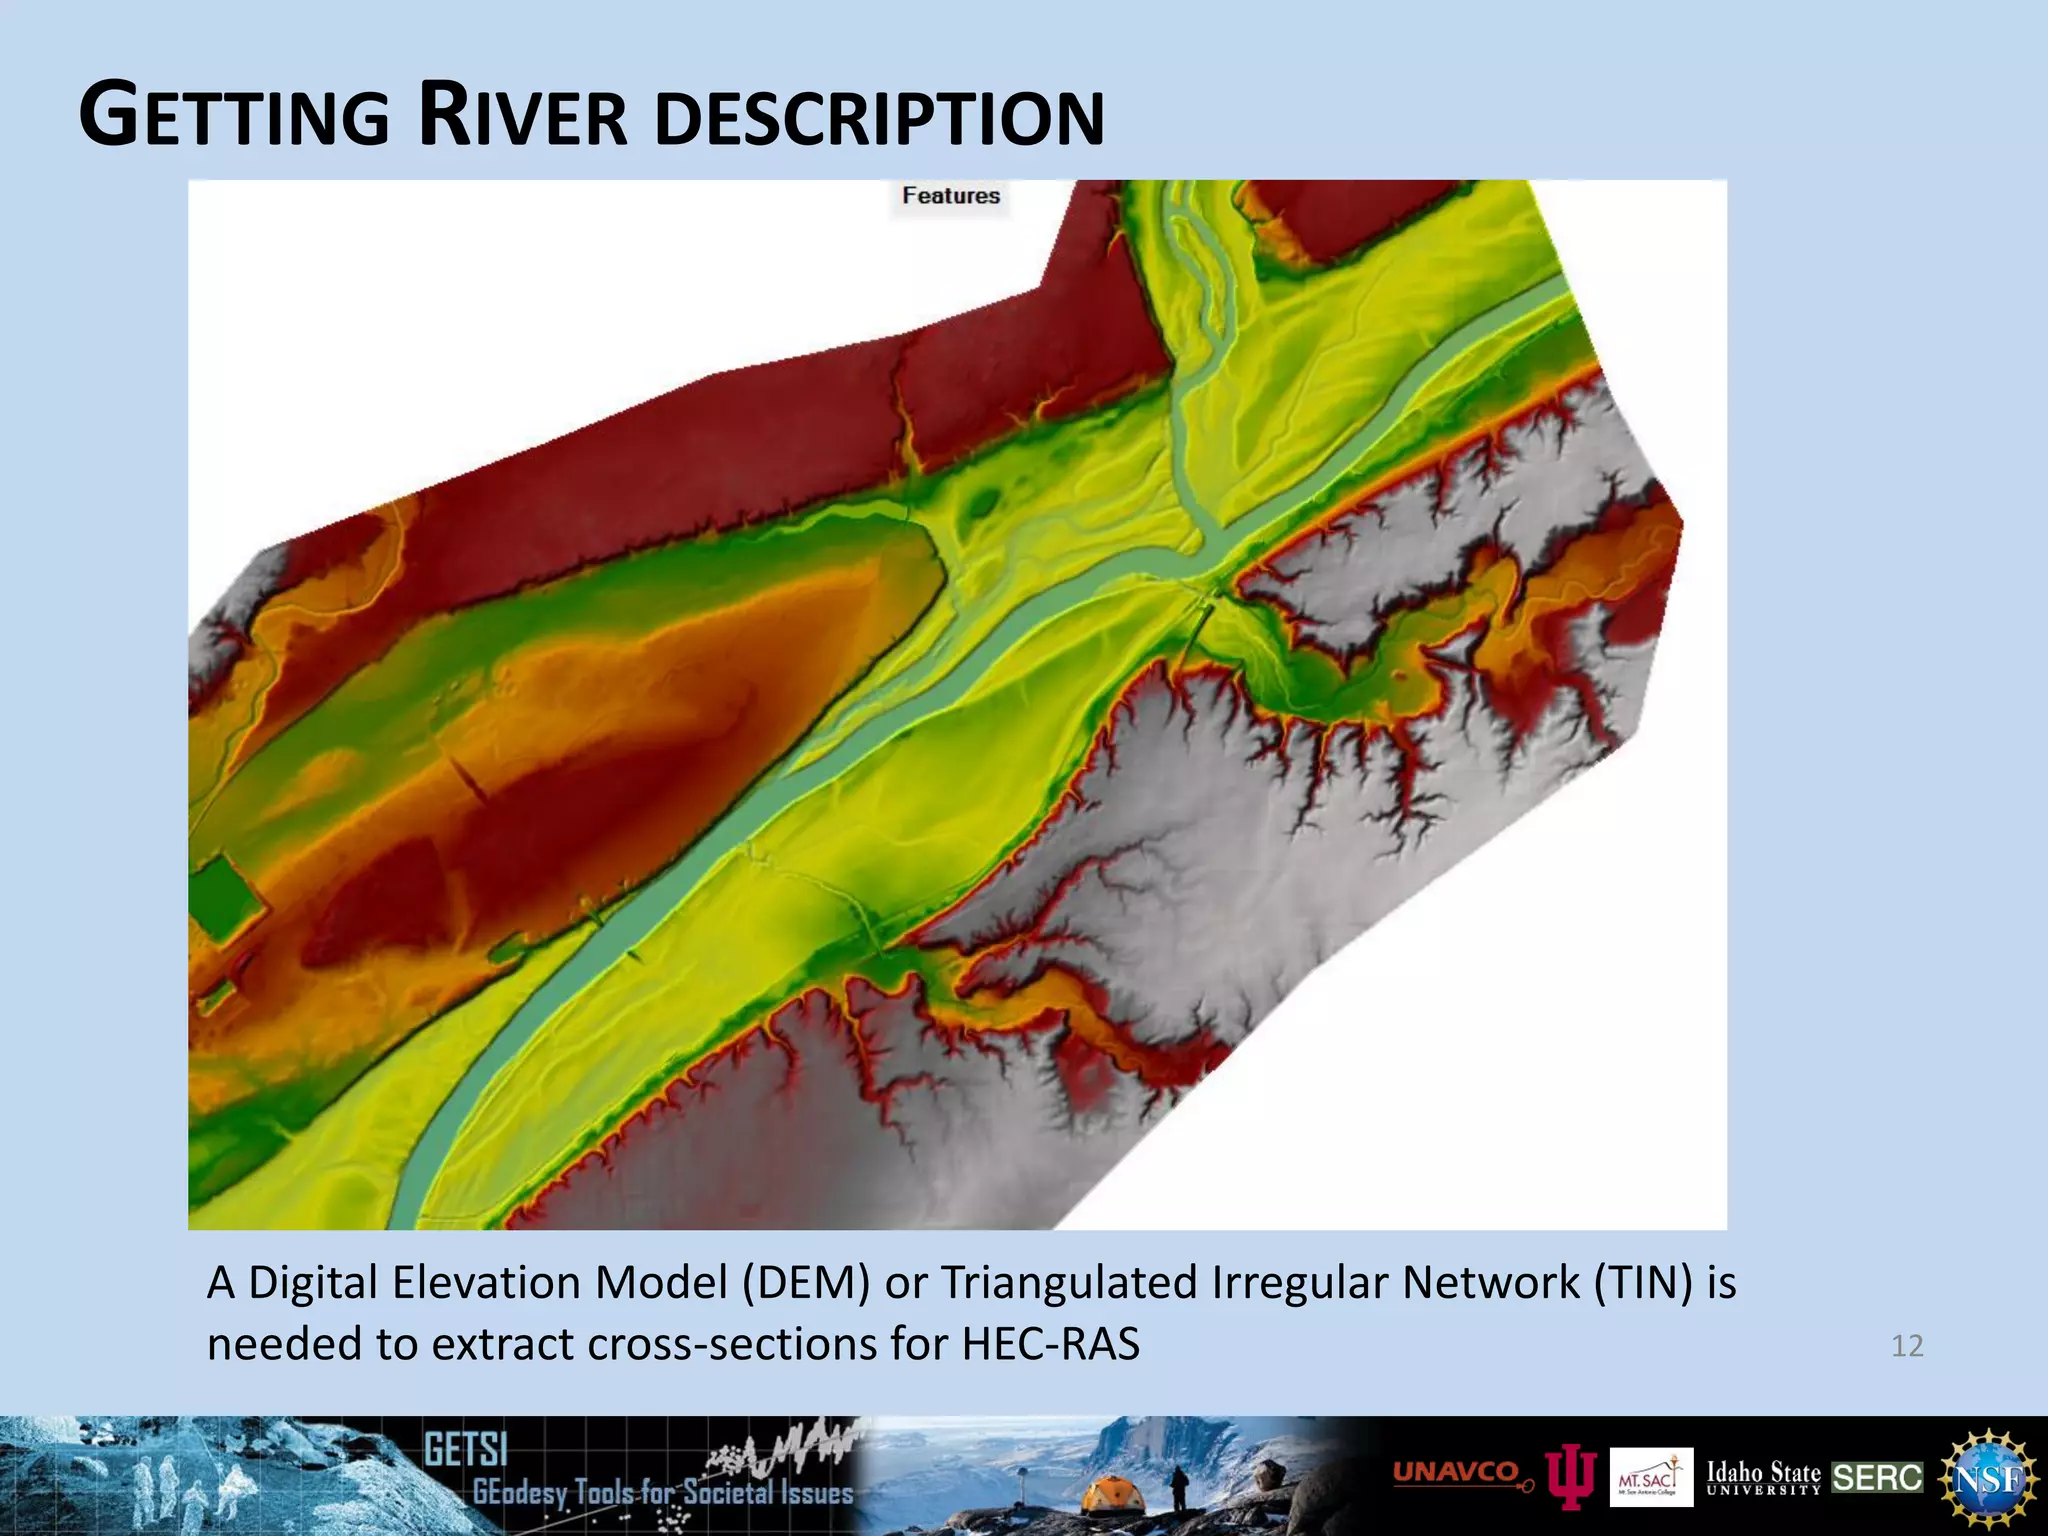
VIP Call Girls Service Hitech City Hyderabad Call +91-8250192130
HYDRAULIC MODELING AND FLOOD.pdf
1. This work is supported by the National Science Foundation’s
Directorate for Education and Human Resources TUES-1245025, IUSE-
1612248, IUSE-1725347, and IUSE-1914915. Questions, contact education-AT-unavco.org
HYDRAULIC MODELING AND FLOOD
INUNDATION MAPPING USING HEC-RAS
Dr. Venkatesh Merwade, Lyles School of
Civil Engineering, Purdue University
Version: 10/08/2018 by V. Merwade
2. • Hydraulic model: A hydraulic model is a mathematical representation of a
water/sewer/storm system and is used to analyze the system’s hydraulic
behavior.
• Hydraulic modeling is frequently used to understand a hydraulic system’s
behavior under different scenarios at different spatial and temporal scales.
2
Lab experiment Modeling
Cost
Time
WHAT IS A HYDRAULIC MODEL?
3. DIFFERENT TYPES OF HYDRAULIC MODELS
Hydraulic models can be categorized by its dimensionality
3
1D 2D
3D
1D/2D
Flow is considered one dimensional
(1D) both in channel and floodplain
Flow is considered two dimensional
(1D) in both channel and floodplain
Combined 1D-2D. 1D in channel
and 2D in floodplain
Flow is considered three dimensional
(3D) in both channel and floodplain
4. ONE DIMENSIONAL (1D) HYDRAULIC MODEL
A 1D model assume flow in one direction – generally along the river.
4
1D
Flow along
longitudinal
direction
Flow along lateral
direction is neglected
EXAMPLES
•HEC-RAS 1D (Hydraulic Engineering Center-River Analysis Service 1D Model)
• MIKE 11
• SWMM (Storm and water management model)
•HY8
5. HEC-RAS 1D
It can be used for the following situations:
▪ Steady or unsteady riverine systems
▪ Flow primarily along one direction
▪ Minimal split flow
5
Developed by U.S Army Corps of Engineering
River centerline,
banks and cross-
sections need to be
defined.
Calculations are
conducted between
different two
contingent cross
sections
6. GOVERNING EQUATIONS
6
1D hydraulic models compute cross-sectional average water surface
elevation (WSE) and velocity at discrete cross-sections by solving a full
version of 1D Saint-Venant equations using implicit finite difference
method.
A: cross-sectional area, Q: Discharge, S: frictional slope, z: water depth,
x: distance along the flow, f: fraction to determine channel versus
floodplain discharge, t: time
8. LOSS IN ENERGY HEAD
8
𝑉𝐿𝑂𝐵
2
2𝑔
𝑉𝑅𝑂𝐵
2
2𝑔
𝑉
𝑐
2
2𝑔
a𝑉2
2𝑔
LLOB LROB
LC
C: contraction/expansion coefficient.
Contraction occurs when downstream
velocity head is higher and vice versa.
Plan View
Cross-sectional View
9. FLOW CONVEYANCE AND FRICTIONAL SLOPE
9
Computation of flow conveyance (K) and frictional slope (Sf) is based on
Manning’s n values. Thus Manning’s n or roughness coefficient plays a critical
role in hydraulic modeling.
10. PUTTING IT ALL TOGETHER
10
• Y1 is given. Assume Y2
• Based on Y1 and Y2, compute conveyance (K) and friction slope (Sf), and then get he.
• Use he to compute Y2.
• If the error between computed Y2 and assumed Y2 is greater than a specified
tolerance (e.g., 0.01 ft), iterate Y2 until the error is within tolerance.
• If the difference between computed Y2 and assume Y2 is within the specified
tolerance, Y2 becomes Y1 and the computations move upstream.
11. DATA REQUIREMENTS
• River Channel description
– Length and slope the reach
– Channel and floodplain roughness
– Cross-section geometry
• Boundary Conditions
• Flow and/or stage data at upstream and downstream
locations
• Structure geometry
– Bridges
– Culverts
– Weirs
– Levees, etc
12. GETTING RIVER DESCRIPTION
12
A Digital Elevation Model (DEM) or Triangulated Irregular Network (TIN) is
needed to extract cross-sections for HEC-RAS
14. GEOMETRY DATA PLAN VIEW
River or stream
Station number
Junction
Bank locations
Cross-section
15. GEOMETRY DATA – CROSS SECTIONAL VIEW
Station or
distance
along XS
Elevation
values
along XS
16. STEADY FLOW DATA – UPSTREAM BOUNDARY
CONDITION
Flow value is specified at the upstream of
each reach. Multiple values can be
specified to create multiple profiles.
17. STEADY FLOW DATA – DOWNSTREAM BOUNDARY
CONDITION
Water depth (known water surface
elevation, critical depth or normal depth)
can be provided as downstream boundary
for each reach
18. RUNNING SIMULATION AND VIEWING RESULTS
Steady flow analysis editor Profile view of results
Cross-sectional view XYZ view
20. HEC-RAS LAB
• You are provided with a HEC-RAS model for
Wabash-Tippecanoe confluence in West
Lafayette, IN
• Run the model for different return periods
ranging from 2 to 500-year and create flood
inundation maps using RAS Mapper
• All instructions are provided in the handout