Download to read offline


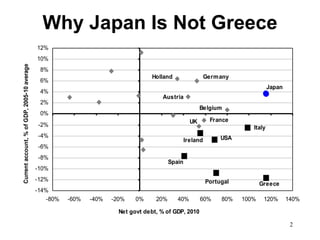
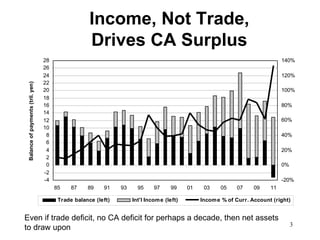
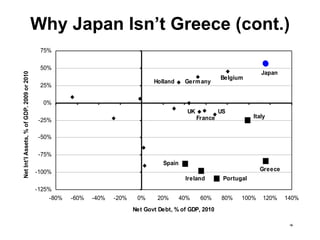
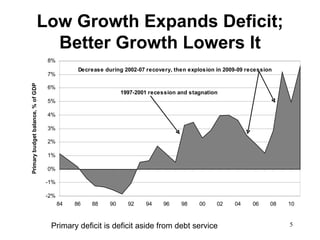
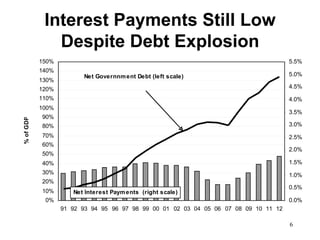
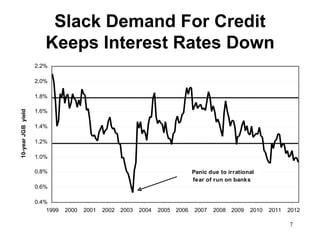


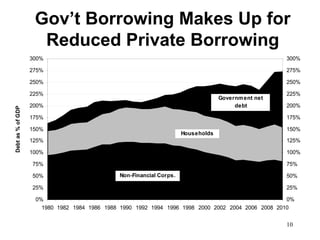
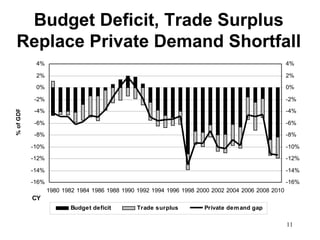


The document analyzes why Japan is not like Greece in facing its debt crisis and argues that Japan can sustain its debt for the following key reasons: 1) Japan has a large trade surplus and net international asset position that can finance its debt, 2) interest payments on Japan's debt remain low despite rising debt levels, and 3) Japan has policy tools like quantitative easing to boost demand and reduce deflationary pressures. However, the document notes Japan's growth remains weak with productivity gains slowing.