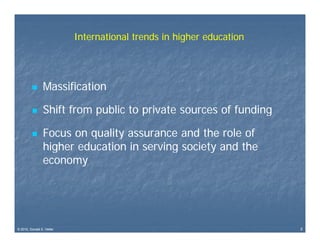
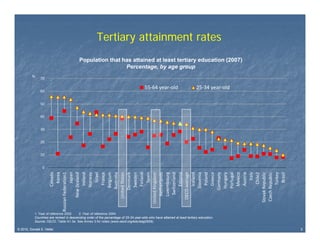
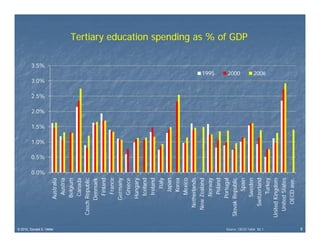
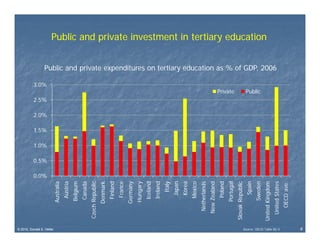
The Guardian
    The F t
    Th Future of Hi h Education
                f Higher Ed ti
               London
            11 March 2010


International Perspectives on
         o       sp      so
     Funding Structures


       Donald E. Heller
International trends in higher education


                Massification

                Shift from public to private sources of funding

                Focus on quality assurance and the role of
                higher education in serving society and the
                economy


© 2010, Donald E. Heller                                              2
Tertiary attainment rates
                                         Population that has attained at least tertiary education (2007)
                                                          Percentage, by age group
         %
               70

                                                                                       55‐64 year‐old                      25‐34 year‐old
               60


               50


               40


               30


               20


               10


                0
                                     Israel


                             Netherlands
                                    Korea

                                    Japan


                                Denmark
                            New Zealand


                                   France
                                 Belgium
                                Australia


                                     Spain


                              Switzerland


                                Germany
                                  Greece

                                 Hungary


                                  Austria


                                   Turkey
                                     Brazil
                          an Federation1


                            United States

                                 Sweden


                                  Mexico

                                      Italy

                         Slovak Republic
                          Czech Republic
                                    Chile2
                                  Norway


                             Luxembourg


                           OECD average
                                  Iceland

                                   Poland


                                 Portugal
                                  Ireland


                                  Estonia
                                  Canada


                                  Finland


                                 Slovenia
                        United Kingdom
                     Russia


                         S
                        U


           1. Year of reference 2002     2. Year of reference 2004
           Countries are ranked in descending order of the percentage of 25-34 year-olds who have attained at least tertiary education.
           Source: OECD. Table A1.3a. See Annex 3 for notes (www.oecd.org/edu/eag2009).

© 2010, Donald E. Heller                                                                                                                    3
0%
                                                  2%
                                                       4%
                                                            6%
                                                                 8%
                                                                      10%
                                                                            12%
                                                                                       14%
                                                                                             16%
                                                                                                   18%
                                                                                                         20%
                                 Australia


© 2010, Donald E. Heller
                                   Austria

                                  Belgium

                                  Canada

                           Czech Republic
                               h

                                 Denmark

                                   Finland
                                                                              OECD Average


                                 Hungary

                                  Iceland

                                   Ireland

                                    Japan

                              Ne
                               etherlands

                             New Zealand
                               w
                                                                                                                                                                                  International students


                                  Norway

                           Slovak Republic
                                k

                                    Spain

                                  Sweden
                                                                                                               Proportion of international students in tertiary education, 2007


                              Sw
                               witzerland

                           United Kingdom
Source: OECD Table C2.1


                                ted
                             Unit States
4
0.0%
                                                       0.5%
                                                              1.0%
                                                                     1.5%
                                                                            2.0%
                                                                                   2.5%
                                                                                          3.0%
                                                                                                        3.5%


© 2010, Donald E. Heller
                                   Australia
                                     Austria
                                   Belgium
                                    Canada
                            Czech Republic
                                h
                                  Denmark
                                     Finland
                                     France
                                  Germany
                                     Greece
                                   Hungary
                                    Iceland
                                     Ireland
                                        Italy
                                       Japan
                                       Korea
                                     Mexico
                               Ne
                                etherlands
                              New Zealand
                                w
                                    Norway
                                                                                                 1995


                                     Poland
                                   Portugal
                           Slovak Republic
                                k
                                                                                                 2000


                                       Spain
                                                                                                               Tertiary education spending as % of GDP


                                    Sweden
                               Sw
                                witzerland
Source: OECD Table B2.1
                                                                                                 2006


                                      Turkey
                           United Kingdom
                             Unit States
                                 ted
                                O
                                OECD ave.
5
0.0%
                                                    0.5%
                                                           1.0%
                                                                  1.5%
                                                                         2.0%
                                                                                2.5%
                                                                                             3.0%


© 2010, Donald E. Heller
                                 A
                                 Australia
                                   Austria
                                  Belgium
                                  Canada
                           Czech Republic
                                 R
                                 D
                                 Denmark
                                   Finland
                                   France
                                 G
                                 Germany
                                 H
                                 Hungary
                                  Iceland
                                   Ireland
                                     Italy
                                    Japan
                                    Korea
                                   Mexico
                              Neth
                                 herlands
                             New Zealand
                                   Poland
                                  Portugal
                                                                                       Private


                                  R
                           Slovak Republic
                                    Spain
                                                                                       Public


                                  Sweden
                                                                                                                                                                              Public and private investment in tertiary education


                           United Kingdom
                                  K
                                                                                                    Public and private expenditures on tertiary education as % of GDP, 2006


Source: OECD Table B2.4


                             United States
                                  d
                               OE
                                ECD ave.
6
Spending on tertiary education


                           Tertiary education spending per student, 2006 ($US PPP)
          $30,000

          $25,000

          $20,000
                                                  OECD Average

          $15,000

          $10,000

            $5,000

                    $0
                                      Korea

                                 therlands
                                  Denmark
                                    Finland

                                  Germany


                                    Ireland


                                     Mexico


                                   Sweden
                            Czech Republic


                                     France


                                    Iceland


                                    Norway


                           Slovak Republic
                                  Australia
                                    Austria

                                  Canada*


                                   Hungary


                                      Japan


                                      Spain


                           United Kingdom
                                   Belgium


                                       Italy


                                     Poland
                                   Portugal


                                witzerland

                             Unite States
                              New Zealand


                                 ed
                                  G
                                  D


                               Net
                                w


                               Sw
© 2010, Donald E. Heller                  *Author’s estimate from StatCan, OECD   Source: OECD Table B1.1a   7
Relationship between spending and attainment

                                                                  60
                                                                                                                                                                  Canada
                                                                                                               Japan
                                                                                                                 p
                    % with tertiary credential, 200 (age 25-34)

                                                                  50


                                                                                                                   Ireland
                                                                                                                                  Norway
                                                  07


                                                                                                                       France      Australia
                                                                  40
                                                                   0


                                                                                                                                Sweden
                                                                                                                                    Denmark                                    United States
                                                                                                Spain                                              Finland
                                                                                                      United Kingdom               Netherlands
                                                                                           Switzerland
                                                                  30


                                                                                     Poland
                                                                  3
                                  y


                                                                                                                                                               OECD ave.
                                                                                                                                                               attainment
                                                                                                     Germany
                                                                                               Hungary
                                                                                          Portugal
                                                                  20


                                                                                                                                                 r = .73
                                                                                  Italy       Mexico     Austria
                                                                                  Slovak Republic
                                                                                          Czech Republic
                                                                         Turkey                                    OECD ave.
                                                                                                                   spending
                                                                  10


                                                                       0.5                    1.0                        1.5                       2.0                              2.5
                                                                                                    Tertiary spending as % of GDP, 1995


© 2010, Donald E. Heller                                                                                                                                     Source: OECD Tables B2.1 & A1.3a   8
Tuition charges

                                         Average university tuition fee charges, 2006 ($US PPP)

        $25,000
        $25 000
                                                                                                                                                   Public                      Private                                        $20,517
        $20,000


        $15,000


        $10,000                                                                                                                         $ ,
                                                                                                                                        $8,519
                            $7,902
                            $7 902
                                                                                                                                $6,695
                                                                                                                                                                                                                 $5,666
                                                                                                                            $4,279$4,717                                                                   $4,694
          $5,000           $4,035                   $3,705                                                              $3,866
                                                                                                                                                       $2,765
                                                                                                                                                 $1,707
                                         $825                                                                    $1,123                                      $1,180 $844
                                                               $0               $0        $0        $0        $0
                                                                                                               $0                                                                                 $0
                  $0


                                                                                                                                         Korea
                                                      Canada


                                                                                                    Iceland
                             Australia

                                          Austria


                                                                                Denmark

                                                                                          Finland


                                                                                                                                Japan


                                                                                                                                                   Netherlands
                                                                                                              Ireland

                                                                                                                        Italy


                                                                                                                                                                 New Zealand


                                                                                                                                                                                          Spain
                                                                                                                                                                               Portugal


                                                                                                                                                                                                  Sweden

                                                                                                                                                                                                             United Kingdom

                                                                                                                                                                                                                               Unite States
                                                               Czech Republic


                                                                                                                                                                                                                                   ed
                             A


                                                                                                                                                                                                                    K
                                                                                D


© 2010, Donald E. Heller                                                                                                                                                                   Source: OECD Table B5.1a                           9
Public funding for higher education in three countries


                                                   U.S.                  England            Canada

         Public/private funding mix             34%/66%               65%/35% (UK)          53%/47%
         (2006)

         Sources of public funding                  51                       1                  11

         Fee-setting authority
         F     tti     th it                      Mixed
                                                  Mi d                    Public
                                                                          P bli               Public
                                                                                              P bli

         Loan providers                          Multiple                    1                  1+

         Loan type                               Mortgage                   ICR             Mortgage


                                              Federal/state/            Federal/            Federal/
         Grants                               institutional             institutional       Provincial
                                                                                            institutional

                    The challenges of affecting access and attainment through public policy levers
                                       are quite different in the three countries
© 2010, Donald E. Heller                                                                                    10
Challenges


             Continuing demands for public support of higher education
                      Expansion – access and completion
                      Maintaining (or increasing) quality
             The role of private funding
                      Increasing tuition fees
                      Private, philanthropic support
                      Business support
             Ensuring equity
                      Financial, academic,
                      Financial academic and cultural barriers
             Managing the migration of students
                      Spaces
                      Revenue implications
                      Quality
© 2010, Donald E. Heller                                                 11

Guardian 2010

  • 1.
    The Guardian The F t Th Future of Hi h Education f Higher Ed ti London 11 March 2010 International Perspectives on o sp so Funding Structures Donald E. Heller
  • 2.
    International trends inhigher education Massification Shift from public to private sources of funding Focus on quality assurance and the role of higher education in serving society and the economy © 2010, Donald E. Heller 2
  • 3.
    Tertiary attainment rates Population that has attained at least tertiary education (2007) Percentage, by age group % 70 55‐64 year‐old 25‐34 year‐old 60 50 40 30 20 10 0 Israel Netherlands Korea Japan Denmark New Zealand France Belgium Australia Spain Switzerland Germany Greece Hungary Austria Turkey Brazil an Federation1 United States Sweden Mexico Italy Slovak Republic Czech Republic Chile2 Norway Luxembourg OECD average Iceland Poland Portugal Ireland Estonia Canada Finland Slovenia United Kingdom Russia S U 1. Year of reference 2002 2. Year of reference 2004 Countries are ranked in descending order of the percentage of 25-34 year-olds who have attained at least tertiary education. Source: OECD. Table A1.3a. See Annex 3 for notes (www.oecd.org/edu/eag2009). © 2010, Donald E. Heller 3
  • 4.
    0% 2% 4% 6% 8% 10% 12% 14% 16% 18% 20% Australia © 2010, Donald E. Heller Austria Belgium Canada Czech Republic h Denmark Finland OECD Average Hungary Iceland Ireland Japan Ne etherlands New Zealand w International students Norway Slovak Republic k Spain Sweden Proportion of international students in tertiary education, 2007 Sw witzerland United Kingdom Source: OECD Table C2.1 ted Unit States 4
  • 5.
    0.0% 0.5% 1.0% 1.5% 2.0% 2.5% 3.0% 3.5% © 2010, Donald E. Heller Australia Austria Belgium Canada Czech Republic h Denmark Finland France Germany Greece Hungary Iceland Ireland Italy Japan Korea Mexico Ne etherlands New Zealand w Norway 1995 Poland Portugal Slovak Republic k 2000 Spain Tertiary education spending as % of GDP Sweden Sw witzerland Source: OECD Table B2.1 2006 Turkey United Kingdom Unit States ted O OECD ave. 5
  • 6.
    0.0% 0.5% 1.0% 1.5% 2.0% 2.5% 3.0% © 2010, Donald E. Heller A Australia Austria Belgium Canada Czech Republic R D Denmark Finland France G Germany H Hungary Iceland Ireland Italy Japan Korea Mexico Neth herlands New Zealand Poland Portugal Private R Slovak Republic Spain Public Sweden Public and private investment in tertiary education United Kingdom K Public and private expenditures on tertiary education as % of GDP, 2006 Source: OECD Table B2.4 United States d OE ECD ave. 6
  • 7.
    Spending on tertiaryeducation Tertiary education spending per student, 2006 ($US PPP) $30,000 $25,000 $20,000 OECD Average $15,000 $10,000 $5,000 $0 Korea therlands Denmark Finland Germany Ireland Mexico Sweden Czech Republic France Iceland Norway Slovak Republic Australia Austria Canada* Hungary Japan Spain United Kingdom Belgium Italy Poland Portugal witzerland Unite States New Zealand ed G D Net w Sw © 2010, Donald E. Heller *Author’s estimate from StatCan, OECD Source: OECD Table B1.1a 7
  • 8.
    Relationship between spendingand attainment 60 Canada Japan p % with tertiary credential, 200 (age 25-34) 50 Ireland Norway 07 France Australia 40 0 Sweden Denmark United States Spain Finland United Kingdom Netherlands Switzerland 30 Poland 3 y OECD ave. attainment Germany Hungary Portugal 20 r = .73 Italy Mexico Austria Slovak Republic Czech Republic Turkey OECD ave. spending 10 0.5 1.0 1.5 2.0 2.5 Tertiary spending as % of GDP, 1995 © 2010, Donald E. Heller Source: OECD Tables B2.1 & A1.3a 8
  • 9.
    Tuition charges Average university tuition fee charges, 2006 ($US PPP) $25,000 $25 000 Public Private $20,517 $20,000 $15,000 $10,000 $ , $8,519 $7,902 $7 902 $6,695 $5,666 $4,279$4,717 $4,694 $5,000 $4,035 $3,705 $3,866 $2,765 $1,707 $825 $1,123 $1,180 $844 $0 $0 $0 $0 $0 $0 $0 $0 Korea Canada Iceland Australia Austria Denmark Finland Japan Netherlands Ireland Italy New Zealand Spain Portugal Sweden United Kingdom Unite States Czech Republic ed A K D © 2010, Donald E. Heller Source: OECD Table B5.1a 9
  • 10.
    Public funding forhigher education in three countries U.S. England Canada Public/private funding mix 34%/66% 65%/35% (UK) 53%/47% (2006) Sources of public funding 51 1 11 Fee-setting authority F tti th it Mixed Mi d Public P bli Public P bli Loan providers Multiple 1 1+ Loan type Mortgage ICR Mortgage Federal/state/ Federal/ Federal/ Grants institutional institutional Provincial institutional The challenges of affecting access and attainment through public policy levers are quite different in the three countries © 2010, Donald E. Heller 10
  • 11.
    Challenges Continuing demands for public support of higher education Expansion – access and completion Maintaining (or increasing) quality The role of private funding Increasing tuition fees Private, philanthropic support Business support Ensuring equity Financial, academic, Financial academic and cultural barriers Managing the migration of students Spaces Revenue implications Quality © 2010, Donald E. Heller 11