
Recommended
Recommended
More Related Content
Similar to jaoac1741.pdf
Similar to jaoac1741.pdf (20)
Recently uploaded
Recently uploaded (20)
jaoac1741.pdf
- 1. Zhang et al.: Journal of AOAC International Vol. 101, No. 6, 2018 1741 Background: There are a substantial number of papers in the scientific literature reporting on the chemical composition of the Aloe vera plant. None of these investigations are truly comprehensive nor address the differences in composition that occur through processing variations in fresh leaves and commercially available product forms. Objectives: This work was to analytically examine a range of these forms and compile the findings. Methods: Fresh A. vera leaves and a number of commercial aloe juice powders were investigated for their major chemical constituents. Samples included fresh leaves from China and Mexico, plus commercial powders from different manufacturers made from different plant parts and/or manufacturing processes. The test results include moisture, ash, fiber, protein, lipids, minerals, organic acids, free sugars, and polysaccharides. The analytical methods employed comprise inductively coupled plasma-optical emission spectroscopy for minerals, high-performance anion-exchange chromatography equipped with pulsed amperometric detection for free sugars, HPLC for organic acids, and size exclusion chromatography (SEC)–multi-angle laser light scattering (MALS)–differential refractive index (dRI) for polysaccharide analyses. The absolute MW and MW distribution were determined using MALS measurement. Results: The major constituents of A. vera fresh leaf are fibers, proteins, organic acids, minerals, monosaccharides, and polysaccharides, which accounted for 85–95% of the total composition determined. In the commercial powdered aloe juice samples, four major components—organic acids, minerals, monosaccharides, and polysaccharides— accounted for 78–84% of the total composition. Apart from the four major components, products manufactured by ethanol precipitation contained high amounts of fiber and protein, while the free sugars were removed. In ethanol-precipitated Special Guest Editor Section Guest edited as a special report on “Aloe vera: Chemistry, Major Chemical Components, Quantification, and Molecular Weight Determination of Polysaccharides” by Kan He. Color images are available online at http://aoac.publisher. ingentaconnect.com/content/aoac/jaoac 1 Corresponding author’s e-mail: qunyiz@herbalife.com Chemical Investigation of Major Constituents in Aloe vera Leaves and Several Commercial Aloe Juice Powders Yuehong Zhang, Zhichao Bao, Xiaoyan Ye, and Zhaoyang Xie Herbalife NatSource (Hunan) Natural Products Co. Ltd, Research and Development, 1318 Kaiyuan East Rd, Xingsha, Changsha City, Hunan Province, People’s Republic of China, 410100 Kan He, Bill Mergens, Wenjie Li, Mike Yatcilla, and Qunyi Zheng 1 Herbalife Nutrition, Worldwide Research Development and Scientific Affairs, 950 West 190th St, Torrance, CA 90502 DOI: https://doi.org/10.5740/jaoacint.18-0122 products, the polysaccharide MW was less affected by manufacturing conditions and the concentration of aloe polysaccharides was higher than in products made in the nonethanol manufacturing processes. The overall chemical profiles were found to be consistent, except for the MW and content of polysaccharides in the commercial aloe samples analyzed, which were largely dependent on the types of manufacturing processes employed. Conclusions: This present study provides a comprehensive investigation of the major chemical composition of A. vera leaf and commercially derived products. The use of the SEC combined with MALS and differential RI detectors has proved to be an improved tool for the accurate determination of polysaccharide MW and contents of the various commercially available A. vera products in this study. A loe vera (L.) Burm.f. (Aloe barbadensis Miller) belongs to Asphodelaceae family (1) and contains over 500 Aloe species, but A. barbadensis and A. arborescens are the two most popular commercially grown species in the world and are widely used for various medical, cosmetic, and nutraceutical purposes (2). Aloe leaves have a life span of about 12 years and take approximately 4 years to reach maturity before harvesting to be processed for aloe product manufacturing (3). The leaf consists mainly of an outer green rind (skin) and an inner pulp or mucilaginous gel.There is a vascular bundle in the leaf lining at the junction between rind and inner pulp (4). The aloe leaf is the sole plant component that has been used, and there are three aloe juice products made according to the parts of the leaf used: juice from entire leaf, juice from inner leaf, and latex from vascular tissue. Whole leaf juice is manufactured by grinding and squeezing the entire leaf to obtain the juice. The obtained juice then undergoes sterilization, filtration, decolorization (activated charcoal absorption), sterilization, concentration, and dehydration. The inner leaf juice is obtained in a similar way as the manufacturing of whole leaf juice, except that the outer rind is removed first (5). Over 200 chemical constituents from aloe leaves have been reported, including polysaccharides (6), minerals, sugars, organic acids,vitamins,lignins,lipids,saponins,phytosterols,protein,and amino acids (7–9). Of the latex derived from the vascular bundle, over 100 compounds have been identified, which are mainly chromones, anthraquinones, anthrones, tetrahydroanthracenones, and anthrone/tetrahydroanthracenone glycosides, etc. (10–12). Besides the latex, these composition studies have focused Downloaded from https://academic.oup.com/jaoac/article/101/6/1741/5654109 by guest on 18 June 2023
- 2. 1742 Zhang et al.: Journal of AOAC International Vol. 101, No. 6, 2018 on the active constituents in A. vera plant, such as acetylated polysaccharides (acemannan); characteristic compounds, such as organic acids including malic, citric, isocitric, and lactic acids, for characterization and quality control of aloe ingredients; and anthraquinones, mainly aloins A and B, which are considered contaminants and must be removed from nonlatex aloe products. A number of methods for aloe polysaccharide compositional analyses have been published, which include colorimetric/ spectrophotometric, NMR spectroscopic, and gel permeation chromatographic (GPC) analysis. A quantitative colorimetric method using Congo Red dye (sodium 4, 4′-diphenyl-2, 2′-diazo-bis-1-naphtlamino-4-sulfonate) specifically measures the β-linked glucomannan of A. vera with no need for prior separation or chemical degradation of the polysaccharides. The method is based on the interaction of the glucomannan with Congo Red to form a characteristic color that can be assayed at 540 nm wavelength. The formed dye–polysaccharide complex is proportional to the amount of glucomannan in the test sample and is reported not to be interfered with by the other ingredients in aloe product, such as, glycerin, ethanol, glucose, sodium chloride, etc., nor by possible adulterants like maltodextrin, dextrin, guar gum, locust gums, pectin, gum Arabic, arabinogalactan, inulin, psyllium, etc. (13).Asimilar colorimetric method uses alizarin red (1, 2-dihydroxyanthraquinone) to react with aloe polysaccharides through the electrostatic and hydrophobic interactions and produces a complex with maximum absorbances at 325 and 516 nm wavelength. Common impurities, such as guar gum, locust gum, starch, or maltodextrin, or small molecules like sucrose and glucose in commercial aloe products do not interfere with the determination of aloe polysaccharides (14, 15). One of the characteristic features of aloe polysaccharides is that the polymer chain contains acetate groups on the mannose moieties, acemannan.These acetate groups can be measured using acolorimetricassay,inwhichtheacetylgroupsonpolysaccharides are quantitatively reacted with alkaline hydroxylamine. The formed acetohydroxamic acid is further reacted with ferric trichloride giving ferric-acetohydroxamic acid complex, which can be measured at 540 nm wavelength to determine the content of acetyl groups (16). The resulting content of the acetate obtained from the above method, however, comprises all the acetate groups, not necessarily only those from the acetylated polysaccharides. More selective and accurate results can be obtained by proton- NMR spectroscopic measurement (1 H-NMR). In the 1 H-NMR spectrum, the different acetate groups present signals that can be utilized as the fingerprint of the A. vera. The content of acetyl polysaccharides is measured by the determination of the content of the acetates. Besides the acetylated polysaccharides, other major components, such as malic acid, citric acid, isocitric acid, isocitric acid lactone, lactic acid, glucose, fructose, and some minerals, can also be assayed by 1 H-NMR. A recent publication reported a method of using 1 H-NMR to quantitate two minerals, Mg 2+ and Ca2+ , after addition of a Cs-EDTA solution into the aloe sample and measurement of the signals derived from the mineral–EDTA complex (17). The method validation and applications using 1 H-NMR on commercial aloe products can be found in literature (18–22). While these methods are focused on the quantitation of aloe polysaccharides, for the polysaccharide MW information, size exclusion chromatography (SEC; or GPC) coupled with different detectors, e.g., refractive index (RI) or light scattering, are frequently employed to acquire such information. Analysis of polysaccharide MW on 32 various A. vera samples from different manufacturers using GPC coupled with an RI and a multi-angle laser light scattering (MALS) detector were reported. Results by MALS detection showed the MWs were from as low as 10 kDa to a high of 740 kDa in the 32 measured samples (23). For chemical compositions of A. vera leaf, a few publications can be found in literature. Major chemical constituents of A. vera plant in fillets, rind, and gel extracted from the fillets were investigated. The main type of polysaccharides was determined to be acetylated polysaccharides present in the fillet and gel fractions. The rind tissue cell wall had a different type of polysaccharide that contained a high level of mannosyl and xylosyl residues. In addition to polysaccharides, the distribution of other components, including lipids, proteins, soluble sugars, fibers, ash, and major minerals in fillet, gel, and rind, were reported (24). Another work reported the isolation of components of cell wall, degenerated cellular organelles, and liquid gel from the mesophyll cells of A. vera inner leaf. The carbohydrate compositions of these components demonstrated that the liquid gel mainly contained mannan, the microparticles contained galactose-rich polysaccharide(s), and cell walls contained an unusually high level of galacturonic acid (4). The chemical compositions of commercial A. vera products have been reported by several authors. One study examined nine commercial A. vera gel powders to assess the quality and authenticity by the analysis of acetylated polysaccharides, free sugar, and organic acid profiles (19). Another work used the 1 H-NMR spectrometry method to inspect five major aloe markers—acetylated polysaccharides, glucose, malic acid, lactic acid, and acetic acid—in 18 A. vera commercial products (21). Despite the number of studies that have been published, an integrated chemical composition analysis for aloe products has been lacking. It would be helpful to know the major components for the evaluation of the quality of aloe products. Because minor constituents like anthroquinones must be removed during the manufacturing process, the aim of the present work is to carry out only major constituent characterization and quantitation. Experimental Fresh Aloe Leaves and Commercial Aloe Samples Fresh aloe leaves were collected from Yunnan, China, and Tamaulipas, Mexico, and used in the current study. Both sources of aloe leaves were identified as A. vera by DNA barcoding analysis. The aloe leaves collected from China were first cleaned by water, and the leaf tip, butt, barbs, and edges were removed using a knife. The whole aloe leaf sample was made by grinding entire aloe leaves in a high-speed blender until the blend was flowing smoothly and no large chunks remained. The blend was then lyophilized to yield sample 1. The gel and rind samples were prepared by filleting the cleaned leaves with a knife to separate the rind (skin) from the inner leaf (gel). The rind and gel were thoroughly washed with distilled water to remove any leftover latex on the leaves and lyophilized to give gel powder 2 and rind 3. The leaves collected from Mexico were prepared into four parts. The butt and tip of the leaf plus barbs from the edges of the leaf were trimmed with knife. The leaf was ground in a blender until the blend was flowing smoothly and no large chunks remained. The contents of the blender were extruded through a 4-ply bedding of cheesecloth and the soluble portion was lyophilized to give whole leaf juice powder 4. The inner leaf was filleted from the Downloaded from https://academic.oup.com/jaoac/article/101/6/1741/5654109 by guest on 18 June 2023
- 3. Zhang et al.: Journal of AOAC International Vol. 101, No. 6, 2018 1743 rind and was ground in the blender until no chunks remained and the contents were flowing smoothly. The blend was centrifuged at 4000 rpm for 5 min and the supernatant was transferred and lyophilized along with the washings of the insoluble fraction to give soluble gel 5a. The insoluble residue was rinsed with water two times (the washings added to the soluble fraction as indicated above) and lyophilized to produce gel insoluble sample 5b. The rind was rinsed under water to remove any remaining inner gel plus as much of the vascular component as possible and was then diced into small cubes and lyophilized to give sample 6. Samples 1–3 were freeze-dried using a SCIENTZ-12N lyophilizer. Samples 4–6 were freeze-dried on a Virtis Genesis 35-L pilot lyophilizer. Commercial aloe powders were acquired from three aloe manufacturers and were identified to be made from A. vera by comparing their chemical profiles with authentic specimen. The description for all the tested samples is given in Table 1. Reagents The organic acid standards, malic acid (99.9% pure) and citric acid (99.9%), were purchased from Supelco (Bellefonte, PA). Acetic acid, isocitric acid trisodium salt hydrate (≥97%), and isocitric acid lactone (97%) were purchased from Sigma-Aldrich (St. Louis, MO). Fumaric acid (99.0%) was purchased from Aladdin (Shanghai, China). Lactic acid (91.2%) was purchased from Dr. Ehrenstorfer Gmbh (Augsburg, Germany). Oxalic acid (≥99.5%),tartaricacid(≥99.5%),formicacid(≥98%),andsuccinic acid (≥99.5%) were from Sinopharm Reagents (Sinopharm, Shanghai, China). Narrow pullulans (MW 10.0, 21.7, 48.8, 113, 200, 366, and 805 kDa) and broad dextrans (MW50, 80, 150, 410, 670, and 1500–2800 kDa) were purchased from Sigma (Sigma- Aldrich) and used as testing standards for MALS recovery measurement. Each standard was dissolved in 0.1 M NaCl to make concentrations of 125, 250, 500, and 1000 μg/mL and were filtered through 0.45μm Xiboshi mixed cellulose esters (MCE) syringe filter (Tianjin Fuji Science and Technology Co., Tianjin, China) before injection. HPLC grade acetonitrile was purchased from Merck (Darmstadt, Germany). ELGA PURELAB® water (Veolia Water Solution & Technologies, High Wycombe, United Kingdom) was used during the entire experiment for sample and standard preparations and chromatographic mobile phase. Moisture Moisture content was determined by drying the sample in a forced convection oven at 105°C to a constant weight (GB 5009.3–2010 Determination of Moisture in Foods; 25). Total Ash Total ash content was determined by the ignition method. The sample was charred first and then placed in a muffle furnace at 550°C and dried to a constant weight according to AOAC INTERNATIONAL, 2012, Method 923.03 (26). Lipid Analysis Lipid content was measured by extracting the samples with hexane in a Soxhlet assembly following the procedure of AOAC, 2012, Method 2003.06 (27). Protein Analysis Protein content was determined based on the amount of nitrogen that was obtained by Tecator Kjeltec 8400 Analyzer (FOSS Analytical A/S, Hillerod, Denmark) and then converted to protein by multiplying the nitrogen content by 6.25 (AOAC, 2012, Method 2001.11; 28). Fiber Analysis The dry sample was digested with 1.25% H2SO4 under boiling for 30 min and then filtered through 300 mesh nylon net (Jufeng Screen, Dongguan, Guangdong, China), followed by washing with boiling water until pH 7 was reached. The residue was digested with 1.25% NaOH under boiling for 30 min, filtered through 300 mesh nylon net, and washed sequentially with boiling water, ethanol, and ether, respectively. The residue was placed in a crucible and dried at 105 ± 2°C to a constant weight. The crucible was then placed in a muffle furnace at 550°C for several hours until all the carbonaceous matter was burnt off. The ash was weighed after the sample was cooled. The crude fiber content was the weight of the difference between the residue and ash (GB/T 5009.10-2003 Determination of Crude Fiber in Vegetable Foods; 29). Mineral Elements Calcium (Ca), magnesium (Mg), potassium (K), sodium (Na), and phosphorus (P) were measured using inductively coupled plasma-optical emission spectroscopy (ICP-OES; iCAP 6300 Table 1. A. vera fresh leaf and commercial samples analyzed Sample a Aloe plants/products Process b 1 Whole leaf FD 2 Inner leaf (gel) FD 3 Rind FD 4 Whole leaf juice FD 5a Inner leaf soluble gel FD 5b Inner leaf insoluble gel FD 6 Rind FD 7 Gel (200:1) SD 8 Gel (200:1) SD 9 Gel (200:1) FD 10 Whole leaf (100:1) FD 11 Whole leaf (100:1) FD 12 Whole leaf (100:1) SD 13 Gel (200:1) SD 14 Gel (200:1) SD 15 Whole leaf extract EP/FD 16 Inner leaf extract EP/FD 17 Whole leaf extract EP/FD 18 Inner leaf extract EP/FD a 1–3: Fresh leaf from Yunnan, China; 4–6: fresh leaf from Tamaulipas, Mexico; 7–11: from company A; 12–14: from company B; 15–18: from company C. b FD=Freeze dried; SD=Spray dried; and EP=Ethanol precipitation. Downloaded from https://academic.oup.com/jaoac/article/101/6/1741/5654109 by guest on 18 June 2023
- 4. 1744 Zhang et al.: Journal of AOAC International Vol. 101, No. 6, 2018 solution was gently shaken to mix well, filtered through 0.45 μm membrane filters, and stored in a refrigerator at 4°C before injection. For rind samples, an extra step of extraction at 60°C in a water bath for 1 h was included. The MW of polysaccharides and quantitation were analyzed on an SEC system consisting of a Waters 2695 separation module, a Waters 2414 differential refractive index (dRI) detector (Waters Co.), and a DAWN- HELEOS-II MALS detector (Wyatt Technology, Santa Barbara, CA). The system set up was SEC-MALS-RI in series. The polysaccharide solutions were separated on a Phenomenex PolySep-GFC-P Linear column (7.8 × 300 mm) with a TSKgel PWXL guard column (40 × 6 mm, 13 μm) in isocratic elution using 0.1 M NaCl as mobile phase, which was filtered through an inline 0.10 μm × 25 mm Durapore membrane filter (Millipore Co., Bedford, MA). The temperature of the column and RI detector were operated at 35°C, the flow rate was 0.7 mL/min, and the injection volume was 100 μL. Data analysis was performed on ASTRAVersion 6.1.5 Software (Wyatt Technology) utilizing the Zimm formalism and RI increment (dn/dc) of 0.14 mL/g. Results and Discussion Overall Chemical Composition Three fractions of fresh Aloe vera plant from China (Figure 1a) and four fractions from Mexico (Figure 1b) were prepared and analyzed. In general, the matured aloe leaf plant is composed of approximately 55–70% inner leaf and 30–45% rind by weight. The inner leaf contains about 98.5–99.5% water and 0.5–1.5% solids; the rind contains 88–91% water and 9–12% solids. The whole leaf contains total solids of about 3.5-4.5%, while the extractable solid of the whole leaf was approximately 1%. The dry weight of the inner leaf soluble fraction to the insoluble fraction is about 2:1 to 3:1. In the commercial aloe products analyzed,accordingtotheinformationprovidedbymanufacturers, the products comprised aloe juice powder manufactured from different plant parts (i.e., whole leaf or inner gel) and the products were made from different processes (i.e., ethanol precipitated or non-ethanol precipitated). Products made from whole leaf are typically termed 100:1, meaning 100 parts of whole leaf juice to make 1 part of juice powder. The inner gel is called 200:1, meaning 200 parts of inner gel to make 1 part of powder, considering 0.5% extractive solid from this source. The main components in these analyzed samples were found to be the ash, free sugars, organic acids, and polysaccharides. The protein contents are relatively high in fresh plants, in the range of 3.8–8.3%, and higher in rind than in gel. Protein content is low in the juice powders, assuming proteins were removed in the filtering and decolorization process. High protein contents were found in the four ethanol-precipitated products (samples 15–18) because the proteins were insoluble in ethanol and were precipitated out together with polysaccharides. The lipid content of the ethanol-precipitated products was in the range of 2.2–4.3% but was found to be less than 1% in commercial juice powders. The reduction was most likely due to the non- water-soluble lipids being removed by filtration during aloe manufacturing process. Total ash and organic acids represent major parts of the entire compositions, accounting for 33–58% in most analyzed samples. Free sugars took another major part, in the range of 6.9–37.7% of the total weight, except for the ethanol-precipitated products, which contained only 0.1–0.2%. This is because the free sugars are readily dissolved in the Series, Thermo Scientific, Sunnyvale, CA) according to the AOAC, 2012, Method 993.14 procedure (30). Free Sugar Analysis About 25.0 mg of dry powder was dissolved in 100 mL of water and sonicated at room temperature for 30 min to extract sugars.Theextractwasfilteredthrough0.45μmhydrophilicPTFE membranefilters(XiboshiSyringeFilter,TianjinFujiScienceand Technology Co.) and stored in refrigerator at 4°C before analysis. Standardstocksolutionwaspreparedbyweighingabout100.0mg of glucose, 50.0 mg of fructose, and 30.0 mg of sucrose, mixing, and dissolving in 100 mL of ultrapure water as stock solution, and storing in a refrigerator at 4°C before analysis. The standard calibration solutions were prepared by diluting the stock solution according to the factors of 10:1, 25:1, 50:1, 100:1, 250:1, and 500:1 for establishing standard curves. The sugar analysis was carried out with Dionex high performance anion exchange chromatography (HPAEC) equipped with pulsed amperometric detection (PAD; Thermo Scientific). Glucose, fructose, and sucrose were separated on a Dionex CarboPac PA10 (250 × 4 mm) chromatography column with a Dionex CarboPac PA10 (50 × 4 mm) guard column. The solvent system was 35 mM sodium hydroxide and was run in isocratic conditions with a flow rate of 1.0 mL/min. Both the column and detector temperature were operated at 35°C. The injection volume was 25 μL, and data analysis was performed on Dionex Chromeleon version 7.2.3.7553 software (Thermo Scientific). Organic Acid Analysis The samples were prepared by accurately weighing about 250.0 mg of powder into 50 mL of volumetric flask and mixing with about 40 mL of water. The solution was sonicated at room temperature for 30 min. The extract was allowed to cool to room temperature before the final volume was brought to 50 mLand was then filtered through a 0.45 μm hydrophilic PTFE membrane filter before the HPLC injection. The mixed organic acid standards were dissolved in ultrapure water, and stock solution was prepared at the concentrations of fumaric acid, 10 mg/L; oxalic acid, 200 mg/L; tartaric and formic acids, 1000 mg/L each; malic acid 5000 mg/L; isocitric, lactic, acetic, citric, and succinic acids, 2500 mg/L each; and isocitric acid lactone, 2500 mg/L. The stock solution was further diluted by the factors of 1:1, 5:1, 10:1, 25:1, 50:1, 250:1, 500:1, and 1,000:1 for standard curves. Standard solutions were stored at 4°C before analysis. HPLC was performed on a Waters 2695 separation module and a Waters 2998 photodiode array detector (Waters Co., Milford, MA) with a Phenomenex Luna C18 (5 μm, 250 × 4.6 mm) column and aThermoAcclaimTM OA(5 μm, 250 × 4.6 mm) column connected in series. The mobile phase was 0.2% phosphoric acid–acetonitrile (98 + 2), and chromatography was run in isocratic elution mode. The column temperature was operatedat20°C,theflowratewas0.4mL/min,theinjectionvolume was 25 μL, and the detection wavelength was set at 210 nm. Data analysis was performed with Empower 3.0 Software (Waters Co.). MW of Polysaccharides and Quantitative Analysis Polysaccharide sample solutions were prepared by accurately weighing about 50.0 mg of powder and dissolving in 50 mL of 0.1 M NaCl solution at room temperature for 20–24 h.The sample Downloaded from https://academic.oup.com/jaoac/article/101/6/1741/5654109 by guest on 18 June 2023
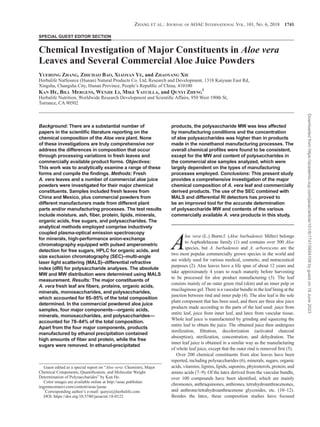
- 5. Zhang et al.: Journal of AOAC International Vol. 101, No. 6, 2018 1745 andKarepredominantinmostofthetestedsamples,accountingfor 67–91% of the five. Distribution of the minerals in gel and rind are quitesimilar.Thetotalofthefiveminerals,exceptforinsample16, were in the range of 6.3–13.5% and their corresponding total ash contents were approximately double this quantity. Analysis of the ash samples from the commercial aloe products by ICP- OES indicated that the five minerals are still the major mineral elements in the ash. The increased weight of the ash is due to the formation of the mineral complex in combustion during ash analysis, as KCl, CaCO3, CaMg(CO3)2, and so on were observed by X-ray diffraction analysis of the ash samples (data not shown). The mineral elements had historically been used as key parameters by the aloe industry for quality control (31). Organic Acids Analysis The concentration of organic acids was measured by an in- house developed method, which is a reversed-phase HPLC method using two C-18 columns connected in series for full separation and quantitation of aloe organic acids, including oxalic, malic, isocitric, lactic, citric, fumaric, and isocitric acid lactone, that have been reported in A. vera products made from either whole leaf or inner leaf (Figure 2A–2D; 19). The results of organic acids in the fresh and commercial aloe powders are given in Table 4. A total of eight organic acids were detected in the current method, and their quantities were determined through comparison with individual standards. Except for sample 16, the sum of the total acids was in the range of 14.9–31.4%, and malic acid has the highest concentration among these acids. It has been reported that a high content of malic acid is typically found in succulents, as it plays an important role in fixing carbon dioxide during the night through crassulacean acid metabolism. Plants utilize carbon dioxide in photosynthesis during the daytime. Therefore, diurnal fluctuation of malic acid content 75–85% ethanol, which is the commonly used ethanol concentration to make ethanol–precipitation products. Sample 16 contains low ash (6.7%) and organic acids (5.9%), but its polysaccharide content is the highest among all the tested samples, reaching to 40%, which is likely due to extensive purification, with the ethanol precipitation removing more minerals and organic acids while enriching polysaccharide content. High fiber contents were found in whole leaf sample 1 and rind 3 and 6, which suggest that a significant amount of leaf tissue structure was not removed during sample preparation. In contrast to sample 1, only juice was obtained from the whole leaf for sample 4, which used the same procedure of making aloe leaf juice product, and very low fiber content was detected. High fiber content was determined in inner leaf sample 6, about 21.8%, deriving mainly from the inner gel cell wall. When the soluble gel 5a was separated the from the insoluble gel 5b, most fibers remained in insoluble gel (45.8%). The overall carbohydrate compositions of the fresh leaf obtained from the present work are close to the published data (4). That the water-insoluble fibers are removed by filtration in typical aloe manufacturing processing was confirmed by only trace amounts of fiber content being detected in commercial aloe juice powder samples 7–14, whereas considerable amounts of fiber were seen in the ethanol-precipitated samples 15–18. As fibers do not dissolve in ethanol, they are not able to be separated from other ethanol-precipitated substances like poly saccharides. The analyses on the major components of A. vera presented above allowed 85–95% of the total composition to be determined, and the results are shown in Table 2. Major Mineral Analysis Mineral analysis of the samples showed that the Ca, K, Mg, Na, and P were the major minerals in both the fresh aloe leaves and commercial samples (Table 3). Among the five elements, Ca A. vera fresh leaves from China A. vera fresh leaves from Mexico Trim (a) (b) Trim Leaves 1kg, 3.7% solids Filet Rind 335g, 9.8% solids Gel 630g, 0.9% solids Grind Lyophilize Rind powder 33g, 3 Gel powder 5.7g, 2 Whole leaf powder 22g, 1 Grind Lyophilize Leaves 0.6kg Leaves 5.6kg Leaves 3.9kg Fileted Grind Centrifuge Lyophilize Whole leaf powder 26.9g, 4 Gel Grind, centrifuge Lyophilize Gel insoluble 7.6g, 5b Gel soluble 22.7g, 5a Rind powder 220g, 6 Cut Lyophilize Figure 1. Preparation of aloe juice powders from different A. vera plant parts (a) from Yunnan, China, and (b) from Tamaulipas, Mexico. Downloaded from https://academic.oup.com/jaoac/article/101/6/1741/5654109 by guest on 18 June 2023
- 6. 1746 Zhang et al.: Journal of AOAC International Vol. 101, No. 6, 2018 has been observed in aloe plants (32). The fresh whole aloe leaf contained malic, citric, and isocitric acids and a small amount of isocitric acid lactone in the concentrations of 10.6, 2.8, 5.8, and 0.61%, respectively, while filleted inner leaf contained malic acid (22.7%) as the only major acid. Malic, isocitric, and citric acids and isocitric acid lactone were found to be the major Table 2. Major chemical composition of A. vera samples (g/100g on dry basis) Sample LOD a Ash Fiber Protein Lipids Organic acids Free sugars Polysacch- arides Sum b 1 5.7 14.9 23.8 7.7 2.2 19.9 11.3 8.8 86.9 2 5.2 16.0 18.8 4.7 2.7 22.8 18.1 8.1 88.4 3 6.0 14.1 27.5 8.3 2.2 19.8 6.9 9.3 86.6 4 5.1 28.6 1.2 4.5 4.3 29.6 21.8 8.1 88.1 5a 6.4 28.8 4.5 3.8 4.2 25.6 22.5 11 92.5 5b 6.8 12.9 45.8 3.8 3.8 8.7 6.6 6.9 88.7 6 5.3 16.8 21.8 5.0 3.9 22.9 7.1 10.4 84.6 7 6.2 16.2 tr c 1.2 0.45 24.7 37.7 8.3 85.7 8 3.3 16.5 tr 1.2 0.32 27.0 34.8 12.5 87.5 9 7.0 15.3 tr 0.9 0.28 27.0 37.7 7.1 87.2 10 5.9 18.1 tr 1.1 0.34 31.4 34.5 7.5 89.4 11 2.6 14.8 tr 0.7 0.50 22.4 37.7 15.4 86.8 12 2.9 20.8 tr 1.8 0.55 27.1 29.6 16.1 88.0 13 5.2 27.7 tr 2.0 0.43 22.6 30.7 11.8 86.1 14 2.6 24.1 tr 2.8 0.21 28.0 31.2 12.2 89.0 15 8.0 21.6 7.3 4.6 2.9 26.4 0.1 33.6 90.4 16 5.3 6.7 22.6 8.8 2.4 5.9 0.2 45.4 94.4 17 5.2 14.6 36.7 9.8 3.7 14.9 0.1 14.2 90.9 18 5.7 16.8 29.8 7.4 2.0 18.9 0.1 21.7 95.1 a LOD=Loss on dry. b Sum of LOD, fibers, proteins, lipids, organic acids, free sugars, and polysaccharides, plus five major minerals. Ash contents are not included. c tr=Trace. Table 3. Concentration of major minerals in A. vera leaf and commercial samples (g/100g on dry basis) Sample Ca K Mg Na P Sum Ash 1 2.8 3.7 0.6 0.3 0.1 7.5 14.9 2 2.5 4.3 0.6 0.4 0.2 8.0 16.0 3 2.3 3.7 0.5 0.2 0.1 6.7 14.1 4 4.5 5.8 0.8 2.1 0.3 13.5 28.6 5a 4.4 6.9 0.8 2.2 0.2 14.5 28.8 5b 2.9 2.1 0.3 0.8 0.1 6.3 12.9 6 4.3 2.4 0.6 0.8 0.2 8.2 16.8 7 4.3 0.8 1.4 0.3 0.4 7.2 16.1 8 5.1 1.2 1.1 0.4 0.8 8.4 16.5 9 4.4 0.4 1.6 0.1 0.6 7.2 15.3 10 5.3 1.3 1.6 0.3 0.3 8.7 18.1 11 5.0 0.4 1.4 0.5 0.4 7.5 14.8 12 2.7 5.2 1.0 0.5 0.5 10.0 20.8 13 3.1 7.4 1.3 1.3 0.2 13.3 27.7 14 2.9 7.3 1.2 0.5 0.2 12.1 24.1 15 6.0 0.4 0.2 0.8 0.2 7.6 21.6 16 2.4 0.3 0.1 0.7 0.3 3.8 6.7 17 4.1 1.4 0.5 0.2 0.1 6.3 14.6 18 7.1 1.7 0.5 0.1 0.3 9.7 16.8 Figure 2. HPLC chromatograms of (A) organic acid standards; (B) whole leaf juice powder (sample 1); (C) gel juice powder (sample 2); and (D) rind (sample 3). Peak 1 = oxalic acid; peak 2 = tartaric acid; peak 3 = formic acid; peak 4 = L-malic acid; peak 5 = isocitric acid; peak 6 = lactic acid; peak 7 = acetic acid; peak 8 = isocitric acid lactone; peak 9 = citric acid; peak 10 = succinic acid; and peak 11 = fumaric acid. Downloaded from https://academic.oup.com/jaoac/article/101/6/1741/5654109 by guest on 18 June 2023
- 7. Zhang et al.: Journal of AOAC International Vol. 101, No. 6, 2018 1747 of freshness of aloe leaf (35). It is suggested that aloe leaves be processed as quickly as possible after harvesting to minimize any enzymatic reactions. A trace amount of acetic acid was detected in two aloe samples, 7 and 9. It is generally agreed that acetic acid is derived from the aloe acetylated polysaccharides, which can be a sign of degraded acetylated polysaccharides in aloe products. However, it is difficult to correlate acetic acid content to the quality of aloe product because the amount of acetic acid is reduced during the aloe manufacturing process through the heating and solvent evaporation processing steps. Free Sugars Analysis Free sugars in the aloe samples were measured by HPAEC- PAD and the results are given in Figure 3A–3D and Table 5. Three sugars, including glucose, fructose, and sucrose, were detected in organic acids in the rind, with the concentrations of 7.4, 7.8, 3.8, and 0.73%, respectively. Literature reported that a high amount of isocitrate was shown in aloe green tissue (rind), while it was lacking in the water tissue (inner leaf), where malate was the dominant acid (33). Therefore, isocitric acid and isocitric acid lactone have been used as marker compounds to distinguish aloe gel from whole leaf in quality control by the aloe industry (5). Although citric acid is not detected in gel, it is commonly used as a flavor or pH adjustment agent in the food industry, which makes it lack uniqueness as a marker for aloe identification. All the tested whole leaf juice powders (samples 10–12, 15, and 17) were found to contain high amount of isocitric acid. In commercial aloe gel samples, trace amounts of isocitric acid were still detected, which is supposed to be from the rind, as gel and rind usually cannot be separated cleanly in large scale production. In the aloe industry, ethanol-precipitated products are made by treating aloe juice with aqueous ethanol. The high-MW polysaccharides are not soluble in ethanol and precipitate from the ethanol solution, where small molecules remain dissolved. Theoretically, small molecule organic acids should be removed by ethanol treatment, but a considerable amount of organic acids, however, can still be seen in the ethanol-precipitated samples, which might be due to the existing complex of polymers and organic acids or ester bond of organic acid with polysaccharides. For example, one paper reported the isolation of maloyl glucans from A. vera gel, in which the malic acid was attached at each of the C-6 hydroxyl group of a glucan (34). Samples 7–14 contained a small amount of lactic acid, ranging from 0.11 to 4.0%, while it was undetected in samples 1–6 made fromthefreshaloeleaf.Researchhasindicatedthatthelacticacidis produced from malic acid by lactic acid bacteria. The reduction of the malic acid content and increase of lactic acid can be indicators Figure 3. HPAEC-PAD chromatogram of (A) standards of free sugars; (B) whole leaf (sample 1); (C) gel (sample 2); and (D) rind (sample 3). Peak 1 = glucose; peak 2 = fructose; and peak 3 = sucrose. Table 4. Concentration of organic acids in A. vera leaf and commercial samples (g/100g on dry basis) Sample Oxalic L-Malic Isocitric Lactic Acetic Isocitric acid lactone Citric Fumaric Sum 1 0.13 10.56 5.79 NDa ND 0.61 2.81 ND 19.90 2 0.07 22.73 ND ND ND ND ND ND 22.80 3 0.18 7.37 7.82 ND ND 0.73 3.69 ND 19.79 4 0.04 17.64 7.42 0.24 0.92 1.22 1.85 0.01 29.57 5a 0.03 22.40 0.82 0.22 0.05 0.17 1.79 0.01 25.63 5b 0.03 6.85 0.40 0.24 0.00 0.10 0.87 ND 8.66 6 0.04 6.34 11.66 0.13 1.10 2.14 1.40 ND 22.94 7 0.02 18.98 0.43 3.35 0.05 0.07 1.73 0.02 24.65 8 0.01 20.30 0.12 3.98 ND ND 2.59 0.01 27.01 9 0.02 22.70 0.43 2.10 0.07 ND 1.63 0.03 26.98 10 0.02 19.92 4.66 1.41 ND 0.90 4.42 0.04 31.37 11 0.01 12.83 2.57 2.89 ND 0.80 3.30 0.01 22.41 12 0.02 14.52 5.78 3.00 ND 1.15 2.64 0.01 27.12 13 0.01 20.94 1.01 0.11 ND 0.24 0.24 0.06 22.61 14 0.01 26.82 0.51 0.22 ND 0.11 0.24 0.05 27.96 15 0.03 7.33 11.39 ND ND ND 7.63 ND 26.38 16 0.07 4.01 ND ND ND 1.31 0.51 ND 5.90 17 0.06 5.69 5.23 ND ND 0.78 3.11 ND 14.87 18 0.07 15.95 0.37 ND ND 2.11 0.39 ND 18.89 a ND=Not detected. Downloaded from https://academic.oup.com/jaoac/article/101/6/1741/5654109 by guest on 18 June 2023
- 8. 1748 Zhang et al.: Journal of AOAC International Vol. 101, No. 6, 2018 through the ethanol-precipitation process, were found to contain very low amounts of free sugars, which can be understood because free sugars are soluble in the aqueous ethanol and were removed during the manufacturing process. Polysaccharides Analysis MWs and content of polysaccharides were determined using SEC-MALS-dRI detectors, and the results are given in Figure 4 and Table 6. The MW of tested polysaccharides by MALS measurement is the weight-average molecular weight, Mw. The resulting Mw found in fresh leaf samples 1–6 were around 567–2613 kDa, corresponding to the result of 1200 kDa from fresh leaf by MALS reported in literature (39). Decreased polysaccharide MW was observed if the fresh leaf was the commercial aloe juice powders. Glucose and fructose, but not sucrose, were detected in the gel made from fresh leaf. In most tested samples, glucose is predominant, with a ratio of glucose to fructose of around 2:1 to 4:1. With respect to leaf parts, the amount of glucose in gel is about 3 times of that in rind. High glucose and fructose content, in the range of 22–26 and 5–12%, respectively, were found in the commercial aloe juice products (samples 7–14) verses 4–14 and 2–4%, respectively, found in the original fresh leaf (samples 1–6). It cannot be determined if the increasing amounts of glucose and fructose were generated during the manufacturing process because of degradation of plant polysaccharides, the use of the enzymes such as cellulase for reducing the viscosity of viscous aloe juice, or the use as additives to adjust taste. No detailed information was provided by manufacturers. The increasing amount of fructose could be the breakdown product of fructose polymer, as fructans have been reported to be isolated from A. vera (36). Aloe leaf was reported to contain eight enzymes, including cellulase (37), which is responsibleforbreakingdowncellulosiccellwalls.Harvestedfresh aloe leaf must be processed within a short period of time to avoid degradation of polysaccharides by these endogenous enzymes. Different MWs of polysaccharides were found in all the tested samples, suggesting polysaccharide degradation occurs during manufacturing. However, no mannose was detected in any of the samples containing either higher- or lower-MW polysaccharides, indicating that the breakdown of the polysaccharides might occur between the glycosidic bonds of glucoses. In one patent, it was believed by the authors that acemannans were connected to each other, forming block polymer through mainly glucose-composed oligosaccharides. Endogenous β-1, 4 glycosidases began to break the linkage of the block polymer to liberate acemannan after aloe leaf was harvested (38). More studies are needed to understand structures of polysaccharides. The samples 15–18, manufactured Table 5. Concentration of free sugars in A. vera leaf and commercial samples (g/100g on dry basis) Sample Glucose Fructose Sucrose Sum 1 8.0 3.3 NDa 11.3 2 14.2 3.9 ND 18.1 3 4.6 2.3 0.06 6.9 4 16.6 5.0 0.16 21.8 5a 18.8 3.7 0.00 22.5 5b 5.3 1.3 0.00 6.6 6 3.9 1.5 1.66 7.1 7 26.2 11.1 0.38 37.7 8 23.4 10.9 0.56 34.8 9 25.2 12.1 0.46 37.7 10 23.0 8.0 3.51 34.5 11 23.7 9.4 4.60 37.7 12 22.1 5.4 2.09 29.6 13 23.9 6.8 0.07 30.7 14 23.8 7.2 0.13 31.2 15 0.04 0.02 0.01 0.07 16 0.14 0.03 ND 0.17 17 0.05 0.02 0.02 0.09 18 0.10 0.02 ND 0.12 a ND=Not detected. Figure 4. GPC-MALS-dRI chromatograms of whole leaf (red trace), inner leaf (green trace), and rind (blue trace). Table 6. Weight-average MW (Mw), number-average MW (Mn), and polydispersity (PD) by MALS measurement, and concentration of polysaccharides (g/100g on dry basis), in A. vera leaf and commercial samples Sample Mw, kDa Mn, kDa PD a Polysaccharides, % 1 567 302 1.9 8.8 2 1101 782 1.4 8.1 3 937 459 2.0 9.3 4 1191 870 1.4 8.1 5a 2613 2329 1.1 11.0 5b 2144 1845 1.2 6.9 6 856 444 1.8 10.4 7 19 16 1.2 8.3 8 22 19 1.2 12.5 9 28 19 1.5 7.1 10 237 49 4.9 7.5 11 23 20 1.2 15.4 12 194 78 2.5 12.2 13 126 88 1.4 11.8 14 136 73 1.9 12.2 15 947 544 1.7 33.6 16 1591 1196 1.3 45.4 17 2641 2511 1.1 14.2 18 1944 1615 1.2 21.7 a PD=Mw/Mn. Downloaded from https://academic.oup.com/jaoac/article/101/6/1741/5654109 by guest on 18 June 2023
- 9. Zhang et al.: Journal of AOAC International Vol. 101, No. 6, 2018 1749 In the present study, quantitation of the polysaccharides was achieved by mass recovery data obtained from SEC- MALS-dRI. The accuracy of quantitation was confirmed by injecting various known concentrations of pullulan and dextran standards. The recovery data are calculated by dividing the resulting concentration obtained from the dRI detector over the injected mass, and the results are given in Table 7. Recoveries are 92–102 and 84–101% for pullulan and dextran, respectively. Quantitative results of all the aloe polysaccharides are shown in Table 6. In fresh leaves, they are in the range of 8.1–11.0%. There are about 6.9% polysaccharides in the insoluble inner gel, which is likely from the residues of inner leaf gel because of the difficulty of exhaustively extracting the polysaccharides from the insoluble gel. Polysaccharides found in non-ethanol- precipitated samples are in the range of 7.1–16.1%, while they are higher in the ethanol-precipitated samples, in the range of 14.2–45.4%, and especially high in samples 15 and 16. Polysaccharides are generally dissolved in water and precipitated in the presence of ethanol. When the ethanol concentration increases, more polysaccharides are precipitated because ethanol reduces the polarity of the solution. Once ethanol concentration reaches about 80%, free sugars and other small molecules still dissolve in the solution, while the solubility of polysaccharides is poor. The polysaccharide purities are enriched through filtration or centrifugation to separate them from small molecules. It needs to be pointed out that the polysaccharide concentration determined by SEC- MALS-dRI is different from that determined by 1 H-NMR, not processed timely, e.g., within hours (data not shown). Endogenous or exogenous organisms of aloe can degrade polysaccharides (40). Polysaccharides extracted from inner leaf contained high Mw of 2613 kDa in sample 5a compared with that from rind (856 kDa) in sample 6. The four samples, 15–18, made from ethanol precipitation keep the high Mw with less degradation on the structure of polysaccharides, as ethanol deactivated the enzymes that may potentially hydrolyze the polysaccharides, and the time and condition to dehydrate the precipitated polysaccharides were much shorter and milder than those of the non-ethanol-precipitation process. In the non- ethanol-precipitation conditions, the whole aloe leaf or inner leaf was ground and pressed to release the juice. The juice usually contains only 0.5–1.5% solids, and a significant amount of water needs to be removed by evaporation.The MWof polysaccharides underwent a certain degree of degradation in processes such as heat. In addition, external enzymes, such as cellulase, are used in some manufacturing processes to facilitate the extraction of the gel from the leaf (40, 41), and the enzymatic treatment results in the reduction of the polysaccharide MW (42, 43). In the non- ethanol-precipitated products, the results of Mw measurement were markedly lower (19–237 kDa) than in ethanol-precipitated products, with Mw 947–2641 kDa. The commercial samples tested herein are from three different aloe product manufacturers, and even though no detailed manufacturing processes are provided by these manufacturers, the results clearly demonstrate that aloe products are manufacturing-process dependent and the MW of the resulting aloe polysaccharides do vary among different manufacturers and different manufacturing processes. Table 7. Weight-average MW (Mw) and recovery of pullulans and dextrans by MALS measurement Pullulan Dextran Mw, kDa Injected mass, μg Calc. mass, μg Mass rec., % Mw, kDa Injected mass, μg Calc. mass, μg Mass rec., % 10 25 23.2 92.7 50 25 21.9 87.0 50 46.5 93.0 50 42.3 84.6 100 93.8 93.8 100 91.2 91.2 21.7 25 24.2 96.9 80 25 23.2 92.8 50 48.3 96.7 50 46.8 93.6 100 97.2 97.2 100 93.0 93.0 48.8 25 23.2 92.7 150 25 23.7 94.8 50 47.1 94.1 50 46.8 93.6 100 95.8 95.8 100 94.6 94.6 113 25 24.4 97.6 270 25 24.8 99.3 50 47.9 95.8 50 49.6 99.1 100 95.2 95.2 100 98.2 98.2 200 25 24.4 97.5 410 25 25.2 100.9 50 48.3 96.5 50 48.9 97.7 100 97.6 97.6 100 96.1 96.1 366 25 25.5 101.9 670 25 25.1 100.5 50 49.9 99.8 50 50.4 100.7 100 97.6 97.6 100 99.4 99.4 805 25 25.6 102.2 1950 25 25.1 100.2 50 50.3 100.6 50 49.4 98.9 100 101.0 101.0 100 97.2 97.2 Downloaded from https://academic.oup.com/jaoac/article/101/6/1741/5654109 by guest on 18 June 2023
- 10. 1750 Zhang et al.: Journal of AOAC International Vol. 101, No. 6, 2018 References (1) Grace, O.M., Klopper, R.R., Smith, G.F., Crouch, N.R., Figueiredo, E., Rønsted, N., van-Wyk, A.E. (2013) Phytotaxa. 76, 7–14. doi:10.11646/phytotaxa.76.1.2 (2) Sung, C.K. (2006) in New Perspectives on Aloe, Y.I. Park, S.K. Lee (Eds), Springer Science+Business Media, New York, NY, pp 7–17 (3) Moghaddasi, M.S., Verma, S.K. (2011) Int. J. Biol. Med. Res. 2, 466–471 (4) Ni, Y., Turner, D., Yates, K.M., Tizard, I. (2004) Int. Immunopharmacol. 4, 1745–1755. doi:10.1016/j. intimp.2004.07.006 (5) Jones, K. (2012) in Aloe Vera Leaf, Aloe Vera Leaf Juice, Aloe Vera Inner Leaf Juice, Aloe vera (L.) Burm. f.: Standards of Identity, Analysis, and Quality Control, R. Upton P. Axentiev (Eds), American Herbal Pharmacopeia, Scotts Valley, CA, pp 13–16 (6) Ni, Y., Yates, K.M., Tizard, I.R. (2004) in Aloes: The Genus Aloe, T. Reynolds (Ed.), CRC Press, Boca Raton, FL, pp 75–87 (7) Dagne, E., Bisrat, D., Viljoen, A., Wyk, B.-E. V. (2000) Current Organic Chemistry 4, 1055–1078. doi:10.2174/1385272003375932 (8) Hamman, J.H. (2008) Molecules 13, 1599–1616. doi:10.3390/ molecules13081599 (9) Javed, S., Atta-ur-Rahman (2014) in Studies in Natural Products Chemistry, Vol. 41, Atta-ur-Rahman (Ed.), Elsevier B.V., Amsterdam, Netherlands, pp 261–285. doi:10.1016/B978-0-444-63294-4.00009-7 (10) Reynolds, T. (2004) in Aloes: The Genus Aloe, T. Reynolds (Ed.), CRC Press, Boca Raton, FL, pp 39–74 (11) Reynolds, T. (1985) Bot. J. Linn. Soc. 90, 157–177. doi:10.1111/j.1095-8339.1985.tb00377.x (12) Wu, X., Wan, J., Zhong, J., Ding, W. (2015) Chinese Journal of Tropical Crops 36, 1542–1550 (13) Eberendu, A.R., Luta, G., Edwards, J.A., Mcanalley, B.H., Davis, B., Rodriguez, S., Henry, C.R. (2005) J. AOAC Int. 88, 684–691 (14) Gu, W., Song, H., Wen, X., Wang, Y., Xia, W., Fang, Y. (2010) Carbohydr. Polym. 80, 115–122. doi:10.1016/j. carbpol.2009.10.074 (15) Gu, W., Wang, Y., Wu, T., Li, W., Wang, H., Xia, W. (2012) Carbohydr. Res. 349, 82–85. doi:10.1016/j.carres.2011.11.026 (16) Light Industry Standards of People’s Republic of China (2007) QB/T 2489 2007, Aloe Products for Raw Food Material, China Light Industry Press, Beijing, China (17) Monakhova, Y.B., Randel, G., Diehl, B.W.K. (2016) J. AOAC Int. 99, 1213–1218. doi:10.5740/jaoacint.16-0020 (18) Diehl, B., Teichmuller, E.E. (1997) SOFW Journal 123, 1015–1018 (19) Bozzi, A., Perrin, C., Austin, S., Vera, F.A. (2007) Food Chem. 103, 22–30. doi:10.1016/j.foodchem.2006.05.061 (20) Davis, B., Goux, W.J. (2009) J. AOAC Int. 92, 1607–1616 (21) Jiao, P., Jia, Q., Randel, G., Diehl, B., Weaver, S., Milligan, G. (2010) J. AOAC Int. 93, 842–847 (22) Edwards, J. (2012) in Aloe Vera Leaf, Aloe Vera Leaf Juice, Aloe Vera Inner Leaf Juice, Aloe vera (L.) Burm. f.: Standards of Identity, Analysis, and Quality Control. R. Upton P. Axentiev (Eds), American Herbal Pharmacopeia, Scotts Valley, CA, pp 33–42 (23) Turner, C.E., Williamson, D.A., Stroud, P.A., Talley, D.J. (2004) Int. Immunopharmacol. 4, 1727–1737. doi:10.1016/j. intimp.2004.07.004 (24) Femenia, A., Sánchez, E.S., Simal, S., Rosselló, C. (1999) Carbohydr. Polym. 39, 109–117. doi:10.1016/S0144- 8617(98)00163-5 (25) National Food Safety Standard (2010) GB 5009.3-2010 Determination of Moisture in Foods, Ministry of Health of People’s Republic of China, Beijing, China because the latter measures the amount of acetyl groups that correspond to acetylated polysaccharides, whereas SEC- MALS-dRI detection quantitates all the components that are eluted from the SEC, including the acetylated polysaccharides, non-acetylated polysaccharides, and proteins, etc. The quantitative relationship between MALS measurement and 1 H-NMR has not been established in the present study. Conclusions In this study, comprehensive investigations on the aloe chemical constituents were carried out on two sources of fresh A. vera leaves and several commercial aloe juice powders made by different manufacturers and different processes. The results show that fresh A. vera leaf is mainly composed of organic acids, minerals, proteins, free sugars, polysaccharides, and insoluble fibers. In the analyzed commercial juice products, the major constituents in non-ethanol-precipitated products are organic acids, minerals, free sugars, and polysaccharides, which account for greater than 90% of the entire composition determined. As fresh aloe leaf juice contains over 98% water, the juice preparation process is similar to a water extraction and all the water-soluble components mentioned above are extracted, while the water-insoluble substances, such as lipids, are not favorable for extraction. The majority of phenolic compounds existing in latex are removed through activated charcoal absorption and filtration during the manufacturing process because they are considered to be unwanted compounds (e.g., anthraquinone aloins). Ethanol precipitation increases the concentrations of polysaccharides and reduces the presence of small molecule compounds. The main components of the ethanol-precipitated products comprise only organic acids, polysaccharides, minerals, and proteins. The present work has provided the general composition of A. vera products. Although the chemistry varies with different manufacturing processes, the variations of ratios of the individual components remain consistent for each type of process. It is always a challenge to obtain accurate MW and quantity of the polysaccharides. Aloe polysaccharides are generally believed to be the main bioactive constituents of the plant and responsible for a number of reported biological activities and clinical effects. Quality control of aloe products includes the determination of MW and quantitation of aloe polysaccharides. It has been demonstrated that SEC-MALS- dRI is an effective tool for polysaccharide characterization without the need for actual aloe polysaccharide standards. Future work will focus on widening the testing scope of the polysaccharides, especially on the aloe polysaccharides with high MW and high branching, as well as on the correlations of the polysaccharide structures and their physical properties in solutions. Acknowledgments We would like to express thanks to Christopher Thompson and Zhengfei Lu for conducting DNA barcoding analysis. Thanks also to Sarah Beamer at the University of West Virginia for lyophilizing many of the aloe samples, and Jaimie Duensing for preparing many of the samples for lyophilization.Additional thanks to Jing Lan at Wyatt Technology, China, for technical support on MALS analysis. Downloaded from https://academic.oup.com/jaoac/article/101/6/1741/5654109 by guest on 18 June 2023
- 11. Zhang et al.: Journal of AOAC International Vol. 101, No. 6, 2018 1751 (26) Official Methods of Analysis (2012) 19th Ed., AOAC INTERNATIONAL, Gaithersburg, MD, Method 923.03 (27) Official Methods of Analysis (2012) 19th Ed., AOAC INTERNATIONAL, Gaithersburg, MD, Method 2003.06 (28) Official Methods of Analysis (2012) 19th Ed., AOAC INTERNATIONAL, Gaithersburg, MD, Method 2001.11 (29) National Food Safety Standard (2003) GB/T 5009.10-2003 Determination of Crude Fiber in Vegetable Foods, Ministry of Health of People’s Republic of China, Beijing, China (30) Official Methods of Analysis (2012) 19th Ed., AOAC INTERNATIONAL, Gaithersburg, MD, Method 993.14 (31) Pelley, R.P., Wang, Y.-T., Waller, T.A. (1993) SOFW Journal 119, 255–258 (32) Black, C.C., Osmond, C.B. (2003) Photosyn. Res. 76, 329–341. doi:10.1023/A:1024978220193 (33) Kluge, M., Knapp, I., Kramer, D., Schwerdtner, I., Ritter, H. (1979) Planta 145, 357–363. doi:10.1007/BF00388361 (34) Esua, M.F., Rauwald, J.W. (2006) Carbohydr. Res. 341, 355–364. doi:10.1016/j.carres.2005.11.022 (35) Tungala, A., Ajay, J.Y., Gajula, P.K., Dinesh, J., Deepak, K.J. (2011) J. Phytol. 3, 01–11 (36) Salinas, C., Handford, M., Pauly, M., Dupree, P., Cardemil, L. (2016) Plos One. doi:10.1371/journal.pone.0159819 (37) Surjushe, A., Vasani, R., Saple, D.G. (2008) Indian J. Dermatol. 53, 163–166. doi:10.4103/0019-5154.44785 (38) Strickland, F.M., Pelley, R.P., Kripke, M.L. Cytoprotective Oligosaccharide from Aloe Preventing Damage to the Skin Immune System by UV Radiation. U.S. Patent 5, 824, 659A, October 20, 1998 (39) Campestrini, L.H., Silveira, J.L.M., Duarte, M.E.R., Koop, H.S., Noseda, M.D. (2013) Carbohydr. Polym. 94, 511–519. doi:10.1016/j.carbpol.2013.01.020 (40) Waller, T.A., Pelley, R.P., Strickland, F.M. (2004) in Aloes: The Genus Aloe, T. Reynolds (Ed.), CRC Press, Boca Raton, FL, pp 139–205 (41) Ramachandra, C.T., Rao, P.S. (2008) Am. J. Agric. Biol. Sci. 3, 502–510. doi:10.3844/ajabssp.2008.502.510 (42) Qiu, Z., Jones, K., Wylie, M., Jia, Q., Orndorff, S. (2000) Planta Med. 66, 152–156. doi:10.1055/s-2000-11125 (43) Im, S.A., Oh, S.T., Song, S., Kim, M.R., Kim, D.S., Woo, S.S., Jo, T.H., Park, Y.I., Lee, C.K. (2005) Int. Immunopharmacol. 5, 271–279. doi:10.1016/j.intimp.2004.09.031 Downloaded from https://academic.oup.com/jaoac/article/101/6/1741/5654109 by guest on 18 June 2023