SlideShare a Scribd company logo
1 of 73
Download to read offline
View from south west showing fire at flare drum (photographcourtesy of the WesternMail and Echo Ltd)
The explosion
and fires at
the Texaco
'RefMilfordiner^aven,
24 July 1994
A report of the investigation by the Health and
Safety Executive into the explosion and fires on
the Pembroke Cracking Company Plant at the
Texaco Refinery, Milford Haven on 24 July l994
HSE BOOKS
O Crown copyright 1997
Applications for reproduction should be made in writing to: Copyright Unit, Her
Majesty's Stationery Office, St Clement's House, 2-16 Colegate, Norwich NR3 1BC?
First published 1997
All rights reserved. No part of this publication may be reproduced, stored in a
retrieval system or transmitted in any form or by any means (electronic, mechanical,
photocopying, recording or otherwise) without the prior written permission of the
copyright owner).
CONTENTS
EXECUTIVE SUMMARY (INCLUDING LESSONS I N BRIEF) 1
BACKGROUND 5
The refinery 5
The companies 7
Management structure 9
DESCRIPTION OF THE PLANT 9
The crude distillation unit 9
The fluidised cracking catalytic unit (FCCU) 9
FCCU instrumentation, control and protection systems 10
The flare system 13
Off-plots tankage 14
THE INCIDENT 14
EMERGENCY RESPONSE 17
DAMAGE 18
HSE INVESTIGATION 2 2
THE KEY FINDINGS 2 3
RESULTS OF THE INVESTIGATION 25
Operation and control of the FCCU 25
Modification of the flare drum pump-out system 29
Company assessment of pump-out modification 33
Corrosion 33
LESSONS FROM THE INCIDENT 34
ACTION BY THE COMPANY 40
ANNEXES
1 Sequence of events 41
2 Corrosion in flare line 57
3 Quantification 58
4 Management structure 59
5 Previous HSE involvement 61
6 Legislation 62
7 Abbreviations 63
8 Plant identification codes 64
EXECUTIVE SUMMARY
The incident
1 An explosion, followed by a number of fires, occurred at 13.23 on Sunday
24 July 1994, on the Pembroke Cracking Company plant (PCC) at the Texaco
Refinery, Pembroke. Two companies occupied the site: PCC (owned jointly by
Texaco Ltd and Gulf Oil (Great Britain) Ltd) and Texaco's Pembroke Refinery.
Paragraphs 30 to 35 describe this arrangement. The site produces hydrocarbon
fuels such as gasoline, diesel, kerosene and liquid petroleum gases (LPG) from
crude oil.
2 The start of the events that led to the explosion can be traced to the period
before 09.00 on Sunday 24 July 1994, when a severe electrical storm caused
plant disturbances that affected the vacuum distillation, alkylation, and butamer
units as well as the fluidised catalytic cracking unit (FCCU). The crude
distillation unit that provided feed to the PCC units was shut down as a result of
a fire which had been started by a lightning strike. During the course of the
morning, all PCC units except the FCCU were shut down.
3 However, the direct cause of the explosion that occurred some five hours later
was a combination of failures in management, equipment and control systems
during the plant upset. These led to the release of about 20 tonnes of flammable
hydrocarbons from the outlet pipe of the flare knock-out drum of the FCCU. The
released hydrocarbons formed a drifting cloud of vapour and droplets that found
a source of ignition about 110 metres from the flare drum. The force of the
consequent explosion was calculated to be the equivalent of at least four tonnes
of high explosive. This caused a major hydrocarbon fire at the flare drum outlet
itself and a number of secondary fires. The company emergency response team
and the county fire brigade effectively contained these fires and prevented
escalation by cooling nearby vessels that contained flammable liquids. Fires
were allowed to burn, under the supervision of the fire brigade, until the evening
of Tuesday 26 July 1994. This was the safest course of action as the flare relief
system had been incapacitated by the explosion.
4 The site suffered severe damage to process plant, buildings and storage tanks.
Due to the refinery's situation, well away from centres of population, off-site
damage was very limited. Properties in Milford Haven town, approximately 3 km
across the Milford Haven waterway, had some glass damage. Twenty-six people
sustained injuries on-site, none serious.
Mitigating factors
5 Two factors prevented possible fatalities. The first was good fortune. The
incident happened on a Sunday afternoon when the site had a relatively low
population of employees. Those people who were near the explosion found
themselves, by chance, in advantageous locations (a van carrying contractors
was about to enter the area which became enveloped in the fireball; men left a
blockwork building used for issue of permits to work just before its walls were
destroyed and the concrete roof fell to the ground).
6 The second factor was the quality of the overall safety provision on and around
the site. For example, the most hazardous installation, the alkylation unit, had
been built and operated to high safety standards, so that the attendant risk of
release of toxic hydrogen fluoride had been minimised. It withstood the forces of
the explosion on the neighbouring FCCU and its operators closed it down safely
according to planned procedure.
The cause
7 The incident was caused by flammable hydrocarbon liquid being continuously
pumped into a process vessel that had its outlet closed. The only means of
escape for this hydrocarbon once the vessel was full was through the pressure
relief system and then to the flare line. The flare system was not designed to
cope with this excursion from normal operation and failed at an outlet pipe. This
released 20 tonnes of a mixture of hydrocarbon liquid and vapour which
subsequently exploded.
8 The situation was caused by a combination of events, including:
(a) a control valve being shut when the control system indicated it was open;
(b) a modification which had been carried out without assessing all the
I consequences;
(c) control panel graphics that did not provide necessary process overviews; and
(d) attempts to keep the unit running when it should have been shut down.
9 In their attempts to restore the plant to normal operation on the day, the
company failed to take the necessary overall perspective, concentrating instead
on the local, immediate symptoms rather than looking for the underlying causes.
Furthermore, some arrangements for management of health and safety were
shown to be inadequate, illustrated by failures in company systems for:
assessing the risks from plant and procedural modifications; the use of
programmable electronic systems (PES); and management of inspection and
maintenance.
Subsequent actions
10 HSE attended the site on the evening of the day of the incident. The
investigation commenced as soon as the fires were under control, and
proceeded over many weeks until the full circumstances were known and the
site was safe to recommence production.
11 The occurrence of this major accident was notified to the European Union (EU).
12 The explosion and fires figured prominently in both the local and national news media.
13 Rebuilding the damaged refinery cost an estimated £48 million, and business
interruptions significantly affected the UK refining capacity.
14 HSE brought legal proceedings against the partners in PCC. Texaco Ltd and
Gulf Oil (Great Britain) Ltd each pleaded guilty to charges under the Health and
Safety at Work etc Act 1974, sections 2 and 3, at Swansea Crown Court, on 22
November 1996. The defendants were fined a total of £200 000 and ordered to
pay £143 700 costs.
15 This report concentrates on the failures and shortcomings that caused the
incident. It omits discussion of the many good aspects of the management of
health and safety identified during the investigation, some of which helped to
mitigate potential consequences from the explosion.
16 The lessons to be learned from this incident, both for refineries and industry as
a whole, are listed below. They are structured according to their nature, and not
in priority order, and they are discussed in detail in paragraphs 125 to 139.
Lessons from the incident
Safety management systems
17 Recommendation 1
Safety management systems should include means of storing, retrieving and
reviewing incident information from the history of similar plants.
Recommendation 2
Safety management systems should have a component that monitors their own
effectiveness.
Human factors
18 Recommendation 3
Display systems should be configured to provide an overview of the condition of
the process including, where appropriate, mass and volumetric balance summaries.
Recommendation 4
Operators should know how to carry out simple volumetric and mass balance
checks whenever level or flow problems are experienced within a unit.
Recommendation 5
The training of staff should include:
(a) assessment of their knowledge and competence for their actual operational
roles under high stress conditions;
(b) clear guidance on when to initiate controlled or emergency shutdowns, and
how to manage unplanned events including working effectively under the
stress of an incident.
Plant design
Protection systems
19 Recommendation 6
The use and configuration of alarms should be such that:
safety critical alarms, including those for flare systems, are distinguishable from
other operational alarms; alarms are limited to the number that an operator can
effectively monitor; and ultimate plant safety should not rely on operator
response to a control system alarm.
Recommendation 7
Safety-critical plant elements on which the safety of a process relies, ie whose
failure could lead to hazardous events, should be identified. Any safety system
used to protect against hazardous events should be specified, and subsequently
designed, based on an appropriate hazard and risk analysis so that the functions to
be carried out and the necessary level of integrity are systematically determined.
Plant layout
Recommendation 8
In new build, or re-equipment, projects and in reviews of existing plant layouts, a
risk assessment should be carried out with regard to the location, and suitability
of construction, of buildings and plant.
Flare system
Recommendation 9
In processes that employ a flare system, there should be effective arrangements
for the removal of slops from a flare knock-out drum that ensure that the removal
is promptly initiated and at an adequate rate to prevent overfilling the drum.
Plant modification
20 Recommendation 10
There should be a formal, controlled procedure for hazard identification and
operability analysis for modifications (including emergency modifications) that
ensures that all safety issues identified at the design stage are reflected in how
the modification is constructed and used.
lnspection systems
21 Recommendation 11
All safety critical parts of plant should be included by companies in
comprehensive inspection programmes.
Recommendation 12
lnspection programmes for corrosion should err on the side of caution, with regard to
the number and location of measurement sample points, concentrating on
measurement sample points where greater (or less uniform) metal loss is foreseeable.
Recommendation 13
All foreseeable operational conditions, not just pressure, should be taken into
account when setting the minimum acceptable thickness for pipe and vessel walls.
Emergency planning
22 Recommendation 14
Fire brigades, in consultation with appropriate major hazard installations, would
be wise to look at emergency plans particularly in respect of the availability of
adequate water supplies for fire-fighting and vessel cooling, to deal with the
worst case scenario.
BACKGROUND
The refinery
23 The refinery site occupies approximately 500 acres of the south shore of the
Milford Haven in South West Wales. By road it is 7 km west of the towns of
Pembroke and Pembroke Dock, Dyfed. Figure 1 shows the location of the town
of Milford Haven, 3 km away, facing the refinery across the Haven waterway.
24 Two smaller refineries and an oil-fired power station (Figure 1) are clustered
around the Haven near the Texaco site.
25 The population (including residential, commuting and labour force) within a 3 km
radius is approximately 15 300, within 24 km 69 500. However, these figures are
considerably increased during the summer holiday season.
26 The Texaco Refinery, as it is known locally, produces hydrocarbon fuels
including motor fuels (petrol and diesel), kerosene, gas oils, fuel oils and
Milford Haven
1Built up areas
Other Roads
Figure 1 Milford Haven, showing the location of the TexacoRefinery site
liquefied petroleum gases (LPG: commercial propane and butane).
27 The facilities comprise a 190 000 barrels per day crude distillation unit and
associated refining processes together with a blending and storage area, and
deep water marine terminal. Crude oil arrives by sea in tankers of up to 300 000
tonnes capacity. Product exports are largely by sea and pipeline, together with a
small volume that is moved by road.
28 Figure 2 shows the refinery itself. The process facilities are located at the south
end of the refinery. The units operated by Pembroke Cracking Company (PCC)
and Pembroke Refinery (PR) occupy distinct sections of the refinery site. The
crude oil tankage is north-west of the process area, intermediate and finished
products are kept in the tanks to the north and north-east, and LPG is stored to
the east. The flares are further to the east. A 15 metre high earth bank runs
nearly the whole length of the high ground north of the tankage area, so that
only the stacks and tallest columns can be seen from Milford Haven. North of
this ridge is the jetty and the fuel oil tankage.
29 There are ten process units in PR and eight in PCC. The main area affected by
the explosion and fires was PCC whose units include the fluidised catalytic
cracking unit (FCCU), butane isomerisation and HF alkylation units, and
supporting processes. Feedstocks for PCC are supplied by PR and Gulf.
The companies
30 The plant directly involved with the incident was the FCCU operated by PCC, a
partnership between Texaco Ltd and Gulf Oil (Great Britain) Ltd which was
established ahead of a major expansion and commissioning programme at the
refinery in 1982.
31 The PCC process units were adjacent to, and integrated with, the PR process units.
The Pembroke Refinery was owned by Texaco. PCC and PR were independent in
the areas of process operation, process engineering, accounting and computing.
There was a corporate training department (part of the personnel department) but
process operator training had been conducted separately by PR and PCC. Both
companies were on the same site but they were run as separate concerns.
32 Texaco provided a range of core services including maintenance, engineering,
inspection and the Environment, Health and Safety department which also
covered the fire-fighting facilities. Other departments covered both sites for
personnel services (including medical), public relations, quality assurance,
planning and security.
33 The companies employed about 600 people at the refinery, around 150 in the
PR process areas and 120 in PCC. There was a normal complement of around
400 contractors' employees on site. During shutdowns there would be up to
03
Figure 2 Therefinery site layout
Flare stack 19-F-102
Flare line
02-F-319 Flare knock-out drum
Control Room
Fluid catalytic cracking unit
Line to slop tanks
1400 on site. During work following the incident there were, unusually, up to
2300 contractors on site.
Management structure
34 The PCC management committee comprised six members, three from Texaco
and three from Gulf, none of whom was based on site. The Site Director of
Manufacturing and General Manager Pembroke Plant (the 'Site Director') had
operational responsibilities for all activities within the site boundary and reported
to the management committee, along with the General Manager of PCC.
35 The Site Director was the link between the on-site activities and both Texaco
headquarters and the PCC management committee. The two on-site operating
companies, PR and PCC, were each headed by a General Manager who, in
practice, reported to the Site Director. The reporting relationship between the
PCC General Manager and the Site Director was one of expediency. The PCC
General Manager was contractually responsible only to PCC's Management
Committee (Texaco/Gulf).
36 The company had an explicit health and safety policy, which stated its
commitments to the health and safety of its workforce. Annex 4 summarises the
structure for safety management at the refinery.
DESCRIPTION OF THE PLANT
Crude distillation unit
37 Crude oil was delivered to the refinery by sea and fed into the CDU where it was
separated by fractional distillation into intermediate products, including naphtha
and gas, kerosene, light diesel, heavy diesel, and heavier components. These
heavy fractions (vacuum gas oil or VGO) formed the feed for the vacuum
distillation unit (VDU) which in turn fed the fluidised catalytic cracking unit
(FCCU) of PCC. Additional VG0 was imported from Gulf Oil's refinery on the
north side of the Milford Haven waterway.
Fluidised catalytic cracking unit (FCCU)
38 The FCCU, where the incident occurred, was a continuous process unit converting
('cracking') long chain and cyclic hydrocarbons into smaller hydrocarbon products
used mainly in fuels.
39 The FCCU comprised:
(a) feed and catalytic sections, where the cracking reaction took place;
(b) regenerator, for regenerating the catalyst;
(c) fractionation, where the product streams were separated;
(d) recovery section, for further purifying the light fractions; and
(e) absorption, for recovering LPG from the fuel gas stream.
40 VG0 at 230-270'~was cracked by contact with a pre-heated catalyst in a large
reactor vessel, the 'cat cracker'. The reaction produced a complex mixture of
hydrocarbon gases and liquids. The 'spent' catalyst was regenerated by burning
off carbon in the regeneration section of the unit. The following fractions were
produced:
(a) ethane, methane and hydrogen, reused within the refinery as fuel gas;
(b) liquefied petroleum gas (LPG), a major product of the refinery,
containing propane, propylene, butane and butylene;
(c) naphtha, used as a gasoline ('petrol') component;
(d) light cycle gas oil (LCGO) used as a diesel blend stock; and
(e) heavy cycle gas oil (HCGO) used as a fuel oil component.
41 Another product, intermediate cycle gas oil (ICGO) was used within the unit as a
heat transfer medium. All the gas oils were used widely in the FCCU to transfer
heat to other parts of the process; although energy-efficient this inevitably meant
that the process controls and inter-relationships were complex. The products
listed above were separated from the mixture by fractional distillation and solvent
cleaning within the recovery section of the unit which contained a series of large
fractionating columns operating at elevated temperatures and pressures.
FCCU instrumentation, control and protection systems
42 The control and protection systems for the FCCU and other PCC plants were
based on three separate but linked systems, each using programmable
electronic equipment:
(a) distributed control system (DCS);
(b) critical process controller (CPC); and
(c) advanced control and process optimisation system (ACPOS).
43 The DCS (a Honeywell TDC 3000 system) provided the primary control and
alarm system for the FCCU. The CPC, a high integrity, independent monitoring
system, provided alarms and automatic shutdown on three areas of plant which
had been identified by the company as being critical to plant safety. These were:
the main FCCU reaction system, the wet gas compressor and the power
recovery train. Following the explosion, the CPC system shut the plant down as
intended. The ACPOS provided automatic control of selected process variables
on the FCCU, during stable plant operation, which were important for
maximising plant throughput and efficiency.
44 All plant measuring devices were either directly monitored and controlled by the
control system, or information was repeated across from other equipment and
made available to plant operators. The plant was controlled within the DCS
system by controllers, which automatically adjusted valves to maintain the target
levels, temperatures, pressures and flows entered by the operators. The
operators could also manipulate valve positions directly via DCS operating
console keyboards. The PCC control room accommodated the butamer and
alkylation units' operating consoles as well as the FCCU console which included
six display units and associated annunciators.
45 The operators controlled the plant from the DCS keyboards, and alarm and other
information was displayed on the screens. The photograph in Figure 3 shows the
control room operating environment.
Figure 3 Part of the main control room, showing the display screens and keyboards used to operate the
plant
Alarms
46 FCCU emergency and high priority alarm information was displayed as an 'area
alarm summary' on the DCS screens and it was normal practice to leave one of
the monitors with this information permanently displayed. Low priority alarms
could not be seen directly on this screen. Each time a process point (for example
a level, a temperature or a pressure) went outside the set values there would be
an audible signal and an indication would appear in the area alarm summary.
When acknowledged, the audible signal would stop. If the alarm were still active
it would continue to show on the screen, disappearing when cleared. The primary
displays, available to the operators for viewing alarms, were on monitors. On the
area alarm summary, a text description of the alarm location was shown together
with the alarm's priority, the type (ie whether it was a low alarm, high alarm, high-
high alarm, out of range alarm etc), the tag number (unique identifier) and the
time when the alarm first occurred. The most recent alarm was displayed at the
top of the first page and the oldest at the bottom. Approximately 20 alarms could
be viewed on this display. When there were more than 20 alarms in the system
the oldest alarms scrolled off the bottom of the page on to the second page, with
a maximum of five pages of alarms associated with this summary display.
47 Each alarm in the DCS system had a priority associated with it: emergency,
high, low, journal (recorded but not displayed) or no action. The operator was
presented with all alarms except 'journal' and 'no action'. In fact, the
'emergency' category was not being used at the time of the incident, except for
one alarm. All alarms were recorded in the system's historical alarm records.
48 In addition to the display monitors a small number of alarms were displayed
independently on hardwired annunciators (banks of small lighted panels with
their own sounder, with one panel corresponding to one alarm). Some were
mounted on the console and some mounted on the wall behind the console.
Operating displays
49 A number of alternative display formats were available within the DCS from
which operators could manipulate the process. These included graphical
displays, which a system designer could program, and standard displays having
a fixed format (eg bar graphs). Most FCCU process operations were carried out
through the operating displays, but some pumps were started and stopped
locally by the outside operators.
50 The operating graphics provided a line diagram representation displaying
process information for most of the FCCU. Alarms associated with the process
points were indicated on screen by colour changes on the process points. Plant
controllers could be operated through these displays via the change zone (this
was a purpose-built area at the bottom of a graphic which allowed plant control
operations to be carried out, such as opening a valve). These graphics were
designed by FCCU operations staff when the DCS was introduced to the FCCU
four years previously. Although these operating graphics were available, in
practice only the bar graph displays were used.
Bar graph displays
51 These standard DCS displays comprised eight indicators alongside one another,
having a fixed format. In the previous generation of equipment they were the
main graphical display and were the most commonly used operating display.
They were linked to preconfigured trends. The operators controlled the plant by
adjusting set points or valve positions from these displays.
The flare system
52 A flare system is of critical importance to the safe operation of a plant. Its
purpose is to dispose, safely, of waste gases and liquids discharged from
process units and storage areas, by separating liquids from gas and vapour
which are then burned at the top of the flare stacks. If an unrestricted route to
the flare tip were not available there could be either uncontrolled venting of
hydrocarbon to atmosphere, or exposure of process vessels to forces in excess
of their safe operating limits.
53 The flare (or blowdown) system on the Texaco refinery site was an arterial
pipework system taking discharges from all over the plant. The pipes were
connected directly to pressure relief valves, pump and other vents, and
manifolded into flare subheaders on each process unit. Within each unit a
knock-out drum, the 'on-plot flare drum', removed any entrained liquid from the
unit flare subheader before the subheader joined the main flare header. In
normal operation, the flare header operated at near ambient temperatures and
pressures. During plant upsets, due to the discharge from relief valves on the
plant, the flare line would experience locally elevated pressures, temperatures
above or below ambient, and rapid flows of liquid and gas. The design,
construction and maintenance of the flare system needed therefore to take
account of the most arduous service conditions that could be foreseen.
54 The refinery flare system had three parts:
(a) the sour flare, carrying acidic gases and hydrocarbons, the principal
contaminant in the stream being hydrogen sulphide, H2S; (this was the flare
system involved in the incident);
(b) the sweet flare, carrying mostly low molecular weight hydrocarbons; and
(c) the acid flare carrying hydrocarbon contaminated with toxic and corrosive gases
and liquids that need further treatment before they can be burned at the flare tip.
55 For safe operation at least one flare outlet must be operational. For this
purpose, the sour flare and sweet flare headers could be made common at a
connection manifold to allow the sour flare stack to be safely taken out of
service for maintenance, and the sour gas routed to the sweet flare stack.
The sour flare
56 Along its route to the sour flare stack, the main flare header increased in size to
36 inches (915 mm) diameter and was joined by a 30 inch (762 mm) header from
the FCCU on-plot flare drum. This drum received gases and liquids from the
FCCU and also from the PCC Merox unit. The connection was made through
four 90' elbows, one of which failed in service during the incident causing the
hydrocarbon release.
57 The route of the main flare line to the flare stack is illustrated in Figure 2, and is
shown in diagrammatical form in the sequence drawings in Annex 1. The on-plot
flare knock-out drum is marked 02-F-319, and the off-plot knock-out drum is 19-
F-102.
Off-plots tankage
58 This report does not give a detailed description of the 'off-plots tankage', which
is the provision for storage of fluid raw materials, products and effluent (known
as 'slops') in tanks remote from the production units.
59 However, among the extensive range of tanks, there was facility for receipt of
slops from the process, including those from the on-plot flare drum. Two tanks,
numbers 53 and 814, were mainly used for this. These tankage locations are
illustrated in Figure 2.
THE INCIDENT
60 The start of the events which led to the explosion can be traced to the period
before 09.00 on Sunday 24 July 1994, when a lightning strike started a fire on
the crude distillation unit. The ensuing plant disturbances and power
interruptions affected the vacuum distillation, alkylation, and butamer units as
well as the fluidised catalytic cracking unit (FCCU) where the eventual explosion
took place. Contrary to reports in the media by journalists and others, these
events, though significant in initiating a plant upset, were not the cause of the
release and explosion that occurred five hours later. These consequences
resulted from subsequent failures to manage the plant upset safely.
61 There follows a brief, very simplified description of the causes of the incident
with reference to Figure 4. Annex 1 provides a fully detailed account illustrated
by time sequence diagrams.
Location of the valves A B and C
Figure 4 Simplifiedprocess diagram, to illustrate the interaction of the key valves and vessels that led to the incident (paragraphs61 to 70)
62 Just before 09.00 hydrocarbon flow was lost to the deethaniser, a vessel in the
FCCU recovery section where lower molecular weight vapour fractions are
separated. This caused the liquid in the deethaniser to empty into the next
vessel along, the debutaniser (with its associated overhead accumulator vessel),
where further fractionation takes place. The system was set up to prevent total
liquid loss in vessels so the falling liquid level in the deethaniser caused valve A
to close, thus preventing hydrocarbon leaving the vessel. This had the knock-on
effect of starving the debutaniser of feed so the falling liquid levels in this vessel
caused the outlet valve, valve B, to close. The hydrocarbon in the debutaniser
was now blocked-in. Although there was no additional flow into the debutaniser,
the trapped liquid was still subject to heat. Therefore the liquid vaporised and
the debutaniser pressure rose until it caused the pressure relief valves to open
and the debutaniser to vent, for the first of three times, into the flare knock-out
drum (intended to remove liquid from the hydrocarbon vapour stream passing
from the relief valve to the flare stack) and on to the flare.
63 Shortly after 09.00 the liquid level in the deethaniser was restored so valve A
opened and flow was restored to the debutaniser. This should have caused
valve B to open and allow hydrocarbon out of the already pressurised
debutaniser into the naphtha splitter. However, valve B never opened.
Operators in the control room received signals wrongly indicating that it had
opened and the debutaniser continued to fill with liquid while the naphtha splitter
emptied.
64 The set-up of the displays on the operators control system was not conducive to
diagnosing the problems that were occurring. There was no overview of the
process and its mass balance. The process was broken up into discrete detailed
sections that could be called up onto separate screens. The operators' attention
was concentrated on the screens which showed the problems around the
deethaniser and the debutaniser; an overall process display screen would have
quickly informed the operators that although the instruments showed that valve
B was open, the reality was that no hydrocarbon was passing from the
debutaniser to the naphtha splitter.
65 To relieve the pressure on the debutaniser system the operators opened valve
C which allowed flow from the 'full' debutaniser overhead drum to another vessel
in the recovery section, the wet gas compressor interstage drum. The wet gas
compressor compresses the vapours produced in the unit into liquid that is
moved through the rest of the recovery section. Opening valve C did not prevent
the debutaniser becoming liquid-logged, so just after 10.00 the debutaniser
vented to flare via the flare knock-out drum for the second time.
66 The opening of valve C caused the liquid levels in the interstage drum to rise to
such an extent that it flooded into the dry end and caused the compressor to trip
(shutdown) at 10.08. Unfortunately, this meant that large volumes of gas had
nowhere to go in the plant, and had to be vented to the flare stack to be burned off.
67 The consequence of this venting to flare was very high liquid levels in the flare
knock-out drum. Its contents were increased still further by the operators' next
action which was to try to remove the flooding from the dry end of the interstage
drum by draining the liquid directly to the flare line via an impromptu
modification which employed steam hoses. This activity allowed the wet gas
compressor to be restarted at 12.28, which provided increased flow through the
unit, but also caused a further increase in pressure in the debutaniser. With
valve B being closed, the debutaniser vented to flare for the third time at 12.46.
This time it carried on venting until the explosion 36 minutes later.
68 Again action was taken by the operators to alleviate the pressure in the
debutaniser, and valve C was opened to allow hydrocarbon to move from the
debutaniser into the wet gas compressor system. The wet gas compressor
tripped (at 13.22) because the dry end became flooded. As previously
described, this meant that large volumes of gas had to be vented to flare.
However, by this time the flare drum was filled to a level beyond its design
capacity. The fast flowing gas passing through the overfilled vessel forced liquid
into the knock-out drum discharge pipe. This line was not designed to take
liquid; in normal service, liquid is removed by the flare drum. The line was
known to be corroded. The force of the liquid in the pipe caused it to break at an
elbow bend, releasing about 20 tonnes of highly flammable hydrocarbon from
which a vapour cloud formed and exploded.
69 Two circumstances prevented this unplanned liquid-filling being properly
managed. Firstly, warnings of the developing problems were lost in the plethora of
instrument alarms triggered in the control room, many of which were unnecessary
and registering with increasing frequency, so operators were unable to appreciate
what was actually happening. Secondly, a modification to the flare drum pump-out
system prevented liquid being pumped automatically to storage tanks outside the
unit (to slops). This modification, whose significance in this type of plant upset
situation had not been realised, had been carried out some years earlier to
prevent waste of potentially valuable hydrocarbon products for environmental
reasons. It altered the way the flare knock-out drum was emptied of liquid.
Originally liquid would have been pumped automatically at a high rate to 'slops'
storage when it reached a designated level. After the modification it was slowly
channelled back into the system that had just released it, so in the circumstances
leading up to the explosion no reduction of liquid in the system was achieved.
70 In the sequence diagrams, Figures 7 to 12, valves A, B and C are labelled with
their plant identifiers: FV 404, FV 436 and HCV 439 respectively.
EMERGENCY RESPONSE
71 Texaco operations personnel shut down and isolated process equipment when
two out of the plant's three flare systems were disabled as a result of the
explosion and fires. They worked with the company's Auxiliary Plant Fire
Brigade (APFB), who mobilised the first tender within one minute of call-out, and
the Dyfed County Fire Brigade (DCFB), to bring the fires under control. Texaco
APFB were called out three times on the day of the incident.
72 The last of the fires was extinguished about two and a half days after the
initiating explosion. Because the flare system was inoperative, the best option
was judged to be to allow the fires to burn until the source of hydrocarbon
fuelling them had been removed, while the site and county fire-fighting teams
kept vessels and other equipment cool.
73 The initiation of the off-site plan was carefully considered by the plant senior
management and DCFB when they arrived on site. This plan never had to be put
into operation, but it was held for review in case the fire spread to the alkylation
plant.
74 The company had set up, as part of their contingency plans, two Base Control
centres equipped with plant drawings, water resource data, computer modelling
facilities, communications and other essential equipment. One was situated in
the gatehouse area, one on site in the workshops area. Neither was used during
the emergency. The Base Control at the gatehouse was extensively damaged
during the explosion; the other facility was rejected by senior management and
DCFB in favour of accommodation in the main office block.
75 Some ground monitors in the blast area were damaged, but did not have serious
leaks. The Fire Hall and Medical Centre were both damaged in the explosion.
Access to the Medical Centre was difficult initially because of blast damage.
76 The Police set up official traffic control points to allow only essential personnel
and emergency vehicles access to the site.
77 An HSE inspector was on site within a few hours of the accident to start HSE's
investigation. HM Pollution Inspectorate and National Rivers Authority (now part
of the Environment Agency) responded the following morning and carried out
sampling and inspection for off-site environmental pollution effects. The
company's report on the incident indicated there had been no such effects.
DAMAGE
78 The first detailed inspection of the scene was made on 27 July 1994, after the
emergency services had left the site. A large area of the plant had suffered
severe structural damage as a result of the explosion and fires. There were
precarious sections of overhead duct-work, pipework, pipe-racks and other
structures. Access scaffolding which had been present before the explosion had
been destroyed or was now unstable. Structural risks were assessed and safe
access procedures agreed between HSE, site management, trade unions and
contractors.
79 The blast had also caused damage to buildings, vessels, columns and tanks,
varying from complete destruction of block wall buildings near the blast area, to
window and roof damage outside the site. The Control Room had some blast
protection features but had suffered internal damage because the door had been
open at the time of the explosion. This was because the earlier power
interruptions had rendered the air conditioning control inoperative. Some window
damage was caused to shops and other buildings off-site, as far away as Milford
Haven town.
80 Examples of some of the damage caused are shown in Figures 5 to 9.
Figure 5 The 30 inch flare line elbow bend that failed and fell to the ground, releasing the hydrocarbon
liquid and vapour
19
Figure 6 Widespreadsite damage
caused by the explosion
Figure 7 Some very large structures,
such as the ducting weighing several
tonnes shown here, were left balanced
in dangerous positions after the
explosion
Figure 8
investigati
the debris
One of the HSE
ion team examines part of
following the incident
Figure 9 One of the damaged shop
fronts in Milford Haven town, where
many properties had glass broken
HSE INVESTIGATION
The explosion was reported on local and then national news very soon after it
happened. The Cardiff-based HSE Principal Inspector responsible for the site
heard one of these bulletins and contacted the company at about 14.00 on
Sunday 24 July 1994. He was subsequently kept informed of site developments
by the company while he briefed the relevant HSE personnel and set in motion
the procedures set out in the area emergency plan.
At approximately 18.30, an HSE inspector arrived on site to assess the scale of the
incident and to gather information to brief the multi-disciplinary HSE investigation
team which was going to meet at the Cardiff area office at 08.30 on Monday 25
July. This meeting was chaired by the acting Field Operations Division (FOD) Area
Director with input from the FOD Regional Director. Following this meeting
inspectors were sent to the site to start the investigation, while the Cardiff area
office conference room was established as an incident room.
An on-site investigation team, led by the Regional Director, was established by
the time the fires were extinguished on Tuesday 26 July 1994. At this time the
incident room was transferred from HSE Cardiff to a room on the site provided
by the company. The investigation team included: inspectors from the Wales and
South West of England area office; specialist inspectors in chemical,
mechanical, electrical, civil and process safety engineering from the Wales and
South West of England Field Consultancy Group; and experts in fire, explosion,
mechanical engineering and instrumentation from the Technology and Health
Sciences Division and the Health and Safety Laboratory, Sheffield and Buxton.
As well as establishing the causes of the incident, it was important to ensure
that the damaged site with its highly hazardous inventories was made safe, and
that any actions by the company to rebuild the plant and reinstate its activities
were appropriate with regard to the risks involved. With this aim, the HSE
presence was organised into the following teams:
Liaison (to provide a link between the HSE teams and the company, emergency
services, other government bodies, media etc).
Mechanical engineering.
Process engineering.
Electrical engineering, instrumentation and control.
Safetylreinstatement.
Legal issues.
85 Inspectors generally contributed to more than one team. During the course of
the investigation members of the HSE teams:
(a) carried out detailed examinations, witnessed tests of equipment in situ, and
made photographic records of the plant involved in the incident;
(b) took possession of a large number of items of plant and equipment for further
detailed examination at HSE's research laboratories. Each piece of equipment
was individually numbered and photographed on-site before being removed.
Access to the larger pieces of plant identified by HSE as relevant to the
investigation was strictly controlled until they had been fully examined;
(c) interviewed witnesses; and
(d) examined documents relevant to the plant and to the company's
management systems.
86 The company, its employees and their trade union representatives provided full
co-operation throughout the HSE investigation. Managers and safety
representatives were kept informed by regular meetings about the progress of
HSE's investigation. Fifty-four written statements were taken. The company set
up its own internal investigation at an early stage and invited a member of the
HSE investigation team to be present at its meetings. There was a full exchange
of information, between HSE and the company, relevant to the ongoing
investigation and the reinstatement of the plant.
THE KEY FINDINGS
87 A brief overview of the content and results of the investigation is provided
below. This is followed by a more detailed explanation, in paragraphs 89 to 124,
using the same headings.
88 Following an initial assessment the investigation concentrated on a number of
areas which were clear contributory factors to the incident.
Operation and control of the fluidised catalytic cracking unit
(FCCU)
Liquid flows and mass balance
The control system allowed more liquid to enter the recovery section of the
FCCU than was leaving it.
Energy conservation and control
The control system allowed another inputloutput imbalance, this time of heat
energy.
Organisation and control
During the process upset the actions taken were too reactive, with nobody
adequately standing back from the action to make a detached assessment of the
cause of the problem, ie 'managing'.
Operating displays
The configuration of the display-screen based information system made it
difficult for operators to identify the cause of the upset.
Alarms
Too many poorly categorised alarms overwhelmed the operators as the process
upset developed.
Instrument maintenance
The incorrect behaviour on the day of a number of instruments used for control
contributed significantly to the causes of the incident. A significant proportion of
the instruments which HSE later tested were found to be in need of
maintenance.
Modification of the flare drum pump-out system
Flare drum pump-out modification
The flare drum is an important part of the flare system, which during the incident
was relieving overfilled vessels. An earlier modification to its pump-out system
severely reduced its automatic liquid handling capacity. It overflowed, causing
liquid to enter an outlet designed for gas only. This consequently failed,
releasing the flammable hydrocarbon in a cloud which exploded.
Company assessment of pump-out modification
There was no recorded safety assessment concerning this modification. It was
possible to restore the original pump-out capability, by manually opening a
valve, but this procedure had fallen into disuse from lack of practice and written
procedures.
Corrosion
The flare drum outlet line which failed, releasing the hydrocarbon that exploded,
was severely corroded. The presence of corrosion was known, but the full extent
was not recognised because it had not been inspected at the point of failure,
where there were inspection access difficulties. Although the flare line was
clearly not properly maintained at this point, the investigation subsequently
determined that this corrosion was not a direct cause of the incident.
RESULTS OF THE INVESTIGATION
Operation and control of the fluidised catalytic cracking unit
(FCCU)
Liquid flows and mass balance
89 The liquid flows within the FCCU recovery section were controlled by control loops
linking the level within each vessel to its discharge rate. The underlying logic was
that if the discharge rate increased it would eventually overtake the input rate and
the level in the vessel would fall. It also follows, however, that liquid would
accumulate in the system in the event of the material discharge rate being
reduced to below the input rate (as there was no control over the input flow).
90 In this type of system, which relies on a single control loop, it is essential that
the designed maximum output flow will always exceed the maximum input flow.
If this condition cannot be guaranteed, the installation of a second control loop
acting on the input would improve the system's control and safety since it would
ensure that, in the event of continuing accumulation occurring within the system,
the input would be reduced or shut off. In essence, it is good practice to have a
back-up feedback control. This is often achieved by a high level trip that
automatically stops input flow.
91 As there were only single output control loops on the FCCU recovery section, it
follows that a serious process upset leading to material accumulation would
occur when flow out of a vessel was restricted below its input rate for whatever
reason. In this incident, an undiagnosed blockage in the system caused this
restriction, which led to the liquid accumulation, which eventually exceeded the
capacity of the relief system resulting in loss of containment.
Energy conservation and control
92 There were heat exchange systems within the FCCU recovery section designed
to conserve energy by using the hot product from one part of the process to
preheat or reboil the inputs to that of another part of the process. This involved
a number of complex energy balances within the system. Heat energy could be
lost from the recovery section through cooling in the fin fans or water chillers.
93 In the same way that the mass balance has an implication for the control of the
process, so does the energy balance. It is important to be able to remove energy
from the system in a plant upset, so reflux systems which actually withdraw
energy from the system, eg the fin fans, are given priority over the heat
exchangers which just move it from one part of the unit to another. In the
context of a plant upset the balancing of such inter-relationships can add to
control difficulties, since correcting a high temperature in one vessel may raise
temperatures elsewhere in the process. Reliable process control requires that
energy input cannot exceed the capacity to remove it from the system.
Organisation and control
94 The flexible, multi-skilled team on the FCCU contained individuals capable of
fulfilling more than one job function. In upset conditions it was normal for all
levels within the management structure to 'help out' in the control room. This
flexible approach to operating control systems can be beneficial, but raises
some potential control problems. Where more than one operator is working, an
increased emphasis on communication is required to ensure that each is
working with the team, and contradictory operations are avoided.
95 There was the risk in this serious upset that, as people at senior level helped
out, they took on operating roles rather than taking an overview of the whole
process. Decisions were made on an individual, too reactive, rather than a fully
co-ordinated, basis.
Operating displays
96 Under the FCCU control system that existed on the day of the incident any
imbalance in liquid flows through the FCCU could lead to liquid accumulation. It
was therefore important that any imbalance in liquid flow be detected so that the
mass flows of the unit could be returned to a balanced position.
97 The plant was well-equipped with level alarms which showed where liquid was
accumulating, but it was more difficult to assess the relative flows through the
vessels and the overall mass balance of the unit. The process of fractional
distillation requires that one raw material is divided into many fractions. While it
was easy to assess the unit feed rate, the various outputs of the process were
spread over five product streams. This generated a practical problem, in that
the accumulated outputs of the system may be spread across several different
control display units, and the overall output of the unit would not be readily
apparent unless the control systems were configured to meet this need.
98 This need was not met; there were no displays providing an overview with an
appropriate timescale on the FCCU. Therefore it was difficult to obtain a
complete picture of the whole, or large sections, of the process. In a primarily
display-screen based operating system, the provision of good overview displays
is of particular importance, as the operator does not have access to a
continuously available set of panel indicators. During the incident no-one from
the operations department had a complete picture of the status of the FCCU.
99 The actual FCCU graphics on the operating displays were not best designed and
configured to help operators control the process.
(a) The operating graphics on the FCCU contained limited amounts of process data
per graphic, and did not make use of colour and intensity to highlight process
data.
(b) Some graphics contained details of the internal structure of plant items.
However, displaying the structure of plant items is useful only if measurements
or derived information (eg pressure, flow, temperature) are also displayed to
give the operator information relevant to the plant status.
(c) Text was used unnecessarily at times in the FCCU graphics. Text takes up large
amounts of space on a graphic and there were instances where the same
information could have been better indicated by colour change.
Alarms
100 In the system as it was configured on the day of the explosion, the chances of
the operators restoring control by manual intervention decreased the longer the
upset condition persisted. This was because they became progressively
overloaded with an increasing barrage of alarms.
101 Observations from the distributed control system (DCS) alarm records indicated
that during the incident, alarms were being presented to operators at the rate of
one every two to three seconds. Alarms going off this frequently resulted in
operators cancelling them because of their nuisance value without necessarily
recognising what they meant.
102 The alarm records were subdivided into journals (recorded lists). Journals are
used mainly by process engineers for post-event diagnosis. The number of
alarms which were received by the operator just prior to the incident could not
be quantified accurately because four of the 16 relevant journals had lost all
data relating to the incident. They had been overwritten by alarms occurring
later in the day (each alarm journal holds only 500 records and the printouts
were taken four hours later). These four journals were related to the equipment
which was most closely concerned with the incident and therefore generating
most alarm signals. From the limited amount of alarm information relevant to the
event which was preserved from just one of the journals, it was seen that in the
last 10.7 minutes before the explosion the two operators had to recognise,
acknowledge and take appropriate action on 275 alarms. At times during the
morning operators were doing nothing but acknowledging alarms.
103 There were 1365 monitoring points connected to some form of instrumentation
on the FCCU. Of these, 55% (755) had one alarm configured and 31% (431) had
two alarms configured. In addition there were another 190 alarms generated
from controllers built into the system software. The total number of alarms
configured was around 2040.
104 Of the alarms configured in the DCS system, 87% were high priority and 13%
were low priority alarms. In the recovery section of the FCCU the company had
not developed the same level of alarm prioritisation as in the catalytic section.
Certain emergency alarms in the recovery section, though not for the flare drum,
were provided on the critical process control system (which subsequently
worked as designed), but on the DCS system only one alarm was given
emergency priority. As the majority of alarms were assigned the same high
priority, virtually all were presented on the area alarm summary and the
operators were unable to tell which alarms were critical to safety and which were
not. There was no philosophy for determining what priority an alarm should have
and no control was exercised over the number of alarms in the system.
105 At 12.56 the high level alarm for the flare drum was activated. There is no
evidence that it was seen. There were approximately 25 minutes between the
triggering of this alarm and the explosion. A number of other critical alarms (not
directly related to the incident) also appear to have been missed among the
many equal status alarms.
Instrument maintenance
106 During the incident a number of instruments displayed abnormal behaviour. HSE
examined and tested 39 instrument loops (those most closely related to the
incident). Of the 39 tested, 24 required attention to correct deficiencies which
varied from minor mechanical damage to major faults which rendered the loop
inoperative. Some loops contained more than one fault. Faults were grouped as
follows:
(a) major (loop inoperative in 'automatic' mode or seriously deficient) - six faults;
(b) significant (errors in measurement or calibration) - 11 faults;
(c) housekeeping (mechanical damage, valves passing etc) - seven faults;
(d) incorrect information (inaccurate data sheets) - seven faults.
107 With the possible exception of the faulty debutaniser outlet valve (valve B)
described in 'The incident' section in paragraph 62, none of the faults is
believed to have occurred spontaneously on the day of the incident. All existed
prior to the incident, and some were known, but a decision had been taken to
defer action until the next planned shutdown. A review of the faults indicated:
(a) some of the faults could have been detected by simple visual inspection;
(b) some of the faults were known about but were being lived with;
(c) some of the faults were due to design-related errors where the cause would not
have been apparent to a technician following a simple loop check but would
have required an engineering investigation to diagnose and correct;
(d) a number of instruments had clearly not been well-maintained as their process
isolation valves were passing; and
(e) none of these items had previously been identified as safety-critical.
108 It would be easy to dismiss the sticking shut of valve B as a 'one-off' equipment
problem, but it is likely that the poor condition of associated instruments
contributed to the valve remaining both shut and undetected, leading eventually
to the overfilling of the flare drum (the description provided with Figure 11 in
Annex 1 provides an example). It is believed that valve B stuck shut at
approximately 08.50, as the level and flow indicators downstream of this valve
all fell to zero after this. However, the flow indicator closest to the valve
continued to indicate a flow and the level in the bottom of the debutaniser, while
high, was not at its maximum (refer to 'The incident' section for more detail).
Both of these readings are believed to have been erroneous.
In the sequence diagrams in Annex 1, Figures 11 to 16, valve B is labelled with
its plant identifier FV 436.
Modification of the flare drum pump-out system
This section deals with the design and modification of the on-plot flare liquid
knock-out drum 02-F-319 (referred to as flare drum F-319)
Flare drum F-319: liquid handling capacity
109 Flare system design is covered by a Texaco design standard GEMS G-5D9
which also refers to the relevant American Petroleum Institute guidance (API
RP-521). In particular, the mechanical design section of GEMS G-5D9 states:
'Each knock-out drum shall have 15 minutes surge volume at design liquid input
and no pumpout. This volume shall be between the level at which the pump
starts and the maximum liquid level. The maximum liquid level shall not exceed
50 per cent of the drum diameter. The pump must empty the drum from the
maximum liquid level to the pump shut off level in 30 minutes, assuming
negligible liquid flow to the drum.'
110 As designed, the flare drum F-319 had adequate volume to provide over 20
minutes capacity, at the maximum foreseeable rate at which it could be filled
(known as the 'worst case liquid relief'), and not counting any pump-out facility.
In practice, the capacity of the system as it was operated before modification
should have been well in excess of 20 minutes, due to pump-out at the same
time as liquid fill. This was well within the standard quoted above, before the
pump-out facility was modified in 1991.
Flare drum F-3 19: pump-out modification
111 With reference to Figure 10, the initial arrangement of the flare drum before it
was modified in 1991 had interlocks that existed between the drum level
transmitter(') and the valve(*) that allowed liquid to leave the flare drum. In the
event of a high liquid level the closed valve would open automatically, clearing
the line to slops tankage and also causing the discharge turbine pump to be
provided with steam. This was an automatic control loop which would both start
the discharge pump and route the liquid contained in the vessel to slops, at the
designed pump-out rate of over 200 m3h-l. Removing the liquid to slops meant
that the liquid was being removed from the FCCU and flare systems. If the level
had continued to rise in the flare drum a high level alarm(3)would have been
initiated on the main control panel. A separate high-high level alarm(4)was
intended to activate a local air horn and control room alarm if the liquid rose to
50% of drum volume.
112 Following the 1991 modification the sour water and other liquid that collected in
the boot (lowest) section of flare drum F-319, was pumped back into the
recovery section of the FCCU. This meant that hydrocarbon accumulating in the
unit, because of abnormal conditions, was just recycled instead of being
removed to off-plot slops. It was possible to reconfigure the system to its
original efficiency by manually opening valves so that the liquid could be
pumped to slops, but this had rarely been done in practice (in fact there were no
written procedures to show how or in what circumstances it should be done).
113 Figure 10 explains the arrangement of the modified pump-out facility in more
detail. The need for the modified control and routing of material to slops
followed a company initiative to reduce pumping to slops, on perfectly
reasonable grounds of efficiency and environmental improvements. The drum
level transmitter(') was retained, but the level controller(5)now operated a
switching valve which could initiate the pump-start by directing steam to the
pump turbine and stop the pump when the level dropped. This level control was
designed to regulate the drum boot-levels of liquid and consequently the start
and stop controls would normally regulate the removal of approximately 5 m3 of
Figure 10 Diagrams to illustrate the modification to the flare knock-out drum pump-out arrangements
Recovery
sect~onof
FCCU
Recovery
sect~onof
FCCU- Flare l~ne Flare 11ne
-
r Flare r(
Automatic
sp~llback
l~ne
Vapour
--
I
I
I
II
I
I
I
I
I
I
I
Flare
-
I
I
I--
Slop
tank
Or~fice/ -Manual7-valve normally closed A
plate 221m3.hr (Could be opened by hand
to drrect flow to slop)
Flare Drum 02-F-319
after modification
Vapour
--
7m3.hr
d
W
FTManual valve
221m3.hr normallyopen
Flare Drum 02-F-319
before modification
0214m3.hr
4
l
I
I
I
I
I
I
I
I
I
I
I
I--
Slop
tank
liquid from the bottom of the drum. The pressure output from the drum level
transmitter(') was also routed to an electronic tran~mitter(~)that relayed the
liquid level signal to the DCS display screen in the control room, with associated
high and low level alarms. The output from the drum level transmitter(') was also
taken to the slops line valve(2)but that line was isolated by a closed manual
gate valve, which prevented discharge to slops unless a decision was taken and
instruction given to send someone to the valve to open it.
114 The high-high level alarm(4)was retained and activated alarms both locally and
in the control room. The alarm was a float switch, but the set point at which the
alarm was triggered was not visible from outside the drum. It was therefore not
possible to be certain at which point within the range of the switch (ie 42 to
58%) the alarm would have sounded. However, it is certain that before a level
equivalent to the upper tapping point (58% of drum volume approximately
130 m3) was reached, the alarm would have sounded.
115 The pipework was re-routed so that the pump would now discharge
automatically back into the secondary overhead accumulator (ie back into the
FCCU process). This discharge back to the process was limited by a restriction
orifice that permitted a flow of only between 7 and 9 m3h-l.The pump's
maximum discharge rate (the original pump-out system capability) was around
221 m3h-l, so a spill-back line was fitted to the drum, which would take the
excess flow when the pump was running. The modified system was still
physically capable of discharging excess liquid to slops, but the automatic
system that had previously existed was replaced by one which required manual
intervention.
116 The effect of the modification preventing the automatic pump-out to slops was
effectively to change the protection provided for the plant from an automatic to a
manual system.
117 An engineering request (ER) dated 29 August 1987 sheds light on the difference
between the original intention of the modification and the way it actually came to
be used in practice over the years. The ER actually describes the modification
which would reduce pump-out rate from the original 221 m3h-' to 7 m3h-l.The
idea of the modification, which was implemented in 1991, was to reduce the load
on the effluent treatment plant during normal operating conditions. The design
intention was to revert to the original full pump-out capability (by opening
manual valves) if the liquid level in the flare drum should rise to the second high
level alarm. However, failure to take this manual action would increase the
pump-out time from less than 30 minutes to over 15 hours.
118 In practice the full pump-out capacity was seldom, if ever, made available after the
modification and was certainly not used on Sunday 24 July 1994. This contributed
directly to the incident. The flare drum F-319 liquid level indicator showed that the
drum had filled up at a rate similar to a worst case liquid relief by about 10.10 on
the morning of the incident, because of product venting from the debutaniser. The
liquid level fell slowly because of the low pump-out rate until a further significant
fast filling at about 12.46 which resulted in a second high level alarm at 12.56.
The vapour relief load from the FCCU overhead accumulator (as explained in 'The
incident' section and the detailed description of the sequence of events in Annex
1) just prior to the incident was then likely to have been sufficient to force liquid
into the line due to the high liquid level in F-319. The corroded line, which in any
case was not designed for liquid loads, therefore failed due to the excessive loads
imposed, releasing the hydrocarbon that subsequently ignited.
Company assessment of pump-out modification
119 The records concerning this modification did not include any 'safety
assessment'. Subsequent HAZOP studies did generically identify the potential
problem area of high liquid levels in knock out drums, and indeed triggered other
concerns on pump-out capability (such as whether a single pump was
sufficiently reliable without a standby). However, the full implications of
modifying the rate of automatic pump-out from flare drum F-319 had not been
scrutinised in detail.
120 A key feature of the pump-out modification was reliance on appropriate operator
manual action to deal with high drum liquid levels. However, in practice,
personnel did not have instructions or experience of reconfiguring the system to
pump to slops at the desired rate of 221 m3h'".
121 There should have been, as a minimum requirement, an instruction to revert to
full pump-out rate during difficult operating conditions which resulted in a heavy
flare loading, with the first and second drum level alarms as a back-up prompt
for the necessary intervention. The engineering request did not specify this
standard, stipulating manual intervention only in response to the second high
level alarm. It was not stated what action, if any, was to be taken in response to
the first high level alarm.
Corrosion
122 At the time of the explosion, the 30 inch diameter flare outlet line from vessel
flare drum F-319 had become severely corroded. There is no suggestion that the
degree of corrosion caused the release of liquid and vapour which ignited in the
incident - under the excessive forces in the line at that time, it probably would
have failed whether corroded or not. But the companies had failed to maintain the
line so that it could withstand foreseeable forces acting on it. In the section of
pipe which failed, shown at Figure 5, the corrosion had progressed well beyond
the nominal corrosion allowance. There were perforations in some regions, and
remaining thicknesses down to 0.3 mm in the vicinity of the rupture were found
when measurements of the failed elbow were made after the incident.
123 The flare system was scheduled for repair, and partial replacement, during the
refinery shutdown planned for the spring of 1995. This shutdown had been
deferred from the autumn of 1994. The company believed that the flare line
would be safe until the spring 1995 shutdown, but they did not have knowledge
of the extent of corrosion at the point which ultimately failed because no survey
or inspection measurements had been done at that precise location.
124 Further details of the extent of corrosion which the investigation revealed are
included as Annex 2.
LESSONS FROM THE INCIDENT
125 It is common, in major accident investigations, to find that a number of
coincidental failings, some of which may have existed for some time, have come
together resulting in the eventual explosion, fire, or release of toxic material.
This incident is no exception.
126 HSE's investigation identified a number of lessons from the incident of 24 July
1994. The purpose in publishing these lessons is to stimulate those in other
industries, as well as the refining and petrochemical industries, to improve the
standards of safety management and control on sites where there is a risk of
major accidents. The lessons are grouped under the following headings:
Safety management systems (SMS)
Human factors
Plant design
Plant modifications
Inspection systems
Emergency planning
Safety management systems (SMS)
127 All the key elements of the incident, and the lessons drawn from it, have been
seen and publicised before, in major accidents around the world. Those who are
responsible for operating hazardous plants must have systems in place that
bring to their attention these lessons of history.
Recommendation 1
Safety management systems should include means of storing, retrieving and
reviewing incident information from the history of similar plants.
This is the philosophy underlying the distribution of information in various
commercial databases and publications and also one of the intentions behind
the record-keeping requirements of the Construction (Design and Management)
Regulations 1994.
128 The incident investigation demonstrated that some of the company's crucial
safety management systems were not adequately performing their function.
Examples are the systems for modifications (paragraph 116 onwards),
instrument maintenance (paragraph 106 onwards) and inspection (paragraph
122 onwards). The company was unaware of these defects in its safety
management systems because its monitoring of their performance did not
effectively highlight the problems.
Recommendation 2
Safety management systems should have a component that monitors their
own effectiveness.
Human factors
129 The incident developed from its initial causative problems largely because of the
combined effects of two factors. Firstly, operators were not provided with
information systems configured to help them identify the root cause of such
problems (paragraph 97 onwards). Secondly, the preparation of shift operators
and supervisors for dealing with a sustained 'upset', and therefore stressful,
situation was inadequate (paragraphs 94 and 95). The interface between the
operators and the control system should have been designed to give the
operators and managers overview facilities through the display. This was not the
case and the discrepancies in mass and volumetric balance in the process, that
would have provided a powerful indication of how the problems should have
been dealt with, were not noticed. Some managers and supervisors were
involved in 'hands-on' operational matters instead of performing a strategic and
diagnostic role. This resulted in action being concentrated on the symptoms of
the problem, and not the causes.
Recommendation 3
Display systems should be configured to provide an overview of the condition
of the process including, where appropriate, mass and volumetric balance
summaries.
Recommendation 4
Operators should know how to carry out simple volumetric and mass balance
checks whenever level or flow problems are experienced within a unit.
Recommendation 5
The training of staff should include:
(a) assessment of their knowledge and competence for their actual
operational roles under high stress conditions;
(b) guidance on when to initiate controlled or emergency shutdowns and how
to manage unplanned events including working effectively under the
stress of an incident.
Plant design
Protection systems
130 The alarm system was such that warnings of crucial problems were lost in the
plethora of general and less important alarms (paragraph 100 onwards). On the
TDC control system, only one alarm was designated 'emergency', of the rest 870h
were classified 'high priority' and 13% 'low priority'. With alarms going off every
two to three seconds, operators did not and could not react appropriately to each
alarm. Each alarm should have had a clearly defined purpose, such as safety,
equipment failure, abnormal process conditions or product quality. The correct
number of alarms should have been determined by operability criteria. Preferably,
there should be as few safety critical alarms as possible. These should be limited
to those situations where, unavoidably, a wider knowledge of the process
conditions is required than can be provided for by an automatic protection system.
Recommendation 6
The use and configuration of alarms should be such that: safety critical
alarms are distinguishable from other operational alarms; alarms are limited
to the number that an operator can effectively monitor; and ultimate plant
safety should not rely on operator response to a control system alarm.
131 Control and protection systems should be independent. The use of control and
protection systems in safety-related applications should take account of HSE
guidelines (Programmable Electronic Systems in Safety-Related Applications)
and emerging standards (Draft International Standard IEC1508, Functional
Safety of EIEIPES safety-related systems).
Recommendation 7
Safety-critical plant elements on which the safety of a process relies, ie
whose failure could lead to hazardous events, should be identified. Any
safety system used to protect against hazardous events should be specified,
and subsequently designed, based on an appropriate hazard and risk
analysis so that the functions to be carried out and the appropriate level of
integrity are systematically determined.
Plant layout
132 It is likely that there would have been many more casualties if this incident had
occurred on a weekday, with more people on site and the offices fully occupied.
As it was there were lucky escapes from damaged structures, particularly from
the permit buildings (paragraphs 78 and 79). By contrast, in the Flixborough
explosion, 18 of the 28 fatalities occurred in the control room as it collapsed.
Recommendation 8
In new build, or re-equipment, projects and in reviews of existing plant
layouts, a risk assessment should be carried out with regard to the location,
and suitability of construction, of buildings and plant.
Flare systems
133 The pump-out system for the flare knock-out drum 02-F-319 was modified for
efficiency and environmental reasons. Before the modification, there was an
automatic pump-out system that removed excess liquid to slops at an adequate
rate. The modification consisted of a reduced capacity, automatic system that
routed limited quantities of liquid back to the start of the process. In addition, a
manual system was retained to deal with excess flows. This required FCCU
operators to communicate with off-plots tankage operators (to check, for
example, that the tanks that receive the slops have sufficient capacity) and to
open valves manually (paragraph 112 onwards). Operators had no proper
instruction or information about how and when this modified procedure was to
have been used, and were not able to appreciate the safety implications of
breaching the company's operational standard for maximum liquid level.
Recommendation 9
In processes that employ a flare system, there should be effective
arrangements for the removal of slops from a flare knock-out drum that
ensure that the removal is promptly initiated and at an adequate rate to
prevent overfilling the drum.
Plant modifications
134 There are numerous examples where modifications to plant hardware, software
or procedures have led to loss situations. The failure to consider the safety
consequences of a modification, or failure to take account of all the history
leading up to a modification, are common factors. Examples include the
Flixborough explosion over 20 years ago, the BP Grangemouth hydrocracker
explosion, and the modification to the flare knock-out drum in 1991 that became
an important factor in this incident (paragraph 111 onwards).
135 The well-documented discussions leading up to the modification of the flare
drum pump-out included means of maintaining the safety integrity of the system.
Unfortunately, the documentation following the final modification lost the detail
of these discussions so that, although the drum could still be pumped out to
tankage, not everyone knew how or when this should be done. Furthermore, the
emergency modifications employed to drain the wet gas compressor interstage
drum during the process upset (paragraph 67) occurred without the company's
own procedures being followed.
Recommendation 10
There should be a formal, controlled procedure for hazard identification and
operability analysis for modifications (including emergency modifications) that
ensures that all safety issues identified at the design stage are reflected in
how the modification is constructed and used.
lnspection systems
136 lnspection of the flare line had not identified the section which eventually failed.
There were no inspection points for measuring thickness in the corroded region
downstream of the failed elbow. Consequently, the severe corrosion at the point
of failure remained undetected (paragraph 122 and Annex 2), although it is
recognised that the extent of the corrosion was not a cause of the release of
hydrocarbon.
137 The company set minimum acceptable thicknesses (retirement thicknesses) for
pipes and vessels using pressure criteria only, not taking into account other
foreseeable operating conditions, such as:
(a) mechanical loading due to wind pressure and pipe or vessel contents (vapour,
gas, liquid, scale), self weight, cyclical loading (wind, temperature);
(b) non-uniform corrosion including pitting corrosion and electrolytic corrosion
especially around welds or other joins; and
(c) the effects of pipe and vessel contents on internal corrosion (including chemical
composition, water content, potential ingress of air, solids content, turbulence,
condensation and erosion).
For services having high potential failure consequences, consideration should
be given to increasing retirement thicknesses to provide for unanticipated or
unknown loading, undiscovered metal loss and foreseeable abuse.
Recommendation 11
All safety critical parts of the plant should be included in comprehensive
inspection programmes.
Recommendation 12
lnspection programmes for corrosion should: err on the side of caution, with
regard to the number and location of measurement sample points; and
concentrate measurement sample points where greater (or less uniform) metal
loss is foreseeable.
Recommendation 13
All foreseeable operational conditions, not just pressure, should be taken into
account when setting the minimum acceptable thickness for pipes and vessels.
Emergency planning
138 The fires in this incident burned from Sunday 24 July 1994 until Tuesday 26 July
1994 (paragraphs 1-3),though emergency plans had not dealt with the
possibility of a fire burning for longer than 24 hours. There are historical
examples of fires on refineries which have lasted longer than this. The
Institution of Chemical Engineers have listed 100 incidents, of which 44 involved
vapour cloud explosions and 54 were in oil refineries or terminals. Although
most resulting fires were extinguished within 24 hours, some burned for longer,
including the fire in 1983 at a neighbouring site north of the Milford Haven
waterway, which was extinguished 35 hours after ignition. The refinery fire at
Shuaiba, Kuwait, in 1981 lasted nearly six days from the initial explosion, while
the Philadelphia Refinery fire of August 1975 took nine days to extinguish (Loss
Prevention Bulletin 099, 1991, 3-25).
139 The twin demands, over an extended period, on water supplies for fire-fighting
and for cooling nearby vessels can be extreme. In this incident, water was kept
continuously available by recycling some of the used fire-fighting water (with
appropriate monitoring of possible flammable or toxic contaminants), and by use
of infra-red detection equipment to identify which vessels should be given
priority for cooling. The emergency teams involved in fighting the fires, and
bringing the site safely under control without further incident, deserve enormous
credit. It is nevertheless considered prudent, with the benefit of hindsight from
the incident, for the question of availability of adequate water supplies to meet
all eventualities to be considered afresh.
Recommendation 14
Fire brigades, in consultation with appropriate major hazard installations, would
be wise to look at emergency plans particularly in respect of the availability of
adequate water supplies for fire-fighting and vessel cooling, to deal with the
worst case scenario.
ACTION BY THE COMPANY
140 Once the site was made safe the company immediately started to replace and
repair the damaged plant. Sections of the refinery separate from PCC plant
started up in a limited way at the end of September 1994. The FCCU and other
damaged units of PCC were recommissioned by the end of November 1994.
141 At an early stage, as the lessons from the incident began to emerge from the
investigation teams, detailed discussions between HSE and the company took
place concerning measures that needed to be implemented for improved safe
operation of the plant. In addition to the replacement of damaged plant, an
extensive and costly programme of actions and projects was agreed, and its
implementation subsequently monitored by HSE. The actions under the
programme are now largely completed, although some, such as training and
monitoring arrangements, are ongoing commitments.
142 The programme included:
(a) A comprehensive review of relief systems, that resulted in site-wide
improvements. One of the outcomes was the provision of a new, larger flare
drum, with uprated instrumentation, and a new flare drum pump-out system
including an additional pump with an electric driver as an alternative to the
originally installed steam-driven pump.
(b) The development of a training simulator capable of realistically reproducing the
FCCU working conditions, in both normal and upset situations. The system,
which has been demonstrated to HSE, cost the company an estimated £500 000,
(c) Training on the roles and responsibilities of operators, supervisors and
managers, employing situational analysis techniques to assess managers' ability
to cope with upset conditions.
(d) Improvements in the configuration of the control system graphical displays, and
rationalisation of alarm systems to avoid operator overload.
(e) Reviews of, and improvements to, procedures for identification of critical plant,
preventative maintenance and inspection programmes. Some of the important
outcomes of these reviews include increased inspection frequency as the
retirement thickness of plants and vessels is approached, employment of a
corrosion specialist, and achievement of NCSllB accreditation which was
planned before the incident.
ANNEX l:SEQUENCE OF EVENTS
1 HSE physically verified instruments and controls on the plant. The timings are
approximate because there are four independent clocks referencing the four
data sources: TDC (the distributed control system), radio logs, TDACS (the data
logging system associated with the control system), and the critical process
controller. The times on these four clocks were not the same. The selected
reference time base is the one from the TDC data log.
Initial disturbances
2 At about 07.20 on Sunday 24th July 1994 an electrical storm approached the
Milford Haven area. There was a series of power supply interruptions between
07.49 and 08.30. During this period there was a fire on the crude distillation unit
and the ensuing plant disturbances affected the vacuum distillation unit,
alkylation unit, FCCU and butamer units. The alkylation and butamer units were
shut down at approximately 08.00. In the period 07.47 to 08.00 the FCCU briefly
lost and then regained vacuum gas oil feed and subsequently had feed reduced
from 600 to 400 m3h-l. The result of these fluctuations in feed levels was an
upset condition within the process that was aggravated by power supply
interruptions at 08.27 and 08.29. These events, though significant in initiating a
plant upset, were not such as to lead inevitably to the incident that occurred six
hours later.
FCCU recovery section process upset
Deethaniser feed instability
Figure 11
Approx 08.30 to 08.50
3 The plant is shown to be largely within its normal operational limits. However,
because of disrupted supply to the FCCU of vacuum gas oil (its feed material),
the level of liquid in the high pressure separator (02-F-310) had fallen to the point
where the visible and audible alarms in the control room had been activated.
4 At 08.33 the low liquid level within the high pressure separator was noted. In
order to recover the level the deethaniser feed valve (02-FV-385, marked
yellow) was manually reduced to 36% of the indicated range to reduce the flow
(the valve is adjusted from a computer panel in the control room). At this stage
the high pressure separator level had declined to about 6% of the level
indicator's range. Though the operator had closed the valve 02-FV-385 only a
small amount the TDC data showed that the flow into the deethaniser
subsequently fell to zero. This valve was known to be temperamental and
unreliable and the effect of his intervention was actually to completely cut off the
flow of liquid to the deethaniser.
5 The flow from the deethaniser to the debutaniser via valve 02-FV-404 was about
450 m3h-' at this point, consequently with no feed the deethaniser rapidly
emptied and after five minutes the liquid level controller 02-LC-402 recorded
zero. The level control was cascaded to the deethaniser output flow valve 02-
FV-404 which closed to retain a liquid level in the deethaniser. The flow of liquid
to the debutaniser was lost and as a result liquid levels in the debutaniser began
to fall.
6 At 08.39 the debutaniser level controller cascaded to the debutaniser control
which started to close the output valve (02-FV-436) to maintain the debutaniser
liquid level. The liquid retained in the debutaniser by this action was material
from the deethaniser which was relatively rich in low molecular weight
hydrocarbon. At the higher temperatures of the debutaniser this material rapidly
vaporised and at 08.46 the debutaniser pressure started to rise rapidly.
02-F-302
Deethanlzer
02-F-201
Main
fractionation accumulator
column
Wet gas cornprauror
U
Key
Normalflows and levels
Activated alarm
f
Abnormalflows and levels
0 Heatexchanger
Pump
E% controlvalve LCN
m Ftnfan cooler
W-436
Flan knockout
Figure 11
P
0
Figure 12
Approx 08.50 to 09.00
7 Because the main fractionator had continued to supply liquid, the high pressure
separator filled up due to valve 02-FV-385 not opening as it should have as the
level recovered. At 08.52 the liquid level exceeded the maximum of the
indicator's range at 100%. Pressure backed up in the system to the point where
the pressure in the overhead accumulator (02-F-203) caused the pressure relief
valve (02-PV-077) to open, allowing venting of the vapourlgas via the flare
knock-out drum.
8 Downstream, the debutaniser level had started to fall (because the supply to the
deethaniser had ceased). This caused the valve (02-FV-436), controlling the
flow of liquid to the naphtha splitter (02-F-305),to close. It probably remained
closed until after the explosion.
Failure of valve 02-FV-436
9 At about this time the secondary overhead accumulator pressure control valve
(02-PV-077) from the main fractionation column opened to 28% and vapour
flowed via the knock-out drum to flare. At about 09.12 the debutaniser outlet
valve 02-FV-436 was recorded, probably erroneously, as starting to open, as
liquid levels in the recovery section became re-established. By 09.40 the signal
sent to the valve was requesting 100% open and a flow was indicated. The
naphtha splitter and overhead accumulator, continued to indicate no level in
either vessel and no flow leaving the naphtha splitter. This suggests that there
was no actual flow via 02-FV-436.
10 Diagnostic tests carried out on the valve positioner for 02-FV-436 concluded that
the positioner may have been subject to an intermittent fault that restricted the
travel of the valve. The valve plug also showed areas of abrasion. The apparent
indication of flow reported on the unrelated indicator 02-FC-436 was assumed to
be due to the instrument being faulty, but subsequent investigation could not
reveal the cause of any fault. An explanation that is consistent with the evidence
and subsequent events is that at this time 02-FV-436 had stuck closed.
11 As a result of the valve failing in the shut position the liquid flow from the
debutaniser was blocked, so liquids accumulated in the debutaniser column and
upstream.
12 The pressure in the debutaniser rose because of the composition of the
materials it contained. These included a high proportion of lighter fractions
which would normally have been extracted by the deethaniser. On this occasion
they had not been extracted because the deethaniser had emptied so quickly.
13 One of the four pressure relief valves (PSV954 A-D) on the debutaniser lifted (at
02-F-302
02-F-211 Deethanlzer
02-F301
Main
fractionation
column
t
Key
Normalflowsand levels
Actwated alarm
Abnormalflowsand levels
0 Heat exchanger .--1
a pump
I
& Control valve LCN
Fin fan cooler
-4 +
I P I
To slops
Flam
19-F-102
02-F419
C-
O
Figure 12
P
m
around 08.53) and a mixture of gas and liquid was released to the flare knock-
out drum (02-F-319).
14 The level in the flare knock-out drum rose from about 60% to around 70% within
two minutes. This drum can be fed from two separate sources: the debutaniser
(02-F-304) and the overhead accumulator (02-F-203).
15 The level of liquid in the naphtha splitter had fallen to zero by the end of this
period. It was to remain in this state, with no action taken, for some four hours.
16 At 08.51 the reflux pumps that helped cool the debutaniser tripped (shut down
automatically). The liquid level within the overhead accumulator was recorded
as 30% by the TDC but this was probably erroneous. The recorded level had
become static after a large amount of movement earlier in the morning.
First debutaniser ,venting
17 The debutaniser was effectively blocked in at 08.53 because there was no input
flow, and it is presumed valve 02-FV-404 was closed, the output valve 02-FV-
436 was almost closed, and the reflux pumps had tripped. The light feed within
the debutaniser was rapidly vaporising and as a result the pressure reached
12.6 barg and the debutaniser pressure safety valves (PSVs) lifted. The
resulting discharge of liquid and vapour passed via the on site flare knock-out
drum to flare.
18 The control valve between the debutaniser and the naphtha splitter 02-FV-436
closed completely at 08.57. The level of liquid in the naphtha splitter was
recorded as zero, and this level remained at zero until the time of the incident.
19 At 09.00 the continued flaring associated with debutaniser venting was identified
and after investigation by an outside operator it was found that one of the
venting PSVs had not resealed after the pressure excursion. This faulty valve
was then changed over with the spare relief valve available at the top of the
debutaniser. Due to the plant upset an extra operator was called in.
Figure 13
Approx 09.00 to 09.50
20 The continuing flaring resulting from the debutaniser venting was noticed,
because the flare was large and smoky.
21 The valve 02-FV-385 was opened manually to 38% to reduce the high liquid
level in the high pressure separator and shortly afterwards the deethaniser liquid
level was re-established, whereupon the valve (02-FV-404) from the deethaniser
opened automatically.
22 Liquid continued to flow into the debutaniser but it did not continue on to the
naphtha splitter. It is likely that valve 02-FV-436 remained closed.
23 The debutaniser temperature was rising again at 09.30 and a heat exchanger
(the reboiler) was by-passed to attempt to reduce the temperature. By 09.37 the
pressure was rising close to the PSV set pressure and in order to reduce it the
operator sent what he assumed to be uncondensed vapour from the debutaniser
overhead accumulator (02-F-314) to the wet gas compressor interstage drum
(02-F-309), by opening the valve 02-HCV-439 manually from 0% to 25% in the
belief that it would vent excess debutaniser pressure back to the wet gas
compressor interstage drum. This procedure was used only rarely and the line
was intended to carry uncondensed vapours back to the wet end of the drum.
24 In fact liquid as well as vapour was sent into the interstage drum, which was now
filling much faster than usual as it was being fed from two sources instead of one.
First, from the secondary overhead accumulator (02-F-203) for the main fractionation
column as in routine operation and, second, from the overhead accumulator (02-F-
314) for the debutaniser, as a result of the upset, non-routine operation.
25 At 09.40 the hot oil flow to the debutaniser reboiler was reduced to zero,
because the temperature was around 1 8 7 ' ~ ~and still rising.
26 In the next ten minutes a series of events occurred as the debutaniser
temperature and pressure continued to rise. The debutaniser liquid level gauge
stayed fixed at 79% of its range. The liquid level probably exceeded this, as the
column flooded. The debutaniser overhead accumulator filled with liquids and
vapour due to the transfer of excess material from the debutaniser. Many of the
level transmitters on the plant were of a differential pressure type. The installation
design was such that following high liquid levels they could be inaccurate.
27 At this point the plant was in a very upset condition and the composition of the
process liquids and gases was not normal. The overheating of the debutaniser
column, which contained material of greater volatility than normal, therefore
resulted in the rapid evolution of both liquids and gases from the top of the
column into the overhead accumulator. In effect, it 'boiled over'.
Figure 13
8
Key
Normalflows and levels
M e d a l a r m
Abnormalflowsand levels
0 Heat exchanger
Pump
Controlvalve LCN
p r o d u c t
m F I ~fan cooler
FV -436
U
Figure 14
Approx 09.50 to 10.25
First wet gas compressor trip
28 Liquid level in the wet gas compressor interstage drum (02-F-309) rose quickly
and liquid spilled over the weir (internal wall) from the 'wet end' into the 'dry end'.
This caused the wet gas compressor to trip (shutdown) automatically at 10.08.
29 This was because valve 02-HCV-439 was open and excess liquid in the
overhead accumulato'r was passing back through the vapour line into the
interstage drum.
30 Around 11.30 there was discussion among the operations staff about the
condition of the unit. While preparations were started for removing feed from the
unit, it was decided to try to restart the wet gas compressor and continue
running, even though the underlying cause of the liquid filling was not known. A
problem existed in that due to the loss of the pressure generated by the wet gas
compressor there was insufficient pressure differential between the dry end of
the interstage drum and the normal receiving vessel (02-F-203) to force the
accumulated liquid out. As the pressure differential was not adequate because
the compressor was not running, a system was improvised to remove the
hydrocarbon liquid using steam hoses. Two steam hoses were attached to the
outlet pipe at the dry end of the wet gas compressor interstage drum and
connected into the flare header down stream of 02-PV-077. The liquid was then
drained away to flare via 02-F-319. The compressor was eventually restarted at
12.28.
Second debutaniser venting
31 At 10.01 the debutaniser was liquid-logged and the pressure exceeded the PSV
set pressure again. Pressure peaked at 12.2 barg and discharge via the
debutaniser PSVs continued for 16 minutes. At 10.10 the liquid level in the
knock-out drum began to rise rapidly, and rose from 61% to 93% over the next
14 minutes. This corresponded to an increase in liquid volume of 44 m3, and
assuming a density of 630 kgm-3 (pentane), this represented a liquid flow rate of
33 kgsec-l. This relief rate is consistent with that which could have discharged
from the debutaniser PSVs.
Key
Normalflows and levels
Activated alarm
Abnormalflows and levels
0 Heatexchanger
a Pump
&1 Controlvaive
Finfan cooler
To slops--e&
Figure 14
m
0
11111
accumulator '
Figure 15
Approx 10.25 to 12.56
32 Between 10.25 and 12.00 there was continuous activity to drain the liquid from
the wet gas compressor interstage drum dry end so that the wet gas compressor
could be restarted to restore flow in the unit.
33 Liquid continued to accumulate in the flare knock-out drum (02-F-319) such that
the high-high level alarm was activated at about 12.56. The alarm did not reset
before the explosion. There was a klaxon local alarm at the drum, as well as the
alarm in the control room but these were not noticed among the many other
alarms triggered during this time.
34 At 10.45 the on-plot flare drum 02-F-319 reached the maximum liquid level,
shown on the indicator as 99.5% of its range, which is approximately 33% of the
total drum volume.
35 At 10.56 the valve 02-HCV-439 was closed. An instrument technician was requested
to check the wet gas compressor interstage drum dry end instrumentation, and this
confirmed the high liquid level in the dry end. While the wet gas compressor was off-
line, feed to the recovery section remained over 230 m3h-'.
36 At 11.20 the debutaniser temperature was still high so the ICGO reboiler flow
was cut off.
37 During the wet gas compressor shutdown the differential pressure between the
deethaniser and debutaniser had reached equilibrium and as a result there was
no pressure to drive the deethaniser feed forward. After 12.00 the wet gas
compressor was restarted, restoring the differential pressure. Flow increased
significantly. When the wet gas compressor was restarted it was carefully run
up, with only a minor incident when a rough noise was heard on the run up and
a hold for diagnostic checks was made. The dry end of the interstage drum was
drained sufficiently to allow CPC control to be restored and the temporary steam
hose connections which had been used for draining the dry end were broken at
12.15. Instrument checks were completed and the dry end liquid level was
recorded at 41% of its range. The wet gas compressor was finally brought back
on line at 12.28.
Third debutaniser venting
38 Shortly after the wet gas compressor restarted, the debutaniser pressure started
to rise and by 12.46 again exceeded the relief valves' set pressure. The
consequent venting to flare continued until the explosion. Assuming a density of
660 kgm-3the liquid flow from the relief valves has been estimated to have
peaked at ll 0 kgsec-' at 12.40 then declined to an average of 82 kgsece'
between 12.46 and 13.05, then further reduced to 64 kgsec-l until 13.21.
39 From 12.46 the debutaniser pressure exceeded the PSV set pressure for about
40 minutes, reaching a maximum pressure of 12.8 barg. Between 12.46 and
12.56 the amount of liquid in the flare knock-out drum increased by 60.5 m3.
This is equivalent to a liquid flow rate of 63.5 kgsec-' and is corresponds with
the recorded rate of liquid input to the debutaniser over the same period.
Key
Normalflows and levels
Activated alarm
Abnormalflowsand levels
Debutanizer
Pump
& Controlvalve
m Finfan cooler
Figure 15
V1
0
The explosion and fires at the texaco refinery milford haven

More Related Content

What's hot

Sil assessment Risk Graph and LOPA Training iFluids
Sil assessment Risk Graph and LOPA Training iFluidsSil assessment Risk Graph and LOPA Training iFluids
Sil assessment Risk Graph and LOPA Training iFluidsJohn Kingsley
 
Assignment piper alpha
Assignment piper alphaAssignment piper alpha
Assignment piper alphaJohnin Taimin
 
PSM Process Safety Management.pdf
PSM Process Safety Management.pdfPSM Process Safety Management.pdf
PSM Process Safety Management.pdfssuser2fc67e
 
Hazop Fundamentals Online Training iFluids
Hazop Fundamentals Online Training iFluidsHazop Fundamentals Online Training iFluids
Hazop Fundamentals Online Training iFluidsJohn Kingsley
 
Back 2 basics - LEARNING FROM ACCIDENTS - No more missed opportunities - A Tr...
Back 2 basics - LEARNING FROM ACCIDENTS - No more missed opportunities - A Tr...Back 2 basics - LEARNING FROM ACCIDENTS - No more missed opportunities - A Tr...
Back 2 basics - LEARNING FROM ACCIDENTS - No more missed opportunities - A Tr...Manuel Rodríguez Herrán
 
Risk Identification in power plants risk i
Risk Identification in power plants risk iRisk Identification in power plants risk i
Risk Identification in power plants risk iPeter Cockcroft
 
Process Safety Management Fundamentals.pptx
Process Safety Management Fundamentals.pptxProcess Safety Management Fundamentals.pptx
Process Safety Management Fundamentals.pptxImtiazHussain312057
 
Piper Alpha Disaster Report
Piper Alpha Disaster ReportPiper Alpha Disaster Report
Piper Alpha Disaster ReportAhmad El Tawil
 
Emergency Preparedness and Response Plan - why one size will not fit all
Emergency Preparedness and Response Plan - why one size will not fit allEmergency Preparedness and Response Plan - why one size will not fit all
Emergency Preparedness and Response Plan - why one size will not fit allPECB
 
Enform oil and gas safety: Process safey vs. personal safety
Enform oil and gas safety: Process safey vs. personal safety Enform oil and gas safety: Process safey vs. personal safety
Enform oil and gas safety: Process safey vs. personal safety Enform
 
LOPA | Layer Of Protection Analysis | Gaurav Singh Rajput
LOPA | Layer Of Protection Analysis | Gaurav Singh RajputLOPA | Layer Of Protection Analysis | Gaurav Singh Rajput
LOPA | Layer Of Protection Analysis | Gaurav Singh RajputGaurav Singh Rajput
 

What's hot (20)

Sil assessment Risk Graph and LOPA Training iFluids
Sil assessment Risk Graph and LOPA Training iFluidsSil assessment Risk Graph and LOPA Training iFluids
Sil assessment Risk Graph and LOPA Training iFluids
 
Assignment piper alpha
Assignment piper alphaAssignment piper alpha
Assignment piper alpha
 
HAZOP Basics
HAZOP BasicsHAZOP Basics
HAZOP Basics
 
Hazop method
Hazop methodHazop method
Hazop method
 
PSM Process Safety Management.pdf
PSM Process Safety Management.pdfPSM Process Safety Management.pdf
PSM Process Safety Management.pdf
 
14 Tips for Process Safety Management
14 Tips for Process Safety Management14 Tips for Process Safety Management
14 Tips for Process Safety Management
 
Hazop Fundamentals Online Training iFluids
Hazop Fundamentals Online Training iFluidsHazop Fundamentals Online Training iFluids
Hazop Fundamentals Online Training iFluids
 
Piper alpha disaster 1988
Piper alpha disaster 1988Piper alpha disaster 1988
Piper alpha disaster 1988
 
Back 2 basics - LEARNING FROM ACCIDENTS - No more missed opportunities - A Tr...
Back 2 basics - LEARNING FROM ACCIDENTS - No more missed opportunities - A Tr...Back 2 basics - LEARNING FROM ACCIDENTS - No more missed opportunities - A Tr...
Back 2 basics - LEARNING FROM ACCIDENTS - No more missed opportunities - A Tr...
 
Hazop gide line
Hazop gide lineHazop gide line
Hazop gide line
 
Risk Identification in power plants risk i
Risk Identification in power plants risk iRisk Identification in power plants risk i
Risk Identification in power plants risk i
 
Process Safety Management Fundamentals.pptx
Process Safety Management Fundamentals.pptxProcess Safety Management Fundamentals.pptx
Process Safety Management Fundamentals.pptx
 
Understanding sil
Understanding silUnderstanding sil
Understanding sil
 
Offshore safety
Offshore safety Offshore safety
Offshore safety
 
Fire safety FM 200
Fire safety FM 200Fire safety FM 200
Fire safety FM 200
 
Piper Alpha Disaster Report
Piper Alpha Disaster ReportPiper Alpha Disaster Report
Piper Alpha Disaster Report
 
Emergency Preparedness and Response Plan - why one size will not fit all
Emergency Preparedness and Response Plan - why one size will not fit allEmergency Preparedness and Response Plan - why one size will not fit all
Emergency Preparedness and Response Plan - why one size will not fit all
 
Enform oil and gas safety: Process safey vs. personal safety
Enform oil and gas safety: Process safey vs. personal safety Enform oil and gas safety: Process safey vs. personal safety
Enform oil and gas safety: Process safey vs. personal safety
 
LOPA | Layer Of Protection Analysis | Gaurav Singh Rajput
LOPA | Layer Of Protection Analysis | Gaurav Singh RajputLOPA | Layer Of Protection Analysis | Gaurav Singh Rajput
LOPA | Layer Of Protection Analysis | Gaurav Singh Rajput
 
LAYER OF PROTECTION ANALYSIS
LAYER OF PROTECTION ANALYSISLAYER OF PROTECTION ANALYSIS
LAYER OF PROTECTION ANALYSIS
 

Similar to The explosion and fires at the texaco refinery milford haven

Accidental Short Report on Texas City Refinery Explosion 2005
Accidental Short Report on Texas City Refinery Explosion 2005Accidental Short Report on Texas City Refinery Explosion 2005
Accidental Short Report on Texas City Refinery Explosion 2005Farooq Ahmed Fk
 
Flixborough disaster
Flixborough disasterFlixborough disaster
Flixborough disasterSameer Phadke
 
Flixborough disaster
Flixborough disasterFlixborough disaster
Flixborough disasterSameer Phadke
 
Pressure Vessel Accidents: Safety Approach
Pressure Vessel Accidents: Safety ApproachPressure Vessel Accidents: Safety Approach
Pressure Vessel Accidents: Safety ApproachIRJET Journal
 
IRJET-Pressure Vessel Accidents: Safety Approach
IRJET-Pressure Vessel Accidents: Safety ApproachIRJET-Pressure Vessel Accidents: Safety Approach
IRJET-Pressure Vessel Accidents: Safety ApproachIRJET Journal
 
Planning to Avoid Failure Storage Tanks
Planning to Avoid Failure Storage TanksPlanning to Avoid Failure Storage Tanks
Planning to Avoid Failure Storage TanksOrlando Costa
 
Engineers responsibility for safety
Engineers responsibility for safetyEngineers responsibility for safety
Engineers responsibility for safetyBhupender Sharma
 
Safty case study
Safty case studySafty case study
Safty case studyYhingying
 
Three Mile Island Case Study
Three Mile Island Case StudyThree Mile Island Case Study
Three Mile Island Case StudyAsmita Bari
 
Nuclear Power Plant Disaster
Nuclear Power Plant DisasterNuclear Power Plant Disaster
Nuclear Power Plant DisasterZulkarnaen Zasni
 
Raising The Stakes - Offshore Risk Allocation (2010)
Raising The Stakes - Offshore Risk Allocation (2010)Raising The Stakes - Offshore Risk Allocation (2010)
Raising The Stakes - Offshore Risk Allocation (2010)Michael Filippich
 
Gi2011hotworks abridged
Gi2011hotworks abridgedGi2011hotworks abridged
Gi2011hotworks abridgedBryan Haywood
 
Gi2011hotworks abridged
Gi2011hotworks abridgedGi2011hotworks abridged
Gi2011hotworks abridgedvtsiri
 
Opito bosiet safety induction
Opito bosiet safety inductionOpito bosiet safety induction
Opito bosiet safety inductionTejpal Barnela
 

Similar to The explosion and fires at the texaco refinery milford haven (20)

Accidental Short Report on Texas City Refinery Explosion 2005
Accidental Short Report on Texas City Refinery Explosion 2005Accidental Short Report on Texas City Refinery Explosion 2005
Accidental Short Report on Texas City Refinery Explosion 2005
 
Jaipur Fire
Jaipur FireJaipur Fire
Jaipur Fire
 
Flixborough disaster
Flixborough disasterFlixborough disaster
Flixborough disaster
 
Flixborough disaster
Flixborough disasterFlixborough disaster
Flixborough disaster
 
moc0828011.pdf
moc0828011.pdfmoc0828011.pdf
moc0828011.pdf
 
Pressure Vessel Accidents: Safety Approach
Pressure Vessel Accidents: Safety ApproachPressure Vessel Accidents: Safety Approach
Pressure Vessel Accidents: Safety Approach
 
IRJET-Pressure Vessel Accidents: Safety Approach
IRJET-Pressure Vessel Accidents: Safety ApproachIRJET-Pressure Vessel Accidents: Safety Approach
IRJET-Pressure Vessel Accidents: Safety Approach
 
Planning to Avoid Failure Storage Tanks
Planning to Avoid Failure Storage TanksPlanning to Avoid Failure Storage Tanks
Planning to Avoid Failure Storage Tanks
 
IOC jaipur
IOC jaipurIOC jaipur
IOC jaipur
 
Hazardex September 2020 Edition
Hazardex September 2020 EditionHazardex September 2020 Edition
Hazardex September 2020 Edition
 
Engineers responsibility for safety
Engineers responsibility for safetyEngineers responsibility for safety
Engineers responsibility for safety
 
Safty case study
Safty case studySafty case study
Safty case study
 
Three Mile Island Case Study
Three Mile Island Case StudyThree Mile Island Case Study
Three Mile Island Case Study
 
Nuclear Power Plant Disaster
Nuclear Power Plant DisasterNuclear Power Plant Disaster
Nuclear Power Plant Disaster
 
Xviii paper-20
Xviii paper-20Xviii paper-20
Xviii paper-20
 
Raising The Stakes - Offshore Risk Allocation (2010)
Raising The Stakes - Offshore Risk Allocation (2010)Raising The Stakes - Offshore Risk Allocation (2010)
Raising The Stakes - Offshore Risk Allocation (2010)
 
Gi2011hotworks abridged
Gi2011hotworks abridgedGi2011hotworks abridged
Gi2011hotworks abridged
 
Gi2011hotworks abridged
Gi2011hotworks abridgedGi2011hotworks abridged
Gi2011hotworks abridged
 
Opito bosiet safety induction
Opito bosiet safety inductionOpito bosiet safety induction
Opito bosiet safety induction
 
Mishref Pump Station
Mishref Pump StationMishref Pump Station
Mishref Pump Station
 

More from دكتور تامر عبدالله شراكى

More from دكتور تامر عبدالله شراكى (20)

New crude oil tank farm project
New crude oil tank farm projectNew crude oil tank farm project
New crude oil tank farm project
 
المصطلحات الفنية لعلوم الحريق والاطفاء
المصطلحات الفنية لعلوم الحريق والاطفاءالمصطلحات الفنية لعلوم الحريق والاطفاء
المصطلحات الفنية لعلوم الحريق والاطفاء
 
Permit to confined_space_work
Permit to confined_space_workPermit to confined_space_work
Permit to confined_space_work
 
Risk management booklet
Risk management bookletRisk management booklet
Risk management booklet
 
How to achieve a safe workplace-e book
How to achieve a safe workplace-e bookHow to achieve a safe workplace-e book
How to achieve a safe workplace-e book
 
What to consider in planning for workplace
What to consider in planning for workplaceWhat to consider in planning for workplace
What to consider in planning for workplace
 
Workplace safety and health guidelines
Workplace safety and health guidelinesWorkplace safety and health guidelines
Workplace safety and health guidelines
 
Nebosh oil-and-gas-certificate-e book
Nebosh oil-and-gas-certificate-e bookNebosh oil-and-gas-certificate-e book
Nebosh oil-and-gas-certificate-e book
 
International technical certificate in oil and gas operational safety revisio...
International technical certificate in oil and gas operational safety revisio...International technical certificate in oil and gas operational safety revisio...
International technical certificate in oil and gas operational safety revisio...
 
Unit ia book part 2
Unit ia book part 2Unit ia book part 2
Unit ia book part 2
 
Management of international health and safety igc1 revision english
Management of international health and safety igc1 revision englishManagement of international health and safety igc1 revision english
Management of international health and safety igc1 revision english
 
Igc1 assessment arabic
Igc1 assessment arabicIgc1 assessment arabic
Igc1 assessment arabic
 
Nebosh international certificate distance learning
Nebosh international certificate distance learningNebosh international certificate distance learning
Nebosh international certificate distance learning
 
Igc1 arabic-1
Igc1  arabic-1Igc1  arabic-1
Igc1 arabic-1
 
Nebosh international diploma syllabus guide
Nebosh international diploma syllabus guideNebosh international diploma syllabus guide
Nebosh international diploma syllabus guide
 
Portable fire extinguishers
Portable fire extinguishersPortable fire extinguishers
Portable fire extinguishers
 
Arc flash guidebook
Arc flash guidebookArc flash guidebook
Arc flash guidebook
 
Niosh extramural research and training program
Niosh extramural research and training programNiosh extramural research and training program
Niosh extramural research and training program
 
Steps to using a fire extinguisher pass.infographic
Steps to using a fire extinguisher pass.infographicSteps to using a fire extinguisher pass.infographic
Steps to using a fire extinguisher pass.infographic
 
Nfpa 10 infographic
Nfpa 10 infographicNfpa 10 infographic
Nfpa 10 infographic
 

Recently uploaded

Current Transformer Drawing and GTP for MSETCL
Current Transformer Drawing and GTP for MSETCLCurrent Transformer Drawing and GTP for MSETCL
Current Transformer Drawing and GTP for MSETCLDeelipZope
 
OSVC_Meta-Data based Simulation Automation to overcome Verification Challenge...
OSVC_Meta-Data based Simulation Automation to overcome Verification Challenge...OSVC_Meta-Data based Simulation Automation to overcome Verification Challenge...
OSVC_Meta-Data based Simulation Automation to overcome Verification Challenge...Soham Mondal
 
VICTOR MAESTRE RAMIREZ - Planetary Defender on NASA's Double Asteroid Redirec...
VICTOR MAESTRE RAMIREZ - Planetary Defender on NASA's Double Asteroid Redirec...VICTOR MAESTRE RAMIREZ - Planetary Defender on NASA's Double Asteroid Redirec...
VICTOR MAESTRE RAMIREZ - Planetary Defender on NASA's Double Asteroid Redirec...VICTOR MAESTRE RAMIREZ
 
Sachpazis Costas: Geotechnical Engineering: A student's Perspective Introduction
Sachpazis Costas: Geotechnical Engineering: A student's Perspective IntroductionSachpazis Costas: Geotechnical Engineering: A student's Perspective Introduction
Sachpazis Costas: Geotechnical Engineering: A student's Perspective IntroductionDr.Costas Sachpazis
 
Heart Disease Prediction using machine learning.pptx
Heart Disease Prediction using machine learning.pptxHeart Disease Prediction using machine learning.pptx
Heart Disease Prediction using machine learning.pptxPoojaBan
 
Artificial-Intelligence-in-Electronics (K).pptx
Artificial-Intelligence-in-Electronics (K).pptxArtificial-Intelligence-in-Electronics (K).pptx
Artificial-Intelligence-in-Electronics (K).pptxbritheesh05
 
College Call Girls Nashik Nehal 7001305949 Independent Escort Service Nashik
College Call Girls Nashik Nehal 7001305949 Independent Escort Service NashikCollege Call Girls Nashik Nehal 7001305949 Independent Escort Service Nashik
College Call Girls Nashik Nehal 7001305949 Independent Escort Service NashikCall Girls in Nagpur High Profile
 
Gurgaon ✡️9711147426✨Call In girls Gurgaon Sector 51 escort service
Gurgaon ✡️9711147426✨Call In girls Gurgaon Sector 51 escort serviceGurgaon ✡️9711147426✨Call In girls Gurgaon Sector 51 escort service
Gurgaon ✡️9711147426✨Call In girls Gurgaon Sector 51 escort servicejennyeacort
 
Architect Hassan Khalil Portfolio for 2024
Architect Hassan Khalil Portfolio for 2024Architect Hassan Khalil Portfolio for 2024
Architect Hassan Khalil Portfolio for 2024hassan khalil
 
HARMONY IN THE HUMAN BEING - Unit-II UHV-2
HARMONY IN THE HUMAN BEING - Unit-II UHV-2HARMONY IN THE HUMAN BEING - Unit-II UHV-2
HARMONY IN THE HUMAN BEING - Unit-II UHV-2RajaP95
 
Model Call Girl in Narela Delhi reach out to us at 🔝8264348440🔝
Model Call Girl in Narela Delhi reach out to us at 🔝8264348440🔝Model Call Girl in Narela Delhi reach out to us at 🔝8264348440🔝
Model Call Girl in Narela Delhi reach out to us at 🔝8264348440🔝soniya singh
 
microprocessor 8085 and its interfacing
microprocessor 8085  and its interfacingmicroprocessor 8085  and its interfacing
microprocessor 8085 and its interfacingjaychoudhary37
 
What are the advantages and disadvantages of membrane structures.pptx
What are the advantages and disadvantages of membrane structures.pptxWhat are the advantages and disadvantages of membrane structures.pptx
What are the advantages and disadvantages of membrane structures.pptxwendy cai
 
main PPT.pptx of girls hostel security using rfid
main PPT.pptx of girls hostel security using rfidmain PPT.pptx of girls hostel security using rfid
main PPT.pptx of girls hostel security using rfidNikhilNagaraju
 
power system scada applications and uses
power system scada applications and usespower system scada applications and uses
power system scada applications and usesDevarapalliHaritha
 
chaitra-1.pptx fake news detection using machine learning
chaitra-1.pptx  fake news detection using machine learningchaitra-1.pptx  fake news detection using machine learning
chaitra-1.pptx fake news detection using machine learningmisbanausheenparvam
 
Application of Residue Theorem to evaluate real integrations.pptx
Application of Residue Theorem to evaluate real integrations.pptxApplication of Residue Theorem to evaluate real integrations.pptx
Application of Residue Theorem to evaluate real integrations.pptx959SahilShah
 
Internship report on mechanical engineering
Internship report on mechanical engineeringInternship report on mechanical engineering
Internship report on mechanical engineeringmalavadedarshan25
 

Recently uploaded (20)

Current Transformer Drawing and GTP for MSETCL
Current Transformer Drawing and GTP for MSETCLCurrent Transformer Drawing and GTP for MSETCL
Current Transformer Drawing and GTP for MSETCL
 
OSVC_Meta-Data based Simulation Automation to overcome Verification Challenge...
OSVC_Meta-Data based Simulation Automation to overcome Verification Challenge...OSVC_Meta-Data based Simulation Automation to overcome Verification Challenge...
OSVC_Meta-Data based Simulation Automation to overcome Verification Challenge...
 
VICTOR MAESTRE RAMIREZ - Planetary Defender on NASA's Double Asteroid Redirec...
VICTOR MAESTRE RAMIREZ - Planetary Defender on NASA's Double Asteroid Redirec...VICTOR MAESTRE RAMIREZ - Planetary Defender on NASA's Double Asteroid Redirec...
VICTOR MAESTRE RAMIREZ - Planetary Defender on NASA's Double Asteroid Redirec...
 
Sachpazis Costas: Geotechnical Engineering: A student's Perspective Introduction
Sachpazis Costas: Geotechnical Engineering: A student's Perspective IntroductionSachpazis Costas: Geotechnical Engineering: A student's Perspective Introduction
Sachpazis Costas: Geotechnical Engineering: A student's Perspective Introduction
 
Heart Disease Prediction using machine learning.pptx
Heart Disease Prediction using machine learning.pptxHeart Disease Prediction using machine learning.pptx
Heart Disease Prediction using machine learning.pptx
 
Artificial-Intelligence-in-Electronics (K).pptx
Artificial-Intelligence-in-Electronics (K).pptxArtificial-Intelligence-in-Electronics (K).pptx
Artificial-Intelligence-in-Electronics (K).pptx
 
College Call Girls Nashik Nehal 7001305949 Independent Escort Service Nashik
College Call Girls Nashik Nehal 7001305949 Independent Escort Service NashikCollege Call Girls Nashik Nehal 7001305949 Independent Escort Service Nashik
College Call Girls Nashik Nehal 7001305949 Independent Escort Service Nashik
 
young call girls in Rajiv Chowk🔝 9953056974 🔝 Delhi escort Service
young call girls in Rajiv Chowk🔝 9953056974 🔝 Delhi escort Serviceyoung call girls in Rajiv Chowk🔝 9953056974 🔝 Delhi escort Service
young call girls in Rajiv Chowk🔝 9953056974 🔝 Delhi escort Service
 
Gurgaon ✡️9711147426✨Call In girls Gurgaon Sector 51 escort service
Gurgaon ✡️9711147426✨Call In girls Gurgaon Sector 51 escort serviceGurgaon ✡️9711147426✨Call In girls Gurgaon Sector 51 escort service
Gurgaon ✡️9711147426✨Call In girls Gurgaon Sector 51 escort service
 
Architect Hassan Khalil Portfolio for 2024
Architect Hassan Khalil Portfolio for 2024Architect Hassan Khalil Portfolio for 2024
Architect Hassan Khalil Portfolio for 2024
 
HARMONY IN THE HUMAN BEING - Unit-II UHV-2
HARMONY IN THE HUMAN BEING - Unit-II UHV-2HARMONY IN THE HUMAN BEING - Unit-II UHV-2
HARMONY IN THE HUMAN BEING - Unit-II UHV-2
 
Model Call Girl in Narela Delhi reach out to us at 🔝8264348440🔝
Model Call Girl in Narela Delhi reach out to us at 🔝8264348440🔝Model Call Girl in Narela Delhi reach out to us at 🔝8264348440🔝
Model Call Girl in Narela Delhi reach out to us at 🔝8264348440🔝
 
🔝9953056974🔝!!-YOUNG call girls in Rajendra Nagar Escort rvice Shot 2000 nigh...
🔝9953056974🔝!!-YOUNG call girls in Rajendra Nagar Escort rvice Shot 2000 nigh...🔝9953056974🔝!!-YOUNG call girls in Rajendra Nagar Escort rvice Shot 2000 nigh...
🔝9953056974🔝!!-YOUNG call girls in Rajendra Nagar Escort rvice Shot 2000 nigh...
 
microprocessor 8085 and its interfacing
microprocessor 8085  and its interfacingmicroprocessor 8085  and its interfacing
microprocessor 8085 and its interfacing
 
What are the advantages and disadvantages of membrane structures.pptx
What are the advantages and disadvantages of membrane structures.pptxWhat are the advantages and disadvantages of membrane structures.pptx
What are the advantages and disadvantages of membrane structures.pptx
 
main PPT.pptx of girls hostel security using rfid
main PPT.pptx of girls hostel security using rfidmain PPT.pptx of girls hostel security using rfid
main PPT.pptx of girls hostel security using rfid
 
power system scada applications and uses
power system scada applications and usespower system scada applications and uses
power system scada applications and uses
 
chaitra-1.pptx fake news detection using machine learning
chaitra-1.pptx  fake news detection using machine learningchaitra-1.pptx  fake news detection using machine learning
chaitra-1.pptx fake news detection using machine learning
 
Application of Residue Theorem to evaluate real integrations.pptx
Application of Residue Theorem to evaluate real integrations.pptxApplication of Residue Theorem to evaluate real integrations.pptx
Application of Residue Theorem to evaluate real integrations.pptx
 
Internship report on mechanical engineering
Internship report on mechanical engineeringInternship report on mechanical engineering
Internship report on mechanical engineering
 

The explosion and fires at the texaco refinery milford haven

  • 1.
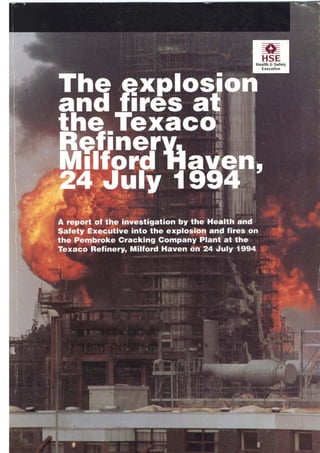
  • 2. View from south west showing fire at flare drum (photographcourtesy of the WesternMail and Echo Ltd)
  • 3. The explosion and fires at the Texaco 'RefMilfordiner^aven, 24 July 1994 A report of the investigation by the Health and Safety Executive into the explosion and fires on the Pembroke Cracking Company Plant at the Texaco Refinery, Milford Haven on 24 July l994 HSE BOOKS
  • 4. O Crown copyright 1997 Applications for reproduction should be made in writing to: Copyright Unit, Her Majesty's Stationery Office, St Clement's House, 2-16 Colegate, Norwich NR3 1BC? First published 1997 All rights reserved. No part of this publication may be reproduced, stored in a retrieval system or transmitted in any form or by any means (electronic, mechanical, photocopying, recording or otherwise) without the prior written permission of the copyright owner).
  • 5. CONTENTS EXECUTIVE SUMMARY (INCLUDING LESSONS I N BRIEF) 1 BACKGROUND 5 The refinery 5 The companies 7 Management structure 9 DESCRIPTION OF THE PLANT 9 The crude distillation unit 9 The fluidised cracking catalytic unit (FCCU) 9 FCCU instrumentation, control and protection systems 10 The flare system 13 Off-plots tankage 14 THE INCIDENT 14 EMERGENCY RESPONSE 17 DAMAGE 18 HSE INVESTIGATION 2 2 THE KEY FINDINGS 2 3
  • 6. RESULTS OF THE INVESTIGATION 25 Operation and control of the FCCU 25 Modification of the flare drum pump-out system 29 Company assessment of pump-out modification 33 Corrosion 33 LESSONS FROM THE INCIDENT 34 ACTION BY THE COMPANY 40 ANNEXES 1 Sequence of events 41 2 Corrosion in flare line 57 3 Quantification 58 4 Management structure 59 5 Previous HSE involvement 61 6 Legislation 62 7 Abbreviations 63 8 Plant identification codes 64
  • 7. EXECUTIVE SUMMARY The incident 1 An explosion, followed by a number of fires, occurred at 13.23 on Sunday 24 July 1994, on the Pembroke Cracking Company plant (PCC) at the Texaco Refinery, Pembroke. Two companies occupied the site: PCC (owned jointly by Texaco Ltd and Gulf Oil (Great Britain) Ltd) and Texaco's Pembroke Refinery. Paragraphs 30 to 35 describe this arrangement. The site produces hydrocarbon fuels such as gasoline, diesel, kerosene and liquid petroleum gases (LPG) from crude oil. 2 The start of the events that led to the explosion can be traced to the period before 09.00 on Sunday 24 July 1994, when a severe electrical storm caused plant disturbances that affected the vacuum distillation, alkylation, and butamer units as well as the fluidised catalytic cracking unit (FCCU). The crude distillation unit that provided feed to the PCC units was shut down as a result of a fire which had been started by a lightning strike. During the course of the morning, all PCC units except the FCCU were shut down. 3 However, the direct cause of the explosion that occurred some five hours later was a combination of failures in management, equipment and control systems during the plant upset. These led to the release of about 20 tonnes of flammable hydrocarbons from the outlet pipe of the flare knock-out drum of the FCCU. The released hydrocarbons formed a drifting cloud of vapour and droplets that found a source of ignition about 110 metres from the flare drum. The force of the consequent explosion was calculated to be the equivalent of at least four tonnes of high explosive. This caused a major hydrocarbon fire at the flare drum outlet itself and a number of secondary fires. The company emergency response team and the county fire brigade effectively contained these fires and prevented escalation by cooling nearby vessels that contained flammable liquids. Fires were allowed to burn, under the supervision of the fire brigade, until the evening of Tuesday 26 July 1994. This was the safest course of action as the flare relief system had been incapacitated by the explosion. 4 The site suffered severe damage to process plant, buildings and storage tanks. Due to the refinery's situation, well away from centres of population, off-site damage was very limited. Properties in Milford Haven town, approximately 3 km across the Milford Haven waterway, had some glass damage. Twenty-six people sustained injuries on-site, none serious. Mitigating factors 5 Two factors prevented possible fatalities. The first was good fortune. The incident happened on a Sunday afternoon when the site had a relatively low population of employees. Those people who were near the explosion found
  • 8. themselves, by chance, in advantageous locations (a van carrying contractors was about to enter the area which became enveloped in the fireball; men left a blockwork building used for issue of permits to work just before its walls were destroyed and the concrete roof fell to the ground). 6 The second factor was the quality of the overall safety provision on and around the site. For example, the most hazardous installation, the alkylation unit, had been built and operated to high safety standards, so that the attendant risk of release of toxic hydrogen fluoride had been minimised. It withstood the forces of the explosion on the neighbouring FCCU and its operators closed it down safely according to planned procedure. The cause 7 The incident was caused by flammable hydrocarbon liquid being continuously pumped into a process vessel that had its outlet closed. The only means of escape for this hydrocarbon once the vessel was full was through the pressure relief system and then to the flare line. The flare system was not designed to cope with this excursion from normal operation and failed at an outlet pipe. This released 20 tonnes of a mixture of hydrocarbon liquid and vapour which subsequently exploded. 8 The situation was caused by a combination of events, including: (a) a control valve being shut when the control system indicated it was open; (b) a modification which had been carried out without assessing all the I consequences; (c) control panel graphics that did not provide necessary process overviews; and (d) attempts to keep the unit running when it should have been shut down. 9 In their attempts to restore the plant to normal operation on the day, the company failed to take the necessary overall perspective, concentrating instead on the local, immediate symptoms rather than looking for the underlying causes. Furthermore, some arrangements for management of health and safety were shown to be inadequate, illustrated by failures in company systems for: assessing the risks from plant and procedural modifications; the use of programmable electronic systems (PES); and management of inspection and maintenance. Subsequent actions 10 HSE attended the site on the evening of the day of the incident. The investigation commenced as soon as the fires were under control, and
  • 9. proceeded over many weeks until the full circumstances were known and the site was safe to recommence production. 11 The occurrence of this major accident was notified to the European Union (EU). 12 The explosion and fires figured prominently in both the local and national news media. 13 Rebuilding the damaged refinery cost an estimated £48 million, and business interruptions significantly affected the UK refining capacity. 14 HSE brought legal proceedings against the partners in PCC. Texaco Ltd and Gulf Oil (Great Britain) Ltd each pleaded guilty to charges under the Health and Safety at Work etc Act 1974, sections 2 and 3, at Swansea Crown Court, on 22 November 1996. The defendants were fined a total of £200 000 and ordered to pay £143 700 costs. 15 This report concentrates on the failures and shortcomings that caused the incident. It omits discussion of the many good aspects of the management of health and safety identified during the investigation, some of which helped to mitigate potential consequences from the explosion. 16 The lessons to be learned from this incident, both for refineries and industry as a whole, are listed below. They are structured according to their nature, and not in priority order, and they are discussed in detail in paragraphs 125 to 139. Lessons from the incident Safety management systems 17 Recommendation 1 Safety management systems should include means of storing, retrieving and reviewing incident information from the history of similar plants. Recommendation 2 Safety management systems should have a component that monitors their own effectiveness. Human factors 18 Recommendation 3 Display systems should be configured to provide an overview of the condition of the process including, where appropriate, mass and volumetric balance summaries. Recommendation 4 Operators should know how to carry out simple volumetric and mass balance checks whenever level or flow problems are experienced within a unit.
  • 10. Recommendation 5 The training of staff should include: (a) assessment of their knowledge and competence for their actual operational roles under high stress conditions; (b) clear guidance on when to initiate controlled or emergency shutdowns, and how to manage unplanned events including working effectively under the stress of an incident. Plant design Protection systems 19 Recommendation 6 The use and configuration of alarms should be such that: safety critical alarms, including those for flare systems, are distinguishable from other operational alarms; alarms are limited to the number that an operator can effectively monitor; and ultimate plant safety should not rely on operator response to a control system alarm. Recommendation 7 Safety-critical plant elements on which the safety of a process relies, ie whose failure could lead to hazardous events, should be identified. Any safety system used to protect against hazardous events should be specified, and subsequently designed, based on an appropriate hazard and risk analysis so that the functions to be carried out and the necessary level of integrity are systematically determined. Plant layout Recommendation 8 In new build, or re-equipment, projects and in reviews of existing plant layouts, a risk assessment should be carried out with regard to the location, and suitability of construction, of buildings and plant. Flare system Recommendation 9 In processes that employ a flare system, there should be effective arrangements for the removal of slops from a flare knock-out drum that ensure that the removal is promptly initiated and at an adequate rate to prevent overfilling the drum. Plant modification 20 Recommendation 10 There should be a formal, controlled procedure for hazard identification and
  • 11. operability analysis for modifications (including emergency modifications) that ensures that all safety issues identified at the design stage are reflected in how the modification is constructed and used. lnspection systems 21 Recommendation 11 All safety critical parts of plant should be included by companies in comprehensive inspection programmes. Recommendation 12 lnspection programmes for corrosion should err on the side of caution, with regard to the number and location of measurement sample points, concentrating on measurement sample points where greater (or less uniform) metal loss is foreseeable. Recommendation 13 All foreseeable operational conditions, not just pressure, should be taken into account when setting the minimum acceptable thickness for pipe and vessel walls. Emergency planning 22 Recommendation 14 Fire brigades, in consultation with appropriate major hazard installations, would be wise to look at emergency plans particularly in respect of the availability of adequate water supplies for fire-fighting and vessel cooling, to deal with the worst case scenario. BACKGROUND The refinery 23 The refinery site occupies approximately 500 acres of the south shore of the Milford Haven in South West Wales. By road it is 7 km west of the towns of Pembroke and Pembroke Dock, Dyfed. Figure 1 shows the location of the town of Milford Haven, 3 km away, facing the refinery across the Haven waterway. 24 Two smaller refineries and an oil-fired power station (Figure 1) are clustered around the Haven near the Texaco site. 25 The population (including residential, commuting and labour force) within a 3 km radius is approximately 15 300, within 24 km 69 500. However, these figures are considerably increased during the summer holiday season. 26 The Texaco Refinery, as it is known locally, produces hydrocarbon fuels including motor fuels (petrol and diesel), kerosene, gas oils, fuel oils and
  • 12. Milford Haven 1Built up areas Other Roads Figure 1 Milford Haven, showing the location of the TexacoRefinery site
  • 13. liquefied petroleum gases (LPG: commercial propane and butane). 27 The facilities comprise a 190 000 barrels per day crude distillation unit and associated refining processes together with a blending and storage area, and deep water marine terminal. Crude oil arrives by sea in tankers of up to 300 000 tonnes capacity. Product exports are largely by sea and pipeline, together with a small volume that is moved by road. 28 Figure 2 shows the refinery itself. The process facilities are located at the south end of the refinery. The units operated by Pembroke Cracking Company (PCC) and Pembroke Refinery (PR) occupy distinct sections of the refinery site. The crude oil tankage is north-west of the process area, intermediate and finished products are kept in the tanks to the north and north-east, and LPG is stored to the east. The flares are further to the east. A 15 metre high earth bank runs nearly the whole length of the high ground north of the tankage area, so that only the stacks and tallest columns can be seen from Milford Haven. North of this ridge is the jetty and the fuel oil tankage. 29 There are ten process units in PR and eight in PCC. The main area affected by the explosion and fires was PCC whose units include the fluidised catalytic cracking unit (FCCU), butane isomerisation and HF alkylation units, and supporting processes. Feedstocks for PCC are supplied by PR and Gulf. The companies 30 The plant directly involved with the incident was the FCCU operated by PCC, a partnership between Texaco Ltd and Gulf Oil (Great Britain) Ltd which was established ahead of a major expansion and commissioning programme at the refinery in 1982. 31 The PCC process units were adjacent to, and integrated with, the PR process units. The Pembroke Refinery was owned by Texaco. PCC and PR were independent in the areas of process operation, process engineering, accounting and computing. There was a corporate training department (part of the personnel department) but process operator training had been conducted separately by PR and PCC. Both companies were on the same site but they were run as separate concerns. 32 Texaco provided a range of core services including maintenance, engineering, inspection and the Environment, Health and Safety department which also covered the fire-fighting facilities. Other departments covered both sites for personnel services (including medical), public relations, quality assurance, planning and security. 33 The companies employed about 600 people at the refinery, around 150 in the PR process areas and 120 in PCC. There was a normal complement of around 400 contractors' employees on site. During shutdowns there would be up to
  • 14. 03 Figure 2 Therefinery site layout Flare stack 19-F-102 Flare line 02-F-319 Flare knock-out drum Control Room Fluid catalytic cracking unit Line to slop tanks
  • 15. 1400 on site. During work following the incident there were, unusually, up to 2300 contractors on site. Management structure 34 The PCC management committee comprised six members, three from Texaco and three from Gulf, none of whom was based on site. The Site Director of Manufacturing and General Manager Pembroke Plant (the 'Site Director') had operational responsibilities for all activities within the site boundary and reported to the management committee, along with the General Manager of PCC. 35 The Site Director was the link between the on-site activities and both Texaco headquarters and the PCC management committee. The two on-site operating companies, PR and PCC, were each headed by a General Manager who, in practice, reported to the Site Director. The reporting relationship between the PCC General Manager and the Site Director was one of expediency. The PCC General Manager was contractually responsible only to PCC's Management Committee (Texaco/Gulf). 36 The company had an explicit health and safety policy, which stated its commitments to the health and safety of its workforce. Annex 4 summarises the structure for safety management at the refinery. DESCRIPTION OF THE PLANT Crude distillation unit 37 Crude oil was delivered to the refinery by sea and fed into the CDU where it was separated by fractional distillation into intermediate products, including naphtha and gas, kerosene, light diesel, heavy diesel, and heavier components. These heavy fractions (vacuum gas oil or VGO) formed the feed for the vacuum distillation unit (VDU) which in turn fed the fluidised catalytic cracking unit (FCCU) of PCC. Additional VG0 was imported from Gulf Oil's refinery on the north side of the Milford Haven waterway. Fluidised catalytic cracking unit (FCCU) 38 The FCCU, where the incident occurred, was a continuous process unit converting ('cracking') long chain and cyclic hydrocarbons into smaller hydrocarbon products used mainly in fuels. 39 The FCCU comprised: (a) feed and catalytic sections, where the cracking reaction took place;
  • 16. (b) regenerator, for regenerating the catalyst; (c) fractionation, where the product streams were separated; (d) recovery section, for further purifying the light fractions; and (e) absorption, for recovering LPG from the fuel gas stream. 40 VG0 at 230-270'~was cracked by contact with a pre-heated catalyst in a large reactor vessel, the 'cat cracker'. The reaction produced a complex mixture of hydrocarbon gases and liquids. The 'spent' catalyst was regenerated by burning off carbon in the regeneration section of the unit. The following fractions were produced: (a) ethane, methane and hydrogen, reused within the refinery as fuel gas; (b) liquefied petroleum gas (LPG), a major product of the refinery, containing propane, propylene, butane and butylene; (c) naphtha, used as a gasoline ('petrol') component; (d) light cycle gas oil (LCGO) used as a diesel blend stock; and (e) heavy cycle gas oil (HCGO) used as a fuel oil component. 41 Another product, intermediate cycle gas oil (ICGO) was used within the unit as a heat transfer medium. All the gas oils were used widely in the FCCU to transfer heat to other parts of the process; although energy-efficient this inevitably meant that the process controls and inter-relationships were complex. The products listed above were separated from the mixture by fractional distillation and solvent cleaning within the recovery section of the unit which contained a series of large fractionating columns operating at elevated temperatures and pressures. FCCU instrumentation, control and protection systems 42 The control and protection systems for the FCCU and other PCC plants were based on three separate but linked systems, each using programmable electronic equipment: (a) distributed control system (DCS); (b) critical process controller (CPC); and (c) advanced control and process optimisation system (ACPOS). 43 The DCS (a Honeywell TDC 3000 system) provided the primary control and
  • 17. alarm system for the FCCU. The CPC, a high integrity, independent monitoring system, provided alarms and automatic shutdown on three areas of plant which had been identified by the company as being critical to plant safety. These were: the main FCCU reaction system, the wet gas compressor and the power recovery train. Following the explosion, the CPC system shut the plant down as intended. The ACPOS provided automatic control of selected process variables on the FCCU, during stable plant operation, which were important for maximising plant throughput and efficiency. 44 All plant measuring devices were either directly monitored and controlled by the control system, or information was repeated across from other equipment and made available to plant operators. The plant was controlled within the DCS system by controllers, which automatically adjusted valves to maintain the target levels, temperatures, pressures and flows entered by the operators. The operators could also manipulate valve positions directly via DCS operating console keyboards. The PCC control room accommodated the butamer and alkylation units' operating consoles as well as the FCCU console which included six display units and associated annunciators. 45 The operators controlled the plant from the DCS keyboards, and alarm and other information was displayed on the screens. The photograph in Figure 3 shows the control room operating environment. Figure 3 Part of the main control room, showing the display screens and keyboards used to operate the plant
  • 18. Alarms 46 FCCU emergency and high priority alarm information was displayed as an 'area alarm summary' on the DCS screens and it was normal practice to leave one of the monitors with this information permanently displayed. Low priority alarms could not be seen directly on this screen. Each time a process point (for example a level, a temperature or a pressure) went outside the set values there would be an audible signal and an indication would appear in the area alarm summary. When acknowledged, the audible signal would stop. If the alarm were still active it would continue to show on the screen, disappearing when cleared. The primary displays, available to the operators for viewing alarms, were on monitors. On the area alarm summary, a text description of the alarm location was shown together with the alarm's priority, the type (ie whether it was a low alarm, high alarm, high- high alarm, out of range alarm etc), the tag number (unique identifier) and the time when the alarm first occurred. The most recent alarm was displayed at the top of the first page and the oldest at the bottom. Approximately 20 alarms could be viewed on this display. When there were more than 20 alarms in the system the oldest alarms scrolled off the bottom of the page on to the second page, with a maximum of five pages of alarms associated with this summary display. 47 Each alarm in the DCS system had a priority associated with it: emergency, high, low, journal (recorded but not displayed) or no action. The operator was presented with all alarms except 'journal' and 'no action'. In fact, the 'emergency' category was not being used at the time of the incident, except for one alarm. All alarms were recorded in the system's historical alarm records. 48 In addition to the display monitors a small number of alarms were displayed independently on hardwired annunciators (banks of small lighted panels with their own sounder, with one panel corresponding to one alarm). Some were mounted on the console and some mounted on the wall behind the console. Operating displays 49 A number of alternative display formats were available within the DCS from which operators could manipulate the process. These included graphical displays, which a system designer could program, and standard displays having a fixed format (eg bar graphs). Most FCCU process operations were carried out through the operating displays, but some pumps were started and stopped locally by the outside operators. 50 The operating graphics provided a line diagram representation displaying process information for most of the FCCU. Alarms associated with the process points were indicated on screen by colour changes on the process points. Plant controllers could be operated through these displays via the change zone (this was a purpose-built area at the bottom of a graphic which allowed plant control operations to be carried out, such as opening a valve). These graphics were
  • 19. designed by FCCU operations staff when the DCS was introduced to the FCCU four years previously. Although these operating graphics were available, in practice only the bar graph displays were used. Bar graph displays 51 These standard DCS displays comprised eight indicators alongside one another, having a fixed format. In the previous generation of equipment they were the main graphical display and were the most commonly used operating display. They were linked to preconfigured trends. The operators controlled the plant by adjusting set points or valve positions from these displays. The flare system 52 A flare system is of critical importance to the safe operation of a plant. Its purpose is to dispose, safely, of waste gases and liquids discharged from process units and storage areas, by separating liquids from gas and vapour which are then burned at the top of the flare stacks. If an unrestricted route to the flare tip were not available there could be either uncontrolled venting of hydrocarbon to atmosphere, or exposure of process vessels to forces in excess of their safe operating limits. 53 The flare (or blowdown) system on the Texaco refinery site was an arterial pipework system taking discharges from all over the plant. The pipes were connected directly to pressure relief valves, pump and other vents, and manifolded into flare subheaders on each process unit. Within each unit a knock-out drum, the 'on-plot flare drum', removed any entrained liquid from the unit flare subheader before the subheader joined the main flare header. In normal operation, the flare header operated at near ambient temperatures and pressures. During plant upsets, due to the discharge from relief valves on the plant, the flare line would experience locally elevated pressures, temperatures above or below ambient, and rapid flows of liquid and gas. The design, construction and maintenance of the flare system needed therefore to take account of the most arduous service conditions that could be foreseen. 54 The refinery flare system had three parts: (a) the sour flare, carrying acidic gases and hydrocarbons, the principal contaminant in the stream being hydrogen sulphide, H2S; (this was the flare system involved in the incident); (b) the sweet flare, carrying mostly low molecular weight hydrocarbons; and (c) the acid flare carrying hydrocarbon contaminated with toxic and corrosive gases and liquids that need further treatment before they can be burned at the flare tip.
  • 20. 55 For safe operation at least one flare outlet must be operational. For this purpose, the sour flare and sweet flare headers could be made common at a connection manifold to allow the sour flare stack to be safely taken out of service for maintenance, and the sour gas routed to the sweet flare stack. The sour flare 56 Along its route to the sour flare stack, the main flare header increased in size to 36 inches (915 mm) diameter and was joined by a 30 inch (762 mm) header from the FCCU on-plot flare drum. This drum received gases and liquids from the FCCU and also from the PCC Merox unit. The connection was made through four 90' elbows, one of which failed in service during the incident causing the hydrocarbon release. 57 The route of the main flare line to the flare stack is illustrated in Figure 2, and is shown in diagrammatical form in the sequence drawings in Annex 1. The on-plot flare knock-out drum is marked 02-F-319, and the off-plot knock-out drum is 19- F-102. Off-plots tankage 58 This report does not give a detailed description of the 'off-plots tankage', which is the provision for storage of fluid raw materials, products and effluent (known as 'slops') in tanks remote from the production units. 59 However, among the extensive range of tanks, there was facility for receipt of slops from the process, including those from the on-plot flare drum. Two tanks, numbers 53 and 814, were mainly used for this. These tankage locations are illustrated in Figure 2. THE INCIDENT 60 The start of the events which led to the explosion can be traced to the period before 09.00 on Sunday 24 July 1994, when a lightning strike started a fire on the crude distillation unit. The ensuing plant disturbances and power interruptions affected the vacuum distillation, alkylation, and butamer units as well as the fluidised catalytic cracking unit (FCCU) where the eventual explosion took place. Contrary to reports in the media by journalists and others, these events, though significant in initiating a plant upset, were not the cause of the release and explosion that occurred five hours later. These consequences resulted from subsequent failures to manage the plant upset safely. 61 There follows a brief, very simplified description of the causes of the incident with reference to Figure 4. Annex 1 provides a fully detailed account illustrated by time sequence diagrams.
  • 21. Location of the valves A B and C Figure 4 Simplifiedprocess diagram, to illustrate the interaction of the key valves and vessels that led to the incident (paragraphs61 to 70)
  • 22. 62 Just before 09.00 hydrocarbon flow was lost to the deethaniser, a vessel in the FCCU recovery section where lower molecular weight vapour fractions are separated. This caused the liquid in the deethaniser to empty into the next vessel along, the debutaniser (with its associated overhead accumulator vessel), where further fractionation takes place. The system was set up to prevent total liquid loss in vessels so the falling liquid level in the deethaniser caused valve A to close, thus preventing hydrocarbon leaving the vessel. This had the knock-on effect of starving the debutaniser of feed so the falling liquid levels in this vessel caused the outlet valve, valve B, to close. The hydrocarbon in the debutaniser was now blocked-in. Although there was no additional flow into the debutaniser, the trapped liquid was still subject to heat. Therefore the liquid vaporised and the debutaniser pressure rose until it caused the pressure relief valves to open and the debutaniser to vent, for the first of three times, into the flare knock-out drum (intended to remove liquid from the hydrocarbon vapour stream passing from the relief valve to the flare stack) and on to the flare. 63 Shortly after 09.00 the liquid level in the deethaniser was restored so valve A opened and flow was restored to the debutaniser. This should have caused valve B to open and allow hydrocarbon out of the already pressurised debutaniser into the naphtha splitter. However, valve B never opened. Operators in the control room received signals wrongly indicating that it had opened and the debutaniser continued to fill with liquid while the naphtha splitter emptied. 64 The set-up of the displays on the operators control system was not conducive to diagnosing the problems that were occurring. There was no overview of the process and its mass balance. The process was broken up into discrete detailed sections that could be called up onto separate screens. The operators' attention was concentrated on the screens which showed the problems around the deethaniser and the debutaniser; an overall process display screen would have quickly informed the operators that although the instruments showed that valve B was open, the reality was that no hydrocarbon was passing from the debutaniser to the naphtha splitter. 65 To relieve the pressure on the debutaniser system the operators opened valve C which allowed flow from the 'full' debutaniser overhead drum to another vessel in the recovery section, the wet gas compressor interstage drum. The wet gas compressor compresses the vapours produced in the unit into liquid that is moved through the rest of the recovery section. Opening valve C did not prevent the debutaniser becoming liquid-logged, so just after 10.00 the debutaniser vented to flare via the flare knock-out drum for the second time. 66 The opening of valve C caused the liquid levels in the interstage drum to rise to such an extent that it flooded into the dry end and caused the compressor to trip (shutdown) at 10.08. Unfortunately, this meant that large volumes of gas had nowhere to go in the plant, and had to be vented to the flare stack to be burned off.
  • 23. 67 The consequence of this venting to flare was very high liquid levels in the flare knock-out drum. Its contents were increased still further by the operators' next action which was to try to remove the flooding from the dry end of the interstage drum by draining the liquid directly to the flare line via an impromptu modification which employed steam hoses. This activity allowed the wet gas compressor to be restarted at 12.28, which provided increased flow through the unit, but also caused a further increase in pressure in the debutaniser. With valve B being closed, the debutaniser vented to flare for the third time at 12.46. This time it carried on venting until the explosion 36 minutes later. 68 Again action was taken by the operators to alleviate the pressure in the debutaniser, and valve C was opened to allow hydrocarbon to move from the debutaniser into the wet gas compressor system. The wet gas compressor tripped (at 13.22) because the dry end became flooded. As previously described, this meant that large volumes of gas had to be vented to flare. However, by this time the flare drum was filled to a level beyond its design capacity. The fast flowing gas passing through the overfilled vessel forced liquid into the knock-out drum discharge pipe. This line was not designed to take liquid; in normal service, liquid is removed by the flare drum. The line was known to be corroded. The force of the liquid in the pipe caused it to break at an elbow bend, releasing about 20 tonnes of highly flammable hydrocarbon from which a vapour cloud formed and exploded. 69 Two circumstances prevented this unplanned liquid-filling being properly managed. Firstly, warnings of the developing problems were lost in the plethora of instrument alarms triggered in the control room, many of which were unnecessary and registering with increasing frequency, so operators were unable to appreciate what was actually happening. Secondly, a modification to the flare drum pump-out system prevented liquid being pumped automatically to storage tanks outside the unit (to slops). This modification, whose significance in this type of plant upset situation had not been realised, had been carried out some years earlier to prevent waste of potentially valuable hydrocarbon products for environmental reasons. It altered the way the flare knock-out drum was emptied of liquid. Originally liquid would have been pumped automatically at a high rate to 'slops' storage when it reached a designated level. After the modification it was slowly channelled back into the system that had just released it, so in the circumstances leading up to the explosion no reduction of liquid in the system was achieved. 70 In the sequence diagrams, Figures 7 to 12, valves A, B and C are labelled with their plant identifiers: FV 404, FV 436 and HCV 439 respectively. EMERGENCY RESPONSE 71 Texaco operations personnel shut down and isolated process equipment when two out of the plant's three flare systems were disabled as a result of the
  • 24. explosion and fires. They worked with the company's Auxiliary Plant Fire Brigade (APFB), who mobilised the first tender within one minute of call-out, and the Dyfed County Fire Brigade (DCFB), to bring the fires under control. Texaco APFB were called out three times on the day of the incident. 72 The last of the fires was extinguished about two and a half days after the initiating explosion. Because the flare system was inoperative, the best option was judged to be to allow the fires to burn until the source of hydrocarbon fuelling them had been removed, while the site and county fire-fighting teams kept vessels and other equipment cool. 73 The initiation of the off-site plan was carefully considered by the plant senior management and DCFB when they arrived on site. This plan never had to be put into operation, but it was held for review in case the fire spread to the alkylation plant. 74 The company had set up, as part of their contingency plans, two Base Control centres equipped with plant drawings, water resource data, computer modelling facilities, communications and other essential equipment. One was situated in the gatehouse area, one on site in the workshops area. Neither was used during the emergency. The Base Control at the gatehouse was extensively damaged during the explosion; the other facility was rejected by senior management and DCFB in favour of accommodation in the main office block. 75 Some ground monitors in the blast area were damaged, but did not have serious leaks. The Fire Hall and Medical Centre were both damaged in the explosion. Access to the Medical Centre was difficult initially because of blast damage. 76 The Police set up official traffic control points to allow only essential personnel and emergency vehicles access to the site. 77 An HSE inspector was on site within a few hours of the accident to start HSE's investigation. HM Pollution Inspectorate and National Rivers Authority (now part of the Environment Agency) responded the following morning and carried out sampling and inspection for off-site environmental pollution effects. The company's report on the incident indicated there had been no such effects. DAMAGE 78 The first detailed inspection of the scene was made on 27 July 1994, after the emergency services had left the site. A large area of the plant had suffered severe structural damage as a result of the explosion and fires. There were precarious sections of overhead duct-work, pipework, pipe-racks and other structures. Access scaffolding which had been present before the explosion had been destroyed or was now unstable. Structural risks were assessed and safe
  • 25. access procedures agreed between HSE, site management, trade unions and contractors. 79 The blast had also caused damage to buildings, vessels, columns and tanks, varying from complete destruction of block wall buildings near the blast area, to window and roof damage outside the site. The Control Room had some blast protection features but had suffered internal damage because the door had been open at the time of the explosion. This was because the earlier power interruptions had rendered the air conditioning control inoperative. Some window damage was caused to shops and other buildings off-site, as far away as Milford Haven town. 80 Examples of some of the damage caused are shown in Figures 5 to 9. Figure 5 The 30 inch flare line elbow bend that failed and fell to the ground, releasing the hydrocarbon liquid and vapour 19
  • 26. Figure 6 Widespreadsite damage caused by the explosion Figure 7 Some very large structures, such as the ducting weighing several tonnes shown here, were left balanced in dangerous positions after the explosion
  • 27. Figure 8 investigati the debris One of the HSE ion team examines part of following the incident Figure 9 One of the damaged shop fronts in Milford Haven town, where many properties had glass broken
  • 28. HSE INVESTIGATION The explosion was reported on local and then national news very soon after it happened. The Cardiff-based HSE Principal Inspector responsible for the site heard one of these bulletins and contacted the company at about 14.00 on Sunday 24 July 1994. He was subsequently kept informed of site developments by the company while he briefed the relevant HSE personnel and set in motion the procedures set out in the area emergency plan. At approximately 18.30, an HSE inspector arrived on site to assess the scale of the incident and to gather information to brief the multi-disciplinary HSE investigation team which was going to meet at the Cardiff area office at 08.30 on Monday 25 July. This meeting was chaired by the acting Field Operations Division (FOD) Area Director with input from the FOD Regional Director. Following this meeting inspectors were sent to the site to start the investigation, while the Cardiff area office conference room was established as an incident room. An on-site investigation team, led by the Regional Director, was established by the time the fires were extinguished on Tuesday 26 July 1994. At this time the incident room was transferred from HSE Cardiff to a room on the site provided by the company. The investigation team included: inspectors from the Wales and South West of England area office; specialist inspectors in chemical, mechanical, electrical, civil and process safety engineering from the Wales and South West of England Field Consultancy Group; and experts in fire, explosion, mechanical engineering and instrumentation from the Technology and Health Sciences Division and the Health and Safety Laboratory, Sheffield and Buxton. As well as establishing the causes of the incident, it was important to ensure that the damaged site with its highly hazardous inventories was made safe, and that any actions by the company to rebuild the plant and reinstate its activities were appropriate with regard to the risks involved. With this aim, the HSE presence was organised into the following teams: Liaison (to provide a link between the HSE teams and the company, emergency services, other government bodies, media etc). Mechanical engineering. Process engineering. Electrical engineering, instrumentation and control. Safetylreinstatement. Legal issues.
  • 29. 85 Inspectors generally contributed to more than one team. During the course of the investigation members of the HSE teams: (a) carried out detailed examinations, witnessed tests of equipment in situ, and made photographic records of the plant involved in the incident; (b) took possession of a large number of items of plant and equipment for further detailed examination at HSE's research laboratories. Each piece of equipment was individually numbered and photographed on-site before being removed. Access to the larger pieces of plant identified by HSE as relevant to the investigation was strictly controlled until they had been fully examined; (c) interviewed witnesses; and (d) examined documents relevant to the plant and to the company's management systems. 86 The company, its employees and their trade union representatives provided full co-operation throughout the HSE investigation. Managers and safety representatives were kept informed by regular meetings about the progress of HSE's investigation. Fifty-four written statements were taken. The company set up its own internal investigation at an early stage and invited a member of the HSE investigation team to be present at its meetings. There was a full exchange of information, between HSE and the company, relevant to the ongoing investigation and the reinstatement of the plant. THE KEY FINDINGS 87 A brief overview of the content and results of the investigation is provided below. This is followed by a more detailed explanation, in paragraphs 89 to 124, using the same headings. 88 Following an initial assessment the investigation concentrated on a number of areas which were clear contributory factors to the incident. Operation and control of the fluidised catalytic cracking unit (FCCU) Liquid flows and mass balance The control system allowed more liquid to enter the recovery section of the FCCU than was leaving it.
  • 30. Energy conservation and control The control system allowed another inputloutput imbalance, this time of heat energy. Organisation and control During the process upset the actions taken were too reactive, with nobody adequately standing back from the action to make a detached assessment of the cause of the problem, ie 'managing'. Operating displays The configuration of the display-screen based information system made it difficult for operators to identify the cause of the upset. Alarms Too many poorly categorised alarms overwhelmed the operators as the process upset developed. Instrument maintenance The incorrect behaviour on the day of a number of instruments used for control contributed significantly to the causes of the incident. A significant proportion of the instruments which HSE later tested were found to be in need of maintenance. Modification of the flare drum pump-out system Flare drum pump-out modification The flare drum is an important part of the flare system, which during the incident was relieving overfilled vessels. An earlier modification to its pump-out system severely reduced its automatic liquid handling capacity. It overflowed, causing liquid to enter an outlet designed for gas only. This consequently failed, releasing the flammable hydrocarbon in a cloud which exploded. Company assessment of pump-out modification There was no recorded safety assessment concerning this modification. It was possible to restore the original pump-out capability, by manually opening a valve, but this procedure had fallen into disuse from lack of practice and written procedures.
  • 31. Corrosion The flare drum outlet line which failed, releasing the hydrocarbon that exploded, was severely corroded. The presence of corrosion was known, but the full extent was not recognised because it had not been inspected at the point of failure, where there were inspection access difficulties. Although the flare line was clearly not properly maintained at this point, the investigation subsequently determined that this corrosion was not a direct cause of the incident. RESULTS OF THE INVESTIGATION Operation and control of the fluidised catalytic cracking unit (FCCU) Liquid flows and mass balance 89 The liquid flows within the FCCU recovery section were controlled by control loops linking the level within each vessel to its discharge rate. The underlying logic was that if the discharge rate increased it would eventually overtake the input rate and the level in the vessel would fall. It also follows, however, that liquid would accumulate in the system in the event of the material discharge rate being reduced to below the input rate (as there was no control over the input flow). 90 In this type of system, which relies on a single control loop, it is essential that the designed maximum output flow will always exceed the maximum input flow. If this condition cannot be guaranteed, the installation of a second control loop acting on the input would improve the system's control and safety since it would ensure that, in the event of continuing accumulation occurring within the system, the input would be reduced or shut off. In essence, it is good practice to have a back-up feedback control. This is often achieved by a high level trip that automatically stops input flow. 91 As there were only single output control loops on the FCCU recovery section, it follows that a serious process upset leading to material accumulation would occur when flow out of a vessel was restricted below its input rate for whatever reason. In this incident, an undiagnosed blockage in the system caused this restriction, which led to the liquid accumulation, which eventually exceeded the capacity of the relief system resulting in loss of containment. Energy conservation and control 92 There were heat exchange systems within the FCCU recovery section designed to conserve energy by using the hot product from one part of the process to preheat or reboil the inputs to that of another part of the process. This involved a number of complex energy balances within the system. Heat energy could be
  • 32. lost from the recovery section through cooling in the fin fans or water chillers. 93 In the same way that the mass balance has an implication for the control of the process, so does the energy balance. It is important to be able to remove energy from the system in a plant upset, so reflux systems which actually withdraw energy from the system, eg the fin fans, are given priority over the heat exchangers which just move it from one part of the unit to another. In the context of a plant upset the balancing of such inter-relationships can add to control difficulties, since correcting a high temperature in one vessel may raise temperatures elsewhere in the process. Reliable process control requires that energy input cannot exceed the capacity to remove it from the system. Organisation and control 94 The flexible, multi-skilled team on the FCCU contained individuals capable of fulfilling more than one job function. In upset conditions it was normal for all levels within the management structure to 'help out' in the control room. This flexible approach to operating control systems can be beneficial, but raises some potential control problems. Where more than one operator is working, an increased emphasis on communication is required to ensure that each is working with the team, and contradictory operations are avoided. 95 There was the risk in this serious upset that, as people at senior level helped out, they took on operating roles rather than taking an overview of the whole process. Decisions were made on an individual, too reactive, rather than a fully co-ordinated, basis. Operating displays 96 Under the FCCU control system that existed on the day of the incident any imbalance in liquid flows through the FCCU could lead to liquid accumulation. It was therefore important that any imbalance in liquid flow be detected so that the mass flows of the unit could be returned to a balanced position. 97 The plant was well-equipped with level alarms which showed where liquid was accumulating, but it was more difficult to assess the relative flows through the vessels and the overall mass balance of the unit. The process of fractional distillation requires that one raw material is divided into many fractions. While it was easy to assess the unit feed rate, the various outputs of the process were spread over five product streams. This generated a practical problem, in that the accumulated outputs of the system may be spread across several different control display units, and the overall output of the unit would not be readily apparent unless the control systems were configured to meet this need. 98 This need was not met; there were no displays providing an overview with an appropriate timescale on the FCCU. Therefore it was difficult to obtain a
  • 33. complete picture of the whole, or large sections, of the process. In a primarily display-screen based operating system, the provision of good overview displays is of particular importance, as the operator does not have access to a continuously available set of panel indicators. During the incident no-one from the operations department had a complete picture of the status of the FCCU. 99 The actual FCCU graphics on the operating displays were not best designed and configured to help operators control the process. (a) The operating graphics on the FCCU contained limited amounts of process data per graphic, and did not make use of colour and intensity to highlight process data. (b) Some graphics contained details of the internal structure of plant items. However, displaying the structure of plant items is useful only if measurements or derived information (eg pressure, flow, temperature) are also displayed to give the operator information relevant to the plant status. (c) Text was used unnecessarily at times in the FCCU graphics. Text takes up large amounts of space on a graphic and there were instances where the same information could have been better indicated by colour change. Alarms 100 In the system as it was configured on the day of the explosion, the chances of the operators restoring control by manual intervention decreased the longer the upset condition persisted. This was because they became progressively overloaded with an increasing barrage of alarms. 101 Observations from the distributed control system (DCS) alarm records indicated that during the incident, alarms were being presented to operators at the rate of one every two to three seconds. Alarms going off this frequently resulted in operators cancelling them because of their nuisance value without necessarily recognising what they meant. 102 The alarm records were subdivided into journals (recorded lists). Journals are used mainly by process engineers for post-event diagnosis. The number of alarms which were received by the operator just prior to the incident could not be quantified accurately because four of the 16 relevant journals had lost all data relating to the incident. They had been overwritten by alarms occurring later in the day (each alarm journal holds only 500 records and the printouts were taken four hours later). These four journals were related to the equipment which was most closely concerned with the incident and therefore generating most alarm signals. From the limited amount of alarm information relevant to the event which was preserved from just one of the journals, it was seen that in the last 10.7 minutes before the explosion the two operators had to recognise,
  • 34. acknowledge and take appropriate action on 275 alarms. At times during the morning operators were doing nothing but acknowledging alarms. 103 There were 1365 monitoring points connected to some form of instrumentation on the FCCU. Of these, 55% (755) had one alarm configured and 31% (431) had two alarms configured. In addition there were another 190 alarms generated from controllers built into the system software. The total number of alarms configured was around 2040. 104 Of the alarms configured in the DCS system, 87% were high priority and 13% were low priority alarms. In the recovery section of the FCCU the company had not developed the same level of alarm prioritisation as in the catalytic section. Certain emergency alarms in the recovery section, though not for the flare drum, were provided on the critical process control system (which subsequently worked as designed), but on the DCS system only one alarm was given emergency priority. As the majority of alarms were assigned the same high priority, virtually all were presented on the area alarm summary and the operators were unable to tell which alarms were critical to safety and which were not. There was no philosophy for determining what priority an alarm should have and no control was exercised over the number of alarms in the system. 105 At 12.56 the high level alarm for the flare drum was activated. There is no evidence that it was seen. There were approximately 25 minutes between the triggering of this alarm and the explosion. A number of other critical alarms (not directly related to the incident) also appear to have been missed among the many equal status alarms. Instrument maintenance 106 During the incident a number of instruments displayed abnormal behaviour. HSE examined and tested 39 instrument loops (those most closely related to the incident). Of the 39 tested, 24 required attention to correct deficiencies which varied from minor mechanical damage to major faults which rendered the loop inoperative. Some loops contained more than one fault. Faults were grouped as follows: (a) major (loop inoperative in 'automatic' mode or seriously deficient) - six faults; (b) significant (errors in measurement or calibration) - 11 faults; (c) housekeeping (mechanical damage, valves passing etc) - seven faults; (d) incorrect information (inaccurate data sheets) - seven faults. 107 With the possible exception of the faulty debutaniser outlet valve (valve B) described in 'The incident' section in paragraph 62, none of the faults is
  • 35. believed to have occurred spontaneously on the day of the incident. All existed prior to the incident, and some were known, but a decision had been taken to defer action until the next planned shutdown. A review of the faults indicated: (a) some of the faults could have been detected by simple visual inspection; (b) some of the faults were known about but were being lived with; (c) some of the faults were due to design-related errors where the cause would not have been apparent to a technician following a simple loop check but would have required an engineering investigation to diagnose and correct; (d) a number of instruments had clearly not been well-maintained as their process isolation valves were passing; and (e) none of these items had previously been identified as safety-critical. 108 It would be easy to dismiss the sticking shut of valve B as a 'one-off' equipment problem, but it is likely that the poor condition of associated instruments contributed to the valve remaining both shut and undetected, leading eventually to the overfilling of the flare drum (the description provided with Figure 11 in Annex 1 provides an example). It is believed that valve B stuck shut at approximately 08.50, as the level and flow indicators downstream of this valve all fell to zero after this. However, the flow indicator closest to the valve continued to indicate a flow and the level in the bottom of the debutaniser, while high, was not at its maximum (refer to 'The incident' section for more detail). Both of these readings are believed to have been erroneous. In the sequence diagrams in Annex 1, Figures 11 to 16, valve B is labelled with its plant identifier FV 436. Modification of the flare drum pump-out system This section deals with the design and modification of the on-plot flare liquid knock-out drum 02-F-319 (referred to as flare drum F-319) Flare drum F-319: liquid handling capacity 109 Flare system design is covered by a Texaco design standard GEMS G-5D9 which also refers to the relevant American Petroleum Institute guidance (API RP-521). In particular, the mechanical design section of GEMS G-5D9 states: 'Each knock-out drum shall have 15 minutes surge volume at design liquid input and no pumpout. This volume shall be between the level at which the pump starts and the maximum liquid level. The maximum liquid level shall not exceed 50 per cent of the drum diameter. The pump must empty the drum from the
  • 36. maximum liquid level to the pump shut off level in 30 minutes, assuming negligible liquid flow to the drum.' 110 As designed, the flare drum F-319 had adequate volume to provide over 20 minutes capacity, at the maximum foreseeable rate at which it could be filled (known as the 'worst case liquid relief'), and not counting any pump-out facility. In practice, the capacity of the system as it was operated before modification should have been well in excess of 20 minutes, due to pump-out at the same time as liquid fill. This was well within the standard quoted above, before the pump-out facility was modified in 1991. Flare drum F-3 19: pump-out modification 111 With reference to Figure 10, the initial arrangement of the flare drum before it was modified in 1991 had interlocks that existed between the drum level transmitter(') and the valve(*) that allowed liquid to leave the flare drum. In the event of a high liquid level the closed valve would open automatically, clearing the line to slops tankage and also causing the discharge turbine pump to be provided with steam. This was an automatic control loop which would both start the discharge pump and route the liquid contained in the vessel to slops, at the designed pump-out rate of over 200 m3h-l. Removing the liquid to slops meant that the liquid was being removed from the FCCU and flare systems. If the level had continued to rise in the flare drum a high level alarm(3)would have been initiated on the main control panel. A separate high-high level alarm(4)was intended to activate a local air horn and control room alarm if the liquid rose to 50% of drum volume. 112 Following the 1991 modification the sour water and other liquid that collected in the boot (lowest) section of flare drum F-319, was pumped back into the recovery section of the FCCU. This meant that hydrocarbon accumulating in the unit, because of abnormal conditions, was just recycled instead of being removed to off-plot slops. It was possible to reconfigure the system to its original efficiency by manually opening valves so that the liquid could be pumped to slops, but this had rarely been done in practice (in fact there were no written procedures to show how or in what circumstances it should be done). 113 Figure 10 explains the arrangement of the modified pump-out facility in more detail. The need for the modified control and routing of material to slops followed a company initiative to reduce pumping to slops, on perfectly reasonable grounds of efficiency and environmental improvements. The drum level transmitter(') was retained, but the level controller(5)now operated a switching valve which could initiate the pump-start by directing steam to the pump turbine and stop the pump when the level dropped. This level control was designed to regulate the drum boot-levels of liquid and consequently the start and stop controls would normally regulate the removal of approximately 5 m3 of
  • 37. Figure 10 Diagrams to illustrate the modification to the flare knock-out drum pump-out arrangements Recovery sect~onof FCCU Recovery sect~onof FCCU- Flare l~ne Flare 11ne - r Flare r( Automatic sp~llback l~ne Vapour -- I I I II I I I I I I I Flare - I I I-- Slop tank Or~fice/ -Manual7-valve normally closed A plate 221m3.hr (Could be opened by hand to drrect flow to slop) Flare Drum 02-F-319 after modification Vapour -- 7m3.hr d W FTManual valve 221m3.hr normallyopen Flare Drum 02-F-319 before modification 0214m3.hr 4 l I I I I I I I I I I I I-- Slop tank
  • 38. liquid from the bottom of the drum. The pressure output from the drum level transmitter(') was also routed to an electronic tran~mitter(~)that relayed the liquid level signal to the DCS display screen in the control room, with associated high and low level alarms. The output from the drum level transmitter(') was also taken to the slops line valve(2)but that line was isolated by a closed manual gate valve, which prevented discharge to slops unless a decision was taken and instruction given to send someone to the valve to open it. 114 The high-high level alarm(4)was retained and activated alarms both locally and in the control room. The alarm was a float switch, but the set point at which the alarm was triggered was not visible from outside the drum. It was therefore not possible to be certain at which point within the range of the switch (ie 42 to 58%) the alarm would have sounded. However, it is certain that before a level equivalent to the upper tapping point (58% of drum volume approximately 130 m3) was reached, the alarm would have sounded. 115 The pipework was re-routed so that the pump would now discharge automatically back into the secondary overhead accumulator (ie back into the FCCU process). This discharge back to the process was limited by a restriction orifice that permitted a flow of only between 7 and 9 m3h-l.The pump's maximum discharge rate (the original pump-out system capability) was around 221 m3h-l, so a spill-back line was fitted to the drum, which would take the excess flow when the pump was running. The modified system was still physically capable of discharging excess liquid to slops, but the automatic system that had previously existed was replaced by one which required manual intervention. 116 The effect of the modification preventing the automatic pump-out to slops was effectively to change the protection provided for the plant from an automatic to a manual system. 117 An engineering request (ER) dated 29 August 1987 sheds light on the difference between the original intention of the modification and the way it actually came to be used in practice over the years. The ER actually describes the modification which would reduce pump-out rate from the original 221 m3h-' to 7 m3h-l.The idea of the modification, which was implemented in 1991, was to reduce the load on the effluent treatment plant during normal operating conditions. The design intention was to revert to the original full pump-out capability (by opening manual valves) if the liquid level in the flare drum should rise to the second high level alarm. However, failure to take this manual action would increase the pump-out time from less than 30 minutes to over 15 hours. 118 In practice the full pump-out capacity was seldom, if ever, made available after the
  • 39. modification and was certainly not used on Sunday 24 July 1994. This contributed directly to the incident. The flare drum F-319 liquid level indicator showed that the drum had filled up at a rate similar to a worst case liquid relief by about 10.10 on the morning of the incident, because of product venting from the debutaniser. The liquid level fell slowly because of the low pump-out rate until a further significant fast filling at about 12.46 which resulted in a second high level alarm at 12.56. The vapour relief load from the FCCU overhead accumulator (as explained in 'The incident' section and the detailed description of the sequence of events in Annex 1) just prior to the incident was then likely to have been sufficient to force liquid into the line due to the high liquid level in F-319. The corroded line, which in any case was not designed for liquid loads, therefore failed due to the excessive loads imposed, releasing the hydrocarbon that subsequently ignited. Company assessment of pump-out modification 119 The records concerning this modification did not include any 'safety assessment'. Subsequent HAZOP studies did generically identify the potential problem area of high liquid levels in knock out drums, and indeed triggered other concerns on pump-out capability (such as whether a single pump was sufficiently reliable without a standby). However, the full implications of modifying the rate of automatic pump-out from flare drum F-319 had not been scrutinised in detail. 120 A key feature of the pump-out modification was reliance on appropriate operator manual action to deal with high drum liquid levels. However, in practice, personnel did not have instructions or experience of reconfiguring the system to pump to slops at the desired rate of 221 m3h'". 121 There should have been, as a minimum requirement, an instruction to revert to full pump-out rate during difficult operating conditions which resulted in a heavy flare loading, with the first and second drum level alarms as a back-up prompt for the necessary intervention. The engineering request did not specify this standard, stipulating manual intervention only in response to the second high level alarm. It was not stated what action, if any, was to be taken in response to the first high level alarm. Corrosion 122 At the time of the explosion, the 30 inch diameter flare outlet line from vessel flare drum F-319 had become severely corroded. There is no suggestion that the degree of corrosion caused the release of liquid and vapour which ignited in the incident - under the excessive forces in the line at that time, it probably would have failed whether corroded or not. But the companies had failed to maintain the line so that it could withstand foreseeable forces acting on it. In the section of pipe which failed, shown at Figure 5, the corrosion had progressed well beyond the nominal corrosion allowance. There were perforations in some regions, and
  • 40. remaining thicknesses down to 0.3 mm in the vicinity of the rupture were found when measurements of the failed elbow were made after the incident. 123 The flare system was scheduled for repair, and partial replacement, during the refinery shutdown planned for the spring of 1995. This shutdown had been deferred from the autumn of 1994. The company believed that the flare line would be safe until the spring 1995 shutdown, but they did not have knowledge of the extent of corrosion at the point which ultimately failed because no survey or inspection measurements had been done at that precise location. 124 Further details of the extent of corrosion which the investigation revealed are included as Annex 2. LESSONS FROM THE INCIDENT 125 It is common, in major accident investigations, to find that a number of coincidental failings, some of which may have existed for some time, have come together resulting in the eventual explosion, fire, or release of toxic material. This incident is no exception. 126 HSE's investigation identified a number of lessons from the incident of 24 July 1994. The purpose in publishing these lessons is to stimulate those in other industries, as well as the refining and petrochemical industries, to improve the standards of safety management and control on sites where there is a risk of major accidents. The lessons are grouped under the following headings: Safety management systems (SMS) Human factors Plant design Plant modifications Inspection systems Emergency planning Safety management systems (SMS) 127 All the key elements of the incident, and the lessons drawn from it, have been seen and publicised before, in major accidents around the world. Those who are responsible for operating hazardous plants must have systems in place that bring to their attention these lessons of history. Recommendation 1 Safety management systems should include means of storing, retrieving and reviewing incident information from the history of similar plants.
  • 41. This is the philosophy underlying the distribution of information in various commercial databases and publications and also one of the intentions behind the record-keeping requirements of the Construction (Design and Management) Regulations 1994. 128 The incident investigation demonstrated that some of the company's crucial safety management systems were not adequately performing their function. Examples are the systems for modifications (paragraph 116 onwards), instrument maintenance (paragraph 106 onwards) and inspection (paragraph 122 onwards). The company was unaware of these defects in its safety management systems because its monitoring of their performance did not effectively highlight the problems. Recommendation 2 Safety management systems should have a component that monitors their own effectiveness. Human factors 129 The incident developed from its initial causative problems largely because of the combined effects of two factors. Firstly, operators were not provided with information systems configured to help them identify the root cause of such problems (paragraph 97 onwards). Secondly, the preparation of shift operators and supervisors for dealing with a sustained 'upset', and therefore stressful, situation was inadequate (paragraphs 94 and 95). The interface between the operators and the control system should have been designed to give the operators and managers overview facilities through the display. This was not the case and the discrepancies in mass and volumetric balance in the process, that would have provided a powerful indication of how the problems should have been dealt with, were not noticed. Some managers and supervisors were involved in 'hands-on' operational matters instead of performing a strategic and diagnostic role. This resulted in action being concentrated on the symptoms of the problem, and not the causes. Recommendation 3 Display systems should be configured to provide an overview of the condition of the process including, where appropriate, mass and volumetric balance summaries. Recommendation 4 Operators should know how to carry out simple volumetric and mass balance checks whenever level or flow problems are experienced within a unit.
  • 42. Recommendation 5 The training of staff should include: (a) assessment of their knowledge and competence for their actual operational roles under high stress conditions; (b) guidance on when to initiate controlled or emergency shutdowns and how to manage unplanned events including working effectively under the stress of an incident. Plant design Protection systems 130 The alarm system was such that warnings of crucial problems were lost in the plethora of general and less important alarms (paragraph 100 onwards). On the TDC control system, only one alarm was designated 'emergency', of the rest 870h were classified 'high priority' and 13% 'low priority'. With alarms going off every two to three seconds, operators did not and could not react appropriately to each alarm. Each alarm should have had a clearly defined purpose, such as safety, equipment failure, abnormal process conditions or product quality. The correct number of alarms should have been determined by operability criteria. Preferably, there should be as few safety critical alarms as possible. These should be limited to those situations where, unavoidably, a wider knowledge of the process conditions is required than can be provided for by an automatic protection system. Recommendation 6 The use and configuration of alarms should be such that: safety critical alarms are distinguishable from other operational alarms; alarms are limited to the number that an operator can effectively monitor; and ultimate plant safety should not rely on operator response to a control system alarm. 131 Control and protection systems should be independent. The use of control and protection systems in safety-related applications should take account of HSE guidelines (Programmable Electronic Systems in Safety-Related Applications) and emerging standards (Draft International Standard IEC1508, Functional Safety of EIEIPES safety-related systems). Recommendation 7 Safety-critical plant elements on which the safety of a process relies, ie whose failure could lead to hazardous events, should be identified. Any safety system used to protect against hazardous events should be specified, and subsequently designed, based on an appropriate hazard and risk analysis so that the functions to be carried out and the appropriate level of integrity are systematically determined.
  • 43. Plant layout 132 It is likely that there would have been many more casualties if this incident had occurred on a weekday, with more people on site and the offices fully occupied. As it was there were lucky escapes from damaged structures, particularly from the permit buildings (paragraphs 78 and 79). By contrast, in the Flixborough explosion, 18 of the 28 fatalities occurred in the control room as it collapsed. Recommendation 8 In new build, or re-equipment, projects and in reviews of existing plant layouts, a risk assessment should be carried out with regard to the location, and suitability of construction, of buildings and plant. Flare systems 133 The pump-out system for the flare knock-out drum 02-F-319 was modified for efficiency and environmental reasons. Before the modification, there was an automatic pump-out system that removed excess liquid to slops at an adequate rate. The modification consisted of a reduced capacity, automatic system that routed limited quantities of liquid back to the start of the process. In addition, a manual system was retained to deal with excess flows. This required FCCU operators to communicate with off-plots tankage operators (to check, for example, that the tanks that receive the slops have sufficient capacity) and to open valves manually (paragraph 112 onwards). Operators had no proper instruction or information about how and when this modified procedure was to have been used, and were not able to appreciate the safety implications of breaching the company's operational standard for maximum liquid level. Recommendation 9 In processes that employ a flare system, there should be effective arrangements for the removal of slops from a flare knock-out drum that ensure that the removal is promptly initiated and at an adequate rate to prevent overfilling the drum. Plant modifications 134 There are numerous examples where modifications to plant hardware, software or procedures have led to loss situations. The failure to consider the safety consequences of a modification, or failure to take account of all the history leading up to a modification, are common factors. Examples include the Flixborough explosion over 20 years ago, the BP Grangemouth hydrocracker explosion, and the modification to the flare knock-out drum in 1991 that became an important factor in this incident (paragraph 111 onwards). 135 The well-documented discussions leading up to the modification of the flare drum pump-out included means of maintaining the safety integrity of the system.
  • 44. Unfortunately, the documentation following the final modification lost the detail of these discussions so that, although the drum could still be pumped out to tankage, not everyone knew how or when this should be done. Furthermore, the emergency modifications employed to drain the wet gas compressor interstage drum during the process upset (paragraph 67) occurred without the company's own procedures being followed. Recommendation 10 There should be a formal, controlled procedure for hazard identification and operability analysis for modifications (including emergency modifications) that ensures that all safety issues identified at the design stage are reflected in how the modification is constructed and used. lnspection systems 136 lnspection of the flare line had not identified the section which eventually failed. There were no inspection points for measuring thickness in the corroded region downstream of the failed elbow. Consequently, the severe corrosion at the point of failure remained undetected (paragraph 122 and Annex 2), although it is recognised that the extent of the corrosion was not a cause of the release of hydrocarbon. 137 The company set minimum acceptable thicknesses (retirement thicknesses) for pipes and vessels using pressure criteria only, not taking into account other foreseeable operating conditions, such as: (a) mechanical loading due to wind pressure and pipe or vessel contents (vapour, gas, liquid, scale), self weight, cyclical loading (wind, temperature); (b) non-uniform corrosion including pitting corrosion and electrolytic corrosion especially around welds or other joins; and (c) the effects of pipe and vessel contents on internal corrosion (including chemical composition, water content, potential ingress of air, solids content, turbulence, condensation and erosion). For services having high potential failure consequences, consideration should be given to increasing retirement thicknesses to provide for unanticipated or unknown loading, undiscovered metal loss and foreseeable abuse. Recommendation 11 All safety critical parts of the plant should be included in comprehensive inspection programmes. Recommendation 12 lnspection programmes for corrosion should: err on the side of caution, with
  • 45. regard to the number and location of measurement sample points; and concentrate measurement sample points where greater (or less uniform) metal loss is foreseeable. Recommendation 13 All foreseeable operational conditions, not just pressure, should be taken into account when setting the minimum acceptable thickness for pipes and vessels. Emergency planning 138 The fires in this incident burned from Sunday 24 July 1994 until Tuesday 26 July 1994 (paragraphs 1-3),though emergency plans had not dealt with the possibility of a fire burning for longer than 24 hours. There are historical examples of fires on refineries which have lasted longer than this. The Institution of Chemical Engineers have listed 100 incidents, of which 44 involved vapour cloud explosions and 54 were in oil refineries or terminals. Although most resulting fires were extinguished within 24 hours, some burned for longer, including the fire in 1983 at a neighbouring site north of the Milford Haven waterway, which was extinguished 35 hours after ignition. The refinery fire at Shuaiba, Kuwait, in 1981 lasted nearly six days from the initial explosion, while the Philadelphia Refinery fire of August 1975 took nine days to extinguish (Loss Prevention Bulletin 099, 1991, 3-25). 139 The twin demands, over an extended period, on water supplies for fire-fighting and for cooling nearby vessels can be extreme. In this incident, water was kept continuously available by recycling some of the used fire-fighting water (with appropriate monitoring of possible flammable or toxic contaminants), and by use of infra-red detection equipment to identify which vessels should be given priority for cooling. The emergency teams involved in fighting the fires, and bringing the site safely under control without further incident, deserve enormous credit. It is nevertheless considered prudent, with the benefit of hindsight from the incident, for the question of availability of adequate water supplies to meet all eventualities to be considered afresh. Recommendation 14 Fire brigades, in consultation with appropriate major hazard installations, would be wise to look at emergency plans particularly in respect of the availability of adequate water supplies for fire-fighting and vessel cooling, to deal with the worst case scenario.
  • 46. ACTION BY THE COMPANY 140 Once the site was made safe the company immediately started to replace and repair the damaged plant. Sections of the refinery separate from PCC plant started up in a limited way at the end of September 1994. The FCCU and other damaged units of PCC were recommissioned by the end of November 1994. 141 At an early stage, as the lessons from the incident began to emerge from the investigation teams, detailed discussions between HSE and the company took place concerning measures that needed to be implemented for improved safe operation of the plant. In addition to the replacement of damaged plant, an extensive and costly programme of actions and projects was agreed, and its implementation subsequently monitored by HSE. The actions under the programme are now largely completed, although some, such as training and monitoring arrangements, are ongoing commitments. 142 The programme included: (a) A comprehensive review of relief systems, that resulted in site-wide improvements. One of the outcomes was the provision of a new, larger flare drum, with uprated instrumentation, and a new flare drum pump-out system including an additional pump with an electric driver as an alternative to the originally installed steam-driven pump. (b) The development of a training simulator capable of realistically reproducing the FCCU working conditions, in both normal and upset situations. The system, which has been demonstrated to HSE, cost the company an estimated £500 000, (c) Training on the roles and responsibilities of operators, supervisors and managers, employing situational analysis techniques to assess managers' ability to cope with upset conditions. (d) Improvements in the configuration of the control system graphical displays, and rationalisation of alarm systems to avoid operator overload. (e) Reviews of, and improvements to, procedures for identification of critical plant, preventative maintenance and inspection programmes. Some of the important outcomes of these reviews include increased inspection frequency as the retirement thickness of plants and vessels is approached, employment of a corrosion specialist, and achievement of NCSllB accreditation which was planned before the incident.
  • 47. ANNEX l:SEQUENCE OF EVENTS 1 HSE physically verified instruments and controls on the plant. The timings are approximate because there are four independent clocks referencing the four data sources: TDC (the distributed control system), radio logs, TDACS (the data logging system associated with the control system), and the critical process controller. The times on these four clocks were not the same. The selected reference time base is the one from the TDC data log. Initial disturbances 2 At about 07.20 on Sunday 24th July 1994 an electrical storm approached the Milford Haven area. There was a series of power supply interruptions between 07.49 and 08.30. During this period there was a fire on the crude distillation unit and the ensuing plant disturbances affected the vacuum distillation unit, alkylation unit, FCCU and butamer units. The alkylation and butamer units were shut down at approximately 08.00. In the period 07.47 to 08.00 the FCCU briefly lost and then regained vacuum gas oil feed and subsequently had feed reduced from 600 to 400 m3h-l. The result of these fluctuations in feed levels was an upset condition within the process that was aggravated by power supply interruptions at 08.27 and 08.29. These events, though significant in initiating a plant upset, were not such as to lead inevitably to the incident that occurred six hours later.
  • 48. FCCU recovery section process upset Deethaniser feed instability Figure 11 Approx 08.30 to 08.50 3 The plant is shown to be largely within its normal operational limits. However, because of disrupted supply to the FCCU of vacuum gas oil (its feed material), the level of liquid in the high pressure separator (02-F-310) had fallen to the point where the visible and audible alarms in the control room had been activated. 4 At 08.33 the low liquid level within the high pressure separator was noted. In order to recover the level the deethaniser feed valve (02-FV-385, marked yellow) was manually reduced to 36% of the indicated range to reduce the flow (the valve is adjusted from a computer panel in the control room). At this stage the high pressure separator level had declined to about 6% of the level indicator's range. Though the operator had closed the valve 02-FV-385 only a small amount the TDC data showed that the flow into the deethaniser subsequently fell to zero. This valve was known to be temperamental and unreliable and the effect of his intervention was actually to completely cut off the flow of liquid to the deethaniser. 5 The flow from the deethaniser to the debutaniser via valve 02-FV-404 was about 450 m3h-' at this point, consequently with no feed the deethaniser rapidly emptied and after five minutes the liquid level controller 02-LC-402 recorded zero. The level control was cascaded to the deethaniser output flow valve 02- FV-404 which closed to retain a liquid level in the deethaniser. The flow of liquid to the debutaniser was lost and as a result liquid levels in the debutaniser began to fall. 6 At 08.39 the debutaniser level controller cascaded to the debutaniser control which started to close the output valve (02-FV-436) to maintain the debutaniser liquid level. The liquid retained in the debutaniser by this action was material from the deethaniser which was relatively rich in low molecular weight hydrocarbon. At the higher temperatures of the debutaniser this material rapidly vaporised and at 08.46 the debutaniser pressure started to rise rapidly.
  • 49. 02-F-302 Deethanlzer 02-F-201 Main fractionation accumulator column Wet gas cornprauror U Key Normalflows and levels Activated alarm f Abnormalflows and levels 0 Heatexchanger Pump E% controlvalve LCN m Ftnfan cooler W-436 Flan knockout Figure 11 P 0
  • 50. Figure 12 Approx 08.50 to 09.00 7 Because the main fractionator had continued to supply liquid, the high pressure separator filled up due to valve 02-FV-385 not opening as it should have as the level recovered. At 08.52 the liquid level exceeded the maximum of the indicator's range at 100%. Pressure backed up in the system to the point where the pressure in the overhead accumulator (02-F-203) caused the pressure relief valve (02-PV-077) to open, allowing venting of the vapourlgas via the flare knock-out drum. 8 Downstream, the debutaniser level had started to fall (because the supply to the deethaniser had ceased). This caused the valve (02-FV-436), controlling the flow of liquid to the naphtha splitter (02-F-305),to close. It probably remained closed until after the explosion. Failure of valve 02-FV-436 9 At about this time the secondary overhead accumulator pressure control valve (02-PV-077) from the main fractionation column opened to 28% and vapour flowed via the knock-out drum to flare. At about 09.12 the debutaniser outlet valve 02-FV-436 was recorded, probably erroneously, as starting to open, as liquid levels in the recovery section became re-established. By 09.40 the signal sent to the valve was requesting 100% open and a flow was indicated. The naphtha splitter and overhead accumulator, continued to indicate no level in either vessel and no flow leaving the naphtha splitter. This suggests that there was no actual flow via 02-FV-436. 10 Diagnostic tests carried out on the valve positioner for 02-FV-436 concluded that the positioner may have been subject to an intermittent fault that restricted the travel of the valve. The valve plug also showed areas of abrasion. The apparent indication of flow reported on the unrelated indicator 02-FC-436 was assumed to be due to the instrument being faulty, but subsequent investigation could not reveal the cause of any fault. An explanation that is consistent with the evidence and subsequent events is that at this time 02-FV-436 had stuck closed. 11 As a result of the valve failing in the shut position the liquid flow from the debutaniser was blocked, so liquids accumulated in the debutaniser column and upstream. 12 The pressure in the debutaniser rose because of the composition of the materials it contained. These included a high proportion of lighter fractions which would normally have been extracted by the deethaniser. On this occasion they had not been extracted because the deethaniser had emptied so quickly. 13 One of the four pressure relief valves (PSV954 A-D) on the debutaniser lifted (at
  • 51. 02-F-302 02-F-211 Deethanlzer 02-F301 Main fractionation column t Key Normalflowsand levels Actwated alarm Abnormalflowsand levels 0 Heat exchanger .--1 a pump I & Control valve LCN Fin fan cooler -4 + I P I To slops Flam 19-F-102 02-F419 C- O Figure 12 P m
  • 52. around 08.53) and a mixture of gas and liquid was released to the flare knock- out drum (02-F-319). 14 The level in the flare knock-out drum rose from about 60% to around 70% within two minutes. This drum can be fed from two separate sources: the debutaniser (02-F-304) and the overhead accumulator (02-F-203). 15 The level of liquid in the naphtha splitter had fallen to zero by the end of this period. It was to remain in this state, with no action taken, for some four hours. 16 At 08.51 the reflux pumps that helped cool the debutaniser tripped (shut down automatically). The liquid level within the overhead accumulator was recorded as 30% by the TDC but this was probably erroneous. The recorded level had become static after a large amount of movement earlier in the morning. First debutaniser ,venting 17 The debutaniser was effectively blocked in at 08.53 because there was no input flow, and it is presumed valve 02-FV-404 was closed, the output valve 02-FV- 436 was almost closed, and the reflux pumps had tripped. The light feed within the debutaniser was rapidly vaporising and as a result the pressure reached 12.6 barg and the debutaniser pressure safety valves (PSVs) lifted. The resulting discharge of liquid and vapour passed via the on site flare knock-out drum to flare. 18 The control valve between the debutaniser and the naphtha splitter 02-FV-436 closed completely at 08.57. The level of liquid in the naphtha splitter was recorded as zero, and this level remained at zero until the time of the incident. 19 At 09.00 the continued flaring associated with debutaniser venting was identified and after investigation by an outside operator it was found that one of the venting PSVs had not resealed after the pressure excursion. This faulty valve was then changed over with the spare relief valve available at the top of the debutaniser. Due to the plant upset an extra operator was called in.
  • 53. Figure 13 Approx 09.00 to 09.50 20 The continuing flaring resulting from the debutaniser venting was noticed, because the flare was large and smoky. 21 The valve 02-FV-385 was opened manually to 38% to reduce the high liquid level in the high pressure separator and shortly afterwards the deethaniser liquid level was re-established, whereupon the valve (02-FV-404) from the deethaniser opened automatically. 22 Liquid continued to flow into the debutaniser but it did not continue on to the naphtha splitter. It is likely that valve 02-FV-436 remained closed. 23 The debutaniser temperature was rising again at 09.30 and a heat exchanger (the reboiler) was by-passed to attempt to reduce the temperature. By 09.37 the pressure was rising close to the PSV set pressure and in order to reduce it the operator sent what he assumed to be uncondensed vapour from the debutaniser overhead accumulator (02-F-314) to the wet gas compressor interstage drum (02-F-309), by opening the valve 02-HCV-439 manually from 0% to 25% in the belief that it would vent excess debutaniser pressure back to the wet gas compressor interstage drum. This procedure was used only rarely and the line was intended to carry uncondensed vapours back to the wet end of the drum. 24 In fact liquid as well as vapour was sent into the interstage drum, which was now filling much faster than usual as it was being fed from two sources instead of one. First, from the secondary overhead accumulator (02-F-203) for the main fractionation column as in routine operation and, second, from the overhead accumulator (02-F- 314) for the debutaniser, as a result of the upset, non-routine operation. 25 At 09.40 the hot oil flow to the debutaniser reboiler was reduced to zero, because the temperature was around 1 8 7 ' ~ ~and still rising. 26 In the next ten minutes a series of events occurred as the debutaniser temperature and pressure continued to rise. The debutaniser liquid level gauge stayed fixed at 79% of its range. The liquid level probably exceeded this, as the column flooded. The debutaniser overhead accumulator filled with liquids and vapour due to the transfer of excess material from the debutaniser. Many of the level transmitters on the plant were of a differential pressure type. The installation design was such that following high liquid levels they could be inaccurate. 27 At this point the plant was in a very upset condition and the composition of the process liquids and gases was not normal. The overheating of the debutaniser column, which contained material of greater volatility than normal, therefore resulted in the rapid evolution of both liquids and gases from the top of the column into the overhead accumulator. In effect, it 'boiled over'.
  • 54. Figure 13 8 Key Normalflows and levels M e d a l a r m Abnormalflowsand levels 0 Heat exchanger Pump Controlvalve LCN p r o d u c t m F I ~fan cooler FV -436 U
  • 55. Figure 14 Approx 09.50 to 10.25 First wet gas compressor trip 28 Liquid level in the wet gas compressor interstage drum (02-F-309) rose quickly and liquid spilled over the weir (internal wall) from the 'wet end' into the 'dry end'. This caused the wet gas compressor to trip (shutdown) automatically at 10.08. 29 This was because valve 02-HCV-439 was open and excess liquid in the overhead accumulato'r was passing back through the vapour line into the interstage drum. 30 Around 11.30 there was discussion among the operations staff about the condition of the unit. While preparations were started for removing feed from the unit, it was decided to try to restart the wet gas compressor and continue running, even though the underlying cause of the liquid filling was not known. A problem existed in that due to the loss of the pressure generated by the wet gas compressor there was insufficient pressure differential between the dry end of the interstage drum and the normal receiving vessel (02-F-203) to force the accumulated liquid out. As the pressure differential was not adequate because the compressor was not running, a system was improvised to remove the hydrocarbon liquid using steam hoses. Two steam hoses were attached to the outlet pipe at the dry end of the wet gas compressor interstage drum and connected into the flare header down stream of 02-PV-077. The liquid was then drained away to flare via 02-F-319. The compressor was eventually restarted at 12.28. Second debutaniser venting 31 At 10.01 the debutaniser was liquid-logged and the pressure exceeded the PSV set pressure again. Pressure peaked at 12.2 barg and discharge via the debutaniser PSVs continued for 16 minutes. At 10.10 the liquid level in the knock-out drum began to rise rapidly, and rose from 61% to 93% over the next 14 minutes. This corresponded to an increase in liquid volume of 44 m3, and assuming a density of 630 kgm-3 (pentane), this represented a liquid flow rate of 33 kgsec-l. This relief rate is consistent with that which could have discharged from the debutaniser PSVs.
  • 56. Key Normalflows and levels Activated alarm Abnormalflows and levels 0 Heatexchanger a Pump &1 Controlvaive Finfan cooler To slops--e& Figure 14 m 0 11111 accumulator '
  • 57. Figure 15 Approx 10.25 to 12.56 32 Between 10.25 and 12.00 there was continuous activity to drain the liquid from the wet gas compressor interstage drum dry end so that the wet gas compressor could be restarted to restore flow in the unit. 33 Liquid continued to accumulate in the flare knock-out drum (02-F-319) such that the high-high level alarm was activated at about 12.56. The alarm did not reset before the explosion. There was a klaxon local alarm at the drum, as well as the alarm in the control room but these were not noticed among the many other alarms triggered during this time. 34 At 10.45 the on-plot flare drum 02-F-319 reached the maximum liquid level, shown on the indicator as 99.5% of its range, which is approximately 33% of the total drum volume. 35 At 10.56 the valve 02-HCV-439 was closed. An instrument technician was requested to check the wet gas compressor interstage drum dry end instrumentation, and this confirmed the high liquid level in the dry end. While the wet gas compressor was off- line, feed to the recovery section remained over 230 m3h-'. 36 At 11.20 the debutaniser temperature was still high so the ICGO reboiler flow was cut off. 37 During the wet gas compressor shutdown the differential pressure between the deethaniser and debutaniser had reached equilibrium and as a result there was no pressure to drive the deethaniser feed forward. After 12.00 the wet gas compressor was restarted, restoring the differential pressure. Flow increased significantly. When the wet gas compressor was restarted it was carefully run up, with only a minor incident when a rough noise was heard on the run up and a hold for diagnostic checks was made. The dry end of the interstage drum was drained sufficiently to allow CPC control to be restored and the temporary steam hose connections which had been used for draining the dry end were broken at 12.15. Instrument checks were completed and the dry end liquid level was recorded at 41% of its range. The wet gas compressor was finally brought back on line at 12.28. Third debutaniser venting 38 Shortly after the wet gas compressor restarted, the debutaniser pressure started to rise and by 12.46 again exceeded the relief valves' set pressure. The consequent venting to flare continued until the explosion. Assuming a density of 660 kgm-3the liquid flow from the relief valves has been estimated to have peaked at ll 0 kgsec-' at 12.40 then declined to an average of 82 kgsece' between 12.46 and 13.05, then further reduced to 64 kgsec-l until 13.21.
  • 58. 39 From 12.46 the debutaniser pressure exceeded the PSV set pressure for about 40 minutes, reaching a maximum pressure of 12.8 barg. Between 12.46 and 12.56 the amount of liquid in the flare knock-out drum increased by 60.5 m3. This is equivalent to a liquid flow rate of 63.5 kgsec-' and is corresponds with the recorded rate of liquid input to the debutaniser over the same period.
  • 59. Key Normalflows and levels Activated alarm Abnormalflowsand levels Debutanizer Pump & Controlvalve m Finfan cooler Figure 15 V1 0