SlideShare a Scribd company logo
1 of 14
© 2007 Prentice Hall 17-1
Regression Analysis
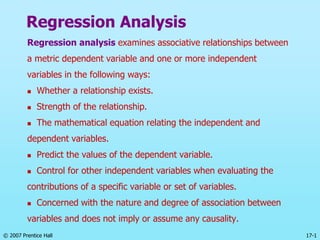
Regression analysis examines associative relationships between
a metric dependent variable and one or more independent
variables in the following ways:
 Whether a relationship exists.
 Strength of the relationship.
 The mathematical equation relating the independent and
dependent variables.
 Predict the values of the dependent variable.
 Control for other independent variables when evaluating the
contributions of a specific variable or set of variables.
 Concerned with the nature and degree of association between
variables and does not imply or assume any causality.
© 2007 Prentice Hall 17-2
Statistics Associated with Multiple
Regression
 Adjusted R2. R2, coefficient of multiple determination,
is adjusted for the number of independent variables and
the sample size to account for the diminishing returns.
 Coefficient of multiple determination. The strength
of association in multiple regression is measured by the
square of the multiple correlation coefficient, R2 .
 F test. The F test is used to test the null hypothesis that
the coefficient of multiple determination in the
population, R2
pop, is zero.
© 2007 Prentice Hall 17-3
 A residual is the difference between the observed
value of Yi and the value predicted by the regression
equation i.
 Scattergrams of the residuals, in which the residuals
are plotted against the predicted values, i, time, or
predictor variables, provide useful insights in
examining the appropriateness of the underlying
assumptions and regression model fit.
 The assumption of a normally distributed error term
can be examined by constructing a histogram of the
residuals.
 The assumption of constant variance of the error
term can be examined by plotting the residuals
against the predicted values of the dependent
variable, i.
Conducting Multiple Regression Analysis
Examination of Residuals
Y
Y
Y
© 2007 Prentice Hall 17-4
 A plot of residuals against time, or the sequence of
observations, will throw some light on the assumption
that the error terms are uncorrelated.
 Plotting the residuals against the independent variables
provides evidence of the appropriateness or
inappropriateness of using a linear model. Again, the
plot should result in a random pattern.
 To examine whether any additional variables should be
included in the regression equation, one could run a
regression of the residuals on the proposed variables.
 If an examination of the residuals indicates that the
assumptions underlying linear regression are not met,
the researcher can transform the variables in an attempt
to satisfy the assumptions.
Conducting Multiple Regression Analysis
Examination of Residuals
© 2007 Prentice Hall 17-5
Residual Plot Indicating that
Variance Is Not Constant
Fig. 17.7
Predicted Y Values
Residuals
© 2007 Prentice Hall 17-6
Residual Plot Indicating a Linear
Relationship Between Residuals and Time
Fig. 17.8
Time
Residuals
© 2007 Prentice Hall 17-7
Plot of Residuals Indicating that
a Fitted Model Is Appropriate
Fig. 17.9
Predicted Y Values
Residuals
© 2007 Prentice Hall 17-8
Stepwise Regression
The purpose of stepwise regression is to select, from a large
number of predictor variables, a small subset of variables that
account for most of the variation in the dependent or criterion
variable. In this procedure, the predictor variables enter or are
removed from the regression equation one at a time. There are
several approaches to stepwise regression.
 Forward inclusion.
 Backward elimination.
© 2007 Prentice Hall 17-9
Multicollinearity
 Multicollinearity arises when intercorrelations among
the predictors are very high.
 Multicollinearity can result in several problems,
including:
 The partial regression coefficients may not be
estimated precisely. The standard errors are likely
to be high.
 The magnitudes as well as the signs of the partial
regression coefficients may change from sample to
sample.
 It becomes difficult to assess the relative importance
of the independent variables in explaining the
variation in the dependent variable.
 Predictor variables may be incorrectly included or
removed in stepwise regression.
© 2007 Prentice Hall 17-10
 A simple procedure for adjusting for multicollinearity
consists of using only one of the variables in a highly
correlated set of variables.
 Alternatively, the set of independent variables can be
transformed into a new set of predictors that are
mutually independent by using techniques such as
principal components analysis.
 More specialized techniques, such as ridge regression
and latent root regression, can also be used.
Multicollinearity
© 2007 Prentice Hall 17-11
Relative Importance of Predictors
Unfortunately, because the predictors are correlated,
there is no unambiguous measure of relative
importance of the predictors in regression analysis.
However, several approaches are commonly used to
assess the relative importance of predictor variables.
 Usefulness Analysis
 Dominance Analysis
© 2007 Prentice Hall 17-12
Cross-Validation
 The regression model is estimated using the entire data set.
 The available data are split into two parts, the estimation sample
and the validation sample. The estimation sample generally
contains 50-90% of the total sample.
 The estimated model is applied to the data in the validation
sample to predict the values of the dependent variable, i, for the
observations in the validation sample.
Hypothesized Model
© 2007 Prentice Hall 17-13
PEP
POS
OID
TOI
RFC
Hypotheses
H1: PEP has positive association with OID
H2: POS has positive association with OID
H3: OID has negative association with TOI
H4: OID has positive association with RFC
© 2007 Prentice Hall 17-14
More Related Content

Similar to regression.ppt

Introduction-to-Linear-Regression.pptx
Introduction-to-Linear-Regression.pptxIntroduction-to-Linear-Regression.pptx
Introduction-to-Linear-Regression.pptxengdlshadfm
 
ders 8 Quantile-Regression.ppt
ders 8 Quantile-Regression.pptders 8 Quantile-Regression.ppt
ders 8 Quantile-Regression.pptErgin Akalpler
 
Overview of Multivariate Statistical Methods
Overview of Multivariate Statistical MethodsOverview of Multivariate Statistical Methods
Overview of Multivariate Statistical MethodsThomasUttaro1
 
Dependence Techniques
Dependence Techniques Dependence Techniques
Dependence Techniques Hasnain Khan
 
Data Science - Part IV - Regression Analysis & ANOVA
Data Science - Part IV - Regression Analysis & ANOVAData Science - Part IV - Regression Analysis & ANOVA
Data Science - Part IV - Regression Analysis & ANOVADerek Kane
 
CFA II Quantitative Analysis
CFA II Quantitative AnalysisCFA II Quantitative Analysis
CFA II Quantitative AnalysisPristine Careers
 
Multiple regression by anagha singh
Multiple regression by anagha singhMultiple regression by anagha singh
Multiple regression by anagha singhAnaghaSingh
 
Stats ca report_18180485
Stats ca report_18180485Stats ca report_18180485
Stats ca report_18180485sarthakkhare3
 
What are the similarities and differences between simple linear regr.pdf
What are the similarities and differences between simple linear regr.pdfWhat are the similarities and differences between simple linear regr.pdf
What are the similarities and differences between simple linear regr.pdfneetuarya13
 
Introduction-to-Non-Linear-Regression.pptx
Introduction-to-Non-Linear-Regression.pptxIntroduction-to-Non-Linear-Regression.pptx
Introduction-to-Non-Linear-Regression.pptxShriramKargaonkar
 
Correlation research
Correlation researchCorrelation research
Correlation researchAmina Tariq
 
Multinomial logisticregression basicrelationships
Multinomial logisticregression basicrelationshipsMultinomial logisticregression basicrelationships
Multinomial logisticregression basicrelationshipsAnirudha si
 
Asset Relationship - CH 8 - Regression | CMT Level 3 | Chartered Market Techn...
Asset Relationship - CH 8 - Regression | CMT Level 3 | Chartered Market Techn...Asset Relationship - CH 8 - Regression | CMT Level 3 | Chartered Market Techn...
Asset Relationship - CH 8 - Regression | CMT Level 3 | Chartered Market Techn...Professional Training Academy
 
Correlational research
Correlational researchCorrelational research
Correlational researchJijo G John
 
Simple regressionand correlation (2).pdf
Simple regressionand correlation (2).pdfSimple regressionand correlation (2).pdf
Simple regressionand correlation (2).pdfyadavrahulrahul799
 

Similar to regression.ppt (20)

Introduction-to-Linear-Regression.pptx
Introduction-to-Linear-Regression.pptxIntroduction-to-Linear-Regression.pptx
Introduction-to-Linear-Regression.pptx
 
ders 8 Quantile-Regression.ppt
ders 8 Quantile-Regression.pptders 8 Quantile-Regression.ppt
ders 8 Quantile-Regression.ppt
 
Data-Analysis.pptx
Data-Analysis.pptxData-Analysis.pptx
Data-Analysis.pptx
 
Overview of Multivariate Statistical Methods
Overview of Multivariate Statistical MethodsOverview of Multivariate Statistical Methods
Overview of Multivariate Statistical Methods
 
Dependence Techniques
Dependence Techniques Dependence Techniques
Dependence Techniques
 
Data Science - Part IV - Regression Analysis & ANOVA
Data Science - Part IV - Regression Analysis & ANOVAData Science - Part IV - Regression Analysis & ANOVA
Data Science - Part IV - Regression Analysis & ANOVA
 
CFA II Quantitative Analysis
CFA II Quantitative AnalysisCFA II Quantitative Analysis
CFA II Quantitative Analysis
 
Multiple regression by anagha singh
Multiple regression by anagha singhMultiple regression by anagha singh
Multiple regression by anagha singh
 
Stats ca report_18180485
Stats ca report_18180485Stats ca report_18180485
Stats ca report_18180485
 
What are the similarities and differences between simple linear regr.pdf
What are the similarities and differences between simple linear regr.pdfWhat are the similarities and differences between simple linear regr.pdf
What are the similarities and differences between simple linear regr.pdf
 
Introduction-to-Non-Linear-Regression.pptx
Introduction-to-Non-Linear-Regression.pptxIntroduction-to-Non-Linear-Regression.pptx
Introduction-to-Non-Linear-Regression.pptx
 
Correlation research
Correlation researchCorrelation research
Correlation research
 
Linear regression
Linear regressionLinear regression
Linear regression
 
Multinomial logisticregression basicrelationships
Multinomial logisticregression basicrelationshipsMultinomial logisticregression basicrelationships
Multinomial logisticregression basicrelationships
 
Asset Relationship - CH 8 - Regression | CMT Level 3 | Chartered Market Techn...
Asset Relationship - CH 8 - Regression | CMT Level 3 | Chartered Market Techn...Asset Relationship - CH 8 - Regression | CMT Level 3 | Chartered Market Techn...
Asset Relationship - CH 8 - Regression | CMT Level 3 | Chartered Market Techn...
 
Regression
RegressionRegression
Regression
 
Chapter 10
Chapter 10Chapter 10
Chapter 10
 
Chapter 10
Chapter 10Chapter 10
Chapter 10
 
Correlational research
Correlational researchCorrelational research
Correlational research
 
Simple regressionand correlation (2).pdf
Simple regressionand correlation (2).pdfSimple regressionand correlation (2).pdf
Simple regressionand correlation (2).pdf
 

More from syedmirsyed

constitutional framework of Pakistan and its description
constitutional framework of Pakistan and its descriptionconstitutional framework of Pakistan and its description
constitutional framework of Pakistan and its descriptionsyedmirsyed
 
Economic system of Pakistan.pptx
Economic system of Pakistan.pptxEconomic system of Pakistan.pptx
Economic system of Pakistan.pptxsyedmirsyed
 
Ethnicity in Pakistan 2.pptx
Ethnicity in Pakistan 2.pptxEthnicity in Pakistan 2.pptx
Ethnicity in Pakistan 2.pptxsyedmirsyed
 
Indus Valley Civilization.pptx
Indus Valley Civilization.pptxIndus Valley Civilization.pptx
Indus Valley Civilization.pptxsyedmirsyed
 
Economic system of Pakistan.pptx
Economic system of Pakistan.pptxEconomic system of Pakistan.pptx
Economic system of Pakistan.pptxsyedmirsyed
 
MAJOR POLITICAL DEVELOPMENTS -1947-1958.pptx
MAJOR POLITICAL DEVELOPMENTS -1947-1958.pptxMAJOR POLITICAL DEVELOPMENTS -1947-1958.pptx
MAJOR POLITICAL DEVELOPMENTS -1947-1958.pptxsyedmirsyed
 
content analysis.ppt
content analysis.pptcontent analysis.ppt
content analysis.pptsyedmirsyed
 
Guidance & Counseling.pptx
Guidance & Counseling.pptxGuidance & Counseling.pptx
Guidance & Counseling.pptxsyedmirsyed
 
MAJOR POLITICAL DEVELOPMENTS 1857-1947.pptx
MAJOR POLITICAL DEVELOPMENTS 1857-1947.pptxMAJOR POLITICAL DEVELOPMENTS 1857-1947.pptx
MAJOR POLITICAL DEVELOPMENTS 1857-1947.pptxsyedmirsyed
 
Evolution and Growth of Muslim in sub continent .pptx
Evolution and Growth of Muslim in sub continent .pptxEvolution and Growth of Muslim in sub continent .pptx
Evolution and Growth of Muslim in sub continent .pptxsyedmirsyed
 
7_Elements_of_Culture.ppt
7_Elements_of_Culture.ppt7_Elements_of_Culture.ppt
7_Elements_of_Culture.pptsyedmirsyed
 
Pakistani-culture.pptx
Pakistani-culture.pptxPakistani-culture.pptx
Pakistani-culture.pptxsyedmirsyed
 
Behavioral Learning Theory.ppt
Behavioral Learning Theory.pptBehavioral Learning Theory.ppt
Behavioral Learning Theory.pptsyedmirsyed
 
Social Institutions -2.pptx
Social Institutions -2.pptxSocial Institutions -2.pptx
Social Institutions -2.pptxsyedmirsyed
 
Learning- Behavioral Views of Learning.ppt
Learning- Behavioral Views of Learning.pptLearning- Behavioral Views of Learning.ppt
Learning- Behavioral Views of Learning.pptsyedmirsyed
 
Intelligence.ppt
Intelligence.pptIntelligence.ppt
Intelligence.pptsyedmirsyed
 
phenomenology.ppt
phenomenology.pptphenomenology.ppt
phenomenology.pptsyedmirsyed
 
Water resources pptx
Water resources pptxWater resources pptx
Water resources pptxsyedmirsyed
 

More from syedmirsyed (19)

constitutional framework of Pakistan and its description
constitutional framework of Pakistan and its descriptionconstitutional framework of Pakistan and its description
constitutional framework of Pakistan and its description
 
Economic system of Pakistan.pptx
Economic system of Pakistan.pptxEconomic system of Pakistan.pptx
Economic system of Pakistan.pptx
 
Ethnicity in Pakistan 2.pptx
Ethnicity in Pakistan 2.pptxEthnicity in Pakistan 2.pptx
Ethnicity in Pakistan 2.pptx
 
Indus Valley Civilization.pptx
Indus Valley Civilization.pptxIndus Valley Civilization.pptx
Indus Valley Civilization.pptx
 
Economic system of Pakistan.pptx
Economic system of Pakistan.pptxEconomic system of Pakistan.pptx
Economic system of Pakistan.pptx
 
MAJOR POLITICAL DEVELOPMENTS -1947-1958.pptx
MAJOR POLITICAL DEVELOPMENTS -1947-1958.pptxMAJOR POLITICAL DEVELOPMENTS -1947-1958.pptx
MAJOR POLITICAL DEVELOPMENTS -1947-1958.pptx
 
content analysis.ppt
content analysis.pptcontent analysis.ppt
content analysis.ppt
 
Guidance & Counseling.pptx
Guidance & Counseling.pptxGuidance & Counseling.pptx
Guidance & Counseling.pptx
 
MAJOR POLITICAL DEVELOPMENTS 1857-1947.pptx
MAJOR POLITICAL DEVELOPMENTS 1857-1947.pptxMAJOR POLITICAL DEVELOPMENTS 1857-1947.pptx
MAJOR POLITICAL DEVELOPMENTS 1857-1947.pptx
 
Evolution and Growth of Muslim in sub continent .pptx
Evolution and Growth of Muslim in sub continent .pptxEvolution and Growth of Muslim in sub continent .pptx
Evolution and Growth of Muslim in sub continent .pptx
 
7_Elements_of_Culture.ppt
7_Elements_of_Culture.ppt7_Elements_of_Culture.ppt
7_Elements_of_Culture.ppt
 
Pakistani-culture.pptx
Pakistani-culture.pptxPakistani-culture.pptx
Pakistani-culture.pptx
 
Behavioral Learning Theory.ppt
Behavioral Learning Theory.pptBehavioral Learning Theory.ppt
Behavioral Learning Theory.ppt
 
Social Institutions -2.pptx
Social Institutions -2.pptxSocial Institutions -2.pptx
Social Institutions -2.pptx
 
Gen Issues.ppt
Gen Issues.pptGen Issues.ppt
Gen Issues.ppt
 
Learning- Behavioral Views of Learning.ppt
Learning- Behavioral Views of Learning.pptLearning- Behavioral Views of Learning.ppt
Learning- Behavioral Views of Learning.ppt
 
Intelligence.ppt
Intelligence.pptIntelligence.ppt
Intelligence.ppt
 
phenomenology.ppt
phenomenology.pptphenomenology.ppt
phenomenology.ppt
 
Water resources pptx
Water resources pptxWater resources pptx
Water resources pptx
 

Recently uploaded

Analytical Profile of Coleus Forskohlii | Forskolin .pdf
Analytical Profile of Coleus Forskohlii | Forskolin .pdfAnalytical Profile of Coleus Forskohlii | Forskolin .pdf
Analytical Profile of Coleus Forskohlii | Forskolin .pdfSwapnil Therkar
 
Artificial Intelligence In Microbiology by Dr. Prince C P
Artificial Intelligence In Microbiology by Dr. Prince C PArtificial Intelligence In Microbiology by Dr. Prince C P
Artificial Intelligence In Microbiology by Dr. Prince C PPRINCE C P
 
Grafana in space: Monitoring Japan's SLIM moon lander in real time
Grafana in space: Monitoring Japan's SLIM moon lander  in real timeGrafana in space: Monitoring Japan's SLIM moon lander  in real time
Grafana in space: Monitoring Japan's SLIM moon lander in real timeSatoshi NAKAHIRA
 
Recombinant DNA technology( Transgenic plant and animal)
Recombinant DNA technology( Transgenic plant and animal)Recombinant DNA technology( Transgenic plant and animal)
Recombinant DNA technology( Transgenic plant and animal)DHURKADEVIBASKAR
 
Pests of soyabean_Binomics_IdentificationDr.UPR.pdf
Pests of soyabean_Binomics_IdentificationDr.UPR.pdfPests of soyabean_Binomics_IdentificationDr.UPR.pdf
Pests of soyabean_Binomics_IdentificationDr.UPR.pdfPirithiRaju
 
THE ROLE OF PHARMACOGNOSY IN TRADITIONAL AND MODERN SYSTEM OF MEDICINE.pptx
THE ROLE OF PHARMACOGNOSY IN TRADITIONAL AND MODERN SYSTEM OF MEDICINE.pptxTHE ROLE OF PHARMACOGNOSY IN TRADITIONAL AND MODERN SYSTEM OF MEDICINE.pptx
THE ROLE OF PHARMACOGNOSY IN TRADITIONAL AND MODERN SYSTEM OF MEDICINE.pptxNandakishor Bhaurao Deshmukh
 
Call Girls In Nihal Vihar Delhi ❤️8860477959 Looking Escorts In 24/7 Delhi NCR
Call Girls In Nihal Vihar Delhi ❤️8860477959 Looking Escorts In 24/7 Delhi NCRCall Girls In Nihal Vihar Delhi ❤️8860477959 Looking Escorts In 24/7 Delhi NCR
Call Girls In Nihal Vihar Delhi ❤️8860477959 Looking Escorts In 24/7 Delhi NCRlizamodels9
 
Pests of jatropha_Bionomics_identification_Dr.UPR.pdf
Pests of jatropha_Bionomics_identification_Dr.UPR.pdfPests of jatropha_Bionomics_identification_Dr.UPR.pdf
Pests of jatropha_Bionomics_identification_Dr.UPR.pdfPirithiRaju
 
Neurodevelopmental disorders according to the dsm 5 tr
Neurodevelopmental disorders according to the dsm 5 trNeurodevelopmental disorders according to the dsm 5 tr
Neurodevelopmental disorders according to the dsm 5 trssuser06f238
 
GenBio2 - Lesson 1 - Introduction to Genetics.pptx
GenBio2 - Lesson 1 - Introduction to Genetics.pptxGenBio2 - Lesson 1 - Introduction to Genetics.pptx
GenBio2 - Lesson 1 - Introduction to Genetics.pptxBerniceCayabyab1
 
Analytical Profile of Coleus Forskohlii | Forskolin .pptx
Analytical Profile of Coleus Forskohlii | Forskolin .pptxAnalytical Profile of Coleus Forskohlii | Forskolin .pptx
Analytical Profile of Coleus Forskohlii | Forskolin .pptxSwapnil Therkar
 
Twin's paradox experiment is a meassurement of the extra dimensions.pptx
Twin's paradox experiment is a meassurement of the extra dimensions.pptxTwin's paradox experiment is a meassurement of the extra dimensions.pptx
Twin's paradox experiment is a meassurement of the extra dimensions.pptxEran Akiva Sinbar
 
Bentham & Hooker's Classification. along with the merits and demerits of the ...
Bentham & Hooker's Classification. along with the merits and demerits of the ...Bentham & Hooker's Classification. along with the merits and demerits of the ...
Bentham & Hooker's Classification. along with the merits and demerits of the ...Nistarini College, Purulia (W.B) India
 
zoogeography of pakistan.pptx fauna of Pakistan
zoogeography of pakistan.pptx fauna of Pakistanzoogeography of pakistan.pptx fauna of Pakistan
zoogeography of pakistan.pptx fauna of Pakistanzohaibmir069
 
Call Girls in Mayapuri Delhi 💯Call Us 🔝9953322196🔝 💯Escort.
Call Girls in Mayapuri Delhi 💯Call Us 🔝9953322196🔝 💯Escort.Call Girls in Mayapuri Delhi 💯Call Us 🔝9953322196🔝 💯Escort.
Call Girls in Mayapuri Delhi 💯Call Us 🔝9953322196🔝 💯Escort.aasikanpl
 
Forest laws, Indian forest laws, why they are important
Forest laws, Indian forest laws, why they are importantForest laws, Indian forest laws, why they are important
Forest laws, Indian forest laws, why they are importantadityabhardwaj282
 
RESPIRATORY ADAPTATIONS TO HYPOXIA IN HUMNAS.pptx
RESPIRATORY ADAPTATIONS TO HYPOXIA IN HUMNAS.pptxRESPIRATORY ADAPTATIONS TO HYPOXIA IN HUMNAS.pptx
RESPIRATORY ADAPTATIONS TO HYPOXIA IN HUMNAS.pptxFarihaAbdulRasheed
 
Call Girls in Munirka Delhi 💯Call Us 🔝8264348440🔝
Call Girls in Munirka Delhi 💯Call Us 🔝8264348440🔝Call Girls in Munirka Delhi 💯Call Us 🔝8264348440🔝
Call Girls in Munirka Delhi 💯Call Us 🔝8264348440🔝soniya singh
 
‏‏VIRUS - 123455555555555555555555555555555555555555
‏‏VIRUS -  123455555555555555555555555555555555555555‏‏VIRUS -  123455555555555555555555555555555555555555
‏‏VIRUS - 123455555555555555555555555555555555555555kikilily0909
 

Recently uploaded (20)

Analytical Profile of Coleus Forskohlii | Forskolin .pdf
Analytical Profile of Coleus Forskohlii | Forskolin .pdfAnalytical Profile of Coleus Forskohlii | Forskolin .pdf
Analytical Profile of Coleus Forskohlii | Forskolin .pdf
 
Artificial Intelligence In Microbiology by Dr. Prince C P
Artificial Intelligence In Microbiology by Dr. Prince C PArtificial Intelligence In Microbiology by Dr. Prince C P
Artificial Intelligence In Microbiology by Dr. Prince C P
 
Grafana in space: Monitoring Japan's SLIM moon lander in real time
Grafana in space: Monitoring Japan's SLIM moon lander  in real timeGrafana in space: Monitoring Japan's SLIM moon lander  in real time
Grafana in space: Monitoring Japan's SLIM moon lander in real time
 
Recombinant DNA technology( Transgenic plant and animal)
Recombinant DNA technology( Transgenic plant and animal)Recombinant DNA technology( Transgenic plant and animal)
Recombinant DNA technology( Transgenic plant and animal)
 
Volatile Oils Pharmacognosy And Phytochemistry -I
Volatile Oils Pharmacognosy And Phytochemistry -IVolatile Oils Pharmacognosy And Phytochemistry -I
Volatile Oils Pharmacognosy And Phytochemistry -I
 
Pests of soyabean_Binomics_IdentificationDr.UPR.pdf
Pests of soyabean_Binomics_IdentificationDr.UPR.pdfPests of soyabean_Binomics_IdentificationDr.UPR.pdf
Pests of soyabean_Binomics_IdentificationDr.UPR.pdf
 
THE ROLE OF PHARMACOGNOSY IN TRADITIONAL AND MODERN SYSTEM OF MEDICINE.pptx
THE ROLE OF PHARMACOGNOSY IN TRADITIONAL AND MODERN SYSTEM OF MEDICINE.pptxTHE ROLE OF PHARMACOGNOSY IN TRADITIONAL AND MODERN SYSTEM OF MEDICINE.pptx
THE ROLE OF PHARMACOGNOSY IN TRADITIONAL AND MODERN SYSTEM OF MEDICINE.pptx
 
Call Girls In Nihal Vihar Delhi ❤️8860477959 Looking Escorts In 24/7 Delhi NCR
Call Girls In Nihal Vihar Delhi ❤️8860477959 Looking Escorts In 24/7 Delhi NCRCall Girls In Nihal Vihar Delhi ❤️8860477959 Looking Escorts In 24/7 Delhi NCR
Call Girls In Nihal Vihar Delhi ❤️8860477959 Looking Escorts In 24/7 Delhi NCR
 
Pests of jatropha_Bionomics_identification_Dr.UPR.pdf
Pests of jatropha_Bionomics_identification_Dr.UPR.pdfPests of jatropha_Bionomics_identification_Dr.UPR.pdf
Pests of jatropha_Bionomics_identification_Dr.UPR.pdf
 
Neurodevelopmental disorders according to the dsm 5 tr
Neurodevelopmental disorders according to the dsm 5 trNeurodevelopmental disorders according to the dsm 5 tr
Neurodevelopmental disorders according to the dsm 5 tr
 
GenBio2 - Lesson 1 - Introduction to Genetics.pptx
GenBio2 - Lesson 1 - Introduction to Genetics.pptxGenBio2 - Lesson 1 - Introduction to Genetics.pptx
GenBio2 - Lesson 1 - Introduction to Genetics.pptx
 
Analytical Profile of Coleus Forskohlii | Forskolin .pptx
Analytical Profile of Coleus Forskohlii | Forskolin .pptxAnalytical Profile of Coleus Forskohlii | Forskolin .pptx
Analytical Profile of Coleus Forskohlii | Forskolin .pptx
 
Twin's paradox experiment is a meassurement of the extra dimensions.pptx
Twin's paradox experiment is a meassurement of the extra dimensions.pptxTwin's paradox experiment is a meassurement of the extra dimensions.pptx
Twin's paradox experiment is a meassurement of the extra dimensions.pptx
 
Bentham & Hooker's Classification. along with the merits and demerits of the ...
Bentham & Hooker's Classification. along with the merits and demerits of the ...Bentham & Hooker's Classification. along with the merits and demerits of the ...
Bentham & Hooker's Classification. along with the merits and demerits of the ...
 
zoogeography of pakistan.pptx fauna of Pakistan
zoogeography of pakistan.pptx fauna of Pakistanzoogeography of pakistan.pptx fauna of Pakistan
zoogeography of pakistan.pptx fauna of Pakistan
 
Call Girls in Mayapuri Delhi 💯Call Us 🔝9953322196🔝 💯Escort.
Call Girls in Mayapuri Delhi 💯Call Us 🔝9953322196🔝 💯Escort.Call Girls in Mayapuri Delhi 💯Call Us 🔝9953322196🔝 💯Escort.
Call Girls in Mayapuri Delhi 💯Call Us 🔝9953322196🔝 💯Escort.
 
Forest laws, Indian forest laws, why they are important
Forest laws, Indian forest laws, why they are importantForest laws, Indian forest laws, why they are important
Forest laws, Indian forest laws, why they are important
 
RESPIRATORY ADAPTATIONS TO HYPOXIA IN HUMNAS.pptx
RESPIRATORY ADAPTATIONS TO HYPOXIA IN HUMNAS.pptxRESPIRATORY ADAPTATIONS TO HYPOXIA IN HUMNAS.pptx
RESPIRATORY ADAPTATIONS TO HYPOXIA IN HUMNAS.pptx
 
Call Girls in Munirka Delhi 💯Call Us 🔝8264348440🔝
Call Girls in Munirka Delhi 💯Call Us 🔝8264348440🔝Call Girls in Munirka Delhi 💯Call Us 🔝8264348440🔝
Call Girls in Munirka Delhi 💯Call Us 🔝8264348440🔝
 
‏‏VIRUS - 123455555555555555555555555555555555555555
‏‏VIRUS -  123455555555555555555555555555555555555555‏‏VIRUS -  123455555555555555555555555555555555555555
‏‏VIRUS - 123455555555555555555555555555555555555555
 

regression.ppt

  • 1. © 2007 Prentice Hall 17-1 Regression Analysis Regression analysis examines associative relationships between a metric dependent variable and one or more independent variables in the following ways:  Whether a relationship exists.  Strength of the relationship.  The mathematical equation relating the independent and dependent variables.  Predict the values of the dependent variable.  Control for other independent variables when evaluating the contributions of a specific variable or set of variables.  Concerned with the nature and degree of association between variables and does not imply or assume any causality.
  • 2. © 2007 Prentice Hall 17-2 Statistics Associated with Multiple Regression  Adjusted R2. R2, coefficient of multiple determination, is adjusted for the number of independent variables and the sample size to account for the diminishing returns.  Coefficient of multiple determination. The strength of association in multiple regression is measured by the square of the multiple correlation coefficient, R2 .  F test. The F test is used to test the null hypothesis that the coefficient of multiple determination in the population, R2 pop, is zero.
  • 3. © 2007 Prentice Hall 17-3  A residual is the difference between the observed value of Yi and the value predicted by the regression equation i.  Scattergrams of the residuals, in which the residuals are plotted against the predicted values, i, time, or predictor variables, provide useful insights in examining the appropriateness of the underlying assumptions and regression model fit.  The assumption of a normally distributed error term can be examined by constructing a histogram of the residuals.  The assumption of constant variance of the error term can be examined by plotting the residuals against the predicted values of the dependent variable, i. Conducting Multiple Regression Analysis Examination of Residuals Y Y Y
  • 4. © 2007 Prentice Hall 17-4  A plot of residuals against time, or the sequence of observations, will throw some light on the assumption that the error terms are uncorrelated.  Plotting the residuals against the independent variables provides evidence of the appropriateness or inappropriateness of using a linear model. Again, the plot should result in a random pattern.  To examine whether any additional variables should be included in the regression equation, one could run a regression of the residuals on the proposed variables.  If an examination of the residuals indicates that the assumptions underlying linear regression are not met, the researcher can transform the variables in an attempt to satisfy the assumptions. Conducting Multiple Regression Analysis Examination of Residuals
  • 5. © 2007 Prentice Hall 17-5 Residual Plot Indicating that Variance Is Not Constant Fig. 17.7 Predicted Y Values Residuals
  • 6. © 2007 Prentice Hall 17-6 Residual Plot Indicating a Linear Relationship Between Residuals and Time Fig. 17.8 Time Residuals
  • 7. © 2007 Prentice Hall 17-7 Plot of Residuals Indicating that a Fitted Model Is Appropriate Fig. 17.9 Predicted Y Values Residuals
  • 8. © 2007 Prentice Hall 17-8 Stepwise Regression The purpose of stepwise regression is to select, from a large number of predictor variables, a small subset of variables that account for most of the variation in the dependent or criterion variable. In this procedure, the predictor variables enter or are removed from the regression equation one at a time. There are several approaches to stepwise regression.  Forward inclusion.  Backward elimination.
  • 9. © 2007 Prentice Hall 17-9 Multicollinearity  Multicollinearity arises when intercorrelations among the predictors are very high.  Multicollinearity can result in several problems, including:  The partial regression coefficients may not be estimated precisely. The standard errors are likely to be high.  The magnitudes as well as the signs of the partial regression coefficients may change from sample to sample.  It becomes difficult to assess the relative importance of the independent variables in explaining the variation in the dependent variable.  Predictor variables may be incorrectly included or removed in stepwise regression.
  • 10. © 2007 Prentice Hall 17-10  A simple procedure for adjusting for multicollinearity consists of using only one of the variables in a highly correlated set of variables.  Alternatively, the set of independent variables can be transformed into a new set of predictors that are mutually independent by using techniques such as principal components analysis.  More specialized techniques, such as ridge regression and latent root regression, can also be used. Multicollinearity
  • 11. © 2007 Prentice Hall 17-11 Relative Importance of Predictors Unfortunately, because the predictors are correlated, there is no unambiguous measure of relative importance of the predictors in regression analysis. However, several approaches are commonly used to assess the relative importance of predictor variables.  Usefulness Analysis  Dominance Analysis
  • 12. © 2007 Prentice Hall 17-12 Cross-Validation  The regression model is estimated using the entire data set.  The available data are split into two parts, the estimation sample and the validation sample. The estimation sample generally contains 50-90% of the total sample.  The estimated model is applied to the data in the validation sample to predict the values of the dependent variable, i, for the observations in the validation sample.
  • 13. Hypothesized Model © 2007 Prentice Hall 17-13 PEP POS OID TOI RFC
  • 14. Hypotheses H1: PEP has positive association with OID H2: POS has positive association with OID H3: OID has negative association with TOI H4: OID has positive association with RFC © 2007 Prentice Hall 17-14