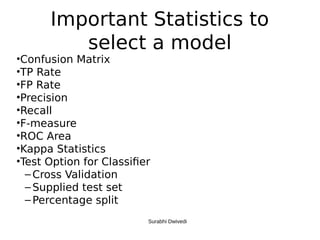
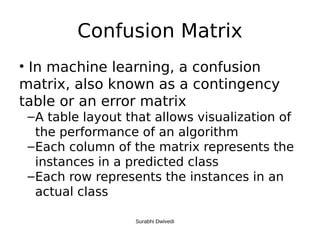
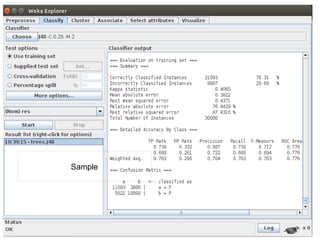
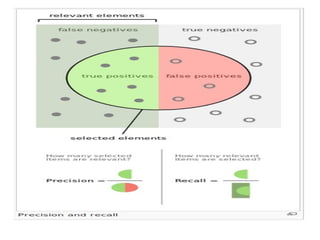
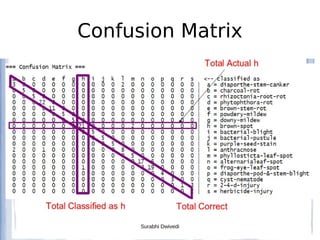
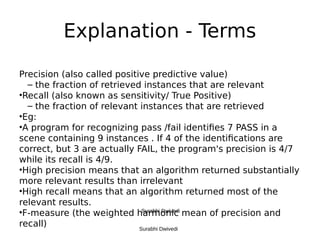
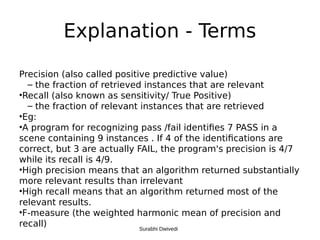
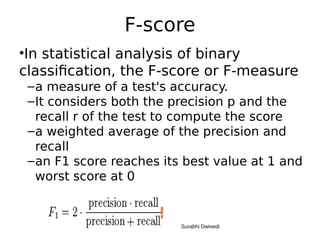
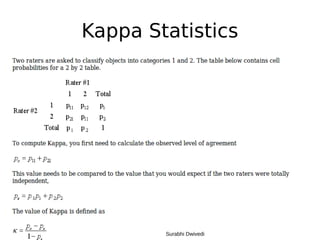
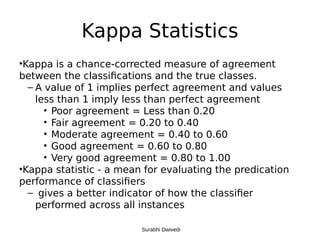
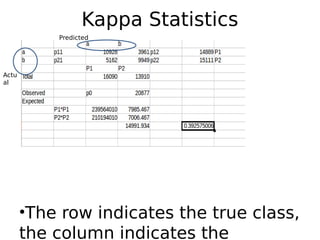
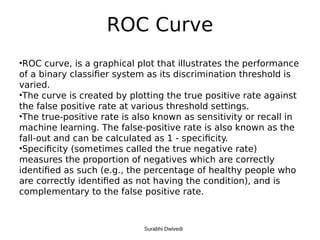
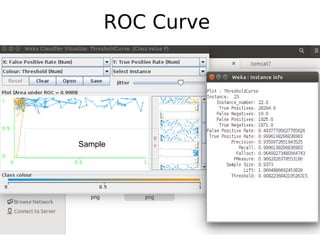
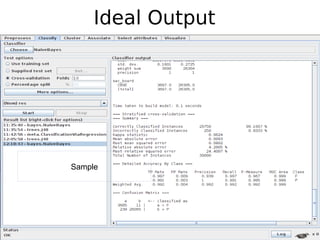
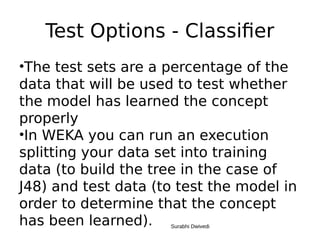
Statistical terms for
Classification in weka
Surabhi Dwivedi
Important Statistics to
select a model
•Confusion Matrix
•TP Rate
•FP Rate
•Precision
•Recall
•F-measure
•ROC Area
•Kappa Statistics
•Test Option for Classifier
– Cross Validation
– Supplied test set
– Percentage split
Surabhi Dwivedi
Confusion Matrix
• In machine learning, a confusion
matrix, also known as a contingency
table or an error matrix
–A table layout that allows visualization of
the performance of an algorithm
–Each column of the matrix represents the
instances in a predicted class
–Each row represents the instances in an
actual class
Surabhi Dwivedi
Confusion Matrix
Surabhi Dwivedi
Sample
Confusion Matrix
Surabhi Dwivedi
Explanation - Terms
Precision (also called positive predictive value)
– the fraction of retrieved instances that are relevant
•Recall (also known as sensitivity/ True Positive)
– the fraction of relevant instances that are retrieved
•Eg:
•A program for recognizing pass /fail identifies 7 PASS in a
scene containing 9 instances . If 4 of the identifications are
correct, but 3 are actually FAIL, the program's precision is 4/7
while its recall is 4/9.
•High precision means that an algorithm returned substantially
more relevant results than irrelevant
•High recall means that an algorithm returned most of the
relevant results.
•F-measure (the weighted harmonic mean of precision and
recall) Surabhi Dwivedi
F-score
•In statistical analysis of binary
classification, the F-score or F-measure
–a measure of a test's accuracy.
–It considers both the precision p and the
recall r of the test to compute the score
–a weighted average of the precision and
recall
–an F1 score reaches its best value at 1 and
worst score at 0
Surabhi Dwivedi
Kappa Statistics
Surabhi Dwivedi
Kappa Statistics
•Kappa is a chance-corrected measure of agreement
between the classifications and the true classes.
– A value of 1 implies perfect agreement and values
less than 1 imply less than perfect agreement
• Poor agreement = Less than 0.20
• Fair agreement = 0.20 to 0.40
• Moderate agreement = 0.40 to 0.60
• Good agreement = 0.60 to 0.80
• Very good agreement = 0.80 to 1.00
•Kappa statistic - a mean for evaluating the predication
performance of classifiers
– gives a better indicator of how the classifier
performed across all instances
Surabhi Dwivedi
Kappa Statistics
•The row indicates the true class,
the column indicates the
Actu
al
Predicted
ROC Curve
•ROC curve, is a graphical plot that illustrates the performance
of a binary classifier system as its discrimination threshold is
varied.
•The curve is created by plotting the true positive rate against
the false positive rate at various threshold settings.
•The true-positive rate is also known as sensitivity or recall in
machine learning. The false-positive rate is also known as the
fall-out and can be calculated as 1 - specificity.
•Specificity (sometimes called the true negative rate)
measures the proportion of negatives which are correctly
identified as such (e.g., the percentage of healthy people who
are correctly identified as not having the condition), and is
complementary to the false positive rate.
Surabhi Dwivedi
ROC Curve
Surabhi Dwivedi
Receiver Operating Curve –
Class XII Data
Sample
Receiver Operating Curve –
Class X Data
Sample
ROC Curve
Sample
•In ROC curve, a better model is more
towards upper left corner.
•Output – Threshold Curve
Surabhi Dwivedi
Margin Curve
•The margin curve prints the cumulative frequency of the
difference of actual class probability and the highest
probability predicted for other classes
•for a single class, if it is predicted to be positive with
probability p, the margin is p - (1-p) =2p-1.
•The negative values denote classification errors,
meaning that the dominant class is not the correct one
•Margin contains the margin value (plotted as an x-
coordinate)
•Cumulative contains the count of instances with margin
less than or equal to the current margin (plot as y axis)
Surabhi Dwivedi
Margin Curve
Sample
Margin Curve
Sample
Ideal Output
Sample
Test Options - Classifier
•The test sets are a percentage of the
data that will be used to test whether
the model has learned the concept
properly
•In WEKA you can run an execution
splitting your data set into training
data (to build the tree in the case of
J48) and test data (to test the model in
order to determine that the concept
has been learned). Surabhi Dwivedi
Thank you

Statistical terms for classification

  • 1.
    Statistical terms for Classificationin weka Surabhi Dwivedi
  • 2.
    Important Statistics to selecta model •Confusion Matrix •TP Rate •FP Rate •Precision •Recall •F-measure •ROC Area •Kappa Statistics •Test Option for Classifier – Cross Validation – Supplied test set – Percentage split Surabhi Dwivedi
  • 3.
    Confusion Matrix • Inmachine learning, a confusion matrix, also known as a contingency table or an error matrix –A table layout that allows visualization of the performance of an algorithm –Each column of the matrix represents the instances in a predicted class –Each row represents the instances in an actual class Surabhi Dwivedi
  • 4.
  • 5.
  • 7.
  • 8.
    Explanation - Terms Precision(also called positive predictive value) – the fraction of retrieved instances that are relevant •Recall (also known as sensitivity/ True Positive) – the fraction of relevant instances that are retrieved •Eg: •A program for recognizing pass /fail identifies 7 PASS in a scene containing 9 instances . If 4 of the identifications are correct, but 3 are actually FAIL, the program's precision is 4/7 while its recall is 4/9. •High precision means that an algorithm returned substantially more relevant results than irrelevant •High recall means that an algorithm returned most of the relevant results. •F-measure (the weighted harmonic mean of precision and recall) Surabhi Dwivedi Surabhi Dwivedi
  • 9.
    Explanation - Terms Precision(also called positive predictive value) – the fraction of retrieved instances that are relevant •Recall (also known as sensitivity/ True Positive) – the fraction of relevant instances that are retrieved •Eg: •A program for recognizing pass /fail identifies 7 PASS in a scene containing 9 instances . If 4 of the identifications are correct, but 3 are actually FAIL, the program's precision is 4/7 while its recall is 4/9. •High precision means that an algorithm returned substantially more relevant results than irrelevant •High recall means that an algorithm returned most of the relevant results. •F-measure (the weighted harmonic mean of precision and recall) Surabhi Dwivedi
  • 10.
    F-score •In statistical analysisof binary classification, the F-score or F-measure –a measure of a test's accuracy. –It considers both the precision p and the recall r of the test to compute the score –a weighted average of the precision and recall –an F1 score reaches its best value at 1 and worst score at 0 Surabhi Dwivedi
  • 11.
  • 12.
    Kappa Statistics •Kappa isa chance-corrected measure of agreement between the classifications and the true classes. – A value of 1 implies perfect agreement and values less than 1 imply less than perfect agreement • Poor agreement = Less than 0.20 • Fair agreement = 0.20 to 0.40 • Moderate agreement = 0.40 to 0.60 • Good agreement = 0.60 to 0.80 • Very good agreement = 0.80 to 1.00 •Kappa statistic - a mean for evaluating the predication performance of classifiers – gives a better indicator of how the classifier performed across all instances Surabhi Dwivedi
  • 13.
    Kappa Statistics •The rowindicates the true class, the column indicates the Actu al Predicted
  • 14.
    ROC Curve •ROC curve,is a graphical plot that illustrates the performance of a binary classifier system as its discrimination threshold is varied. •The curve is created by plotting the true positive rate against the false positive rate at various threshold settings. •The true-positive rate is also known as sensitivity or recall in machine learning. The false-positive rate is also known as the fall-out and can be calculated as 1 - specificity. •Specificity (sometimes called the true negative rate) measures the proportion of negatives which are correctly identified as such (e.g., the percentage of healthy people who are correctly identified as not having the condition), and is complementary to the false positive rate. Surabhi Dwivedi
  • 15.
  • 16.
    Receiver Operating Curve– Class XII Data Sample
  • 17.
    Receiver Operating Curve– Class X Data Sample
  • 18.
  • 19.
    •In ROC curve,a better model is more towards upper left corner. •Output – Threshold Curve Surabhi Dwivedi
  • 20.
    Margin Curve •The margincurve prints the cumulative frequency of the difference of actual class probability and the highest probability predicted for other classes •for a single class, if it is predicted to be positive with probability p, the margin is p - (1-p) =2p-1. •The negative values denote classification errors, meaning that the dominant class is not the correct one •Margin contains the margin value (plotted as an x- coordinate) •Cumulative contains the count of instances with margin less than or equal to the current margin (plot as y axis) Surabhi Dwivedi
  • 21.
  • 22.
  • 23.
  • 24.
    Test Options -Classifier •The test sets are a percentage of the data that will be used to test whether the model has learned the concept properly •In WEKA you can run an execution splitting your data set into training data (to build the tree in the case of J48) and test data (to test the model in order to determine that the concept has been learned). Surabhi Dwivedi
  • 25.