Download as PDF, PPTX


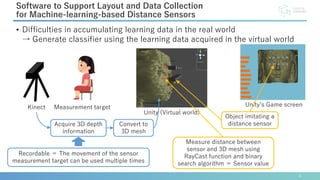
![• Gesture recognition and posture estimation can be performed by
combining real-world sensors and machine learning.
• The number and position of sensors that can acquire unique sensor
data are often determined by trial and error.
2
Combining Real-World Sensors and Machine Learning
The flow of system design
Examination
of sensor
placement
Create device
Acquire
identification
result
Accumulate
learning data
Combining real-world sensors
and machine learning [1]
[1] Munehiko Sato, Ivan Poupyrev, and Chris Harrison. Touche: Enhancing touch interaction on humans, screens, liquids, and everyday objects. In Proceedings of the SIGCHI Conference on Human Factors in Computing Systems, CHI
'12, pp. 483{492, New York, NY, USA, 2012. ACM.](https://image.slidesharecdn.com/asianchiv2simsensor-200924072508/85/Development-of-Real-World-Sensor-Optimal-Placement-Support-Software-AsianCHI2020-2-320.jpg)
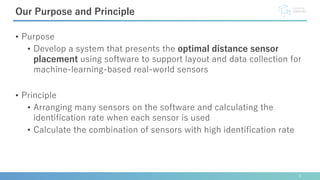
![• Learn virtual egocentric video and the posture of a humanoid model
walking in a virtual world
• Estimate the walking postures of people in the real world by combining
data in images shot by a camera attached a pedestrian and learning
data in the virtual world
• Use learning data in the virtual world to estimate the real-world system
3
Simulation of Real-World System on Computer
[2] Yuan Y., Kitani K. (2018) 3D Ego-Pose Estimation via Imitation Learning. In: Ferrari V., Hebert M., Sminchisescu C., Weiss Y. (eds) Computer Vision – ECCV 2018. ECCV 2018. Lecture Notes in Computer Science, vol 11220.
Springer, Cham](https://image.slidesharecdn.com/asianchiv2simsensor-200924072508/85/Development-of-Real-World-Sensor-Optimal-Placement-Support-Software-AsianCHI2020-3-320.jpg)
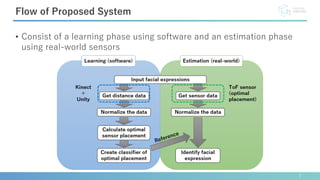
![• Facial expression identification based on changes in the distance
between distance sensors placed on an eyeglass frame and the skin
surface on a face
6
Facial Expression Identification by Distance Sensor
AffectiveWear [5]
[5] Masai, K., Sugiura, Y., Ogata, M., Kunze, K., Inami, M., Sugimoto, M.: Facial Expression Recognition in Daily Life by Embedded Photo Reflective Sensors on Smart Eyewear. In: Proceedings of the 21st International Conference on
Intelligent User Interfaces (IUI '16), pp. 317-326. ACM, New York, NY, USA (2016).](https://image.slidesharecdn.com/asianchiv2simsensor-200924072508/85/Development-of-Real-World-Sensor-Optimal-Placement-Support-Software-AsianCHI2020-6-320.jpg)
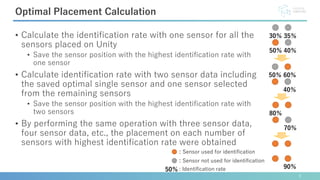
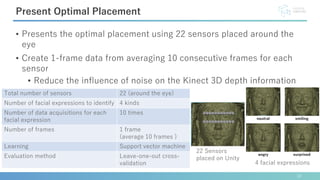
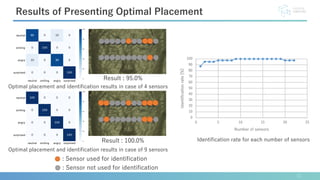
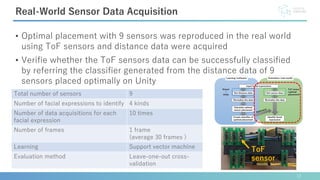
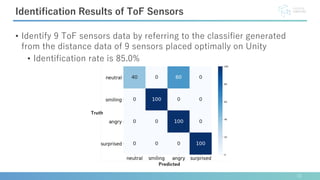
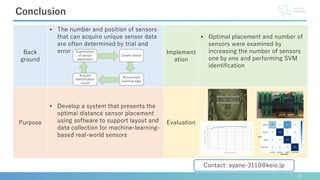

This document describes software developed to optimize the placement of real-world sensors for machine learning applications. The software allows virtually placing different numbers of sensors and calculating identification rates to determine the optimal sensor configuration. It was tested on a facial expression identification task using distance sensors on eyeglasses. The optimal 9-sensor placement identified in software achieved an 85% identification rate when tested with real-world time-of-flight sensors, demonstrating its ability to support sensor layout optimization for machine learning systems.


![[FIT2025 トップコンファレンスセッション]EarHover: ヒアラブルデバイスにおける音漏れ信号を用いた空中ジェスチャ認識](https://cdn.slidesharecdn.com/ss_thumbnails/fit2025-presentationv2-251006033725-c7651715-thumbnail.jpg?width=640&height=640&fit=bounds)


