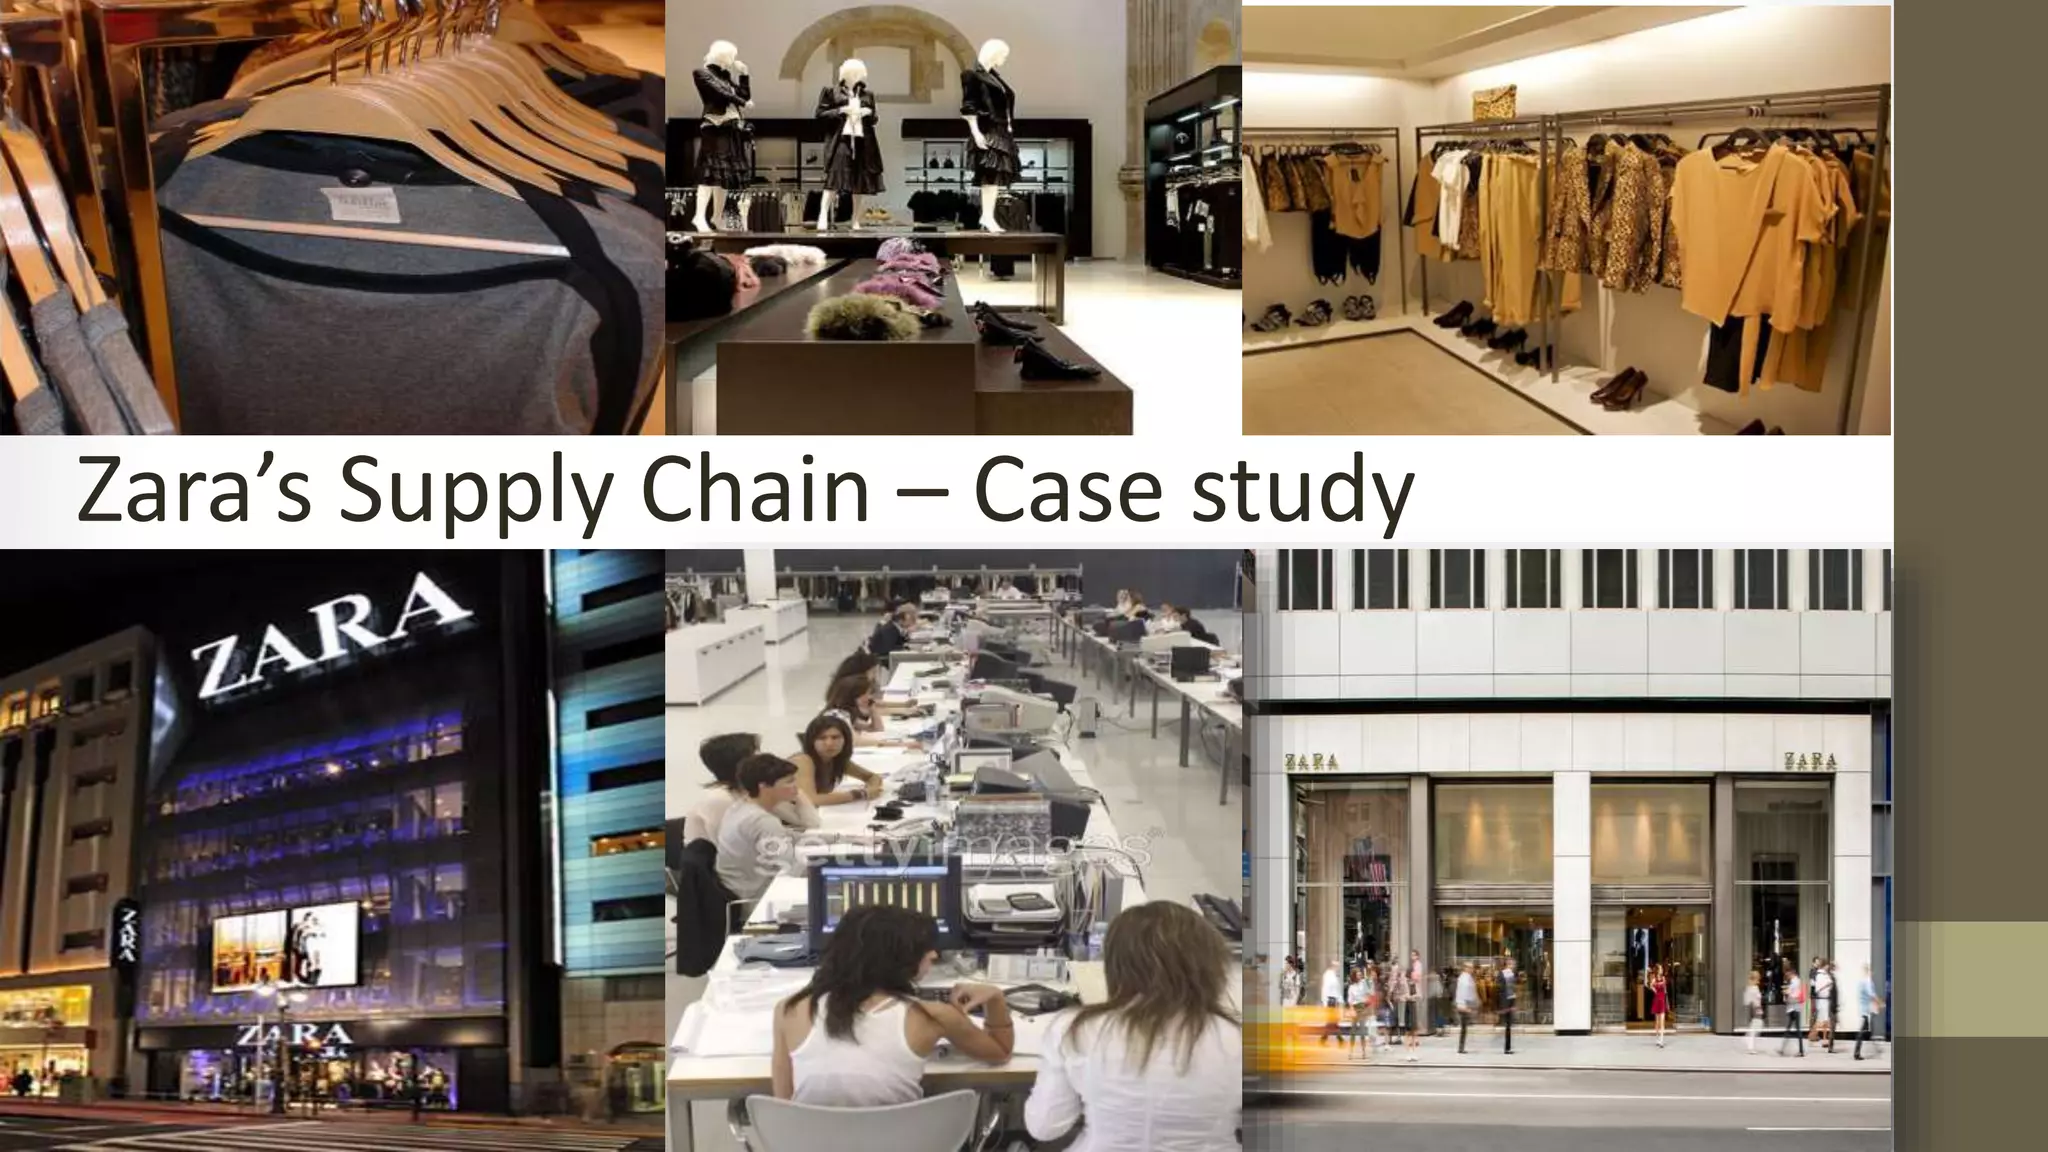
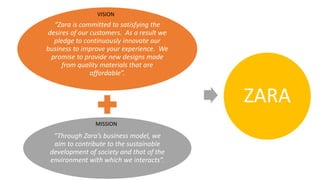
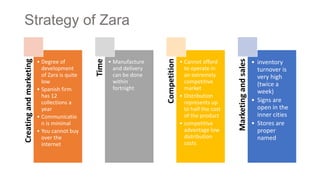
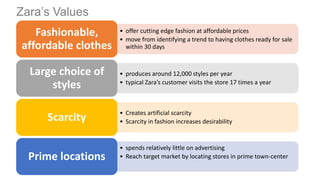
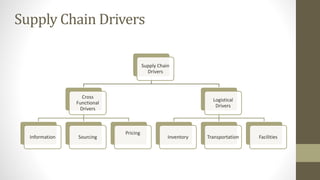
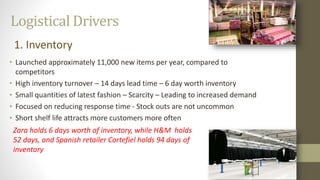
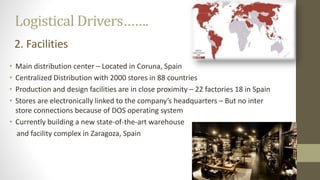
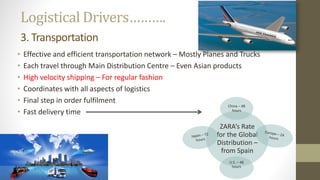
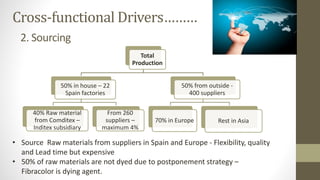
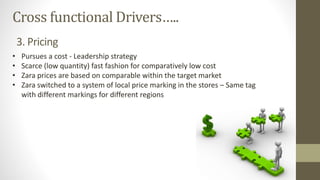
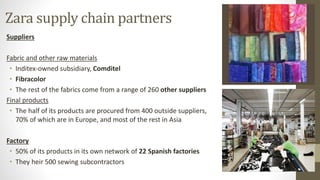
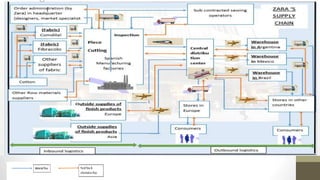
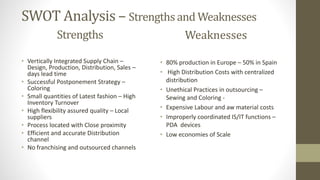
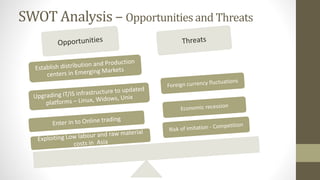
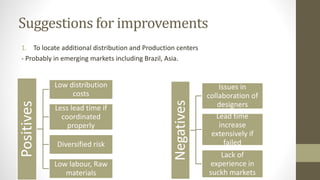
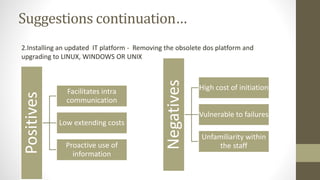
Zara’s Supply Chain – Case study
Table of content
• Zara’s Vision and Mission
• Competitive Strategy
• Logistical Drivers
• Cross Functional Drivers
• Key Performance Indicators
• SWOT
• Some sugesstions
ā€œZara is committed to satisfying the
desires of our customers. As a result we
pledge to continuously innovate our
business to improve your experience. We
promise to provide new designs made
from quality materials that are
affordableā€.
ā€œThrough Zara’s business model, we
aim to contribute to the sustainable
development of society and that of the
environment with which we interactsā€.
ZARA
VISION
MISSION
Strategy of ZaraCreatingandmarketing
• Degree of
development
of Zara is quite
low
• Spanish firm
has 12
collections a
year
• Communicatio
n is minimal
• You cannot buy
over the
internet
Time
• Manufacture
and delivery
can be done
within
fortnight
Competition
• Cannot afford
to operate in
an extremely
competitive
market
• Distribution
represents up
to half the cost
of the product
• competitive
advantage low
distribution
costs
Marketingandsales
• inventory
turnover is
very high
(twice a
week)
• Signs are
open in the
inner cities
• Stores are
proper
named
• offer cutting edge fashion at affordable prices
• move from identifying a trend to having clothes ready for sale
within 30 days
Fashionable,
affordable clothes
• produces around 12,000 styles per year
• typical Zara’s customer visits the store 17 times a year
Large choice of
styles
• Creates artificial scarcity
• Scarcity in fashion increases desirabilityScarcity
• spends relatively little on advertising
• Reach target market by locating stores in prime town-centerPrime locations
Zara’s Values
Supply Chain Drivers
Supply Chain
Drivers
Cross
Functional
Drivers
Information Sourcing
Pricing
Logistical
Drivers
Inventory Transportation Facilities
Logistical Drivers
• Launched approximately 11,000 new items per year, compared to
competitors
• High inventory turnover – 14 days lead time – 6 day worth inventory
• Small quantities of latest fashion – Scarcity – Leading to increased demand
• Focused on reducing response time - Stock outs are not uncommon
• Short shelf life attracts more customers more often
1. Inventory
Zara holds 6 days worth of inventory, while H&M holds
52 days, and Spanish retailer Cortefiel holds 94 days of
inventory
Logistical Drivers…….
• Main distribution center – Located in Coruna, Spain
• Centralized Distribution with 2000 stores in 88 countries
• Production and design facilities are in close proximity – 22 factories 18 in Spain
• Stores are electronically linked to the company’s headquarters – But no inter
store connections because of DOS operating system
• Currently building a new state-of-the-art warehouse
and facility complex in Zaragoza, Spain
2. Facilities
3. Transportation
• Effective and efficient transportation network – Mostly Planes and Trucks
• Each travel through Main Distribution Centre – Even Asian products
• High velocity shipping – For regular fashion
• Coordinates with all aspects of logistics
• Final step in order fulfilment
• Fast delivery time
Logistical Drivers……….
ZARA’s Rate
for the Global
Distribution –
from Spain
China – 48
hours
U.S. – 48
hours
Cross-functional Drivers
• Information is the biggest driver as it directly effects the responsiveness and
efficiency of supply chain
• Clubs, Universities, Fashion shows, social gatherings are major sources
• The designers, market specialists and buyers have real-time information –
Customer driven process
• IT advantage has shortened the time in Designing to Production
• Sales and Feed back information is sent to Headquarters every day in evening
• The link between inter-stores is poor
• PDA devices is not connected to POS terminals
leading to once a day communication
• Old POS OS is used since cheap and stable
1. Information
2. Sourcing
• Source Raw materials from suppliers in Spain and Europe - Flexibility, quality
and Lead time but expensive
• 50% of raw materials are not dyed due to postponement strategy –
Fibracolor is dying agent.
Cross-functional Drivers………
Total
Production
50% in house – 22
Spain factories
40% Raw material
from Comditex –
Inditex subsidiary
From 260
suppliers –
maximum 4%
50% from outside -
400 suppliers
70% in Europe Rest in Asia
Cross functional Drivers…..
• Pursues a cost - Leadership strategy
• Scarce (low quantity) fast fashion for comparatively low cost
• Zara prices are based on comparable within the target market
• Zara switched to a system of local price marking in the stores – Same tag
with different markings for different regions
3. Pricing
Zara supply chain partners
Suppliers
Fabric and other raw materials
• Inditex-owned subsidiary, Comditel
• Fibracolor
• The rest of the fabrics come from a range of 260 other suppliers
Final products
• The half of its products are procured from 400 outside suppliers,
70% of which are in Europe, and most of the rest in Asia
Factory
• 50% of its products in its own network of 22 Spanish factories
• They heir 500 sewing subcontractors
Transportation
• Subcontractors use their own truck fleet to transport between factory and
subcontractor’s plant
• Finish product transportation :their own system of aerial monorails
connects ten of the factories in La CoruƱa to the distribution center
• Contractors, using trucks bearing Zara’s name pick up the merchandize at
La CoruƱa and deliver it directly to Zara’s stores in Europe.
• Products shipped by air are flown from either the airport in La CoruƱa or
the larger airport in Santiago
Warehouses
• Central distribution center at La CoruƱa
• Three other smaller warehouses in Brazil, Argentina, and Mexico
Stores
• There are over 2000 Zara Retail stores located across 88 countries
Zara supply chain partners(contd…)
ZARA SUPPLY
CHAIN
Key Performance Indicators
Supplier interface
• Time taken to deliver goods (in European
stores and American and Asian outlets)
• Employees in logistics department
• Annual distribution of garments
• Number of retail stores
• Lead time (compared with competitors)
• E-commerce usage (online sales
percentage)
Customer interface
• Capacity in in house and outsourced
manufacturers.
• Flexibility of above mentioned manufacturers
(extra capacity available as a percentage)
• Labor costs (as a percentage of sales or
compared with competitors)
• No of deadlines met regarding production (or any
other processes for that matter)
• Number of errors in processes (compared with
competitors or as a percentage of processes
amount)
• percentage of automation in operations (as a
percentage)
• Supplier ratings (A grade, B grade, C grade and so
forth)
Key Performance Indicators
Design and Production- Just in Time
Production
• Wastage in terms of proportion of sales
• Number of designers
• Number of designs & number of approved
designs
• Variability of demand in percentage or
standard deviation
• Inventory level (inventory ratios- compared
with competitors)
• Replenishment time
• Number of designs distributed
Centralized Logistics and Distribution
• Number of orders from retail outlets
• Shipment preparation time
• Work time on full capacity
• Time to market the product from scratch (from
design)
• Ownership and control of manufacturing
facilities in Spain (and other regions that
speeds up delivery)
• No of stores (region wise)
• Revenues (region wise)
• Vertical integration (no of integration and size
of the investment – compared with
competitors)
• No of distribution centers (in America, Asia
and Europe)
Key Performance Indicators
Financial performance Indicators
• Gross profit margins compared with
competitors
• Working capital cycle (in days)
• Inventory turnover
SWOT Analysis – Strengths and Weaknesses
Strengths
• Vertically Integrated Supply Chain –
Design, Production, Distribution, Sales –
days lead time
• Successful Postponement Strategy –
Coloring
• Small quantities of Latest fashion – High
Inventory Turnover
• High flexibility assured quality – Local
suppliers
• Process located with Close proximity
• Efficient and accurate Distribution
channel
• No franchising and outsourced channels
Weaknesses
• 80% production in Europe – 50% in Spain
• High Distribution Costs with centralized
distribution
• Unethical Practices in outsourcing –
Sewing and Coloring -
• Expensive Labour and aw material costs
• Improperly coordinated IS/IT functions –
PDA devices
• Low economies of Scale
SWOT Analysis – Opportunities and Threats
Suggestions for improvements
1. To locate additional distribution and Production centers
- Probably in emerging markets including Brazil, Asia.
Positives
Low distribution
costs
Less lead time if
coordinated
properly
Diversified risk
Low labour, Raw
materials
Negatives
Issues in
collaboration of
designers
Lead time
increase
extensively if
failed
Lack of
experience in
suckh markets
Suggestions continuation…
2.Installing an updated IT platform - Removing the obsolete dos platform and
upgrading to LINUX, WINDOWS OR UNIX
Positives
Facilitates intra
communication
Low extending costs
Proactive use of
information
Negatives
High cost of initiation
Vulnerable to failures
Unfamiliarity within
the staff
Suggestions- Continuation…..
3. Outsourcing to ethical partners in the supply chain process - Currently based on
economy – Currently people are concerned on CSR – Tarnished reputation as Wallmart
Positives
Good perception
Enthusiastic
workforce leading to
productivity
Negatives
Costs may be high
Zara final

Zara final

  • 1.
    Zara’s Supply Chain– Case study
  • 2.
    Table of content •Zara’s Vision and Mission • Competitive Strategy • Logistical Drivers • Cross Functional Drivers • Key Performance Indicators • SWOT • Some sugesstions
  • 3.
    ā€œZara is committedto satisfying the desires of our customers. As a result we pledge to continuously innovate our business to improve your experience. We promise to provide new designs made from quality materials that are affordableā€. ā€œThrough Zara’s business model, we aim to contribute to the sustainable development of society and that of the environment with which we interactsā€. ZARA VISION MISSION
  • 4.
    Strategy of ZaraCreatingandmarketing •Degree of development of Zara is quite low • Spanish firm has 12 collections a year • Communicatio n is minimal • You cannot buy over the internet Time • Manufacture and delivery can be done within fortnight Competition • Cannot afford to operate in an extremely competitive market • Distribution represents up to half the cost of the product • competitive advantage low distribution costs Marketingandsales • inventory turnover is very high (twice a week) • Signs are open in the inner cities • Stores are proper named
  • 5.
    • offer cuttingedge fashion at affordable prices • move from identifying a trend to having clothes ready for sale within 30 days Fashionable, affordable clothes • produces around 12,000 styles per year • typical Zara’s customer visits the store 17 times a year Large choice of styles • Creates artificial scarcity • Scarcity in fashion increases desirabilityScarcity • spends relatively little on advertising • Reach target market by locating stores in prime town-centerPrime locations Zara’s Values
  • 6.
    Supply Chain Drivers SupplyChain Drivers Cross Functional Drivers Information Sourcing Pricing Logistical Drivers Inventory Transportation Facilities
  • 7.
    Logistical Drivers • Launchedapproximately 11,000 new items per year, compared to competitors • High inventory turnover – 14 days lead time – 6 day worth inventory • Small quantities of latest fashion – Scarcity – Leading to increased demand • Focused on reducing response time - Stock outs are not uncommon • Short shelf life attracts more customers more often 1. Inventory Zara holds 6 days worth of inventory, while H&M holds 52 days, and Spanish retailer Cortefiel holds 94 days of inventory
  • 8.
    Logistical Drivers……. • Maindistribution center – Located in Coruna, Spain • Centralized Distribution with 2000 stores in 88 countries • Production and design facilities are in close proximity – 22 factories 18 in Spain • Stores are electronically linked to the company’s headquarters – But no inter store connections because of DOS operating system • Currently building a new state-of-the-art warehouse and facility complex in Zaragoza, Spain 2. Facilities
  • 10.
    3. Transportation • Effectiveand efficient transportation network – Mostly Planes and Trucks • Each travel through Main Distribution Centre – Even Asian products • High velocity shipping – For regular fashion • Coordinates with all aspects of logistics • Final step in order fulfilment • Fast delivery time Logistical Drivers………. ZARA’s Rate for the Global Distribution – from Spain China – 48 hours U.S. – 48 hours
  • 11.
    Cross-functional Drivers • Informationis the biggest driver as it directly effects the responsiveness and efficiency of supply chain • Clubs, Universities, Fashion shows, social gatherings are major sources • The designers, market specialists and buyers have real-time information – Customer driven process • IT advantage has shortened the time in Designing to Production • Sales and Feed back information is sent to Headquarters every day in evening • The link between inter-stores is poor • PDA devices is not connected to POS terminals leading to once a day communication • Old POS OS is used since cheap and stable 1. Information
  • 12.
    2. Sourcing • SourceRaw materials from suppliers in Spain and Europe - Flexibility, quality and Lead time but expensive • 50% of raw materials are not dyed due to postponement strategy – Fibracolor is dying agent. Cross-functional Drivers……… Total Production 50% in house – 22 Spain factories 40% Raw material from Comditex – Inditex subsidiary From 260 suppliers – maximum 4% 50% from outside - 400 suppliers 70% in Europe Rest in Asia
  • 13.
    Cross functional Drivers….. •Pursues a cost - Leadership strategy • Scarce (low quantity) fast fashion for comparatively low cost • Zara prices are based on comparable within the target market • Zara switched to a system of local price marking in the stores – Same tag with different markings for different regions 3. Pricing
  • 14.
    Zara supply chainpartners Suppliers Fabric and other raw materials • Inditex-owned subsidiary, Comditel • Fibracolor • The rest of the fabrics come from a range of 260 other suppliers Final products • The half of its products are procured from 400 outside suppliers, 70% of which are in Europe, and most of the rest in Asia Factory • 50% of its products in its own network of 22 Spanish factories • They heir 500 sewing subcontractors
  • 15.
    Transportation • Subcontractors usetheir own truck fleet to transport between factory and subcontractor’s plant • Finish product transportation :their own system of aerial monorails connects ten of the factories in La CoruƱa to the distribution center • Contractors, using trucks bearing Zara’s name pick up the merchandize at La CoruƱa and deliver it directly to Zara’s stores in Europe. • Products shipped by air are flown from either the airport in La CoruƱa or the larger airport in Santiago Warehouses • Central distribution center at La CoruƱa • Three other smaller warehouses in Brazil, Argentina, and Mexico Stores • There are over 2000 Zara Retail stores located across 88 countries Zara supply chain partners(contd…)
  • 16.
  • 17.
    Key Performance Indicators Supplierinterface • Time taken to deliver goods (in European stores and American and Asian outlets) • Employees in logistics department • Annual distribution of garments • Number of retail stores • Lead time (compared with competitors) • E-commerce usage (online sales percentage) Customer interface • Capacity in in house and outsourced manufacturers. • Flexibility of above mentioned manufacturers (extra capacity available as a percentage) • Labor costs (as a percentage of sales or compared with competitors) • No of deadlines met regarding production (or any other processes for that matter) • Number of errors in processes (compared with competitors or as a percentage of processes amount) • percentage of automation in operations (as a percentage) • Supplier ratings (A grade, B grade, C grade and so forth)
  • 18.
    Key Performance Indicators Designand Production- Just in Time Production • Wastage in terms of proportion of sales • Number of designers • Number of designs & number of approved designs • Variability of demand in percentage or standard deviation • Inventory level (inventory ratios- compared with competitors) • Replenishment time • Number of designs distributed Centralized Logistics and Distribution • Number of orders from retail outlets • Shipment preparation time • Work time on full capacity • Time to market the product from scratch (from design) • Ownership and control of manufacturing facilities in Spain (and other regions that speeds up delivery) • No of stores (region wise) • Revenues (region wise) • Vertical integration (no of integration and size of the investment – compared with competitors) • No of distribution centers (in America, Asia and Europe)
  • 19.
    Key Performance Indicators Financialperformance Indicators • Gross profit margins compared with competitors • Working capital cycle (in days) • Inventory turnover
  • 20.
    SWOT Analysis –Strengths and Weaknesses Strengths • Vertically Integrated Supply Chain – Design, Production, Distribution, Sales – days lead time • Successful Postponement Strategy – Coloring • Small quantities of Latest fashion – High Inventory Turnover • High flexibility assured quality – Local suppliers • Process located with Close proximity • Efficient and accurate Distribution channel • No franchising and outsourced channels Weaknesses • 80% production in Europe – 50% in Spain • High Distribution Costs with centralized distribution • Unethical Practices in outsourcing – Sewing and Coloring - • Expensive Labour and aw material costs • Improperly coordinated IS/IT functions – PDA devices • Low economies of Scale
  • 21.
    SWOT Analysis –Opportunities and Threats
  • 22.
    Suggestions for improvements 1.To locate additional distribution and Production centers - Probably in emerging markets including Brazil, Asia. Positives Low distribution costs Less lead time if coordinated properly Diversified risk Low labour, Raw materials Negatives Issues in collaboration of designers Lead time increase extensively if failed Lack of experience in suckh markets
  • 23.
    Suggestions continuation… 2.Installing anupdated IT platform - Removing the obsolete dos platform and upgrading to LINUX, WINDOWS OR UNIX Positives Facilitates intra communication Low extending costs Proactive use of information Negatives High cost of initiation Vulnerable to failures Unfamiliarity within the staff
  • 24.
    Suggestions- Continuation….. 3. Outsourcingto ethical partners in the supply chain process - Currently based on economy – Currently people are concerned on CSR – Tarnished reputation as Wallmart Positives Good perception Enthusiastic workforce leading to productivity Negatives Costs may be high