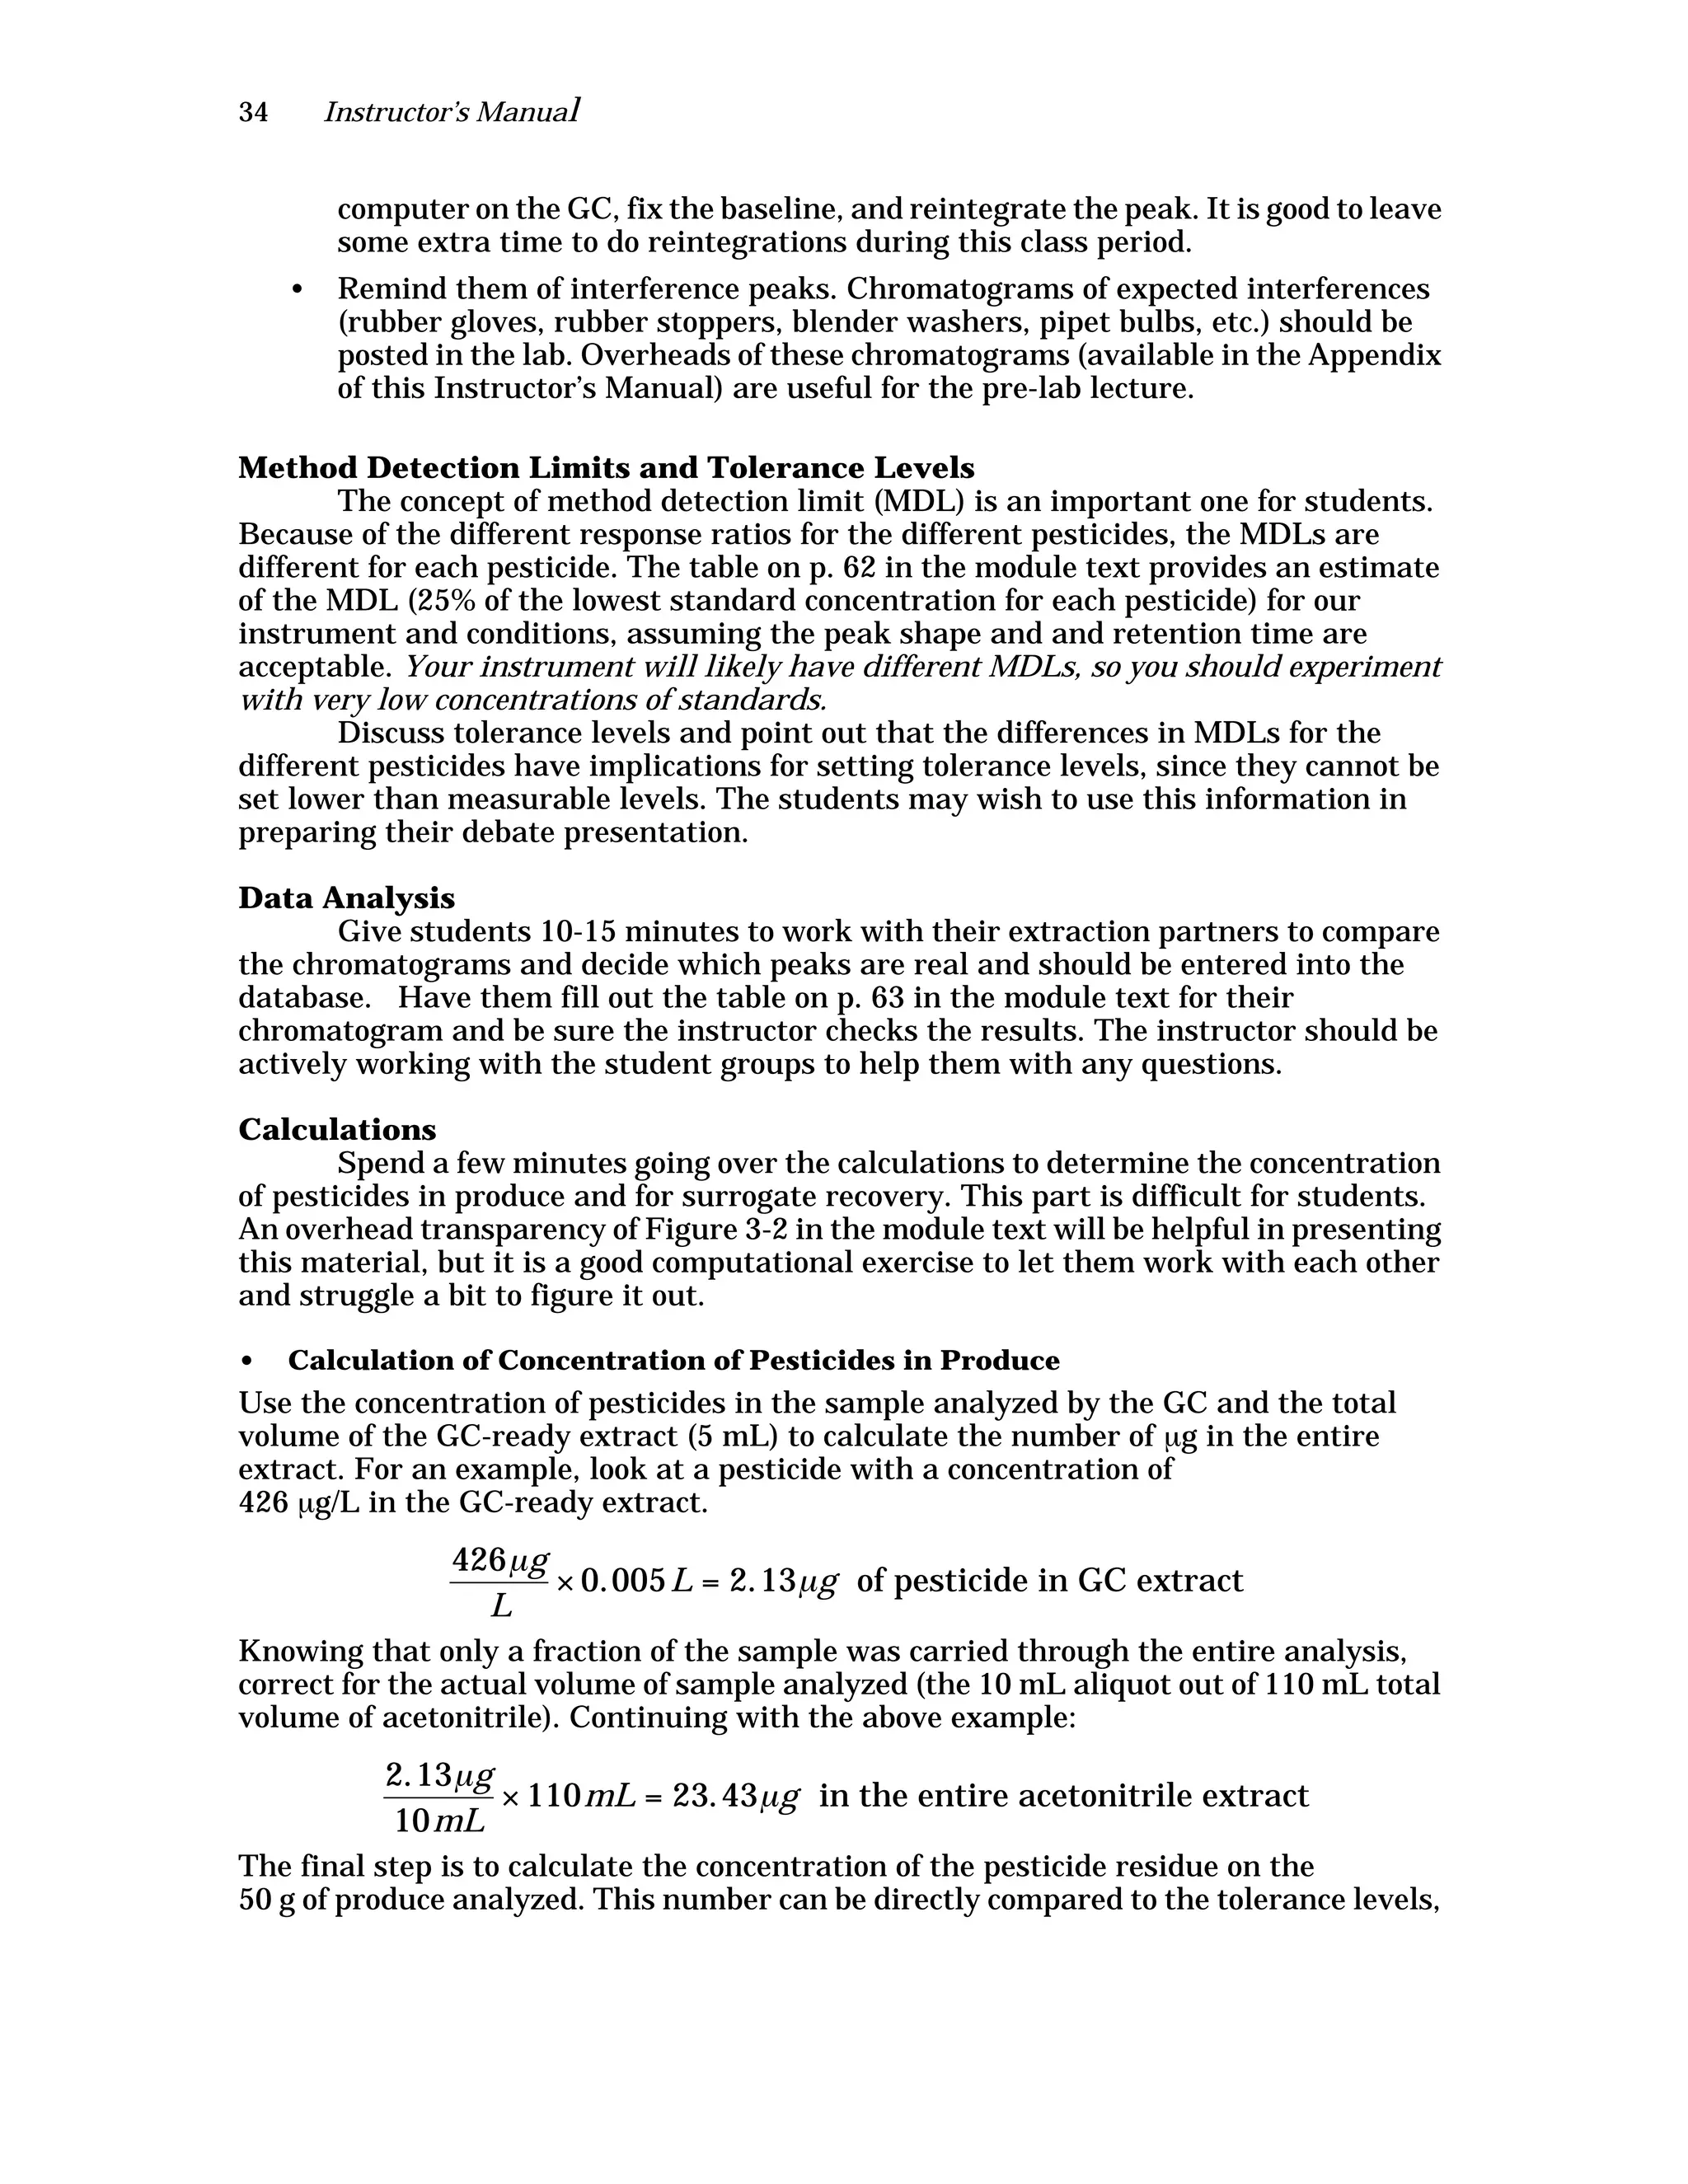
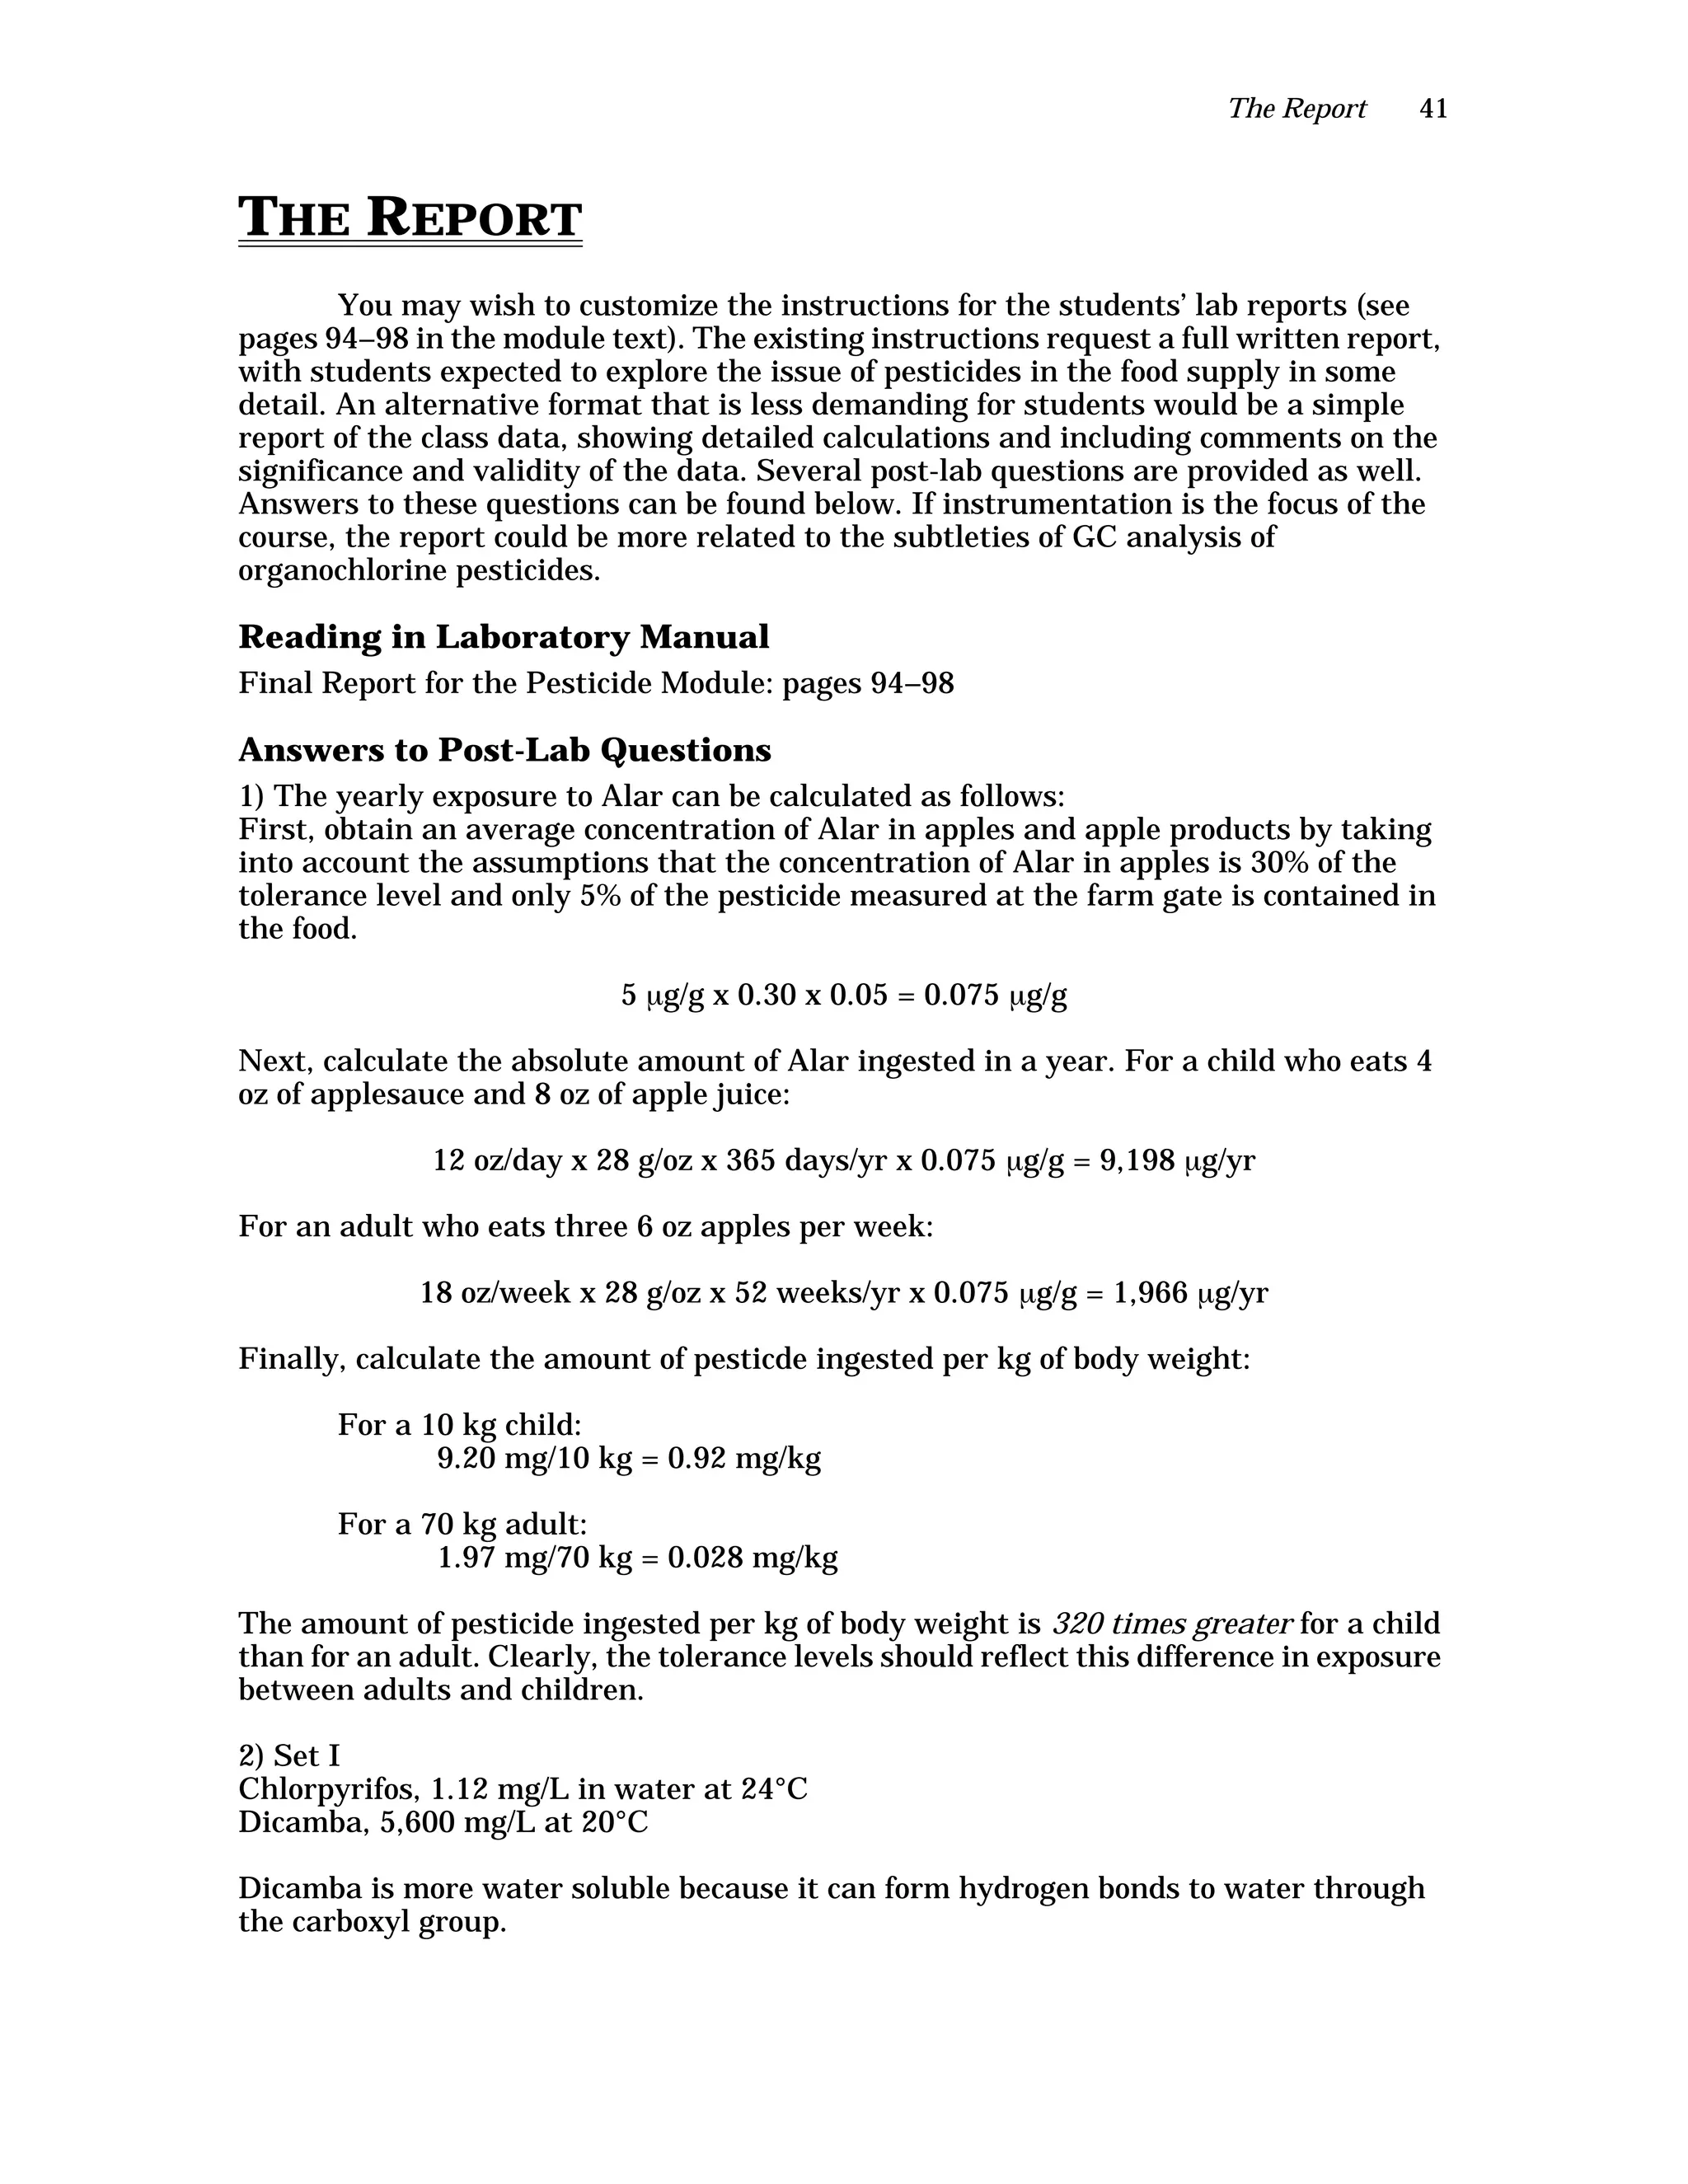
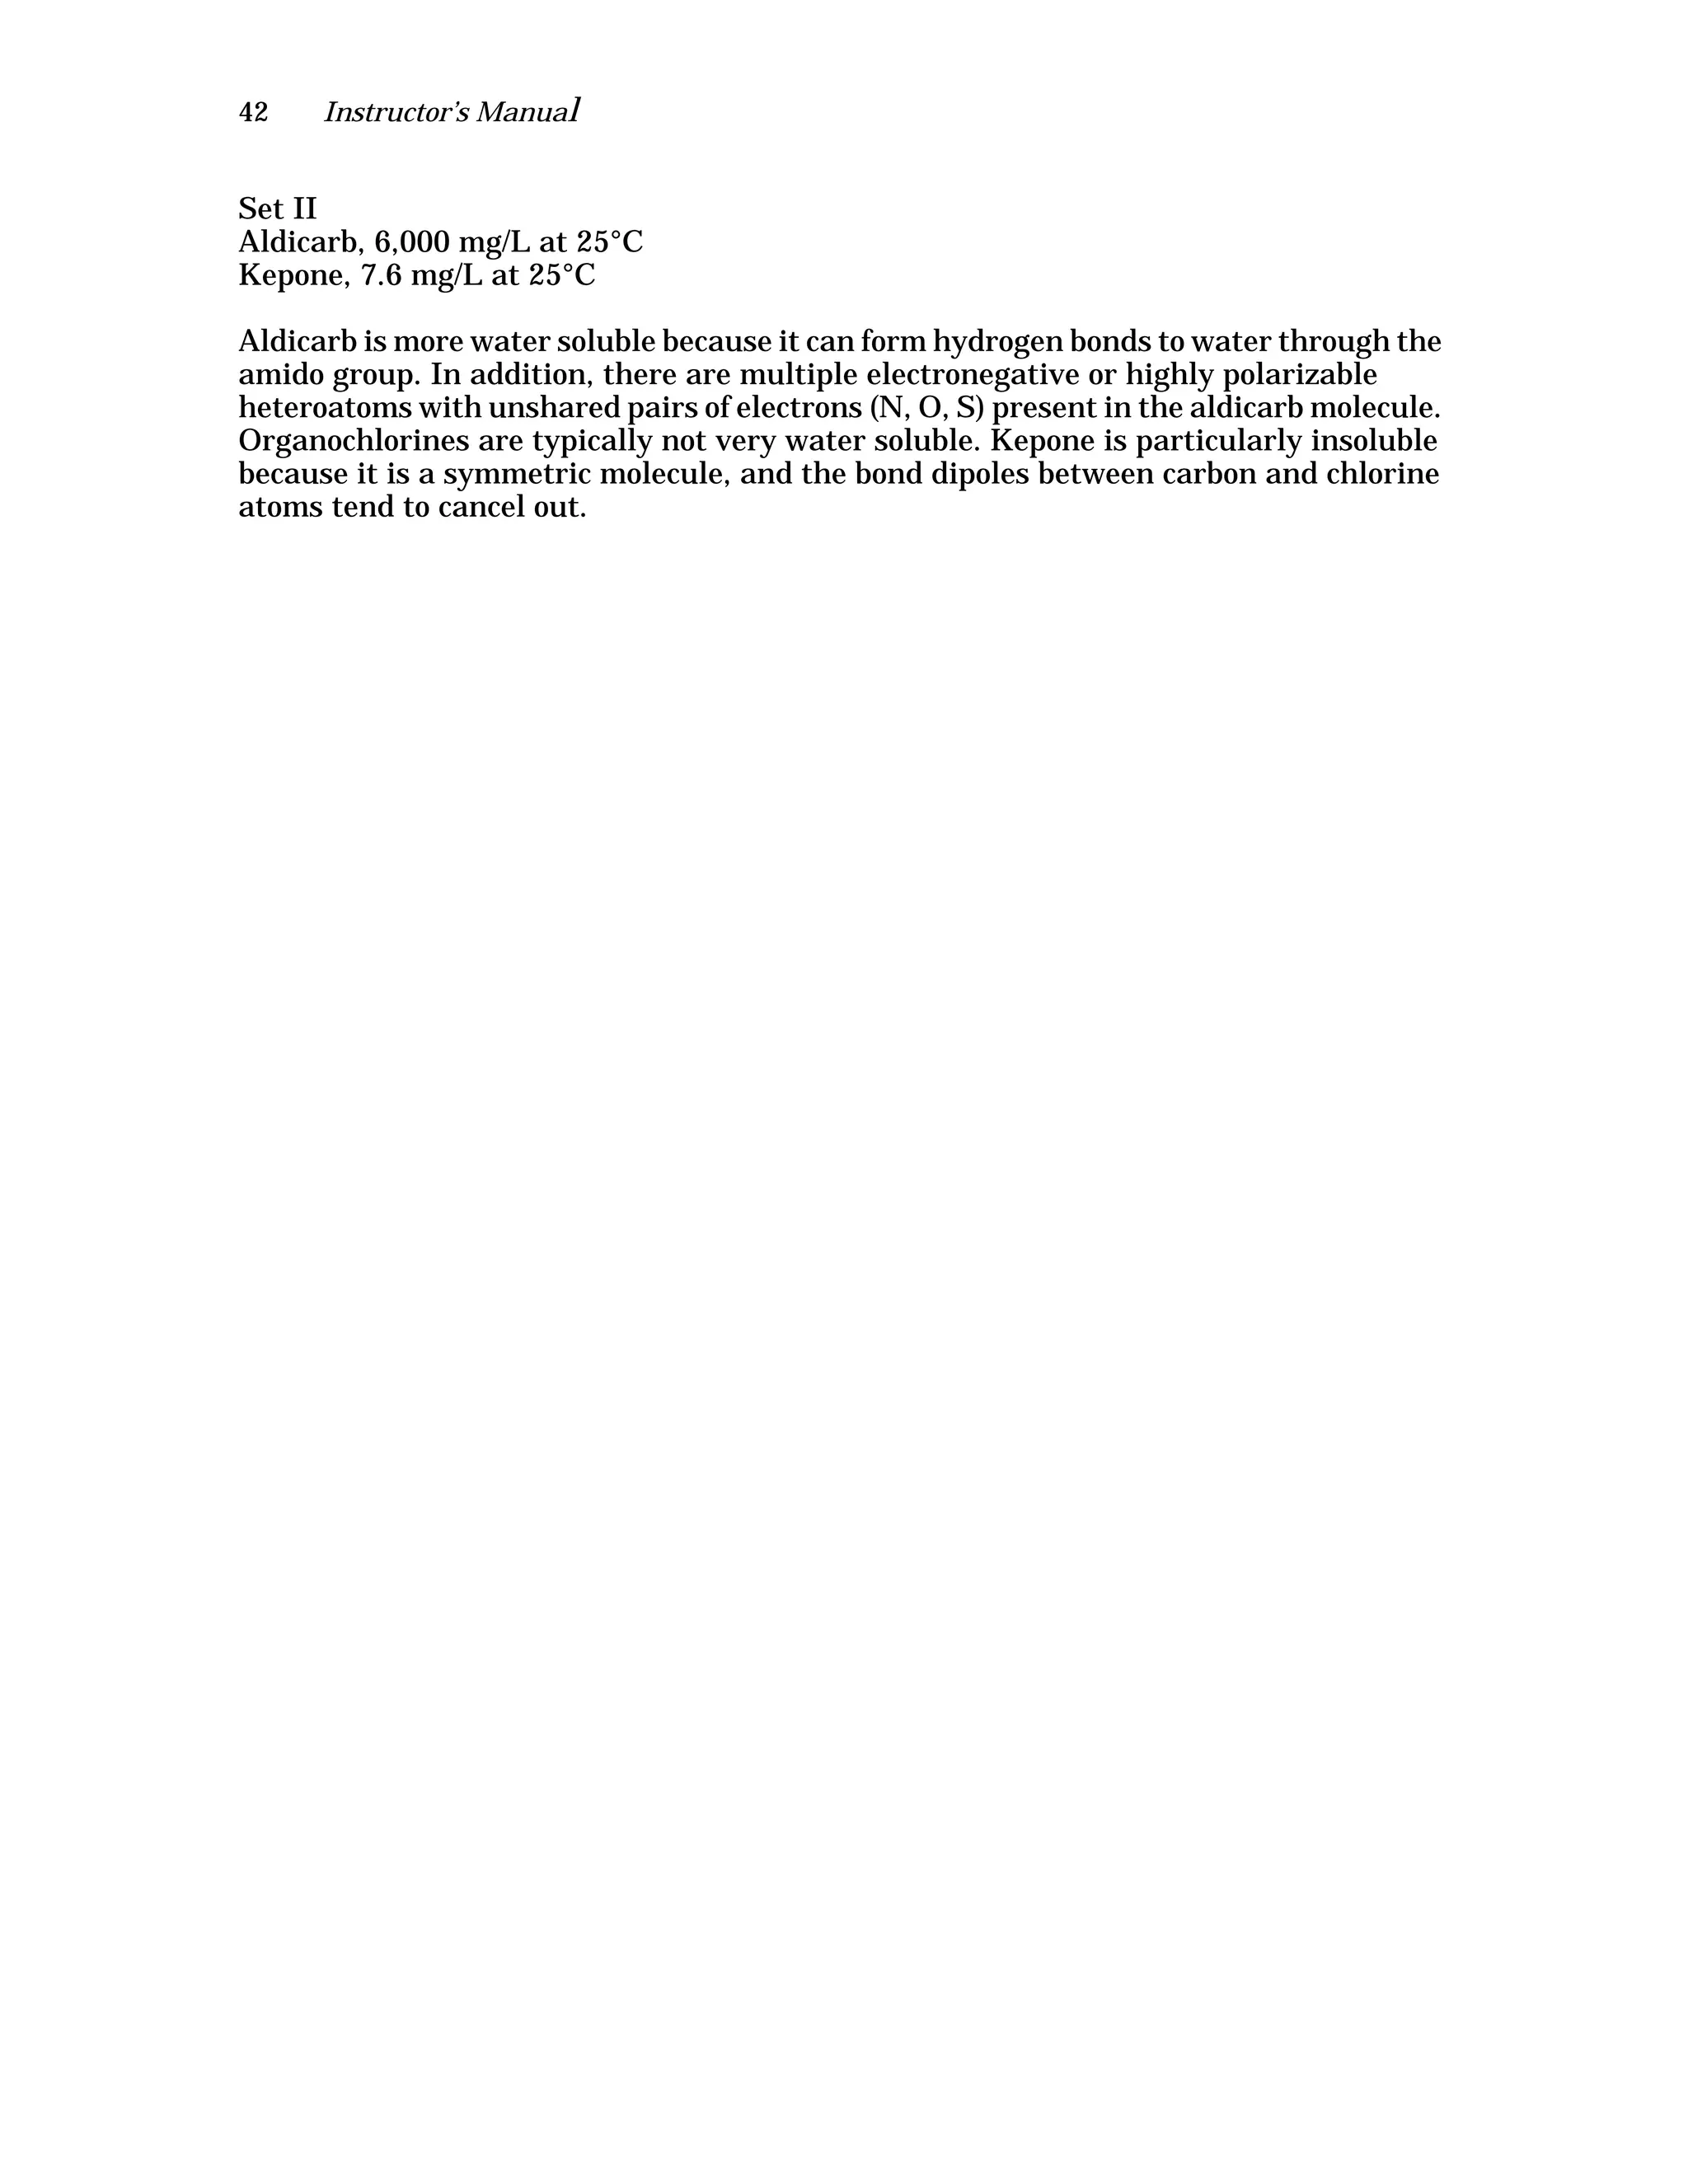
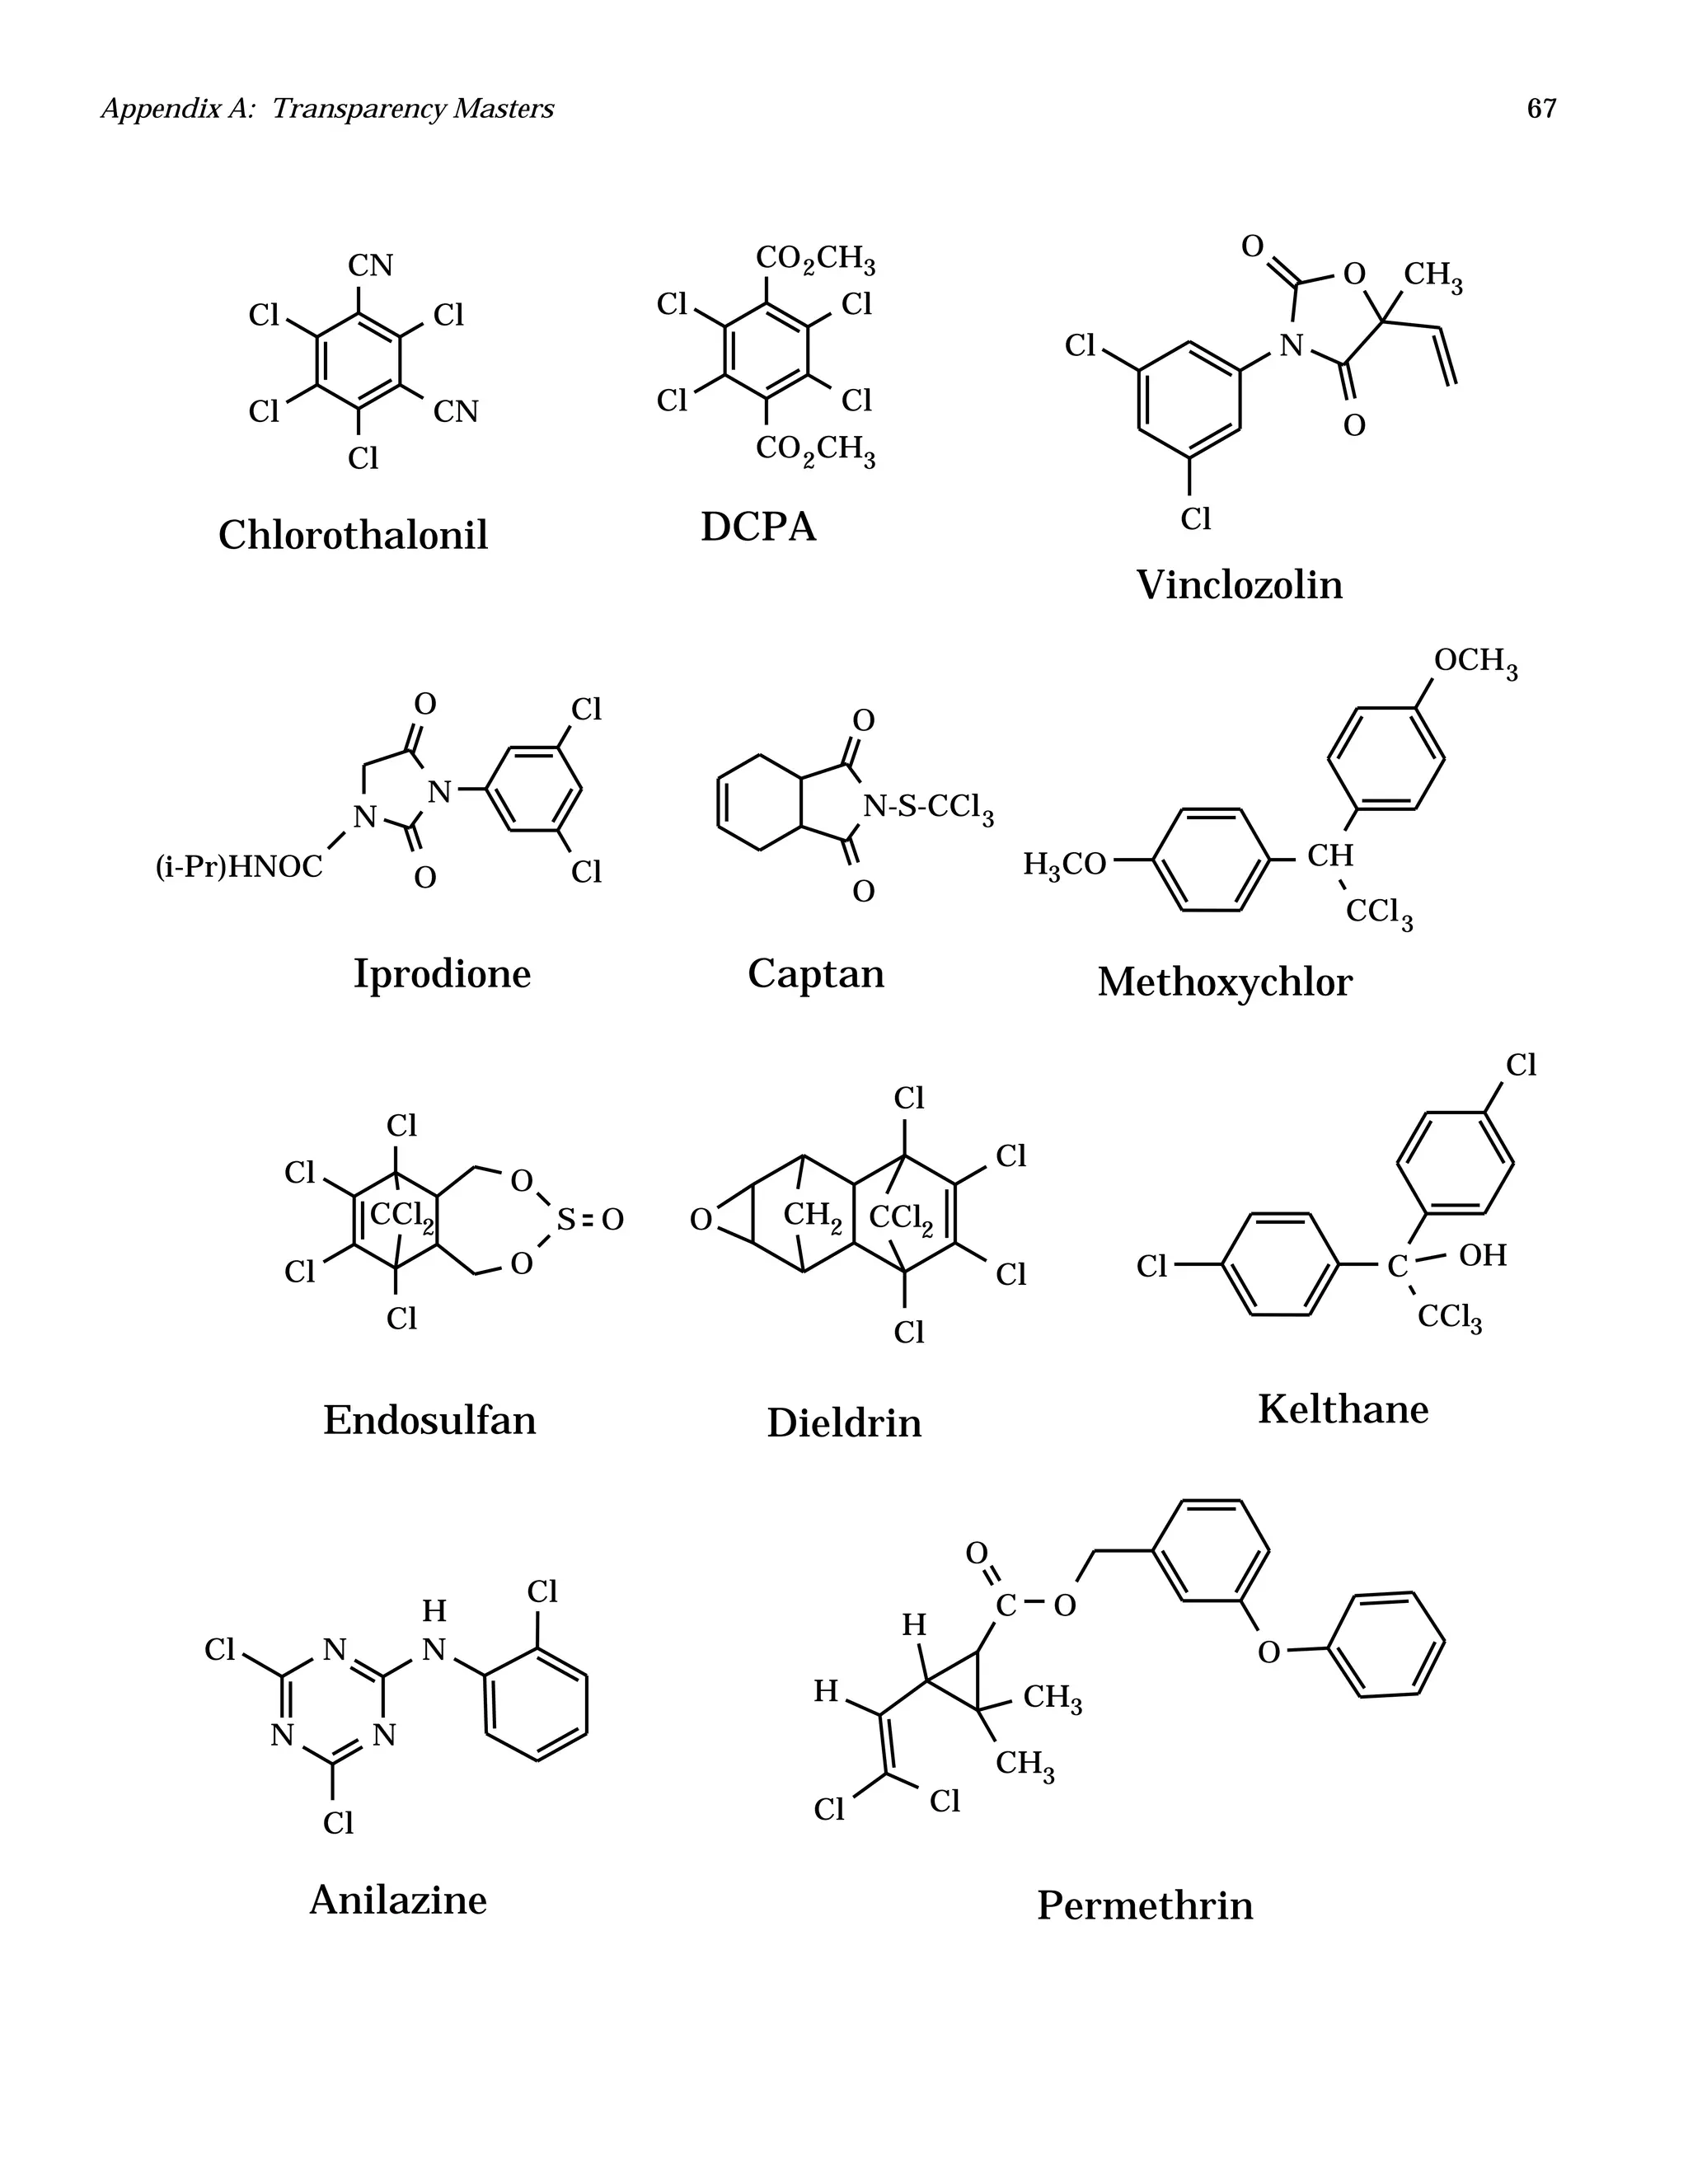
Organochlorine Pesticides in
Fruits and Vegetables
Instructor’s Manual
Susan E. Kegley
Organochlorine Pesticides in
Fruits and Vegetables
Instructor’s Manual
Organochlorine Pesticides in
Fruits and Vegetables
Instructor’s Manual
SUSAN E. KEGLEY
University of California, Berkeley
University Science Books
Sausalito, California
University Science Books
55D Gate 5 Road
Sausalito, CA 94965
FAX (415) 332-5393
univscibks@igc.org
www.uscibooks.com
Cover Art: Leigh Anne McConnaughey
Cover Design: Robert Ishi
Copyright ©1998 by University Science Books
Reproduction or translation of any part of this work beyond that permitted by Sec-
tion 107 or 108 of the 1976 United States Copyright Act without the permission of
the copyright holder is unlawful. Requests for permission or further information
should be addressed to the Permissions Department, University Science Books.
This work was supported by a grant from the National Science Foundation,
#USE-9156123, the Perkin-Elmer Corporation, and the Hewlett-Packard Corpora-
tion.
ISBN: 0-xxxxx
Contents
Introduction
Learning Goals for Students 2
Logistics 3
In What Courses Could the Module Be Used?
Suggested Schedule
Materials and Instrumentation
Risk Assessment and Solubilities of Organic Compounds
Reading in Laboratory Manual
Time Required
Pre-Lab Discussion
Risk Assessment 4
Solubilities of Organic Substances
Experimental Design 5
Flow of Lab 6
Safety Considerations 6
Waste Disposal 6
Sample Flow Chart for Pesticide Extraction
Answers to the Risk Assessment Exercise
Answers to Post-lab Questions 9
Stockroom Prep: Organic Solubilities 11
Extraction of Pesticides From Produce 12
Reading in Laboratory Manual 12
Time Required 12
Before Lab 12
Pre-Lab Discussion 12
Solvent Extraction 12
Supercritical Fluid Extraction 13
Using a Surrogate Spike 13
Issues of Contamination 14
Flow of Lab 14
viii Contents
Techniques and Safety 15
Waste Disposal 15
Answers to Post-Lab Questions, Week #2 15
Stockroom Prep: Pesticide Extraction 17
Instrument Prep: GC Analysis 20
Instrument Setup 20
Preparation of Pesticide Standards 22
Preparation of Surrogate Standards 25
Conditioning of the Column and Preparation of the ECD 26
Using an MSD with Single Ion Monitoring (SIM) 28
Troubleshooting Guide for GC Analysis 28
Instrument Prep: SFE Extraction 30
Data Analysis and Debate Preparation
Reading in Laboratory Manual
Time Required
Before Lab 11
Pre-Lab Discussion
Gas Chromatography
Interpreting a Chromatogram 31
Method Detection Limits and Tolerance Levels 32
Data Analysis 32
Calculations
Results and Discussion 3232
Preparing Students for the Pesticide Debate 34
Flow of Lab 34
The Great Debate
Reading in Laboratory Manual
Time Required
Before Lab 11
Flow of Lab 36
Potential Problems and How to Handle Them 38
Handout for Peer Grading
The Report
Reading in Laboratory Manual
Answers to Post-Lab Questions
Grading Keys 39
Appendix A: Overhead Transparency Masters
Appendix B: Evaluation Data on the Debate
Introduction 1
INTRODUCTION
This module presents concepts related to structure/solubility relationships of
organic compounds, risk assessment, gas chromatography, biodegredation,
bioaccumulation, and organic extraction techniques. At the end of the module, students
use the data collected by the class to write up a full report on the risks and benefits of
pesticides in the food supply and/or debate the issue of pesticide use on our food supply.
The full module can be carried out in four weeks, which includes one laboratory period
for the debate on the use of pesticides in the food supply. Alternatively the instructor
may choose to shorten the module by eliminating the debate or lengthen it by having
students optimize the GC method of analysis.
This instructor’s manual is provided to help someone new to pesticide analysis
get started with this module. The following information is provided:
• Guidelines for material to be covered in the pre-lab lecture
• Suggested flow of lab
• Safety precautions
• Waste disposal
• Stockroom prep lists
• Suggested instrument procedures for setup and troubleshooting
• Answers to lab questions
• Example data
LEARNING GOALS FOR STUDENTS
At the beginning of the module, it is important for you, the instructor, to present
your students with a guide to what they should expect to have learned by the end of the
module. This helps students gauge their progress and clarifies the important concepts
covered by the module.
By the end of this module, General and Organic Chemistry students should
have gained the following:
• An understanding of the solubility properties of organochlorine compounds and
how the process of extraction works.
• An understanding of the basic principles of gas chromatographic analysis of
organic compounds.
• Skepticism when interpreting computer-generated data.
• An introduction to the use of internal standards to gauge the percent recovery of
extractables.
• An understanding of how risk assessment is carried out, including the
complexities and vagaries of human perceptions of risk.
• An understanding of the problems and benefits associated with pesticide use
and the difficulties inherent in regulating pesticides.
Upper-Level Analytical students should, in addition, have gained the following:
2 Instructor’s Manual
• A detailed understanding of gas chromatography as used in the analysis of
organochlorine compounds, including the advantages and disadvantages of
different detector systems, designing temperature programs to maximize
accuracy and efficiency of the analysis, and the determination of response ratios.
LOGISTICS
In What Courses Could the Module Be Used?
This module can be used at a variety of levels throughout the undergraduate chemistry
curriculum
General Chemistry
This module has been tested for seven semesters in a first semester general
chemistry course at the University of California, Berkeley in special laboratory sections
focusing on environmental chemistry. The experiments have been carried out
successfully by students with a wide range of abilities, not just honors chemistry
students. The rationale for teaching it in the first semester of freshman chemistry is
based on the fact that it provides a broad range of students with evidence of the utility
and importance of chemistry in our society. The major disadvantage of doing the
module this early in the curriculum is students have had less exposure to some of the
concepts and techniques presented. Equipment limitations might make it difficult to do
this module at institutions with large (>350 students) general chemistry classes.
Creative scheduling and/or use of more than one GC could circumvent this issue. In
general, the response of freshmen to this module has been overwhelmingly positive.
Organic Chemistry
The module could also be used for an organic laboratory course, and is arguably
better placed in a course where structure/solubility relationships, extraction
techniques, and gas chromatography are more traditionally covered.
Suggested Flow of the Module for General and Organic Chemistry
Week #1: Organic solubilities and risk assessment
Week #2: Extraction of pesticide residues from produce
Week #3: Data interpretation, data entry, and debate preparation
Week #4: Pesticide debate
Instrumental Methods of Analysis
This module also works well in an upper level instrumental methods of analysis
course and has been tested in this course three times at the University of California,
Berkeley. With more advanced students, instructors are able to delve deeper into the
theory and practice of gas chromatography. Students could determine response ratios
and retention times for different pesticides and design their own temperature program
that permits separation of all components of a pesticide mixture. They could then test
the extraction efficiency of selected pesticides by processing a spiked sample. More time
would need to be allotted for method development, but other parts of the experiment,
such as the debate, could be trimmed if desired.
Suggested Flow of the Module for Upper-Level Analytical Chemistry
Week #1: Determination of retention times and
response ratios of selected pesticides.
Week #2: Development of an appropriate temperature program for optimum
separation and quantification of pesticide residues.
Week #3: Extraction of pesticide residues from produce to determine
Introduction 3
extraction efficiency for selected pesticides.
Week #4: Data interpretation, risk assessment.
Materials and Instrumentation
All materials and equipment not normally found in a chemistry stockroom are
listed in the Stockroom Preparations sections with a source, catalog number, and
approximate price. It is assumed that students have access to balances and the usual
collection of flasks, beakers, clamps, etc. in their lab locker.
Analysis of organochlorine pesticide residues at trace levels requires a gas
chromatograph with an electron capture detector. Alternatively, a mass spectrometric
detector using single ion monitoring (SIM) techniques can be used with similar results.
All development work was carried out using a capillary column, as recommended in the
Calfornia Department of Food and Agriculture method.1 An autosampler is highly
recommended, particularly if class size is large. If an autosampler is available, up to
175 samples can be run in a week. If students work in pairs, a total of 350 students
could easily do the experiment. Creative scheduling, where students rotate through
several modules during the semester, would allow even larger classes to carry out the
module. Alternatively, more than one GC could be used.
If a GC with an ECD/MSD or autosampler is not available at your institution
and you would like to do this module, it might be worth considering the submission of
a proposal to the National Science Foundation’s Course Curriculum and Laboratory
Improvement (CCLI) program (http://www.nsf.gov). Perkin-Elmer and
Hewlett-Packard make excellent capillary instruments. Autosamplers and ECDs can
usually be retrofitted onto existing instruments. The typical cost of an autosampler is
~$10,000 and an ECD is ~$3,000.
If you wish to carry out the supercritical fluid extraction process, you will need
a supercritical fluid extraction system. An easy-to-use commercial system is the
Hewlett-Packard 7690T, available for ~$50-60K, depending on options. Be aware that
with all SFE systems, you will likely need to spend a great deal of maintenance time to
keep the instrument running well.
1. California Department of Food and Agriculture, Division of Inspection Services, Chemistry
Laboratory Services Branch, Pesticide Residue Program, Multi-Residue Pesticide Screens, Jan. 27,
1988.
4 Instructor’s Manual
RISK ASSESSMENT AND ORGANIC SOLUBILITIES
On the first day of the module, it is important to set the stage for the entire 3-4-4
weeks of lab work. The first week focuses on the subtleties of risk assessment and
structure/solubility relationships of organic compounds. In addition, the students will
plan their experiment by creating a question they wish to know the answer to, then
designing their produce sampling plan to best answer the question.
Reading in Laboratory Manual
Laboratory Protocols and Safety: pages 3–6
Solubility of Organic Compounds: pages 20–29
Pre-lab Questions: page 25
Experimental Design: page 36
Risk Assessment: pages 64–74
Time Required
• Risk Assessment: 30-40 minutes
• Solubility of Organic Compounds: 1.5-2 hours
• Experimental Design: 20-30 minutes
Pre-Lab Discussion
Begin by spending a few minutes introducing the topic of pesticides in our
environment. The structures of the pesticides analyzed for in this module are on page
13 in the text of the module. A transparency master of the pesticide structures is
included in the Appendix to this Instructor’s Manual. Points to bring out in your
general overview are:
• The experimental techniques used in this module allow the detection of
organochlorine pesticides, which are more long-lived than organophosphates
(e.g., malathion) or carbamates (e.g., Sevin).
• Organochlorine pesticides are not very water soluble, so are not easily removed
by washing produce.
• Organochlorine pesticides do not biodegrade readily. They often bioaccumulate
in natural systems. Be sure to define biodegradation and bioaccumulation.
• Chronic, long-term exposure to organochlorine pesticides has been associated
with an increased risk of cancer, as well as reproductive disorders that are
thought to be due to the estrogenic effects of these pesticides. See the student
manual for more information on these effects.
Solubility properties of organic compounds can be related to the issue of risk
assessment by emphasizing how differences in the structure, and therefore solubility,
of organic compounds provide the chemist with an easy way to separate pesticide
residues from produce and allow for the determination of the exposure received by the
average person.
Risk Assessment
The main points of how risk assessment is done should be presented briefly.
Discuss the methods used to construct a dose-response curve (animal tests, bacterial
Risk Assessment and Organic Solubilities 5
tests, and epidemiological studies), and talk about perception of risk. Some additional
reading on risk assessment can be found in the following books:
1. Environmental Epidemiology and Risk Assesssment, Tim Aldrich and Jack Griffith,
Van Nostrand Reinhold (New York, 1993), pp. 212-237.
2. Principles of Environmental Toxicology, Sigmund F. Zakrzewski, American Chemical
Society (Washington, DC, 1991), pp. 11-25.
Students’ task for this part of the experiment is a writing assignment, where
they answer the questions on page 74 in the student manual. This assignment is a good
place to have students work in groups to discuss possible answers, but it is best to have
the expectation that each student do his or her own writing.
Because most of the answers are either in the reading or are an interpretation
on the part of the student, this part of the experiment could also be a pre-lab exercise
that students turn in when they arrive in class or lab. Once students have turned in
their answers, it is helpful to discuss the answers with the entire class. Use the
examples on pages 71-73 to get the students to discuss how the perception of risk often
governs people’s behavior.
Solubilities of organic substances
Introduce the concept of organic extraction in the context of thinking about how
it is possible to isolate a substance from a solution without getting too many other
components with it. Some everyday examples of extraction the students will likely be
familiar with include coffee from coffee beans, tea from tea leaves, proteins and flavor
molecules from chicken bones, and spice extracts (vanilla, almond, etc). This part of the
module provides an opportunity to discuss polarity, dipole moments, intermolecular
forces, Lewis dot structures, and electronegativity. The old adage like dissolves like will
be helpful for the students, but they should understand why that phrase is true.
(see the lab manual on Organic Solubilities for more detailed background). The
following demonstrations are helpful in presenting the concepts.
DEMONSTRATION: The bending of water
Materials required
• Two 50 mL burets, one full of water and the other full of hexane. Attach both
burets to the same buret clip and have two wide diameter pans below the
burets to catch wide-ranging drips. Label the burets as to their contents with
labels that are large enough to be visible from the back of the room.
• One inflated balloon.
• A dark background in place behind the burets.
Procedure
Draw the structures or provide molecular models of water and hexane that
clearly show the geometry around the atoms. Ask students to determine the
expected polarity of each substance.
Demonstrate the polarity of water and the non-polarity of hexane by rubbing the
balloon on your head (or have a student do it if you lack the hair!), then open the
buret of water and bring the balloon close to the stream of water. The water will
bend strongly towards the negatively charged balloon. (See “Why does a Stream
6 Instructor’s Manual
of Water Deflect in an Electric Field?” by G.K. Vemulapalli and S.G. Kukolich, J.
Chem. Ed., 1996, 73, 887 for a detailed explanation of the phenomenon). Try not
to let the balloon get wet---once it’s wet, the charge on the balloon is quickly
neutralized.
Do the same with the hexane and you will observe no bending of the stream of
liquid. Because hexane is not polar, there is no way to induce charge asymmetry
in a collection of non-polar molecules.
DEMONSTRATION: Predicting solubilities of organic substances in water
Materials required
• 5 labeled scintillation vials, half-full with the following solvents: acetone,
hexane, methanol, methylene chloride, acetonitrile
• iodine crystals and a spatula
• salt (NaCl)
Procedure
Draw the chemical structures of these solvents up on the board or put them on
the overhead projector (Transparency Master is available in the Appendix in this
instructor’s manual). Ask the students to make predictions about which
compounds will be water soluble. Take a poll, tallying the predictions under each
structure. This should happen with some discussion, i.e., ask students why they
are predicting the result they are. This is a good opportunity to have them think
about electronegativities of different atoms and the effects of electronegativity on
the distribution of electrons in a molecule and its resulting polarity.
Add a speck of iodine to each solvent (for color), then fill the vial the rest of the
way with water and let them see if their predictions hold. Add salt to the
acetonitrile/water mixture and you will see the (now very polar) water separate
from the acetonitrile to form two distinct layers. Emphasize that this is the
procedure that will be used in the pesticide extraction to first dissolve all soluble
compounds, then drive the non-polar pesticides into the acetonitrile layer, away
from other impurities that are water soluble.
Finish by summarizing the effects of polar groups on the water solubility of chemical
substances. Have students think about the need for using a fairly non-polar solvent to
extract pesticide residues from produce by showing the structures of the pesticides
being extracted (Transparency Master available). Emphasize “Like dissolves like.”
Experimental Design
Students will need to come up with a question about pesticides in the food supply
they wish to answer with their experiment, then decide the produce they will need to
buy to answer the question. Give students about 10 minutes to discuss ideas in a group
of 4-5 students, then open the discussion up to the class as a whole so the groups can
share their ideas and decide on the one question they wish to answer. The instructor
should guide this discussion and keep students from planning to do more than is
feasible. The biggest mistake students make here is changing too many variables at
once. This is a problem in pesticide analysis because the distribution of a pesticide on
fruits or vegetables is not at all uniform. Because of this fact, it is necessary to have as
many replicate samples as possible if the object of the study is to find out, for example,
whether processed spinach (frozen, canned) has different concentrations of pesticides
than fresh spinach. Students could also decide to analyze a wide variety of produce to
Risk Assessment and Organic Solubilities 7
assess the extent of possible pesticide exposure from a typical adult or child diet. Be
careful in interpreting results here---you really need more than one sample to draw
any kind of conclusion about pesticides in the food supply. Be sure students think about
this as they plan their experiment.
The list of eligible produce is on p. 36 in the module text. Remember that citrus
fruits and members of the cabbage family (broccoli, cauliflower, cabbage, brussel
sprouts) cannot be analyzed by this method due to the presence of compounds that
interfere with the ECD. Carrots usually give some interfering peaks on the
chromatogram as well. Remember that students will work in pairs, so this limits the
number of different samples students can analyze to half the number of students in the
class. Produce that most commonly contains detectable organochlorine pesticide
residues includes grapes, spinach, strawberries, blueberries, peaches, nectarines, and
plums. Less commonly, “hits” are obtained on apples, cucumbers, lettuce, tomatoes,
potatoes, and squash.
Creating a flow chart for the extraction lab
If you have additional time in the lab on this day, providing time for students to
work with their partners to plan their work on the pesticide extraction helps immensely
in increasing the students’ efficiency during the week of the (long) extraction
experiment. Have them create a flow chart plan for the extraction, paying particular
attention to division of labor in the parts of the experiment partners do together. A
sample flow chart is shown on the next page. This exercise could also be assigned as
homework, but you should emphasize that it is critical for them to really do it.
Flow of lab
It is best to have students do the risk assessment writing exercise first, before
they get involved in the details of carrying out the solubility tests. Students should
work in pairs for the solubility tests. They should be encouraged to make copious notes
on their observations to facilitate answering the post-lab questions. Planning the
experiment should be done at the end of the laboratory period.
Safety Considerations
Students should be aware that they will be working with flammable solvents.
Remind them of the fire extinguisher and fire blanket locations and be sure there are
no sources of open flames or sparks in the laboratory. Aniline should be kept in a fume
hood. Provide rubber gloves for students to use in this experiment.
Waste Disposal
This experiment generates about 50 mL of organic waste per pair of students,
assuming they clean their test tubes with acetone. Some of the waste will contain the
halogenated solvent methylene chloride. Have students place this waste in a separate
container and do not mix it in with the other components, so only a small amount of the
waste will need to be disposed of as halogenated waste.
8 Instructor’s Manual
Sample Flow Chart for Pesticide Extraction
Find your partner (P1, P2)
Partner 1 does this Partner 2 does this
Wash the essential glassware
for cutting up the produce and
getting it in the blender.
Prepare the glass wool/powder funnel
setup. Add 15 g NaCl to sep funnel and
have the setup ready to receive the
blended mixture
Have TA add surrogate.
Load into blender.
Add CH3CN and blend for 5 min.
Clean the remaining glassware,
including the sep funnel
Pour blended mixture through
the glass wool into the sep funnel
Wash blender for the next pair
to use.
Shake the sep funnel to mix the
NaCl with the acetonitrile/
produce mixture
Allow mixture to stand for 30 min.
While waiting, clean tray.
Note: After this point, both
partners are doing the same thing
Cut up produce and weigh out 50 g
Prepare the blender (clean and foil
on the top). Hand off to P2.
Pipet 10 mL of the acetonitrile layer into a small beaker.
Evaporate to dryness using N-evap.
While waiting, set up Florisil column
Rinse column twice, once with 10:90 Acetone:Hexane
and once with pure hexane
Rinse beaker, once with pure hexane, then twice w/10:90 Acetone:Hexane. Pour
rinsings through the column and collect them in a beaker.
Rinse the column twice with pure hexane, collect rinsings in the same beaker.
Evaporate to < 5 mL using N-evap. Transfer to 10 mL grad cylinder and rinse beaker,
transferring rinsings. Dilute or evaporate as necessary, until sample volume is 5.0 mL.
Transfer to septum-capped vial and prepare GC sample for analysis.
Risk Assessment and Organic Solubilities 9
Answers to the Risk Assessment Exercise
1) List as many possible routes of exposure to pesticides as you can think of for an adult
human and for a 2-year-old. Consider all forms of pesticides, not just food-use pesticides.
Adult
• Ingestion of pesticides on food and in drinking water
• Inhalation or ingestion of pesticides while applying them in the home or garden
• Inhalation or ingestion of pesticides while applying them during work (home
pest control, agriculture)
• Inhalation or ingestion of pesticides from spray drift if the person lives near an
agricultural area
• From animal flea collars, foggers, and dip treatments
Two-year-old
• Ingestion of pesticides on food and in drinking water. This may be more of a
problem with children because they tend to eat a less varied diet and they eat
and drink more than adults on a per kilogram basis.
• Inhalation or ingestion of pesticides from spray drift if the person lives near an
agricultural area
• From touching animal flea collars and treated fur, then putting hands in mouth
• From crawling around in a yard that has been treated with lawn-care pesticides,
then putting hands in mouth
• From crawling around on the floor of a house that has been fumigated for ants,
roaches, termites, etc.
• From the clothes and hands of a parent who has been applying pesticides
2) If you eat a salad made with lettuce, carrots, and walnuts that have each been sprayed
with a different type of pesticide, what factors would you need to take into consideration
in order to estimate how much of each pesticide you actually ingest with this salad?
• how much of each vegetable you ate, in grams
• the average concentration of the pesticide typically found on each vegetable
Other factors you might wonder about include:
• How toxic are the pesticidse?
• Do the different pesticides have synergistic effects that might amplify the toxic
effects?
3) Consider the following statement by Lombardo and Yess
2
about weighing the risks
and the benefits of pesticide use:
“The concept of relative risk is a difficult one to communicate to
the general public. Benefits are usually expressed in economic terms
and are perceived as an advantage to business interests, while risks
are expressed in life span, injury, or other physiological
2. “The Food and Drug Administration Program on Pesticide Residues in Food,” P.Lombardo
and N.J.Yess, Pesticide Residues and Food Safety, B.G.Tweedy, H.J. Dishburger,
L.G.Ballantine, and J.McCarthy, eds., American Chemical Society (Washington, DC, 1991),
p. 168.
10 Instructor’s Manual
consequences that have emotional connotations and can be related
to individual concerns. Economic benefits to the consumer from
pesticide use in terms of a higher quality, more abundant, cheaper
food supply have apparently not been effectively communicated.
“Despite the fact that the U.S. population is now the longest lived
and best protected in history, the overall perception by most
Americans is that they face more risks today than ever before and
that the risks will continue to increase in the future.”
In the context of the reading in the section above, what do you think might be going on
in the minds of the American people that would make them feel this way? Write a half
page or so to explain your reasoning in some detail.
Students should mention issues related to how different people perceive risk,
regardless of the actual risk. They can also discuss the “risk-dread” diagram in the
context of the fear of the unknown that most people have and comment on the
uncertainty of the long-term effects on human health of the ingestion of small amounts
of pesticides.
Answers to Post-Lab Questions
1) From a first glance at the structure and composition of methylene chloride, students
might readily predict that methylene chloride is not soluble in hexane and is soluble in
water. The two electronegative chlorine atoms bound to carbon create bond dipoles and
a net molecular dipole, thus making methylene chloride a polar molecule. The results
of the solubility tests will provide them with a real observation that methylene chloride
is soluble in hexane. They are then left with the task of rationalizing this observation.
What must be true is that the intermolecular forces between hexane molecules and
methylene chloride molecules must be strong enough to overcome the intermolecular
forces between methylene chloride molecules. The apparent paradox can be explained
by noting that while chlorine is quite electronegative, it is large and polarizable, which
reduces its tendency to concentrate charge in one area of the molecule.
2) Ammonia is more water soluble than triethylamine for two reasons:
a) It can act as both a hydrogen bond donor, with an unshared pair of electrons, and a
hydrogen bond acceptor, with the three hydrogens bound to the electronegative
nitrogen.
b) Triethylamine has three very non-polar ethyl groups, rendering a significant fraction
of the molecule hydrophobic. It is thus energetically unfavorable for triethylamine to
participate in molecular interactions with water molecules.
3) Benzoic acid is insoluble in acid, but soluble in base. The equation for the dissolution
reaction is:
C
O
O
benzoic acid
+ OH-
+ H2O
C
O
-
O
H
Risk Assessment and Organic Solubilities 11
Aniline is insoluble in base, but soluble in acid. The equation for the dissolution reaction
is:4) Predict that phenol will be soluble in 6 M NaOH, pyridine will be soluble in 6M
HCl, and cyclohexane will be insoluble in both.
5) The following compounds would be able to participate in hydrogen bonding with
water:
acetone H-bond acceptor
benzoic acid H-bond donor, H-bond acceptor
oleic acid H-bond donor, H-bond acceptor
acetonitrile H-bond acceptor
glucose H-bond donor, H-bond acceptor
aniline H-bond acceptor
Note that the ability to participate in hydrogen bonding with water does not guarantee
water solubility. Molecules with an extensive hydrocarbon portion (oleic acid, aniline,
and benzoic acid) are non-polar and will not dissolve appreciably in water.
NH2
aniline
+ H3O
+
NH3
+
+ H2O
O
H
+
-
OH
O
-
+ H2O
N
+ H3O
+
N
H
+ H2O
12 Instructor’s Manual
STOCKROOM PREP: ORGANIC SOLUBILITIES
This stockroom preparation list applies to a room of 25-30 students working in pairs.
Have gloves available for students to use.
In the hood
100 mL dropper bottles of these liquids:
• acetone
• hexane
• methylene chloride
• acetonitrile
• corn oil
• aniline
500 mL bottles of these solvents:
• hexane (cheapest grade possible)
• acetonitrile (cheapest grade possible)
3 dropper bottles (100 mL size) of 6 M NaOH
3 dropper bottles (100 mL size) of 6 M HCl
pH paper, range 1-12
Wash bottles of acetone for washing test tubes
Near balances
Small bottles (< 100 g size) of the following solids:
• glucose
• benzoic acid
Waste Containers
• 1 L waste container labeled "Organic Waste---NO methylene chloride"
• 500 mL waste container labeled “Methylene chloride waste ONLY”
Extraction of Pesticides From Produce 13
EXTRACTION OF PESTICIDES FROM PRODUCE
In this part of the module, students will extract pesticide residues from the
produce they have chosen to analyze. The organic solubilities lab should have prepared
them to think about why pesticides are more soluble in organic solvents than in water.
Reading in Laboratory Manual
Organochlorine Pesticides: pages 9–18
Fundamentals of Extraction: pages 30–43
Supercritical Fluid Extraction (if your class is doing this): pages 44–50
Prelab Assignment: page 34
Review
Solubility of Organic Compounds: pages 20–29
Time Required
• Pesticide extraction: 3 hours
• NOTE: This is a long experiment and there is no good place to stop in the
middle. The best way to get through it in a reasonable period of time is to do
whatever you can to have students get organized ahead of time. The flow
chart (part of the prelab assignment) is quite effective in requiring students
to plan their lab work before they come into lab. You could also tell them to
bring dinner if they don’t read ahead. (This is usually quite effective in
encouraging them to prepare!)
Before Lab
Go shopping for some interesting fruits and vegetables in case the student
responsible for shopping forgets to go. Alternatively, call and remind the student
assigned to the task.
Be sure the GC is fully functional. See the Instructor’s Manual section on
preparing the GC for the experiment and plan to have the instrument ready about a
week ahead of time, just in case something doesn’t quite work as planned.
Pre-lab Discussion
The instructor should re-emphasize structure/solubility relationships and
remind the students of the purpose of the lab: to extract and quantify pesticide residues
on produce with the intent of determining the average exposure consumers receive.
Solvent Extraction
Extraction should be presented in the context of separating pesticide residues
from the vegetable matter in a form that can be analyzed. Show the structures of some
organic solvents on the board (draw out the structures---hexane, methylene chloride,
acetonitrile, water), then have the students look at the structures of the pesticides they
will test for on p. 13 in the module text and determine which solvent would be the best.
There is no right answer for this question because the compounds have very different
structures, but this exercise provides a good lead-in for reminders about polarity,
electronegativity of elements, hydrogen bonding, and like-dissolves-like. Methylene
chloride is probably the solvent that will best dissolve most of the chlorinated pesticides
shown (like dissolves like); however, it is more hazardous to work with and more
expensive to dispose of than a more benign solvent like acetonitrile, the solvent actually
14 Instructor’s Manual
used in the experiment. Methylene chloride is also inappropriate because it dissolves
too many of the polar compounds found in fruits and vegetables, which results in a very
messy chromatogram.
Supercritical Fluid Extraction
If you have access to a supercritical fluid extraction system, it is a nice
comparison to have students run their samples using both extraction methods and then
compare the results. The SFE process doesn’t take much more time and can easily be
fit into the 30 minute waiting period while students wait for the acetonitrile/water
layers to separate. More advanced students can tinker with the extraction conditions to
optimize the extraction for different pesticides.
Depending on the level of the class, the pre-lab discussion on SFE can touch on
one or more of the following:
• Phase diagrams and the theoretical basis for supercritical phenomena
• The flexibility of SFE for fine tuning extraction conditions
• Advantages and disadvantages of SFE vs solvent-based extractions
Using a surrogate spike
The use of an internal standard (the word surrogate is often used preferentially
but interchangeably in environmental labs) to measure extraction efficiency is an
important concept in environmental chemistry. In short, the surrogate provides
information on the efficiency of the extraction by adding a compound of similar
solubility characteristics to the mixture before extraction, then measuring the percent
of the compound recovered from the sample. The two compounds tetrachloro-m-xylene
(TCMX) and decachlorobiphenyl (DCBP) are used as the surrogate compounds to help
estimate the recovery of pesticides from the extraction process. The major limitation of
using these particular substances as surrogates is that they are not very similar in
structure or boiling point to some of the pesticides. In practice, the results show that
many students evaporate off the TCMX (and probably the lower-boiling pesticides as
well) in the step in which solvents are removed using the nitrogen evaporator. Student
recovery of the DCBP is usually higher than recovery of TCMX by at least a factor of
two.
Issues of contamination
Because the ECD is such a sensitive detector, it is important to keep potential
sources of organic contaminants to a minimum. Solvents will dissolve contaminants
from plastics (pipet tips, plastic bags), rubber (latex pipet bulbs or gloves, rubber
CH3
Cl
CH3
Cl
Cl
Cl
Tetrachloro-m-xylene
TCMX
Cl Cl
ClCl
Cl
Cl Cl
Cl
ClCl
Decachlorobiphenyl
DCBP
Extraction of Pesticides From Produce 15
washers on blenders, rubber stoppers), vinyl (gloves), and stopcock grease. Teflon is the
only non-contaminating plastic. The instructor should ensure that all separatory
funnels have teflon stopcocks and that no grease is used in preparing the separatory
funnels. If you have access to a machine shop, have them make teflon washers for the
blenders. The students must be aware of potential sources of contamination and take
special precautions to avoid contact of the extract with plastics or rubber. It is wise to
make an extract of each contaminant that might possibly be encountered and run it
through the GC to show the students the potential problems and to help them interpret
the impurity peaks that may show up in their chromatograms. Make transparencies of
the impurity chromatograms (or post the chromatograms in the lab room) to show them
to the students before they begin their work so they know the importance of being
careful. To make these contaminant extracts, simply place the object (rubber gloves,
rubber stoppers, Pasteur pipet bulbs, blender washers, blender caps, etc.) in a small
beaker of 10% acetone: 90% hexane (or even just pure hexane) for about 30 seconds.
Obtain the chromatogram of these extracts using the same GC conditions as for the
pesticide samples and standards.
Flow of lab
The pre-lab lecture should be as short as possible. This is a long experiment and
there is no good place to stop in the middle. Students work in pairs, using the blenders
on a first-come, first-serve basis. While waiting 30 minutes for the acetonitrile layer to
separate from the water layer, or while waiting for solutions to evaporate, students can
take a tour of the GC to see how it works or, if you plan to also do an SFE extraction,
students can load their extraction thimbles during this time.
Techniques and safety
1) If students have not used a separatory funnel in their prior experiments, the
instructor should demonstrate how it works. Show students how to vent the separatory
funnel, reminding them to hold the stopper on when they turn it upside down.
2) The instructor should add the surrogate compound to each person's sample, using a
gas-tight microliter syringe. Be sure to wash the syringe with acetone (4-5 times) at the
end of the day.
3) The most important safety concern for this experiment is the mixture of flammable
solvents and sparks generated by blender motors. In the lab room, the blenders should
be set up in a geographically different location than the solvents. While we have never
had a fire during this experiment, the instructor should know where the fire
extinguisher is and not hesitate to use it.
Waste Disposal
This experiment generates about 250 mL of waste per pair of students. Students
should be encouraged to dispose of any acetonitrile/fruit/ vegetable/water/ acetone
waste in a separate container from the waste containing hexane. In some areas, water
soluble solvents such as acetonitrile and acetone can be drain-disposed in small
quantities. Check your local regulations.
16 Instructor’s Manual
STOCKROOM PREP: PESTICIDE EXTRACTION
This stockroom preparation list applies to a room of 25-30 students. Suppliers and
catalog numbers for non-standard items are included here.
In one hood: Solvents
• Acetonitrile, Pesticide-grade (Fisher Scientific, catalog # A999-4)
Four 500 mL bottles
• 10% acetone:90% hexane (volume %), Pesticide-grade
Two 500 mL bottles
• Hexane, Pesticide-grade (Fisher Scientific, catalog # H300-4)
Two 500 mL bottles
• Acetone, Pesticide-grade (Fisher Scientific, catalog # A40-4), put out in teflon
wash bottles (Fisher Scientific, catalog # 03-409-12A).
NOTE: All solvents should be put out in 500 mL glass bottles so they are easy to pour.
Before the first use, the bottles should be cleaned and allowed to dry completely, then
rinsed with Pesticide or Optima grade acetone. Labels should instruct students to never
NEVER stick any implements (pipets, etc.) into the bottles of clean solvent and never
NEVER pour solvent back into a bottle of clean solvent.
SUPPLIERS: Pesticide or Optima™ grade solvents can be ordered from Fisher
Scientific. Although Optima™ grade is the highest quality, the cheaper Pesticide-grade
solvents have never caused us any problems with contamination. The teflon wash
bottles are essential because of contamination by the plastic from a normal wash bottle.
Teflon wash bottles are also available from Fisher Scientific (Catalog # 03-409-12A).
In a second hood: Blenders
• 5 blenders, with teflon washers if possible (machine shop can make these)
NOTE: If there is limited hood space, the blenders should be the first choice of
equipment and/or supplies to put in a hood. If there is a fire caused by blender sparks,
at least it will be localized in a small, contained, non-flammable space. Be sure no
flammable materials (paper, Kimwipes, waste bottles, etc.) are in the hood with the
blenders.
SUPPLIERS: Blenders can be purchased for a very reasonable price from a local
discount store. There is no need to purchase them from a more expensive scientific
supply house. Just be sure to purchase glass blenders (not plastic!) and wrap the plastic
tops with foil to prevent contamination from dissolving plastic. These blenders are not
spark-free, but acetonitrile is not flammable enough or volatile enough to flash at room
temperature. Just be sure you do not use these blenders with very flammable solvents
such as hexane or acetone.
In a third hood: Nitrogen Evaporator
Set up the nitrogen evaporator in a different hood. This device can be constructed from
some glass or plastic T-tubes, tygon tubing, pinch clamps, and 4-inch 16-gauge syringe
needles. Alternatively, Pasteur pipets could be used instead of syringe needles. The gas
Stockroom Prep: Pesticide Extraction 17
used does not necessarily have to be nitrogen, but does need to be clean and oil-free. If
there is a clean air supply and a hood (remember, fumes floating around in the lab are
a potential fire hazard) available at the students’ individual desks, a better solution
would be to have students construct their own evaporator, using air or house nitrogen
as the gas. All needles (or Pasteur pipets) should be cleaned with an acetone-soaked
Kimwipe before use and at the beginning and end of each lab day. Kimwipes should be
placed near the nitrogen evaporator in the hood. A hot plate under the nitrogen
evaporator that warms the water bath to just barely above body temperature (~40°C)
will speed the solvent evaporation process; however, if the water bath is too hot,
pesticide residues will volatilize, resulting in low recoveries.
In Control of the Instructor
• 15 mL of a 10,000 µg/L TCMX-DCBP surrogate spiking solution, stored in a
freezer when not in use (available from Supelco, Supelco Park, Bellefonte, PA
16823-0048, Phone: (800) 247-6628, as their PEST Surrogate Spike Mix, catalog
#4-8460M). Prepare this standard using microliter syringes and very small (10
mL) volumetric flasks.
• 500 µL gas-tight syringe for dispensing the surrogate (Fisher Scientific, catalog
#13-684-106)
Supplies and non-flammable chemicals
• 250g NaCl
• 30 Prep-Sep® Florisil™ funnels, 1 per student (Fisher Scientific, catalog # P476)
• 30 15-mL vials with teflon-coated septa, 1 per student (Fisher Scientific, catalog
# 03-393C)
• 30 2-mL GC autosampler vials with teflon-coated septa (use the supplier
recommended for your instrument). You will also need a crimping tool to seal the
caps onto the autosampler vials.
• 10 knives (cheap serrated knives from a discount store work well)
• 10 aluminum pans for chopping produce (grocery store)
• Glass wool (about a golf ball sized lump for each pair of students)
• Pasteur pipets and latex pipet bulbs
Nitrogen Evaporator
needle
large beaker on hotplate
pinch clamp
N2 in
hotplate here hotplate here hotplate here
18 Instructor’s Manual
• Latex gloves (contamination by plastics is minimized with latex gloves)
• 30 #5 one-hole rubber stoppers (very clean), fitted with a Pasteur pipet with the
end removed, i.e., no glass protruding from the stopper (see picture below), 1 per
student.
Waste Containers
• Two 1 L waste bottles labeled "Acetonitrile/acetone/fruit/vegetable waste."
• One 1 L bottle labeled “Hexane waste”
rubber stopper
glass tube
(Pasteur pipet)
Instrument Prep: GC Analysis 19
INSTRUMENT PREP: GC ANALYSIS
A capillary GC coupled to an electron capture detector (ECD) is especially
well-suited for detection of halogenated organics and is essential for the sensitivity
necessary to detect ppb levels of pesticide residues in environmental samples.
Preparing the capillary gas chromatograph for the analysis of organochlorine pesticides
should be started the week before the experiment begins. If you have not used an ECD
before, you might want to start two weeks before. The ECD is a tricky beast and
requires special handling compared to an FID or TCD. Because of the long run time
(~45 minutes), an autosampler is highly desirable for this experiment.
Instrument Setup
This analysis is best carried out using a 25 m x 0.25 mm ID fused silica capillary
column, loaded with a 0.25 µm film thickness of 5% phenylmethyl silicone. This column
is available as the PTE-5 column (catalog #2-4135M) from Supelco, Supelco Park,
Bellefonte, PA 16823-0048, Phone: (800) 247-6628, FAX: (814) 359-3044). The detector
makeup gas should be an ultra-pure mixture of 95% Ar/5% CH4 (80-100 mL/min) and
the carrier gas should be ultra-pure helium (~50 mL/min flow at split vent, 1-2 mL/min
through the column). All gases should be connected to the GC using 1/8" copper tubing
that has been pre-cleaned at initial setup to remove oils, by first rinsing tubing with
methylene chloride, then with hexane and finally methanol. The gases should be
passed through a final in-line moisture trap before entry into the GC. The output from
all GC ports (split vent, purge vent, detector vent) should be exhausted to a hood. For
maximum sensitivity, all injections should be carried out in the splitless mode using a
special splitless capillary insert available from your GC manufacturer. Most new
capillary GCs are shipped with both split and splitless inserts.
The retention times for the pesticides we tested for are given in Table 1. The
temperature program and instrument parameters for pesticide analysis are given in
Table 2. A sample chromatogram of a standard mixture is shown on page 54 in the
student manual.
20 Instructor’s Manual
Table 1: Typical Retention Times for Pesticides
on a 5% Phenylmethyl Silicone Column
Pesticide Retention time
(minutes)
Chlorothalonil 13.00
Vinclozolin 14.81
Kelthane 17.15, 30.30
DCPA 17.38
Anilazine 18.67
Captan 18.87
Endosulfan 20.23, 22.93
Dieldrin 21.47
Iprodione 29.37
Methoxychlor 30.54
Permethrin 38.28, 38.92
Table 2: Instrument Parameters for
Organochlorine Pesticide Analysis
Carrier gas He, 1-2 mL/min
Makeup gas Ar/CH4, 80 mL/min
Detector ECD
Injection port insert Splitless
Flow from split valve 50 mL/min.
Injector temperature 225°C
Detector temperature 300-350°C
Sample volume 2-5 µL
Initial oven temperature:
Ramp @ 4°C/min to:
Ramp @ 2°C/min to:
Ramp @45°C/min to:
140°C, hold 2 min.
220°C, hold 5 min.
250°C, hold 0 min.
265°C, hold 5 min.
Purge valve Off, t = 0 min.
On, t = 2 min. for the
entire run
Total run time 47 min.
Instrument Prep: GC Analysis 21
Preparation of Pesticide Standards
A variety of pesticides are available from Chem Service, 660 Tower Lane, P.O.
Box 3108, West Chester, PA 19381-3108, Phone: (215) 692-3026, FAX: (215) 692-8729.
The Chem Service catalog is a valuable resource because of its extensive
cross-referencing of trade names and common names for pesticides. For example,
Kelthane is also known as Dicofol, and DCPA is also known as Chlorthal. We worked
out the GC conditions for eleven of the organochlorine pesticides most commonly found
on produce (see Table 3).
While other pesticides may be observed in an extract, it is not critical for
students to know the identity of every peak on a chromatogram. You may choose to
make up a standard containing only a few components. If so, it is best to choose
pesticides most likely to be found on produce. These are: permethrin (spinach), captan
(grapes, berries), iprodione (grapes, berries), vinclozolin (berries), and methoxychlor
(apples). Data from a recent article from the Journal of AOAC International, Vol. 75,
1992, pp. 925-933 by H.J. Schattenberg, II, and J.-P Hsu entitled “Pesticide Residue
Survey of Produce from 1989 to 1991” is included in Appendix B at the end of the
student manual and provides a wealth of information on the occurence of pesticide
residues on produce.
Using care in handling the powdered pesticides (be sure to check the MSDS
sheets accompanying the pesticide shipment), prepare primary stock solutions of
Table 3: Pesticides Used in This Experiment with LD50 and Order Number
Pesticide Alternate Names LD50
(mg/kg)
ChemService
Catalog #
Anilazine Triazine, Dyrene®, B-622®,
Kemate®
2,710 PS-388
Captan Orthocide 406®, Vancide
89®, SR-406®
9,000 PS-25
Chlorothalonil Bravo®, Daconil 2787® N/A PS-1020
DCPA Chlorthal, Dacthal®, Rid®,
DAC 893®, Chlorthal-
Methyl®, Fatal®
3,000 PS-33
Dieldrin Compound 497®, HEOD,
Octalox®
46 PS-76
Endosulfan Chlorthiepin®, Malix®, Hoe
2671®, Thiodan®,
Cyclodan®, Beosit®,
Thimul®, Thifor®,
18 PS-81
Iprodione Rovral®, Glycophene, Chipco
26019®
3500 PS-1052
Kelthane Dicofol, DTMC®, FW 293 668 PS-82
Methoxychlor DMDT®, Marlate®,
Methoxy-DDT®,
Dimethoxy-DT®
6000 PS-83
Permethrin Ambush 430 PS-758
Vinclozolin Ronilan® 10,000 PS-1049
22 Instructor’s Manual
individual pesticides at concentrations of 1.00 g/L in Pesticide-grade acetone or
methanol (weigh 100 mg of pesticide into a 100 mL volumetric flask or 50 mg into a 50
mL volumetric flask). These primary stock solutions should be diluted with hexane
(note change of solvent) to the concentrations shown in Table 4 to give the secondary
stock solutions. Because of the volatility of the organic solvents used to prepare the
standards, gas-tight microliter syringes are the optimum method for transferring the
solutions to prepare the more dilute standards. Fisher Scientific carries the Hamilton
series 1700 syringes for volumes between 10-500 mL and series 1000 syringes for
volumes above 1 mL.
All stock solutions should be stored in a freezer in clean glass vials with
teflon-lined septum caps (Fisher Scientific, catalog # 03-393C). If the septum cap has
been perforated, replace it immediately with a new one to avoid leaching of the silicone
rubber into the solution. If stored properly, the lifetime of the 1.00 g/L standards is
several years, and that of the 5,000 and 50,000 µg/L standards is a year or so. Before
storing any standard, draw a line on the outside of the vial at the level of the solvent.
This will make it easy to spot a standard from which solvent has evaporated or spilled.
The multicomponent GC working calibration standards are prepared by
using gas-tight microliter syringes to transfer the appropriate amounts of the
secondary standards for each pesticide into a single 10 mL volumetric flask and diluting
to volume with Pesticide-grade hexane. Because the detector response for each
pesticide is different, it is essential to make up working standards that give a
comparable detector response for each component. Table 5 lists the detector response
ratio for each pesticide relative to anilazine (see p. 60 in the module text for more
information on response ratios). Table 6 provides a guide to volumes that should be
used to prepare a set of standards containing the eleven pesticides. This is only a guide,
Table 4: Preparation of Secondary Stock Solutions
Pesticide Concentration of
Secondary Stock
Solution
(µg/L)
µL of Primary
Standard Used to
Prepare Secondary
Stock Solution in a
10 mL Volumetric
Flask
Chlorothalonil 5,000 50
Vinclozolin 5,000 50
Kelthane 5,000 50
DCPA 5,000 50
Anilazine 5,000 50
Captan 5,000 50
Endosulfan 5,000 50
Dieldrin 5,000 50
Iprodione 50,000 500
Methoxychlor 5,000 50
Permethrin 50,000 500
Instrument Prep: GC Analysis 23
as your detector may have slightly different sensitivity.
Table 5: Response Ratios for Pesticides
Pesticide Response Ratio
(relative to anilazine)
Chlorothalonil 3.48
Vinclozolin 1.88
Kelthane 0.16
DCPA 2.87
Anilazine 1.00
Captan 1.19
Endosulfan I 1.67
Dieldrin 1.75
Iprodione 0.14
Methoxychlor 0.20
Permethrin (cis) 0.11
Table 6: Preparation of Working Standards
Pesticide µL of Secondary Stock
Solution in 10 mL
volumetric flask
(Standard #1)
µL of Secondary Stock
Solution in 10 mL
volumetric flask
(Standard #2)
µL of Secondary Stock
Solution in 10 mL
volumetric flask
(Standard #3)
Chlorothalonil 10 25 50
Vinclozolin 25 50 100
Kelthane 250 500 1,000
DCPA 15 35 70
Anilazine 50 100 200
Captan 30 75 150
Endosulfan 30 60 120
Dieldrin 20 40 80
Iprodione 30 75 150
Methoxychlor 50 100 200
Permethrin 50 100 200
24 Instructor’s Manual
Table 7 provides the final concentrations of the components in the working standards
prepared according to Table 6. The lifetime of the working calibration standards is 3-4
weeks, if the vials are stored in the freezer when not in use and the septum caps are
intact.
Preparation of Surrogate Standards
The surrogate used in this analysis is a mixture of tetrachloro- meta-xylene
(TCMX) and decachlorobiphenyl (DCBP), available from Supelco, Supelco Park,
Bellefonte, PA 16823-0048, Phone: (800) 247-6628, as their PEST Surrogate Spike Mix,
catalog #4-8460M. This commercially prepared primary standard is 200,000 µg/L. For
GC surrogate analysis, 20, 50, 80, and 100 µg/L standards should be prepared. This can
be done by carrying out an initial 100-fold dilution to give a secondary standard with a
concentration of 2,000 µg/L. Dilution of 100µL of the primary standard to a final volume
of 10.0 mL with hexane will provide this secondary standard. To prepare the working
standards, use the amount of secondary standard indicated in Table 8 and dilute to 10.0
mL with hexane. Use gas-tight microliter syringes (Fisher Scientific) to carry out all
transfers. While you have the concentrated surrogate solutions out, you may also want
to prepare the 10,000 µg/L surrogate spiking solution to add to the students’ samples
before processing.
Table 7: Final Concentration of Working Standards Prepared According to Table 6
Pesticide Concentration of
Components in
Standard #1
(µg/L)
Concentration of
Components in
Standard #2
(µg/L)
Concentration of
Components in
Standard #3
(µg/L)
Chlorothalonil 5 12 25
Vinclozolin 12 25 50
Kelthane 125 250 500
DCPA 8 17 35
Anilazine 25 50 100
Captan 15 32 75
Endosulfan 15 30 60
Dieldrin 10 20 40
Iprodione 150 320 750
Methoxychlor 25 50 100
Permethrin 250 500 1,000
Instrument Prep: GC Analysis 25
A representative chromatogram of the standards and surrogates is shown on the
following page.
Conditioning of the Column and Preparation of the ECD
The column must be conditioned carefully to ensure saturation of the sites on the
stationary phase and on the glass insert in the the injection port. This is done by
injecting the most concentrated standard onto the column and allowing the
temperature program to run its course. The number of times this must be repeated is
related to the age and previous use of the column and detector. If the column is new, it
will take longer to condition the system than for a previously-used column. If the
column has been sitting unused for a more than a few days, but has been previously
used for the analysis, fewer injections will be required. Best results will be obtained if
the column is reserved for pesticide analysis only. The practice of “baking out” the
column at the end of the day will drastically reduce the sensitivity of the analysis and
should not be done on a routine basis.
The ECD is quite sensitive to temperature changes and functions best if it is left
on at 300-350°C at all times, with the makeup gas flowing. Getting a good baseline after
the detector has been turned off often requires cycling the GC through the temperature
program a number of times. Conditioning of the column can be done at the same time
by injecting the highest standard and cycling through the temperature program until a
flat baseline is achieved throughout the run. With an autosampler, the easiest method
is to set up the instrument to run the conditioning standard overnight (an out-of-date,
high-concentration working standard works well for this purpose).
If the column and ECD have been used within a day or so and the instrument
has been left on in the interim, it is usually only necessary to run the conditioning
standard a few times (2-4) before analyzing real samples or standards. Interruption of
a sequence of runs by more than 2-3 hours may result in deterioration of the accuracy
of the standard curve, so it is best to run all samples with no interruption. The
mid-range standard should be run periodically between samples to ascertain the
continuing accuracy of the standard curve.
To avoid contamination of the ECD, don’t use it for other experiments where
significant concentrations of halogenated compounds are present. One shot of as little
as 1µL of methylene chloride will decommission the ECD for several days!!
Table 8: Preparation of Surrogate Standards
Working Standard
Concentration (µg/L)
Volume of 2,000 µg/L
standard to dilute to 10.0
mL with hexane
(µL)
100 500
80 400
50 250
20 100
26 Instructor’s Manual
Instrument Prep: GC Analysis 27
28 Instructor’s Manual
Using an MSD with Single Ion Monitoring (SIM)
While we did not use an MSD in our development work, people do routinely use
an MSD for detection of organohalogen compounds. Sensitivity will likely be somewhat
less than with an ECD, but can be enhanced by using the technique of single ion
monitoring, which can be programmed easily with most commercial GC-MS
instruments. The technique allows you to focus the spectrometer scan on several
high-intensity ions characteristic of each pesticide. The four most intense ions of the
pesticides analyzed in this experiment are given in Table 9 below. An advantage of this
technique is that most impurities do not show up because they do not (except by
coincidence) have fragment ions of the same mass as the pesticides. Sensitivity can also
be enhanced in the SIM analysis by tuning the MSD for maximum response in the
100-300 mass range.
Table 9: Intense Ions of Pesticides for Single Ion Monitoring by Mass Spec
a
The intensity of the peak is given in parentheses as a percentage of the base peak.
bData from Mass Spectra of Environmental Contaminants, 2nd edition, Ronald A. Hites,
Lewis Publishers (Boca Raton, FL, 1992).
c
Not available.
TROUBLESHOOTING GUIDE FOR GC ANALYSIS
There are a number of possible problems that might be encountered in any GC
analysis of trace level components. Some of them have to do with the particular analysis
and others relate only to the GC conditions. What follows is a list of common problems
and some potential solutions. If you really get stuck, you should probably call your GC
manufacturer’s technical service department.
No peaks observed when sample injected
• Check that there is enough sample in the autosampler vial.
• Check to be sure the syringe is not clogged.
• Check that the injection port insert is splitless and the split ratio is no higher
Pesticide m/z of Intense Ions in Mass Spectruma,b
Anilazine 239 (100), 241 (66), 178 (35), 143 (33)
Captan 79 (100), 77 (42), 80 (25), 149 (21)
Chlorothalonil 266 (100), 264 (85), 268 (52), 109 (30)
DCPA N/Ac
Dieldrin 79 (100), 82 (42), 81 (35), 108 (21)
Endosulfan 195 (100), 241 (80), 197 (77), 237 (70)
Iprodione 56 (100), 43 (93), 58 (61), 314 (41)
Kelthane 139 (100), 111 (36), 141 (29), 250 (27)
Methoxychlor 227 (100), 228 (23), 152 (10), 138 (10)
Permethrin 183 (100), 163 (16), 165 (12), 184 (9)
Vinclozolin N/Ac
Instrument Prep: GC Analysis 29
than 50:50.
• Check that purge valve is off for at least two minutes after injection of sample.
• If the column or detector has just been changed, the positioning of the capillary
column in the detector or injector might be off. Check this and reposition the
column if necessary.
• If the column is new, be sure it is properly conditioned.
• Is the detector on?
Too many peaks observed during a run
• Are the gas lines and gases clean? To check this, run the temperature program
without injecting a sample. If you observe extra peaks, suspect the purity of your
gases. If you don’t have in-line oxygen and water filters, get them. You may need
to buy higher purity gases.
• Is the syringe clean? If you are using an autosampler, check to be sure the wash
vials are filled. Try a new syringe.
• Are there contaminants in the solvent? Inject pure solvent to check. Have only
Pesticide-grade solvents been used in all analyses? Are there known impurities
that may be present from the procedures? If so, extract the suspected
contaminant and obtain a chromatogram for cross-checking.
• Are there contaminants or incompatible compounds in the sample? Some
samples contain compounds that interfere with ECD pesticide analysis. These
include broccoli, brussel sprouts, cabbage, cauliflower, citrus fruits, avocadoes,
and carrots.
Wandering baseline
• Is the instrument just warming up? It may take several injections and over a day
for the ECD to stabilize and give a good baseline. If this is the problem, be
patient and keep injecting samples and cycling the instrument through the
temperature program.
• Is there methylene chloride contamination? If so, it may take several days to get
the detector to calm down.
• If the baseline rises during the analysis, you can still get useful data by putting
in additional autozero commands at unimportant times (i.e., no peaks come out
at these times) in the method.
Irreproducible Retention Times
• Is the carrier gas tank turned on?
• Is there sufficient gas pressure in the tank?
• Is the capillary column partially clogged? You can check this by detaching the
detector end of the column and placing it in a beaker of water. If the column is
clear, you should see a steady stream of bubbles coming out of the end.
Detector signal off-scale and won’t come back on scale
• Check to be sure the make-up gas is on and there is sufficient pressure in the
tank.
• Is the detector sufficiently warmed up and stabilized? Depending on your
detector, this may take 30 minutes to a few hours.
• Is it time for a new detector?
30 Instructor’s Manual
INSTRUMENT PREP: SFE EXTRACTION
This method was developed using a Hewlett-Packard 7690T SFE system. Your
system is likely to be somewhat different; however, the conditions given in Table 10
below should be readily transferable between instruments.
The parameters above provide conditions for a good general extraction program, but the
conditions don’t work equally well for all pesticides. If you are only going to analyze for
a select few pesticides, you may want to experiment with different times, temperatures,
and pressures to optimize the conditions for those particular pesticides.
Instrument Supplies
• Ultrapure CO2 with eductor tube to use as the supercritical extraction fluid
(from your local gas supplier)
• xxx-grade CO2 to use for cooling (from your local gas supplier)
• Extraction thimbles, thimble caps, funnels, etc. (from SFE system
manufacturer)
• Pesticide-grade hexane
• Pesticide-grade acetone
• 2-mL GC autosampler vials with teflon-coated septa (use the supplier
recommended for your instrument). You will also need a crimping tool to seal the
caps onto the autosampler vials.
Some Precautions for Best Performance
Leaks are common in these systems and are usually caused by solid materials
that find their way into the threaded part of the extraction thimble/thimble cap. The
best way to avoid this problem is to clean the threads on both the thimble and the
thimble cap before use and using a thimble funnel (screws into the thimble so threads
Table 10: Conditions for SFE Pesticide Extraction
Parameter Value
Extractant Ultrapure CO2
Pressure/Density
Extraction temperature
Extraction time
Static
Flow
Nozzle temperature
Trap packing Stainless steel or C18
Trap temperature
Rinse solvent #1 Pesticide-grade hexane
2 mL
Rinse solvent #2
(cleanup solvent)
Pesticide-grade acetone
5 mL??
Instrument Prep: SFE Extraction 31
are not contaminated) to load the produce. Be sure to stuff all the loose ends of the plant
material down into the thimble before removing the funnel. Wipe the threads clean if
necessary, then put on the thimble cap.
The thimble caps clog easily---proper maintenance is essential if the caps are to
last for more than one extraction. After each extraction, the caps should be immediately
placed in a beaker of water or acetone to prevent the plant material stuck on the caps
from hardening. The caps should then be sonicated, first for 15 minutes in distilled
water, then for 15 minutes in Pesticide-grade acetone. The use of an additional filter
within the funnel (the Kimwipe™ in the procedure) helps to keep solid matter from
contaminating the thimble caps in the first place.
32 Instructor’s Manual
DATA ANALYSIS AND DEBATE PREPARATION
The goal of this day’s lab work is to teach the students about interpreting the
data they acquire from the GC and to prepare them for the upcoming debate. It is
important to communicate to the students the human factor in data interpretation. The
setting of tolerance levels should also be discussed in order to show students the
connection between instrument accuracy and sensitivity, and laws regulating pesticide
use.
Reading in Laboratory Manual
Gas Chromatography: pages 51–63
Pesticide Regulations: pages 76–80
The Greate Debate: pages 82–85
Time Required
• Chromatogram interpretation: 30-40 minutes
• Calculations and data entry: 20-30 minutes
• Discussion of data: 20-30 minutes
• Preparation for Pesticide Debate: 20-30 minutes
Before Lab
• Select students to be in the Debate Groups, Agribusiness and
Envrionmentalists. Be sure to divide the strong and/or articulate students
equally, so both groups are on a fairly even playing field.
• Have the GC files available in case students need to reintegrate their
chromatograms.
• Print out chromatograms and report printouts for each student’s sample(s).
Prepare a spread sheet for students to enter their data into such as the one
sketched out below.
A sample data set from our class can be downloaded from the web at:
http://www.cchem.berkeley.edu/~chem1a/echem.S97/Pesticides/Pest2.html
Pre-lab Discussion
Begin by spending a few minutes introducing the importance of tolerance levels
in pesticide regulation, defining them and discussing the rather random way they have
been set in the past (see student manual). Emphasize that ultimately, the tolerance
level depends on the technology available for detection. As detection limits have
plummeted in the last 10-15 years with advances in GC and detector technology,
Name
(Partner)
Produce
tested
mass
(g)
Pesticide(s)
found
Conc.
µg/g
Tolerance
(µg/g)
µg/L
TCM
X
%
recovery
µg/L
DCBP
%
recovery
Gilbert
(Elizabeth)
Apples
washed/
unpeeled
50 Methoxychlor
Kelthane
0.14
0.046
14
5
17 19 17 19
Data Analysis and Debate Preparation 33
tolerance levels that were once set at the detection limits are now being revised.
This part of the module is also a chance to convince students of the value of
skepticism in chromatogram interpretation and data analysis. Students tend to believe
something if it is on a computer printout, regardless of the quality of the data. This
laboratory period will give them a chance to practice with critical analysis of data.
Gas chromatography
It is useful to emphasize the differences between organic and inorganic
substances in terms of volatility and use this to lead in to GC as a separation technique.
Only volatile substances can be analyzed this way, and the analysis is for substances in
the gas phase. Pages 51–61 provide detailed background information on gas
chromatography. Most freshman students have no trouble understanding basic
chromatographic concepts. The table below is a good way to present chromatography
basics in a way that allows comparison between different types of chromatography (thin
layer chromatography, paper chromatgraphy, ion chromatography, high pressure
liquid chromatography). For an advanced class, this will help the students see the
similarities between the different types of chromatography.
Depending on the level of the class, discussion of the ECD or the MSD as a
detector can range from a simple explanation of its advantages in quantifying
organohalogen compounds to a complete description of the electronics involved in
making it work. If possible, have your students take a "GC tour" of the instrument, so
they can see it and explore how it is put together.
Interpreting a chromatogram
Return the chromatograms to the students. Remind them how important it is to
look at the chromatogram carefully and critically, not just to read off numbers from the
report. Instill in them that they should never trust a computer! Common computer
mistakes students should know about include:
• Sometimes the GC will label a peak as a pesticide, even though the retention
time is far off from the expected retention time. Students must compare actual
and expected retention time of a suspected peak. If it is within 0.15 minutes,
there is a good chance it really is the component in question. If not, it is worth
being suspicious.
• Sometimes the GC will label a peak as a pesticide, even though the peak is not
really shaped like a peak. Shapless blobs will sometimes be labeled as peaks and
students must look at the chromatogram to determine if the peak is real.
• The integration of the peaks may not be correct, due to computer error in
drawing the baseline. This explains a surrogate recovery greater than 100% that
is sometimes observed. To fix this problem, students will need to go back to the
mobile phase helium gas
stationary phase organic resin that compounds stick
to (dipole-dipole interactions)
column 0.25 mm x 30 m (capillary)
chromatographic “force” high pressure gas
temperature of analysis 30-400°C, as needed
detector Electron Capture (ECD)
34 Instructor’s Manual
computer on the GC, fix the baseline, and reintegrate the peak. It is good to leave
some extra time to do reintegrations during this class period.
• Remind them of interference peaks. Chromatograms of expected interferences
(rubber gloves, rubber stoppers, blender washers, pipet bulbs, etc.) should be
posted in the lab. Overheads of these chromatograms (available in the Appendix
of this Instructor’s Manual) are useful for the pre-lab lecture.
Method Detection Limits and Tolerance Levels
The concept of method detection limit (MDL) is an important one for students.
Because of the different response ratios for the different pesticides, the MDLs are
different for each pesticide. The table on p. 62 in the module text provides an estimate
of the MDL (25% of the lowest standard concentration for each pesticide) for our
instrument and conditions, assuming the peak shape and and retention time are
acceptable. Your instrument will likely have different MDLs, so you should experiment
with very low concentrations of standards.
Discuss tolerance levels and point out that the differences in MDLs for the
different pesticides have implications for setting tolerance levels, since they cannot be
set lower than measurable levels. The students may wish to use this information in
preparing their debate presentation.
Data Analysis
Give students 10-15 minutes to work with their extraction partners to compare
the chromatograms and decide which peaks are real and should be entered into the
database. Have them fill out the table on p. 63 in the module text for their
chromatogram and be sure the instructor checks the results. The instructor should be
actively working with the student groups to help them with any questions.
Calculations
Spend a few minutes going over the calculations to determine the concentration
of pesticides in produce and for surrogate recovery. This part is difficult for students.
An overhead transparency of Figure 3-2 in the module text will be helpful in presenting
this material, but it is a good computational exercise to let them work with each other
and struggle a bit to figure it out.
• Calculation of Concentration of Pesticides in Produce
Use the concentration of pesticides in the sample analyzed by the GC and the total
volume of the GC-ready extract (5 mL) to calculate the number of µg in the entire
extract. For an example, look at a pesticide with a concentration of
426 µg/L in the GC-ready extract.
Knowing that only a fraction of the sample was carried through the entire analysis,
correct for the actual volume of sample analyzed (the 10 mL aliquot out of 110 mL total
volume of acetonitrile). Continuing with the above example:
The final step is to calculate the concentration of the pesticide residue on the
50 g of produce analyzed. This number can be directly compared to the tolerance levels,
426µg
L
× 0.005L = 2.13µg of pesticide in GC extract
2.13µg
10mL
× 110mL = 23.43µg in the entire acetonitrile extract
Data Analysis and Debate Preparation 35
as given in Appendix A in the module text.
• Calculation of Surrogate Recovery
The surrogate recovery provides an estimate of the efficiency of the extraction
procedure. First, determine the theoretical maximum percent recovery of surrogate.
Correct for the actual amount of sample taken through the entire procedure.
Determine the theoretical maximum concentration of surrogate in the 5 mL GC extract.
Finally, compare this number to the actual number for surrogate recovery obtained for
a real sample and multiply by 100% to obtain the percent recovery.
If students get low surrogate recoveries, they may have lost some of the
surrogate compounds and pesticides either by physical processes (spilling, not rinsing
the Florisil™ column enough) or by evaporation due to heating the sample too much in
the nitrogen evaporation step. Loss by evaporation is more significant for TCMX
(typically 30-40% recovery) than DCBP (typically 70-80% recovery) because it boils at a
much lower temperature than DCBP and is “blown-off” in the nitrogen evaporation
step. There will even be differences in lab partners’ sample handling that will show up
here. This difference in recovery for the two surrogates also points out that neither of
the two numbers are necessarily accurate for all pesticides. Those pesticides that have
boiling points similar to DCBP (and correspondingly elute later on the chromatogram)
will have percent recoveries similar to DCBP. The same is true for pesticides with
boiling points closer to TCMX. It should be pointed out that surrogate recoveries are
only a guide to how efficient the extraction is and no exact corrections can be made. In
the environmental analysis business, surrogate recoveries are only reported, not used
to calculate “corrected concentrations.”
Results and Discussion
Have students share their raw data (pesticide and surrogate concentrations in
the GC extract in µg/L) with the class, either by putting the results up on the blackboard
or entering them into a spreadsheet or graphing program. Once all the data is entered
and everyone can look at it, have the students critique the data set. Do all duplicates
match? Are all reported results above the MDL? Look at the "hits," where measurable
pesticide residues were found in the produce samples. Is there Dieldrin (banned 20
years ago)? What pesticides occur commonly on different fruits and vegetables? Are
there peaks in the student chromatograms that look like pesticides but are not in the
standard mixture (these may be real!)? These questions will generate discussion about
the results.
Preparing Students for the Pesticide Debate
If the class is doing the debate, the remainder of the class period should be used
23.43µg of pesticide
50.0 g of produce
= 0.47µg / g = 0.47 ppm
500µL ×
10,000µg
L
×
1L
106
µL
= 5µg of surrogate added
5µg
110mL
× 10mL = 0.45µg of surrogate in GC extract
0.45µg
0.005L
= 91µg / L surrogate in GC extract
36 Instructor’s Manual
to divide students into two groups of 8-12 students each, Agribusiness and
Environmentalists. It is best for the instructor to choose the groups before the lab
period. The students should be put into groups based on abilities, with an attempt to
equally divide students of different abilities. The groups should meet during this lab
period to look over the procedures for the debate and the data they collected, and
determine who in the group will play the different roles described on p. 82 in the module
text.
There are 10 sets of individual readings, each set containing one or more related
articles. References to these web-based readings can be found at
http://mc2.cchem.berkeley.edu/MCsquared/UCB/Echem/Pesticides/Pestshort.html.
Additional references are cited in the module text. On the web, the reading sets are
color-coded depending on the slant the group publishing the article brings to the debate,
red for the Agribusiness side, green for the Environmental side, and black for
(apparently) neutral sources. The stronger students should be made responsible for the
readings in Sets #7 and #8 on the regulation of pesticides, since these articles are
essential for making a good argument about the existing pesticide regulations.
Give each student his or her individual reading assignment and emphasize that
everyone will be expected to have read not only their individual readings, but also all
of the module text on pesticides and risk assessment. Fully explain the grading scheme
and the fact that they must bring to class a one-page summary of their readings (and
copies to hand out to all) the next week. The one-page summary is quite effective in
ensuring that students take the reading assignment seriously and come prepared to
present their knowledge to the group.
NOTE: It is critical for students to do this assignment; otherwise the debate will be a
flop because they won’t know enough to put together a good set of arguments. Be sure
to make this clear to the students.
Flow of Lab
Begin with an overview of data analysis and chromatogram interpretation, then
have the students meet with their partners to review their data and determine which
peaks are real on their chromatograms. If they need to re-integrate their
chromatograms, this is a good time to do it and provide students with an opportunity to
learn more about the hands-on use of the gas chromatograph. Have students write their
GC data on the board, then lead a class discussion about the data and its validity.
Describe how to do the calculations to convert the GC data in µg per liter of extract to
µg per gram of produce. Go over the expectations for the final lab report, then break the
students into their debate groups to plan their debate strategy.
The Great Debate 37
THE GREAT DEBATE
The goal of this day’s work is for students to use the data they acquired to debate
the issue of pesticides in the food supply and to examine the effectiveness and fairness
of the Food Quality Protection Act of 1996 from different points of view.
Web Readings
Each student should have read his or her assigned web reading and prepared a
summary of the article to hand out to fellow students in preparation for the debate.
Reading in Laboratory Manual
Review:
Organochlorine Pesticides: pages 9–18
Risk Assessment: pages 64–74
Pesticide Regulations: pages 76–80
The Greate Debate: pages 82–85
Time Required
• Debate preparation: 60-90 minutes
• The Debate: 30-45 minutes
• Peer Grading: 10 minutes
Before Lab
• Print out a copy of the data set for students to use in their debate.
• If you have an overhead projector available for students to use, bring blank
transparencies and pens for students to write on them. They can give more
effective presentations with visual aids.
• Prepare a list of the students in the class to help you keep track of particpation
in the discussion.
• Make copies of the Peer Grading sheet on p. 40 in this Instructor’s Manual, one
for each student.
Flow of Lab
Remind students about report due dates and expectations. See following section
in this Instructor’s Manual.
Hand out pesticide data to all students and tell them that in order to make an
effective argument, they will need to use the data they obtained. Any knowledge about
uncertainty in the measurements, capability of the instrument and the detector used,
and other experimental details might help (or hinder!) their arguments.
Students get into their groups and spend about 60-90 minutes formulating their
debate plan, according to the questions in the lab manual. You should tell students they
have slightly less time than you have actually allotted. Even with a timekeeper,
students are usually not prepared at the end of the designated time. At this point, it is
useful for the instructor to remind them to be sure to address the questions on page 83
in the module text. The group activities during this time period should flow as outlined
below.
Debate preparation begins with each student giving a 2-minute summary of
each reading to the group (~25 minutes). The timekeeper should be sure everyone
stays on track. Students who have the same set of readings (most sets contain more
38 Instructor’s Manual
than one article) should alternate being the first presenter to the group. The
summarizer should summarize what the group has heard, once in the middle and once
at the end of the individual reports, reminding the group of the main questions they
need to address. The recorder should write down the main points. The spokespeople
should listen closely for any facts they might want to use in their arguments.
Using the information presented, the group should now begin to formulate a
position consistent with their interests (Agribusiness, Environment). The director
will play a major role in reminding the group of its mission, which is to address the
questions on p. 83 in the module text. The summarizer should speak every 10-15
minutes to clarify what has been discussed. The timekeeper should keep an eye on
the remaining time and move the discussion along if it gets bogged down on one
particular point. At the end of the discussion, the recorder will have the group go back
over the questions and write down the consensus of the points to be made in the
presentation by the spokespeople.
The debate will follow and should last ~30-45 minutes. You, the instructor, are
the director of the debate, with your mission being to ensure that as many people as
possible have a chance to contribute to the debate. You should also be sure to cut it off
before the students begin going in circles or just reiterating points already made. Here
are some rules students must follow (write these on the board or hand them out ahead
of time).
• The preliminary speeches by the spokespeople may not exceed 10 minutes.
• No interrupting is allowed. Students must be acknowledged by the instructor
before speaking.
• Any comment during the general discussion is limited to ~1 minute. No
filibustering!
• Courtesy is of utmost importance! Just because you disagree with someone does
not mean you have to be rude to them.
During the debate, it is most important for the instructor to be watching all
students in the room, not just the ones who are dominating the discussion. The debate is
most successful if there is participation from as many students as possible. You may
wish to have a list of students on which you make a mark next to a student's name each
time she or he speaks. This will provide a concrete reminder of who has contributed
more or less than their share, and, while you should not try to stifle creative comments
from the talkative students, you can choose to call on other students besides the
"talkers." Watch out for gender bias in which students you call on. Studies have shown
that males are more agressive than females at being recognized in a group where they
must compete for "permission" to talk. It is easy for the hand-wavers to obscure your
notice of the rest of the students. Again, keeping a list of students and how often they
have responded will be useful.
At times during the debate, you may need to ask for clarification from a student
if a question or comment is worded in a way that is difficult to understand. Keep
students to the 1 minute limit for comments.
As the end of the time approaches (or as the discussion slows down or students
start to repeat themselves), you should bring the debate to a close by summarizing the
evolution of student opinion throughout the course of the debate. Be sure to highlight
the good points the two groups have made (you should write these down as you hear
them), with particular emphasis on solutions to the problem, not just differences of
opinion. Often students have come to some middle ground by this time and it is useful
to remind them that the problem of pesticides and food production is not just black or
white and they have illustrated this first hand. Finally, compliment everyone on their
participation and effort.
After the debate is over, the students should spend 5-10 minutes assigning
The Great Debate 39
grades to the other students in their group. Students do not grade themselves. It is
important that they give this careful thought, so be sure everyone takes this seriously
and does it with quiet and in private.
Potential problems and How to Handle Them
• Overly aggressive students:
A gentle way to handle these students is to compliment all talkative students for their
wonderful insights, but you want to be sure that others have a chance to state their
opinions and to remind them that you must call on them first before they can speak.
Don't dwell on it, but move things along by immediately calling on someone else to
continue the debate. If this doesn't work, you may need to stop the debate and remind
all students of the rules. At worst, you may have to ask a particular student to refrain
from participating.
• Overly passive students:
There are many students who are reluctant to speak their mind for fear of saying
something "stupid" in the eyes of their classmates or just because they are
uncomfortable speaking in front of a large group. Often it is possible to bring these
students out of their shells if the issue excites them enough to motivate a response. As
director of the debate, you should watch closely for indications that these shy students
might be willing to contribute to the discussion. If you see someone with a half-raised
hand or an eager look, be sure to call on him or her as soon as possible. If you wait and
let another "eager beaver" student speak first, you will have lost them. If you missed
the boat on getting them to contribute, you might be able to bring them back by saying
something like, "Tina, I noticed you had your hand up a minute ago---would you like to
say something?"
• The debate is going in circles:
Sometimes the students will get into a line of argument that appears to be going
nowhere. At this point, it is useful to re-focus them on the questions of p. 83, perhaps
saying: "But what effect does this point you're making have on the way pesticides are
regulated?" or something to that effect that brings the discussion back to the broader
issues.
• Students who have not done the assignment:
These students are a problem for the rest of the group because there will be a hole in
the group's knowledge base. The best solution is prevention. Be sure all students know
what will be expected of them the week before and how their performance will be
graded.
Peer Grading
On the following page is a sheet to be handed out for students to use in grading each
other for their work in preparing the debate.
40 Instructor’s Manual
Participation Grades for the Pesticide Debate
(see p. 85 in the module text for guidelines)
Your Name:
Your Group:
Names of Group Members
(do not list yourself)
Summary Grade Discussion Grade
The Report 41
THE REPORT
You may wish to customize the instructions for the students’ lab reports (see
pages 94–98 in the module text). The existing instructions request a full written report,
with students expected to explore the issue of pesticides in the food supply in some
detail. An alternative format that is less demanding for students would be a simple
report of the class data, showing detailed calculations and including comments on the
significance and validity of the data. Several post-lab questions are provided as well.
Answers to these questions can be found below. If instrumentation is the focus of the
course, the report could be more related to the subtleties of GC analysis of
organochlorine pesticides.
Reading in Laboratory Manual
Final Report for the Pesticide Module: pages 94–98
Answers to Post-Lab Questions
1) The yearly exposure to Alar can be calculated as follows:
First, obtain an average concentration of Alar in apples and apple products by taking
into account the assumptions that the concentration of Alar in apples is 30% of the
tolerance level and only 5% of the pesticide measured at the farm gate is contained in
the food.
5 µg/g x 0.30 x 0.05 = 0.075 µg/g
Next, calculate the absolute amount of Alar ingested in a year. For a child who eats 4
oz of applesauce and 8 oz of apple juice:
12 oz/day x 28 g/oz x 365 days/yr x 0.075 µg/g = 9,198 µg/yr
For an adult who eats three 6 oz apples per week:
18 oz/week x 28 g/oz x 52 weeks/yr x 0.075 µg/g = 1,966 µg/yr
Finally, calculate the amount of pesticde ingested per kg of body weight:
For a 10 kg child:
9.20 mg/10 kg = 0.92 mg/kg
For a 70 kg adult:
1.97 mg/70 kg = 0.028 mg/kg
The amount of pesticide ingested per kg of body weight is 320 times greater for a child
than for an adult. Clearly, the tolerance levels should reflect this difference in exposure
between adults and children.
2) Set I
Chlorpyrifos, 1.12 mg/L in water at 24°C
Dicamba, 5,600 mg/L at 20°C
Dicamba is more water soluble because it can form hydrogen bonds to water through
the carboxyl group.
42 Instructor’s Manual
Set II
Aldicarb, 6,000 mg/L at 25°C
Kepone, 7.6 mg/L at 25°C
Aldicarb is more water soluble because it can form hydrogen bonds to water through the
amido group. In addition, there are multiple electronegative or highly polarizable
heteroatoms with unshared pairs of electrons (N, O, S) present in the aldicarb molecule.
Organochlorines are typically not very water soluble. Kepone is particularly insoluble
because it is a symmetric molecule, and the bond dipoles between carbon and chlorine
atoms tend to cancel out.
Appendix A:
Transparency Masters
Appendix A: Transparency Masters 43
44 Instructor’s Manual
Appendix A: Transparency Masters 45
0
5
10
15
20
25
MortalityRatio
Never
Smoked
1-9 10-20 >20
Cigarettes Smoked Per Day
46 Instructor’s Manual
O O
OH
OH
benzopyrene
intermediateepoxide
ultimatecarcinogen
Appendix A: Transparency Masters 47
48 Instructor’s Manual
NOTOBSERVABLE
Unknowntothoseexposed,effectdelayed,
newrisk,risksunknowntoscience
OBSERVABLE
Knowntothoseexposed,effect
immediate,oldrisk,risksknowntoscience
UNCONTROLLABLE
Dreaded,globally
catastrophic,consequences
fatal,notequitable,highriskto
futuregenerations,noteasily
reduced,riskincreasing,
involuntary
CONTROLLABLE
Notdreaded,notglobally
catastrophic,consequences
notfatal,equitable,lowrisk
tofuturegenerations,easily
reduced,riskdecreasing,
voluntary
Radioactivewaste
Pesticides
Saccharin
Aspirin
Nuclearwar
Autoaccidents
Smoking
Bicycles
Coal-burning
pollution
Diagnostic
X-rays
Antibiotics
DNAtechnology
Electricfields
Commercialaviation
Nervegasaccidents
Largedams
Chainsaws
Fireworks
Appendix A: Transparency Masters 49
50 Instructor’s Manual
Controlplate:
ContainsSalmonella
typhimuriumon
agarmediumwith
enoughhistidinefor
severalcell
divisions.
Testplate:
ContainsSalmonella
typhimuriumon
agarmediumwith
enoughhistidinefor
severalcell
divisionsplusthe
testsubstanceplus
theS9fractionto
mimicmammalian
metabolism.
Numberof
revertantsdueto
randomerrorsin
DNAreplication
Numberof
revertantsduetothe
testsubstance,its
metabolites,and
randomerrorsin
DNAreplication
Incubateat37°C
for2days
Incubateat37°C
for2days
Appendix A: Transparency Masters 51
52 Instructor’s Manual
+-+-+-
+ -
+ -
+-
+-
++
+ +
- -
- -
Appendix A: Transparency Masters 53
WATER MOLECULES FORM HYDROGEN-BONDED CLUSTERS
54 Instructor’s Manual
Appendix A: Transparency Masters 55
56 Instructor’s Manual
Cl C
H
Cl
H
H3C
C
H3C
O
CH3
C
N
H3C
CH2
CH2
CH2
CH2
CH3
H
O
H
H
O
CH3
methylene chlorideacetone
acetonitrile
hexane
water
methanol
Appendix A: Transparency Masters 57
58 Instructor’s Manual
injectorport
detector
oven
column
Hegasin
outlet
capillarycolumn
polymercoating
(stationaryphase)
Appendix A: Transparency Masters 59
60 Instructor’s Manual
hydrogen/airflame
negatively-chargedcollectorplate
e-
current-measuringdevice
columneffluent
gaseousionsproduced
whencomponentis
burned
hydrogen/airmixture
outputto
computer
Appendix A: Transparency Masters 61
62 Instructor’s Manual
positively-chargedcollectorplate
e-
current-measuringdevice
columneffluent:
samplemolecules
outputto
computer
capillarycolumn
63
Ni
source
S
S
S
electrons
samplemolecules
exitthedetector
S
S
Appendix A: Transparency Masters 63
BIOACCUMULATION
person
10,000 ppb DDT
..
trout
3,000 ppb DDT
.
invertebrates
800 ppb DDT
..
sediment
300 ppb DDT
water
0.5 ppb DDT
64 Instructor’s Manual
Pesticide
Solubility in
Water (mg/L)
at 20°C
Half-Life
Chlordane
0.1 3.3 years
Dieldrin
0.17 >7 years
Endosulfan
0.5 35-190 days
Cl
Cl
Cl
Cl
CCl2Cl
Cl
Cl
Cl
Cl
Cl
O CH2 CCl2
O
S
O
O
Cl
Cl
Cl
Cl
CCl2
Appendix A: Transparency Masters 65
Captan
0.5 1-12 days
Dichlobenil
18 1 year
Carbaryl
32 4-29 days
Pesticide
Solubility in
Water (mg/L)
at 20°C
Half-Life
N-S-CCl3
O
O
CN
ClCl
O
C
HN
O
CH3
66 Instructor’s Manual
Malathion
143 4-6 days
2,4-Dichlorophenoxy-
acetic acid
682 1-14 days
Pesticide
Solubility in
Water (mg/L)
at 20°C
Half-Life
H3CO
P
S
S
OCH3
H OCH2CH3
O
OCH2CH3O
Cl
Cl
O-CH2-C
O
OH
Appendix A: Transparency Masters 67
CO2CH3
Cl
Cl
CO2CH3
Cl
Cl
CN
Cl
Cl
Cl
CN
Cl
Cl
Cl
N
N
O
O(i-Pr)HNOC
N-S-CCl3
O
O
O
S
O
O
Cl
Cl
Cl
Cl
CCl2
N N
N
H
NCl
Cl
Cl
Cl
Cl
Cl
Cl
O CH2 CCl2
OC
O
O
H
CH3
CH3
H
Cl Cl
Chlorothalonil DCPA
Iprodione Captan
DieldrinEndosulfan
Anilazine Permethrin
Cl
Cl
N
O
O
O
CH3
Vinclozolin
CH
CCl3
H3CO
OCH3
Methoxychlor
C
CCl3
Cl
Cl
Kelthane
OH
68 Instructor’s Manual
§ 180.378 Permethrin; tolerances for
residues.
Commodity ppm
Apples 0.05
Artichokes 10.0
Asparagus 1.0
Avocados 1.0
Broccoli 1.0
Cabbage 6.0
Celery 5.0
Cauliflower 1.0
Cherries 3.0
Corn, forage 60.0
Eggplant 1.0
Filberts 0.05
Garlic 0.1
Lettuce (head) 20.0
Mushrooms 6.0
Onions 0.1
Peaches 5.0
Pears 3.0
Potatoes 0.05
Soybeans 0.05
Spinach 20.0
Tomatoes 2
Appendix A: Transparency Masters 69
0
20
40
60
80
100
120
140
160
Thymus
Stature
Brain
Kidneys
Spleen
Ovaries
Uterus
Testes
Age (Years)
b 2 4 8 13 17
% of Adult
Organ Weight
70 Instructor’s Manual
Appendix A: Transparency Masters 71
72 Instructor’s Manual
Appendix A: Transparency Masters 73
total volume of
acetonitrile extract, T
aliquot of
extract
removed for
further
processing, A
evaporation
Florisil
cleanup
evaporation
volume of
sample ready
for GC analysis, G
volume of
surrogate added, S
63
Appendix B:
Evaluation Data on the
Pesticide Debate
64 Instructor’s Manual
What follows is evaluation data collected over the course of 5 semesters at the
University of California, Berkeley on freshmen students taking special environmental
laboratory sections as an alternative to the traditional laboratory offered with the large
freshman chemistry course. The data presented here indicate the effects of the debate
on the students’ opinions of the exercise, in addition to an evaluation of the effect of the
debate on students’ views towards pesticide use.
Overview
In the pesticide lab, students extract organochlorine pesticides from fruits and
vegetables and use their data in a role-playing exercise. The students are divided into
two groups, one representing the Agribusiness and Chemical Manufacturing Industry
and the other representing the "die-hard" Environmentalists. A week before the lab,
they are provided with readings (each reading had two students responsible for
reporting on it) that supports their sides of the story (somewhat---a few of the readings
were the same) and their mission is to debate the issue, after formulating plans within
their groups. Students in each group are assigned the tasks of spokesperson,
timekeeper, recorder, summarizer, and director, a structure which helps the
students stay on track. The individual group discussions begin with each student
summarizing his or her own particular article to the group. After all the summaries are
given, the groups then tackle the issues below and use the information to make a case
for their side. The specific issues debated are:
• Students begin by presenting the class data on pesticide residues in produce.
They are expected to use this data to support their point of view and comment
on whether their group perceives there is a problem with pesticides in the food
supply.
• Do you support or reject the new Food Quality Protection Act of 1996 that
regulates pesticide use?
• Should we:
a) regulate pesticides more heavily than the new law dictates?
b) forbid them entirely?
c) decrease the regulatory burden on pesticide producers and users?
d) re-write the laws for pesticide regulations? If so, how?
e) keep the status quo?
f) some combination of the above?
• Is our present method of regulation effective? Over burdensome?
While the groups formulate their debate plan, the instructor is available to help clarify
issues, but does not guide the discussion. When the debate begins, each group has 10
minutes to present its case, then the floor is opened for general discussion. The
instructor's role is one of referee (for the outgoing students) and encourager (for the less
aggressive students).
The Agribusiness versus Environmentalists debate was a success with most
students, with words like "exciting," "fun," and "interesting" dominating the comments.
Students who were very pro-environment found themselves arguing for the side of the
Agribusiness interests, which required them to see a different side of the issue and
forced a realization that not all environmental problems have clear-cut solutions. With
very few exceptions, all students came to class prepared and participated fully in the
discussion. Students graded each other on participation. The detailed instructions
students received for the debate and for the peer-grading scheme can be found on pp.
82–85 in the module text.
65
Evaluation Data
Over the five semesters the course was evaluated, the debate was carried out by
9 lab sections of students; a total of 184 students. At the end of the course, students
were asked several questions about the debate and the grading scheme and to provide
additional comments if they desired. The results of these questions follow.
Did you like the discussion/debate on the pesticide module?
The debate was popular with the students, with a large fraction (80%) giving it
a "thumbs-up." Nineteen percent of the students did not like this alternative approach.
DID STUDENTS LIKE THE DEBATE?
Did you think the grading scheme for the debate was fair?
The debate assignment was peer-graded, with students grading each other on
both the quality of the summary of their article and their level of participation in the
pre-debate discussion. Students were provided with the guidelines shown on p. 85 in
the student laboratory manual to rate the performance of their fellow students. The
teaching assistants were given discretionary points to use if they felt it necessary, but
these were used only rarely. Grades given to students by their peers were generally B
or better, with only those students who did not come prepared graded down
significantly. In light of the full participation of all of the students observed, the
teaching staff in the course would have given very similar grades for the most part.
Students were generally accepting of this method of grading, with 75% in favor and 24%
opposed.
80%
19%
1%
Yes
No
In-Between
N = 184
66 Instructor’s Manual
DID STUDENTS THINK THE PEER GRADING APPROACH WAS FAIR?
If you did not think the grading scheme was fair, why not?
The 25% of the students who did not like the grading scheme cited several
reasons. They thought their peers lacked the maturity to do a good job and were
concerned that competitiveness and self-interest might influence the grading. Some
students felt that their peers would give higher grades than a TA might have. It was
also clear that some students were uncomfortable grading their peers, remarking that
they were not qualified or that it was not their job.
In the last semester the class was surveyed, we asked additional questions to
find out the effect of the debate on shaping students' opinions on the issue of pesticide
use. Because of the small number of students (N = 41), it is difficult to obtain precise
conclusions, only a general overview.
Did the debate serve to reinforce your present views on issues related
to pesticide use? If so, which issues?
More than half of the students (61%) indicated that the debate reinforced their
present views on pesticide use, while 37% indicated the opposite.
75%
24%
1%
Yes
No
N/A
N = 182
67
DID THE DEBATE REINFORCE STUDENTS' VIEWS ON PESTICIDE USE?
When asked to cite on which issues their views were reinforced, students didn't
really seem to answer the question that was asked; instead, they mostly cited new
revelations they had arrived at during the debate. Sixty-one percent (N = 24) of the
students provided comments which fell into several general categories. Percentages are
expressed as the number of comments out of 24 total comments.
• Students became more aware of the societal costs of pesticides (33%).
• Students became more aware of the health risks of pesticides (29%).
• Students became convinced that pesticide use should be minimized and
alternatives explored (21%).
• Students decided that the pesticide problem was not as bad as they had thought
(8%).
• Miscellaneous, not related to any of the above (8%).
Did the debate serve to change your views on issues related to pesticide
use? If so, which issues?
Nearly half of the students (44%) were influenced by the debate to change their
opinions related to pesticide use.
61%37%
2%
Yes
No
no answer
N = 41
68 Instructor’s Manual
DID THE DEBATE CHANGE STUDENTS' VIEWS ON PESTICIDE USE?
Forty-four percent (N = 18) of the students provided comments which fell into
several general categories. Percentages are expressed as the number of comments out
of 18 total comments.
• Students became convinced that it would be difficult to completely do away with
pesticides (33%).
• Students decided that the pesticide problem was not as bad as they had thought
(22%).
• Students became convinced that pesticide use should be minimized and
alternatives explored (17%).
• Students decided that the pesticide problem was worse than they had thought
(11%).
• Students were confused about the issue (6%).
• Miscellaneous--not related to any of the above (11%).
Additional comments on the debate.
Space was provided on the questionnaire for additional comments on the debate.
Forty-six percent (N = 84) of the 184 students responded over the three semesters the
debate was included in the curriculum. The categories of responses and their
percentages are shown below. Percentages are expressed as the number of comments
out of 84 total comments. The comments fell into six major categories:
• Some students were dissatisfied with the organization and format of the debate
(32%).
• The pesticide issue is not black and white. Some students appreciated this and
others did not (24%).
44%
54%
2%
Yes
No
no answer
N = 41
69
• Nonspecific positive comments (20%).
• The relationship of chemistry to the debate (9%).
• Students felt like they learned a great deal (7%)
• Students liked the change of pace (7%).
I. Some students were dissatisfied with the organization and format of
the debate (32%)
The largest percentage of students (32%) were dissatisfied with some aspect of
the organization or format of the debate. Fifteen percent thought the debate could be
more organized or that more time should be provided for constructing their arguments.
"The discussion was good, but needed more structure and organization to
it. There was little resolved in the end. A good debate experience and
good practice working in groups."
"We needed more preparation time and less time to debate."
These comments were well-placed and matched our own assessment of a problem area.
We changed the structure of the debate over the course of the project, imposing more
structure and providing more time for discussion and debate planning. Thorough TA
preparation and greater attention to moderating the debate solved many of the
organizational problems.
Some students (7%) wanted more information on the topic. Since the two sides
(Agribusiness and Environmentalists) were given a combination of identical readings
and other readings specific to only their own group, students felt as if information was
being withheld. In the first two semesters, we did make all readings available on
reserve at the library, but students didn't remember this in-class announcement or they
didn't take the time to go to the reserve section. We initially addressed this problem by
making a course "reader" available for purchase that contained all of the readings.
Because permissions for reprints are expensive, this was a costly route for the students,
with readers selling for $22. We have now modified this part of the module so students
can access the readings for the debate on the world wide web. This appears to be the
best solution to this problem, with many good articles available from reliable sources.
Students also commented that the debate was too hostile and competitive (4%).
These comments came exclusively from two different occasions (out of a total of nine
times the debate was staged), where one aggressive individual from the class behaved
in a way that created outright hostility between the two sides. As might be anticipated,
this was not well-received by the students. We countered this problem by providing the
instructors with some tactics to deal with aggressive students. These suggestions are
included on p. 38 in this Instructor’s Manual.
A small group of students was dissatisfied with the fact that grades were based
on participation. The shy students felt as if they were being penalized for being quiet
(4%) and the outgoing students felt like they were not getting enough credit for being
leaders (2%).
70 Instructor’s Manual
II. The pesticide issue is not black and white. Some students
appreciated this and others did not (24%).
A discussion about the use of pesticides in the food supply is a true debate.
There are good points to be made on both sides and there are many issues which are not
clear-cut. Trade-offs must be made to reach a workable compromise in our present
political and economic climate. The debate was successful in making students think
about the multiple issues involved in regulating pesticides. While 6% of the students
were dissatisfied that they had not been able to choose the side of the issue they were
debating, 9% of the comments indicated that students thought the act of debating was
particularly effective in educating them to the issues faced by "the other side."
"I thought the set-up was thought-provoking---some of us had to seriously
argue the "other" side of the picture, thus it was enormously beneficial to
step into the shoes of an agribusiness woman."
"It was very nice to take "hard core" science and apply it socially with
human nature clouding the facts---as it does in real society."
"I think it is a gateway to get people involved in the issues we study in
lab. It forces people to take a side and argue that point of view. What
better way is than to make people think about both sides of an issue? I
think that debate is a great idea."
Students (5%) also commented that others were not really taking sides during the
debate. It is true that a class full of environmentalists (as is typical for this class) are
usually all on the same side. We had the most success and the most lively debate when
students were encouraged (either by an instructor or by peers) to really play their roles
as much as possible.
Some students (4%) were very uncomfortable with the fuzzy nature of the
problem. They wanted a right answer to exist and be presented to them.
"The pesticide debate was very biased. If there was going to be a true
debate, there should be a few people (pereferably the TAs and standing
on neutral ground) overlooking the debate without pointing out either
sides's faults but only the right (italics added) statements."
III. Nonspecific Positive Comments (20%)
A significant fraction (20%) of the students simply made enthusiastic comments
about the debate.
"It was one of the best things I've had this year."
"It was fun and helpful!"
"I loved it!!!"
"It's cool!"
IV. The relationship of chemistry to the debate (9%)
Students also brought out the relationship of chemistry to the debate, with 5%
of the comments indicating that students felt that the debate had shown them the
relevance of chemistry to the real world.
71
"Made the rest of the lab more interesting because I understood the
impact and relevance of what we are studying. Helped me to notice
connections in other labs. Made me think!"
Four percent of the students felt there was not enough chemistry involved in the
debate.
"The discussion for the pesticide module was good because it was a
different approach to the material and I learned a lot about the debate,
but strictly in terms of chemistry, it wasn't as effective. I was forced to
really learn about the stuff in the lab manual because I had to do those
big old lab reports. For the pesticide one I didn't learn so much about
organic compounds, polar/non-polar substances, etc. --- but keep it
anyway. Because it was a refreshing aspect of the material."
The lack of chemistry discussed in the debate was a concern for the instructors
in the course as well. While the goal of the debate was for the students to use their data
to help make their points, discussion of data did not typically dominate the students'
debate. Indeed, students more often resorted to anecdotal evidence to support their
statements rather than real data they had collected. It is very clear that if students are
given an opportunity to skirt the real science, they will take it and rely more heavily on
ways of thinking and arguing they are more accustomed to. Because the students in
our class were freshmen, this is not surprising, since their level of scientific
sophistication was still low. It would be interesting to see how upper-level chemistry
students handle this aspect of the debate. Our solution to this problem was to change
the debate format so the presentation of data is required as the initial part of the debate
presentation, as indicated in the instructions for the debate.
V. Students felt like they learned a great deal (7%)
Some students (7%) commented on the fact that they learned and remembered
a great deal from the debate experience.
"I learned more from that discussion than I did from the other labs."
"I learned a lot from the discussion, and more importantly, I remember a
lot."
"I learned a great deal. I also feel more at ease about the issue now that
I understand it a little better. I can recognize media hype of the issue has
expanded the proportions of the issue. Pesticides are lousy and do lousy
things to the soil, but I don't believe we are at a serious risk right now
and I learned this through the discussion."
VI. Students liked the change of pace (7%)
We planned the debate to take place at the end of the semester to partially take
the place of the large lab reports expected of the students for the other three modules
earlier in the semester. The students had worked hard the entire semester, and this
activity was meant to create a bit of a break and a change of pace for the students at
this stress-filled time in the semester. The students noticed this and were grateful for
a chance to do something different.
"Three modules and the debate were more realistic than 4 modules."
72 Instructor’s Manual
" . . . It also eased the final crunch by pardoning us from another massive
report."

Organochlorine Pesticides in Fruits & Vegetables

  • 1.
    Organochlorine Pesticides in Fruitsand Vegetables Instructor’s Manual Susan E. Kegley
  • 2.
    Organochlorine Pesticides in Fruitsand Vegetables Instructor’s Manual
  • 4.
    Organochlorine Pesticides in Fruitsand Vegetables Instructor’s Manual SUSAN E. KEGLEY University of California, Berkeley University Science Books Sausalito, California
  • 6.
    University Science Books 55DGate 5 Road Sausalito, CA 94965 FAX (415) 332-5393 univscibks@igc.org www.uscibooks.com Cover Art: Leigh Anne McConnaughey Cover Design: Robert Ishi Copyright ©1998 by University Science Books Reproduction or translation of any part of this work beyond that permitted by Sec- tion 107 or 108 of the 1976 United States Copyright Act without the permission of the copyright holder is unlawful. Requests for permission or further information should be addressed to the Permissions Department, University Science Books. This work was supported by a grant from the National Science Foundation, #USE-9156123, the Perkin-Elmer Corporation, and the Hewlett-Packard Corpora- tion. ISBN: 0-xxxxx
  • 7.
    Contents Introduction Learning Goals forStudents 2 Logistics 3 In What Courses Could the Module Be Used? Suggested Schedule Materials and Instrumentation Risk Assessment and Solubilities of Organic Compounds Reading in Laboratory Manual Time Required Pre-Lab Discussion Risk Assessment 4 Solubilities of Organic Substances Experimental Design 5 Flow of Lab 6 Safety Considerations 6 Waste Disposal 6 Sample Flow Chart for Pesticide Extraction Answers to the Risk Assessment Exercise Answers to Post-lab Questions 9 Stockroom Prep: Organic Solubilities 11 Extraction of Pesticides From Produce 12 Reading in Laboratory Manual 12 Time Required 12 Before Lab 12 Pre-Lab Discussion 12 Solvent Extraction 12 Supercritical Fluid Extraction 13 Using a Surrogate Spike 13 Issues of Contamination 14 Flow of Lab 14
  • 8.
    viii Contents Techniques andSafety 15 Waste Disposal 15 Answers to Post-Lab Questions, Week #2 15 Stockroom Prep: Pesticide Extraction 17 Instrument Prep: GC Analysis 20 Instrument Setup 20 Preparation of Pesticide Standards 22 Preparation of Surrogate Standards 25 Conditioning of the Column and Preparation of the ECD 26 Using an MSD with Single Ion Monitoring (SIM) 28 Troubleshooting Guide for GC Analysis 28 Instrument Prep: SFE Extraction 30 Data Analysis and Debate Preparation Reading in Laboratory Manual Time Required Before Lab 11 Pre-Lab Discussion Gas Chromatography Interpreting a Chromatogram 31 Method Detection Limits and Tolerance Levels 32 Data Analysis 32 Calculations Results and Discussion 3232 Preparing Students for the Pesticide Debate 34 Flow of Lab 34 The Great Debate Reading in Laboratory Manual Time Required Before Lab 11 Flow of Lab 36 Potential Problems and How to Handle Them 38 Handout for Peer Grading The Report Reading in Laboratory Manual Answers to Post-Lab Questions Grading Keys 39 Appendix A: Overhead Transparency Masters Appendix B: Evaluation Data on the Debate
  • 9.
    Introduction 1 INTRODUCTION This modulepresents concepts related to structure/solubility relationships of organic compounds, risk assessment, gas chromatography, biodegredation, bioaccumulation, and organic extraction techniques. At the end of the module, students use the data collected by the class to write up a full report on the risks and benefits of pesticides in the food supply and/or debate the issue of pesticide use on our food supply. The full module can be carried out in four weeks, which includes one laboratory period for the debate on the use of pesticides in the food supply. Alternatively the instructor may choose to shorten the module by eliminating the debate or lengthen it by having students optimize the GC method of analysis. This instructor’s manual is provided to help someone new to pesticide analysis get started with this module. The following information is provided: • Guidelines for material to be covered in the pre-lab lecture • Suggested flow of lab • Safety precautions • Waste disposal • Stockroom prep lists • Suggested instrument procedures for setup and troubleshooting • Answers to lab questions • Example data LEARNING GOALS FOR STUDENTS At the beginning of the module, it is important for you, the instructor, to present your students with a guide to what they should expect to have learned by the end of the module. This helps students gauge their progress and clarifies the important concepts covered by the module. By the end of this module, General and Organic Chemistry students should have gained the following: • An understanding of the solubility properties of organochlorine compounds and how the process of extraction works. • An understanding of the basic principles of gas chromatographic analysis of organic compounds. • Skepticism when interpreting computer-generated data. • An introduction to the use of internal standards to gauge the percent recovery of extractables. • An understanding of how risk assessment is carried out, including the complexities and vagaries of human perceptions of risk. • An understanding of the problems and benefits associated with pesticide use and the difficulties inherent in regulating pesticides. Upper-Level Analytical students should, in addition, have gained the following:
  • 10.
    2 Instructor’s Manual •A detailed understanding of gas chromatography as used in the analysis of organochlorine compounds, including the advantages and disadvantages of different detector systems, designing temperature programs to maximize accuracy and efficiency of the analysis, and the determination of response ratios. LOGISTICS In What Courses Could the Module Be Used? This module can be used at a variety of levels throughout the undergraduate chemistry curriculum General Chemistry This module has been tested for seven semesters in a first semester general chemistry course at the University of California, Berkeley in special laboratory sections focusing on environmental chemistry. The experiments have been carried out successfully by students with a wide range of abilities, not just honors chemistry students. The rationale for teaching it in the first semester of freshman chemistry is based on the fact that it provides a broad range of students with evidence of the utility and importance of chemistry in our society. The major disadvantage of doing the module this early in the curriculum is students have had less exposure to some of the concepts and techniques presented. Equipment limitations might make it difficult to do this module at institutions with large (>350 students) general chemistry classes. Creative scheduling and/or use of more than one GC could circumvent this issue. In general, the response of freshmen to this module has been overwhelmingly positive. Organic Chemistry The module could also be used for an organic laboratory course, and is arguably better placed in a course where structure/solubility relationships, extraction techniques, and gas chromatography are more traditionally covered. Suggested Flow of the Module for General and Organic Chemistry Week #1: Organic solubilities and risk assessment Week #2: Extraction of pesticide residues from produce Week #3: Data interpretation, data entry, and debate preparation Week #4: Pesticide debate Instrumental Methods of Analysis This module also works well in an upper level instrumental methods of analysis course and has been tested in this course three times at the University of California, Berkeley. With more advanced students, instructors are able to delve deeper into the theory and practice of gas chromatography. Students could determine response ratios and retention times for different pesticides and design their own temperature program that permits separation of all components of a pesticide mixture. They could then test the extraction efficiency of selected pesticides by processing a spiked sample. More time would need to be allotted for method development, but other parts of the experiment, such as the debate, could be trimmed if desired. Suggested Flow of the Module for Upper-Level Analytical Chemistry Week #1: Determination of retention times and response ratios of selected pesticides. Week #2: Development of an appropriate temperature program for optimum separation and quantification of pesticide residues. Week #3: Extraction of pesticide residues from produce to determine
  • 11.
    Introduction 3 extraction efficiencyfor selected pesticides. Week #4: Data interpretation, risk assessment. Materials and Instrumentation All materials and equipment not normally found in a chemistry stockroom are listed in the Stockroom Preparations sections with a source, catalog number, and approximate price. It is assumed that students have access to balances and the usual collection of flasks, beakers, clamps, etc. in their lab locker. Analysis of organochlorine pesticide residues at trace levels requires a gas chromatograph with an electron capture detector. Alternatively, a mass spectrometric detector using single ion monitoring (SIM) techniques can be used with similar results. All development work was carried out using a capillary column, as recommended in the Calfornia Department of Food and Agriculture method.1 An autosampler is highly recommended, particularly if class size is large. If an autosampler is available, up to 175 samples can be run in a week. If students work in pairs, a total of 350 students could easily do the experiment. Creative scheduling, where students rotate through several modules during the semester, would allow even larger classes to carry out the module. Alternatively, more than one GC could be used. If a GC with an ECD/MSD or autosampler is not available at your institution and you would like to do this module, it might be worth considering the submission of a proposal to the National Science Foundation’s Course Curriculum and Laboratory Improvement (CCLI) program (http://www.nsf.gov). Perkin-Elmer and Hewlett-Packard make excellent capillary instruments. Autosamplers and ECDs can usually be retrofitted onto existing instruments. The typical cost of an autosampler is ~$10,000 and an ECD is ~$3,000. If you wish to carry out the supercritical fluid extraction process, you will need a supercritical fluid extraction system. An easy-to-use commercial system is the Hewlett-Packard 7690T, available for ~$50-60K, depending on options. Be aware that with all SFE systems, you will likely need to spend a great deal of maintenance time to keep the instrument running well. 1. California Department of Food and Agriculture, Division of Inspection Services, Chemistry Laboratory Services Branch, Pesticide Residue Program, Multi-Residue Pesticide Screens, Jan. 27, 1988.
  • 12.
    4 Instructor’s Manual RISKASSESSMENT AND ORGANIC SOLUBILITIES On the first day of the module, it is important to set the stage for the entire 3-4-4 weeks of lab work. The first week focuses on the subtleties of risk assessment and structure/solubility relationships of organic compounds. In addition, the students will plan their experiment by creating a question they wish to know the answer to, then designing their produce sampling plan to best answer the question. Reading in Laboratory Manual Laboratory Protocols and Safety: pages 3–6 Solubility of Organic Compounds: pages 20–29 Pre-lab Questions: page 25 Experimental Design: page 36 Risk Assessment: pages 64–74 Time Required • Risk Assessment: 30-40 minutes • Solubility of Organic Compounds: 1.5-2 hours • Experimental Design: 20-30 minutes Pre-Lab Discussion Begin by spending a few minutes introducing the topic of pesticides in our environment. The structures of the pesticides analyzed for in this module are on page 13 in the text of the module. A transparency master of the pesticide structures is included in the Appendix to this Instructor’s Manual. Points to bring out in your general overview are: • The experimental techniques used in this module allow the detection of organochlorine pesticides, which are more long-lived than organophosphates (e.g., malathion) or carbamates (e.g., Sevin). • Organochlorine pesticides are not very water soluble, so are not easily removed by washing produce. • Organochlorine pesticides do not biodegrade readily. They often bioaccumulate in natural systems. Be sure to define biodegradation and bioaccumulation. • Chronic, long-term exposure to organochlorine pesticides has been associated with an increased risk of cancer, as well as reproductive disorders that are thought to be due to the estrogenic effects of these pesticides. See the student manual for more information on these effects. Solubility properties of organic compounds can be related to the issue of risk assessment by emphasizing how differences in the structure, and therefore solubility, of organic compounds provide the chemist with an easy way to separate pesticide residues from produce and allow for the determination of the exposure received by the average person. Risk Assessment The main points of how risk assessment is done should be presented briefly. Discuss the methods used to construct a dose-response curve (animal tests, bacterial
  • 13.
    Risk Assessment andOrganic Solubilities 5 tests, and epidemiological studies), and talk about perception of risk. Some additional reading on risk assessment can be found in the following books: 1. Environmental Epidemiology and Risk Assesssment, Tim Aldrich and Jack Griffith, Van Nostrand Reinhold (New York, 1993), pp. 212-237. 2. Principles of Environmental Toxicology, Sigmund F. Zakrzewski, American Chemical Society (Washington, DC, 1991), pp. 11-25. Students’ task for this part of the experiment is a writing assignment, where they answer the questions on page 74 in the student manual. This assignment is a good place to have students work in groups to discuss possible answers, but it is best to have the expectation that each student do his or her own writing. Because most of the answers are either in the reading or are an interpretation on the part of the student, this part of the experiment could also be a pre-lab exercise that students turn in when they arrive in class or lab. Once students have turned in their answers, it is helpful to discuss the answers with the entire class. Use the examples on pages 71-73 to get the students to discuss how the perception of risk often governs people’s behavior. Solubilities of organic substances Introduce the concept of organic extraction in the context of thinking about how it is possible to isolate a substance from a solution without getting too many other components with it. Some everyday examples of extraction the students will likely be familiar with include coffee from coffee beans, tea from tea leaves, proteins and flavor molecules from chicken bones, and spice extracts (vanilla, almond, etc). This part of the module provides an opportunity to discuss polarity, dipole moments, intermolecular forces, Lewis dot structures, and electronegativity. The old adage like dissolves like will be helpful for the students, but they should understand why that phrase is true. (see the lab manual on Organic Solubilities for more detailed background). The following demonstrations are helpful in presenting the concepts. DEMONSTRATION: The bending of water Materials required • Two 50 mL burets, one full of water and the other full of hexane. Attach both burets to the same buret clip and have two wide diameter pans below the burets to catch wide-ranging drips. Label the burets as to their contents with labels that are large enough to be visible from the back of the room. • One inflated balloon. • A dark background in place behind the burets. Procedure Draw the structures or provide molecular models of water and hexane that clearly show the geometry around the atoms. Ask students to determine the expected polarity of each substance. Demonstrate the polarity of water and the non-polarity of hexane by rubbing the balloon on your head (or have a student do it if you lack the hair!), then open the buret of water and bring the balloon close to the stream of water. The water will bend strongly towards the negatively charged balloon. (See “Why does a Stream
  • 14.
    6 Instructor’s Manual ofWater Deflect in an Electric Field?” by G.K. Vemulapalli and S.G. Kukolich, J. Chem. Ed., 1996, 73, 887 for a detailed explanation of the phenomenon). Try not to let the balloon get wet---once it’s wet, the charge on the balloon is quickly neutralized. Do the same with the hexane and you will observe no bending of the stream of liquid. Because hexane is not polar, there is no way to induce charge asymmetry in a collection of non-polar molecules. DEMONSTRATION: Predicting solubilities of organic substances in water Materials required • 5 labeled scintillation vials, half-full with the following solvents: acetone, hexane, methanol, methylene chloride, acetonitrile • iodine crystals and a spatula • salt (NaCl) Procedure Draw the chemical structures of these solvents up on the board or put them on the overhead projector (Transparency Master is available in the Appendix in this instructor’s manual). Ask the students to make predictions about which compounds will be water soluble. Take a poll, tallying the predictions under each structure. This should happen with some discussion, i.e., ask students why they are predicting the result they are. This is a good opportunity to have them think about electronegativities of different atoms and the effects of electronegativity on the distribution of electrons in a molecule and its resulting polarity. Add a speck of iodine to each solvent (for color), then fill the vial the rest of the way with water and let them see if their predictions hold. Add salt to the acetonitrile/water mixture and you will see the (now very polar) water separate from the acetonitrile to form two distinct layers. Emphasize that this is the procedure that will be used in the pesticide extraction to first dissolve all soluble compounds, then drive the non-polar pesticides into the acetonitrile layer, away from other impurities that are water soluble. Finish by summarizing the effects of polar groups on the water solubility of chemical substances. Have students think about the need for using a fairly non-polar solvent to extract pesticide residues from produce by showing the structures of the pesticides being extracted (Transparency Master available). Emphasize “Like dissolves like.” Experimental Design Students will need to come up with a question about pesticides in the food supply they wish to answer with their experiment, then decide the produce they will need to buy to answer the question. Give students about 10 minutes to discuss ideas in a group of 4-5 students, then open the discussion up to the class as a whole so the groups can share their ideas and decide on the one question they wish to answer. The instructor should guide this discussion and keep students from planning to do more than is feasible. The biggest mistake students make here is changing too many variables at once. This is a problem in pesticide analysis because the distribution of a pesticide on fruits or vegetables is not at all uniform. Because of this fact, it is necessary to have as many replicate samples as possible if the object of the study is to find out, for example, whether processed spinach (frozen, canned) has different concentrations of pesticides than fresh spinach. Students could also decide to analyze a wide variety of produce to
  • 15.
    Risk Assessment andOrganic Solubilities 7 assess the extent of possible pesticide exposure from a typical adult or child diet. Be careful in interpreting results here---you really need more than one sample to draw any kind of conclusion about pesticides in the food supply. Be sure students think about this as they plan their experiment. The list of eligible produce is on p. 36 in the module text. Remember that citrus fruits and members of the cabbage family (broccoli, cauliflower, cabbage, brussel sprouts) cannot be analyzed by this method due to the presence of compounds that interfere with the ECD. Carrots usually give some interfering peaks on the chromatogram as well. Remember that students will work in pairs, so this limits the number of different samples students can analyze to half the number of students in the class. Produce that most commonly contains detectable organochlorine pesticide residues includes grapes, spinach, strawberries, blueberries, peaches, nectarines, and plums. Less commonly, “hits” are obtained on apples, cucumbers, lettuce, tomatoes, potatoes, and squash. Creating a flow chart for the extraction lab If you have additional time in the lab on this day, providing time for students to work with their partners to plan their work on the pesticide extraction helps immensely in increasing the students’ efficiency during the week of the (long) extraction experiment. Have them create a flow chart plan for the extraction, paying particular attention to division of labor in the parts of the experiment partners do together. A sample flow chart is shown on the next page. This exercise could also be assigned as homework, but you should emphasize that it is critical for them to really do it. Flow of lab It is best to have students do the risk assessment writing exercise first, before they get involved in the details of carrying out the solubility tests. Students should work in pairs for the solubility tests. They should be encouraged to make copious notes on their observations to facilitate answering the post-lab questions. Planning the experiment should be done at the end of the laboratory period. Safety Considerations Students should be aware that they will be working with flammable solvents. Remind them of the fire extinguisher and fire blanket locations and be sure there are no sources of open flames or sparks in the laboratory. Aniline should be kept in a fume hood. Provide rubber gloves for students to use in this experiment. Waste Disposal This experiment generates about 50 mL of organic waste per pair of students, assuming they clean their test tubes with acetone. Some of the waste will contain the halogenated solvent methylene chloride. Have students place this waste in a separate container and do not mix it in with the other components, so only a small amount of the waste will need to be disposed of as halogenated waste.
  • 16.
    8 Instructor’s Manual SampleFlow Chart for Pesticide Extraction Find your partner (P1, P2) Partner 1 does this Partner 2 does this Wash the essential glassware for cutting up the produce and getting it in the blender. Prepare the glass wool/powder funnel setup. Add 15 g NaCl to sep funnel and have the setup ready to receive the blended mixture Have TA add surrogate. Load into blender. Add CH3CN and blend for 5 min. Clean the remaining glassware, including the sep funnel Pour blended mixture through the glass wool into the sep funnel Wash blender for the next pair to use. Shake the sep funnel to mix the NaCl with the acetonitrile/ produce mixture Allow mixture to stand for 30 min. While waiting, clean tray. Note: After this point, both partners are doing the same thing Cut up produce and weigh out 50 g Prepare the blender (clean and foil on the top). Hand off to P2. Pipet 10 mL of the acetonitrile layer into a small beaker. Evaporate to dryness using N-evap. While waiting, set up Florisil column Rinse column twice, once with 10:90 Acetone:Hexane and once with pure hexane Rinse beaker, once with pure hexane, then twice w/10:90 Acetone:Hexane. Pour rinsings through the column and collect them in a beaker. Rinse the column twice with pure hexane, collect rinsings in the same beaker. Evaporate to < 5 mL using N-evap. Transfer to 10 mL grad cylinder and rinse beaker, transferring rinsings. Dilute or evaporate as necessary, until sample volume is 5.0 mL. Transfer to septum-capped vial and prepare GC sample for analysis.
  • 17.
    Risk Assessment andOrganic Solubilities 9 Answers to the Risk Assessment Exercise 1) List as many possible routes of exposure to pesticides as you can think of for an adult human and for a 2-year-old. Consider all forms of pesticides, not just food-use pesticides. Adult • Ingestion of pesticides on food and in drinking water • Inhalation or ingestion of pesticides while applying them in the home or garden • Inhalation or ingestion of pesticides while applying them during work (home pest control, agriculture) • Inhalation or ingestion of pesticides from spray drift if the person lives near an agricultural area • From animal flea collars, foggers, and dip treatments Two-year-old • Ingestion of pesticides on food and in drinking water. This may be more of a problem with children because they tend to eat a less varied diet and they eat and drink more than adults on a per kilogram basis. • Inhalation or ingestion of pesticides from spray drift if the person lives near an agricultural area • From touching animal flea collars and treated fur, then putting hands in mouth • From crawling around in a yard that has been treated with lawn-care pesticides, then putting hands in mouth • From crawling around on the floor of a house that has been fumigated for ants, roaches, termites, etc. • From the clothes and hands of a parent who has been applying pesticides 2) If you eat a salad made with lettuce, carrots, and walnuts that have each been sprayed with a different type of pesticide, what factors would you need to take into consideration in order to estimate how much of each pesticide you actually ingest with this salad? • how much of each vegetable you ate, in grams • the average concentration of the pesticide typically found on each vegetable Other factors you might wonder about include: • How toxic are the pesticidse? • Do the different pesticides have synergistic effects that might amplify the toxic effects? 3) Consider the following statement by Lombardo and Yess 2 about weighing the risks and the benefits of pesticide use: “The concept of relative risk is a difficult one to communicate to the general public. Benefits are usually expressed in economic terms and are perceived as an advantage to business interests, while risks are expressed in life span, injury, or other physiological 2. “The Food and Drug Administration Program on Pesticide Residues in Food,” P.Lombardo and N.J.Yess, Pesticide Residues and Food Safety, B.G.Tweedy, H.J. Dishburger, L.G.Ballantine, and J.McCarthy, eds., American Chemical Society (Washington, DC, 1991), p. 168.
  • 18.
    10 Instructor’s Manual consequencesthat have emotional connotations and can be related to individual concerns. Economic benefits to the consumer from pesticide use in terms of a higher quality, more abundant, cheaper food supply have apparently not been effectively communicated. “Despite the fact that the U.S. population is now the longest lived and best protected in history, the overall perception by most Americans is that they face more risks today than ever before and that the risks will continue to increase in the future.” In the context of the reading in the section above, what do you think might be going on in the minds of the American people that would make them feel this way? Write a half page or so to explain your reasoning in some detail. Students should mention issues related to how different people perceive risk, regardless of the actual risk. They can also discuss the “risk-dread” diagram in the context of the fear of the unknown that most people have and comment on the uncertainty of the long-term effects on human health of the ingestion of small amounts of pesticides. Answers to Post-Lab Questions 1) From a first glance at the structure and composition of methylene chloride, students might readily predict that methylene chloride is not soluble in hexane and is soluble in water. The two electronegative chlorine atoms bound to carbon create bond dipoles and a net molecular dipole, thus making methylene chloride a polar molecule. The results of the solubility tests will provide them with a real observation that methylene chloride is soluble in hexane. They are then left with the task of rationalizing this observation. What must be true is that the intermolecular forces between hexane molecules and methylene chloride molecules must be strong enough to overcome the intermolecular forces between methylene chloride molecules. The apparent paradox can be explained by noting that while chlorine is quite electronegative, it is large and polarizable, which reduces its tendency to concentrate charge in one area of the molecule. 2) Ammonia is more water soluble than triethylamine for two reasons: a) It can act as both a hydrogen bond donor, with an unshared pair of electrons, and a hydrogen bond acceptor, with the three hydrogens bound to the electronegative nitrogen. b) Triethylamine has three very non-polar ethyl groups, rendering a significant fraction of the molecule hydrophobic. It is thus energetically unfavorable for triethylamine to participate in molecular interactions with water molecules. 3) Benzoic acid is insoluble in acid, but soluble in base. The equation for the dissolution reaction is: C O O benzoic acid + OH- + H2O C O - O H
  • 19.
    Risk Assessment andOrganic Solubilities 11 Aniline is insoluble in base, but soluble in acid. The equation for the dissolution reaction is:4) Predict that phenol will be soluble in 6 M NaOH, pyridine will be soluble in 6M HCl, and cyclohexane will be insoluble in both. 5) The following compounds would be able to participate in hydrogen bonding with water: acetone H-bond acceptor benzoic acid H-bond donor, H-bond acceptor oleic acid H-bond donor, H-bond acceptor acetonitrile H-bond acceptor glucose H-bond donor, H-bond acceptor aniline H-bond acceptor Note that the ability to participate in hydrogen bonding with water does not guarantee water solubility. Molecules with an extensive hydrocarbon portion (oleic acid, aniline, and benzoic acid) are non-polar and will not dissolve appreciably in water. NH2 aniline + H3O + NH3 + + H2O O H + - OH O - + H2O N + H3O + N H + H2O
  • 20.
    12 Instructor’s Manual STOCKROOMPREP: ORGANIC SOLUBILITIES This stockroom preparation list applies to a room of 25-30 students working in pairs. Have gloves available for students to use. In the hood 100 mL dropper bottles of these liquids: • acetone • hexane • methylene chloride • acetonitrile • corn oil • aniline 500 mL bottles of these solvents: • hexane (cheapest grade possible) • acetonitrile (cheapest grade possible) 3 dropper bottles (100 mL size) of 6 M NaOH 3 dropper bottles (100 mL size) of 6 M HCl pH paper, range 1-12 Wash bottles of acetone for washing test tubes Near balances Small bottles (< 100 g size) of the following solids: • glucose • benzoic acid Waste Containers • 1 L waste container labeled "Organic Waste---NO methylene chloride" • 500 mL waste container labeled “Methylene chloride waste ONLY”
  • 21.
    Extraction of PesticidesFrom Produce 13 EXTRACTION OF PESTICIDES FROM PRODUCE In this part of the module, students will extract pesticide residues from the produce they have chosen to analyze. The organic solubilities lab should have prepared them to think about why pesticides are more soluble in organic solvents than in water. Reading in Laboratory Manual Organochlorine Pesticides: pages 9–18 Fundamentals of Extraction: pages 30–43 Supercritical Fluid Extraction (if your class is doing this): pages 44–50 Prelab Assignment: page 34 Review Solubility of Organic Compounds: pages 20–29 Time Required • Pesticide extraction: 3 hours • NOTE: This is a long experiment and there is no good place to stop in the middle. The best way to get through it in a reasonable period of time is to do whatever you can to have students get organized ahead of time. The flow chart (part of the prelab assignment) is quite effective in requiring students to plan their lab work before they come into lab. You could also tell them to bring dinner if they don’t read ahead. (This is usually quite effective in encouraging them to prepare!) Before Lab Go shopping for some interesting fruits and vegetables in case the student responsible for shopping forgets to go. Alternatively, call and remind the student assigned to the task. Be sure the GC is fully functional. See the Instructor’s Manual section on preparing the GC for the experiment and plan to have the instrument ready about a week ahead of time, just in case something doesn’t quite work as planned. Pre-lab Discussion The instructor should re-emphasize structure/solubility relationships and remind the students of the purpose of the lab: to extract and quantify pesticide residues on produce with the intent of determining the average exposure consumers receive. Solvent Extraction Extraction should be presented in the context of separating pesticide residues from the vegetable matter in a form that can be analyzed. Show the structures of some organic solvents on the board (draw out the structures---hexane, methylene chloride, acetonitrile, water), then have the students look at the structures of the pesticides they will test for on p. 13 in the module text and determine which solvent would be the best. There is no right answer for this question because the compounds have very different structures, but this exercise provides a good lead-in for reminders about polarity, electronegativity of elements, hydrogen bonding, and like-dissolves-like. Methylene chloride is probably the solvent that will best dissolve most of the chlorinated pesticides shown (like dissolves like); however, it is more hazardous to work with and more expensive to dispose of than a more benign solvent like acetonitrile, the solvent actually
  • 22.
    14 Instructor’s Manual usedin the experiment. Methylene chloride is also inappropriate because it dissolves too many of the polar compounds found in fruits and vegetables, which results in a very messy chromatogram. Supercritical Fluid Extraction If you have access to a supercritical fluid extraction system, it is a nice comparison to have students run their samples using both extraction methods and then compare the results. The SFE process doesn’t take much more time and can easily be fit into the 30 minute waiting period while students wait for the acetonitrile/water layers to separate. More advanced students can tinker with the extraction conditions to optimize the extraction for different pesticides. Depending on the level of the class, the pre-lab discussion on SFE can touch on one or more of the following: • Phase diagrams and the theoretical basis for supercritical phenomena • The flexibility of SFE for fine tuning extraction conditions • Advantages and disadvantages of SFE vs solvent-based extractions Using a surrogate spike The use of an internal standard (the word surrogate is often used preferentially but interchangeably in environmental labs) to measure extraction efficiency is an important concept in environmental chemistry. In short, the surrogate provides information on the efficiency of the extraction by adding a compound of similar solubility characteristics to the mixture before extraction, then measuring the percent of the compound recovered from the sample. The two compounds tetrachloro-m-xylene (TCMX) and decachlorobiphenyl (DCBP) are used as the surrogate compounds to help estimate the recovery of pesticides from the extraction process. The major limitation of using these particular substances as surrogates is that they are not very similar in structure or boiling point to some of the pesticides. In practice, the results show that many students evaporate off the TCMX (and probably the lower-boiling pesticides as well) in the step in which solvents are removed using the nitrogen evaporator. Student recovery of the DCBP is usually higher than recovery of TCMX by at least a factor of two. Issues of contamination Because the ECD is such a sensitive detector, it is important to keep potential sources of organic contaminants to a minimum. Solvents will dissolve contaminants from plastics (pipet tips, plastic bags), rubber (latex pipet bulbs or gloves, rubber CH3 Cl CH3 Cl Cl Cl Tetrachloro-m-xylene TCMX Cl Cl ClCl Cl Cl Cl Cl ClCl Decachlorobiphenyl DCBP
  • 23.
    Extraction of PesticidesFrom Produce 15 washers on blenders, rubber stoppers), vinyl (gloves), and stopcock grease. Teflon is the only non-contaminating plastic. The instructor should ensure that all separatory funnels have teflon stopcocks and that no grease is used in preparing the separatory funnels. If you have access to a machine shop, have them make teflon washers for the blenders. The students must be aware of potential sources of contamination and take special precautions to avoid contact of the extract with plastics or rubber. It is wise to make an extract of each contaminant that might possibly be encountered and run it through the GC to show the students the potential problems and to help them interpret the impurity peaks that may show up in their chromatograms. Make transparencies of the impurity chromatograms (or post the chromatograms in the lab room) to show them to the students before they begin their work so they know the importance of being careful. To make these contaminant extracts, simply place the object (rubber gloves, rubber stoppers, Pasteur pipet bulbs, blender washers, blender caps, etc.) in a small beaker of 10% acetone: 90% hexane (or even just pure hexane) for about 30 seconds. Obtain the chromatogram of these extracts using the same GC conditions as for the pesticide samples and standards. Flow of lab The pre-lab lecture should be as short as possible. This is a long experiment and there is no good place to stop in the middle. Students work in pairs, using the blenders on a first-come, first-serve basis. While waiting 30 minutes for the acetonitrile layer to separate from the water layer, or while waiting for solutions to evaporate, students can take a tour of the GC to see how it works or, if you plan to also do an SFE extraction, students can load their extraction thimbles during this time. Techniques and safety 1) If students have not used a separatory funnel in their prior experiments, the instructor should demonstrate how it works. Show students how to vent the separatory funnel, reminding them to hold the stopper on when they turn it upside down. 2) The instructor should add the surrogate compound to each person's sample, using a gas-tight microliter syringe. Be sure to wash the syringe with acetone (4-5 times) at the end of the day. 3) The most important safety concern for this experiment is the mixture of flammable solvents and sparks generated by blender motors. In the lab room, the blenders should be set up in a geographically different location than the solvents. While we have never had a fire during this experiment, the instructor should know where the fire extinguisher is and not hesitate to use it. Waste Disposal This experiment generates about 250 mL of waste per pair of students. Students should be encouraged to dispose of any acetonitrile/fruit/ vegetable/water/ acetone waste in a separate container from the waste containing hexane. In some areas, water soluble solvents such as acetonitrile and acetone can be drain-disposed in small quantities. Check your local regulations.
  • 24.
    16 Instructor’s Manual STOCKROOMPREP: PESTICIDE EXTRACTION This stockroom preparation list applies to a room of 25-30 students. Suppliers and catalog numbers for non-standard items are included here. In one hood: Solvents • Acetonitrile, Pesticide-grade (Fisher Scientific, catalog # A999-4) Four 500 mL bottles • 10% acetone:90% hexane (volume %), Pesticide-grade Two 500 mL bottles • Hexane, Pesticide-grade (Fisher Scientific, catalog # H300-4) Two 500 mL bottles • Acetone, Pesticide-grade (Fisher Scientific, catalog # A40-4), put out in teflon wash bottles (Fisher Scientific, catalog # 03-409-12A). NOTE: All solvents should be put out in 500 mL glass bottles so they are easy to pour. Before the first use, the bottles should be cleaned and allowed to dry completely, then rinsed with Pesticide or Optima grade acetone. Labels should instruct students to never NEVER stick any implements (pipets, etc.) into the bottles of clean solvent and never NEVER pour solvent back into a bottle of clean solvent. SUPPLIERS: Pesticide or Optima™ grade solvents can be ordered from Fisher Scientific. Although Optima™ grade is the highest quality, the cheaper Pesticide-grade solvents have never caused us any problems with contamination. The teflon wash bottles are essential because of contamination by the plastic from a normal wash bottle. Teflon wash bottles are also available from Fisher Scientific (Catalog # 03-409-12A). In a second hood: Blenders • 5 blenders, with teflon washers if possible (machine shop can make these) NOTE: If there is limited hood space, the blenders should be the first choice of equipment and/or supplies to put in a hood. If there is a fire caused by blender sparks, at least it will be localized in a small, contained, non-flammable space. Be sure no flammable materials (paper, Kimwipes, waste bottles, etc.) are in the hood with the blenders. SUPPLIERS: Blenders can be purchased for a very reasonable price from a local discount store. There is no need to purchase them from a more expensive scientific supply house. Just be sure to purchase glass blenders (not plastic!) and wrap the plastic tops with foil to prevent contamination from dissolving plastic. These blenders are not spark-free, but acetonitrile is not flammable enough or volatile enough to flash at room temperature. Just be sure you do not use these blenders with very flammable solvents such as hexane or acetone. In a third hood: Nitrogen Evaporator Set up the nitrogen evaporator in a different hood. This device can be constructed from some glass or plastic T-tubes, tygon tubing, pinch clamps, and 4-inch 16-gauge syringe needles. Alternatively, Pasteur pipets could be used instead of syringe needles. The gas
  • 25.
    Stockroom Prep: PesticideExtraction 17 used does not necessarily have to be nitrogen, but does need to be clean and oil-free. If there is a clean air supply and a hood (remember, fumes floating around in the lab are a potential fire hazard) available at the students’ individual desks, a better solution would be to have students construct their own evaporator, using air or house nitrogen as the gas. All needles (or Pasteur pipets) should be cleaned with an acetone-soaked Kimwipe before use and at the beginning and end of each lab day. Kimwipes should be placed near the nitrogen evaporator in the hood. A hot plate under the nitrogen evaporator that warms the water bath to just barely above body temperature (~40°C) will speed the solvent evaporation process; however, if the water bath is too hot, pesticide residues will volatilize, resulting in low recoveries. In Control of the Instructor • 15 mL of a 10,000 µg/L TCMX-DCBP surrogate spiking solution, stored in a freezer when not in use (available from Supelco, Supelco Park, Bellefonte, PA 16823-0048, Phone: (800) 247-6628, as their PEST Surrogate Spike Mix, catalog #4-8460M). Prepare this standard using microliter syringes and very small (10 mL) volumetric flasks. • 500 µL gas-tight syringe for dispensing the surrogate (Fisher Scientific, catalog #13-684-106) Supplies and non-flammable chemicals • 250g NaCl • 30 Prep-Sep® Florisil™ funnels, 1 per student (Fisher Scientific, catalog # P476) • 30 15-mL vials with teflon-coated septa, 1 per student (Fisher Scientific, catalog # 03-393C) • 30 2-mL GC autosampler vials with teflon-coated septa (use the supplier recommended for your instrument). You will also need a crimping tool to seal the caps onto the autosampler vials. • 10 knives (cheap serrated knives from a discount store work well) • 10 aluminum pans for chopping produce (grocery store) • Glass wool (about a golf ball sized lump for each pair of students) • Pasteur pipets and latex pipet bulbs Nitrogen Evaporator needle large beaker on hotplate pinch clamp N2 in hotplate here hotplate here hotplate here
  • 26.
    18 Instructor’s Manual •Latex gloves (contamination by plastics is minimized with latex gloves) • 30 #5 one-hole rubber stoppers (very clean), fitted with a Pasteur pipet with the end removed, i.e., no glass protruding from the stopper (see picture below), 1 per student. Waste Containers • Two 1 L waste bottles labeled "Acetonitrile/acetone/fruit/vegetable waste." • One 1 L bottle labeled “Hexane waste” rubber stopper glass tube (Pasteur pipet)
  • 27.
    Instrument Prep: GCAnalysis 19 INSTRUMENT PREP: GC ANALYSIS A capillary GC coupled to an electron capture detector (ECD) is especially well-suited for detection of halogenated organics and is essential for the sensitivity necessary to detect ppb levels of pesticide residues in environmental samples. Preparing the capillary gas chromatograph for the analysis of organochlorine pesticides should be started the week before the experiment begins. If you have not used an ECD before, you might want to start two weeks before. The ECD is a tricky beast and requires special handling compared to an FID or TCD. Because of the long run time (~45 minutes), an autosampler is highly desirable for this experiment. Instrument Setup This analysis is best carried out using a 25 m x 0.25 mm ID fused silica capillary column, loaded with a 0.25 µm film thickness of 5% phenylmethyl silicone. This column is available as the PTE-5 column (catalog #2-4135M) from Supelco, Supelco Park, Bellefonte, PA 16823-0048, Phone: (800) 247-6628, FAX: (814) 359-3044). The detector makeup gas should be an ultra-pure mixture of 95% Ar/5% CH4 (80-100 mL/min) and the carrier gas should be ultra-pure helium (~50 mL/min flow at split vent, 1-2 mL/min through the column). All gases should be connected to the GC using 1/8" copper tubing that has been pre-cleaned at initial setup to remove oils, by first rinsing tubing with methylene chloride, then with hexane and finally methanol. The gases should be passed through a final in-line moisture trap before entry into the GC. The output from all GC ports (split vent, purge vent, detector vent) should be exhausted to a hood. For maximum sensitivity, all injections should be carried out in the splitless mode using a special splitless capillary insert available from your GC manufacturer. Most new capillary GCs are shipped with both split and splitless inserts. The retention times for the pesticides we tested for are given in Table 1. The temperature program and instrument parameters for pesticide analysis are given in Table 2. A sample chromatogram of a standard mixture is shown on page 54 in the student manual.
  • 28.
    20 Instructor’s Manual Table1: Typical Retention Times for Pesticides on a 5% Phenylmethyl Silicone Column Pesticide Retention time (minutes) Chlorothalonil 13.00 Vinclozolin 14.81 Kelthane 17.15, 30.30 DCPA 17.38 Anilazine 18.67 Captan 18.87 Endosulfan 20.23, 22.93 Dieldrin 21.47 Iprodione 29.37 Methoxychlor 30.54 Permethrin 38.28, 38.92 Table 2: Instrument Parameters for Organochlorine Pesticide Analysis Carrier gas He, 1-2 mL/min Makeup gas Ar/CH4, 80 mL/min Detector ECD Injection port insert Splitless Flow from split valve 50 mL/min. Injector temperature 225°C Detector temperature 300-350°C Sample volume 2-5 µL Initial oven temperature: Ramp @ 4°C/min to: Ramp @ 2°C/min to: Ramp @45°C/min to: 140°C, hold 2 min. 220°C, hold 5 min. 250°C, hold 0 min. 265°C, hold 5 min. Purge valve Off, t = 0 min. On, t = 2 min. for the entire run Total run time 47 min.
  • 29.
    Instrument Prep: GCAnalysis 21 Preparation of Pesticide Standards A variety of pesticides are available from Chem Service, 660 Tower Lane, P.O. Box 3108, West Chester, PA 19381-3108, Phone: (215) 692-3026, FAX: (215) 692-8729. The Chem Service catalog is a valuable resource because of its extensive cross-referencing of trade names and common names for pesticides. For example, Kelthane is also known as Dicofol, and DCPA is also known as Chlorthal. We worked out the GC conditions for eleven of the organochlorine pesticides most commonly found on produce (see Table 3). While other pesticides may be observed in an extract, it is not critical for students to know the identity of every peak on a chromatogram. You may choose to make up a standard containing only a few components. If so, it is best to choose pesticides most likely to be found on produce. These are: permethrin (spinach), captan (grapes, berries), iprodione (grapes, berries), vinclozolin (berries), and methoxychlor (apples). Data from a recent article from the Journal of AOAC International, Vol. 75, 1992, pp. 925-933 by H.J. Schattenberg, II, and J.-P Hsu entitled “Pesticide Residue Survey of Produce from 1989 to 1991” is included in Appendix B at the end of the student manual and provides a wealth of information on the occurence of pesticide residues on produce. Using care in handling the powdered pesticides (be sure to check the MSDS sheets accompanying the pesticide shipment), prepare primary stock solutions of Table 3: Pesticides Used in This Experiment with LD50 and Order Number Pesticide Alternate Names LD50 (mg/kg) ChemService Catalog # Anilazine Triazine, Dyrene®, B-622®, Kemate® 2,710 PS-388 Captan Orthocide 406®, Vancide 89®, SR-406® 9,000 PS-25 Chlorothalonil Bravo®, Daconil 2787® N/A PS-1020 DCPA Chlorthal, Dacthal®, Rid®, DAC 893®, Chlorthal- Methyl®, Fatal® 3,000 PS-33 Dieldrin Compound 497®, HEOD, Octalox® 46 PS-76 Endosulfan Chlorthiepin®, Malix®, Hoe 2671®, Thiodan®, Cyclodan®, Beosit®, Thimul®, Thifor®, 18 PS-81 Iprodione Rovral®, Glycophene, Chipco 26019® 3500 PS-1052 Kelthane Dicofol, DTMC®, FW 293 668 PS-82 Methoxychlor DMDT®, Marlate®, Methoxy-DDT®, Dimethoxy-DT® 6000 PS-83 Permethrin Ambush 430 PS-758 Vinclozolin Ronilan® 10,000 PS-1049
  • 30.
    22 Instructor’s Manual individualpesticides at concentrations of 1.00 g/L in Pesticide-grade acetone or methanol (weigh 100 mg of pesticide into a 100 mL volumetric flask or 50 mg into a 50 mL volumetric flask). These primary stock solutions should be diluted with hexane (note change of solvent) to the concentrations shown in Table 4 to give the secondary stock solutions. Because of the volatility of the organic solvents used to prepare the standards, gas-tight microliter syringes are the optimum method for transferring the solutions to prepare the more dilute standards. Fisher Scientific carries the Hamilton series 1700 syringes for volumes between 10-500 mL and series 1000 syringes for volumes above 1 mL. All stock solutions should be stored in a freezer in clean glass vials with teflon-lined septum caps (Fisher Scientific, catalog # 03-393C). If the septum cap has been perforated, replace it immediately with a new one to avoid leaching of the silicone rubber into the solution. If stored properly, the lifetime of the 1.00 g/L standards is several years, and that of the 5,000 and 50,000 µg/L standards is a year or so. Before storing any standard, draw a line on the outside of the vial at the level of the solvent. This will make it easy to spot a standard from which solvent has evaporated or spilled. The multicomponent GC working calibration standards are prepared by using gas-tight microliter syringes to transfer the appropriate amounts of the secondary standards for each pesticide into a single 10 mL volumetric flask and diluting to volume with Pesticide-grade hexane. Because the detector response for each pesticide is different, it is essential to make up working standards that give a comparable detector response for each component. Table 5 lists the detector response ratio for each pesticide relative to anilazine (see p. 60 in the module text for more information on response ratios). Table 6 provides a guide to volumes that should be used to prepare a set of standards containing the eleven pesticides. This is only a guide, Table 4: Preparation of Secondary Stock Solutions Pesticide Concentration of Secondary Stock Solution (µg/L) µL of Primary Standard Used to Prepare Secondary Stock Solution in a 10 mL Volumetric Flask Chlorothalonil 5,000 50 Vinclozolin 5,000 50 Kelthane 5,000 50 DCPA 5,000 50 Anilazine 5,000 50 Captan 5,000 50 Endosulfan 5,000 50 Dieldrin 5,000 50 Iprodione 50,000 500 Methoxychlor 5,000 50 Permethrin 50,000 500
  • 31.
    Instrument Prep: GCAnalysis 23 as your detector may have slightly different sensitivity. Table 5: Response Ratios for Pesticides Pesticide Response Ratio (relative to anilazine) Chlorothalonil 3.48 Vinclozolin 1.88 Kelthane 0.16 DCPA 2.87 Anilazine 1.00 Captan 1.19 Endosulfan I 1.67 Dieldrin 1.75 Iprodione 0.14 Methoxychlor 0.20 Permethrin (cis) 0.11 Table 6: Preparation of Working Standards Pesticide µL of Secondary Stock Solution in 10 mL volumetric flask (Standard #1) µL of Secondary Stock Solution in 10 mL volumetric flask (Standard #2) µL of Secondary Stock Solution in 10 mL volumetric flask (Standard #3) Chlorothalonil 10 25 50 Vinclozolin 25 50 100 Kelthane 250 500 1,000 DCPA 15 35 70 Anilazine 50 100 200 Captan 30 75 150 Endosulfan 30 60 120 Dieldrin 20 40 80 Iprodione 30 75 150 Methoxychlor 50 100 200 Permethrin 50 100 200
  • 32.
    24 Instructor’s Manual Table7 provides the final concentrations of the components in the working standards prepared according to Table 6. The lifetime of the working calibration standards is 3-4 weeks, if the vials are stored in the freezer when not in use and the septum caps are intact. Preparation of Surrogate Standards The surrogate used in this analysis is a mixture of tetrachloro- meta-xylene (TCMX) and decachlorobiphenyl (DCBP), available from Supelco, Supelco Park, Bellefonte, PA 16823-0048, Phone: (800) 247-6628, as their PEST Surrogate Spike Mix, catalog #4-8460M. This commercially prepared primary standard is 200,000 µg/L. For GC surrogate analysis, 20, 50, 80, and 100 µg/L standards should be prepared. This can be done by carrying out an initial 100-fold dilution to give a secondary standard with a concentration of 2,000 µg/L. Dilution of 100µL of the primary standard to a final volume of 10.0 mL with hexane will provide this secondary standard. To prepare the working standards, use the amount of secondary standard indicated in Table 8 and dilute to 10.0 mL with hexane. Use gas-tight microliter syringes (Fisher Scientific) to carry out all transfers. While you have the concentrated surrogate solutions out, you may also want to prepare the 10,000 µg/L surrogate spiking solution to add to the students’ samples before processing. Table 7: Final Concentration of Working Standards Prepared According to Table 6 Pesticide Concentration of Components in Standard #1 (µg/L) Concentration of Components in Standard #2 (µg/L) Concentration of Components in Standard #3 (µg/L) Chlorothalonil 5 12 25 Vinclozolin 12 25 50 Kelthane 125 250 500 DCPA 8 17 35 Anilazine 25 50 100 Captan 15 32 75 Endosulfan 15 30 60 Dieldrin 10 20 40 Iprodione 150 320 750 Methoxychlor 25 50 100 Permethrin 250 500 1,000
  • 33.
    Instrument Prep: GCAnalysis 25 A representative chromatogram of the standards and surrogates is shown on the following page. Conditioning of the Column and Preparation of the ECD The column must be conditioned carefully to ensure saturation of the sites on the stationary phase and on the glass insert in the the injection port. This is done by injecting the most concentrated standard onto the column and allowing the temperature program to run its course. The number of times this must be repeated is related to the age and previous use of the column and detector. If the column is new, it will take longer to condition the system than for a previously-used column. If the column has been sitting unused for a more than a few days, but has been previously used for the analysis, fewer injections will be required. Best results will be obtained if the column is reserved for pesticide analysis only. The practice of “baking out” the column at the end of the day will drastically reduce the sensitivity of the analysis and should not be done on a routine basis. The ECD is quite sensitive to temperature changes and functions best if it is left on at 300-350°C at all times, with the makeup gas flowing. Getting a good baseline after the detector has been turned off often requires cycling the GC through the temperature program a number of times. Conditioning of the column can be done at the same time by injecting the highest standard and cycling through the temperature program until a flat baseline is achieved throughout the run. With an autosampler, the easiest method is to set up the instrument to run the conditioning standard overnight (an out-of-date, high-concentration working standard works well for this purpose). If the column and ECD have been used within a day or so and the instrument has been left on in the interim, it is usually only necessary to run the conditioning standard a few times (2-4) before analyzing real samples or standards. Interruption of a sequence of runs by more than 2-3 hours may result in deterioration of the accuracy of the standard curve, so it is best to run all samples with no interruption. The mid-range standard should be run periodically between samples to ascertain the continuing accuracy of the standard curve. To avoid contamination of the ECD, don’t use it for other experiments where significant concentrations of halogenated compounds are present. One shot of as little as 1µL of methylene chloride will decommission the ECD for several days!! Table 8: Preparation of Surrogate Standards Working Standard Concentration (µg/L) Volume of 2,000 µg/L standard to dilute to 10.0 mL with hexane (µL) 100 500 80 400 50 250 20 100
  • 34.
  • 35.
  • 36.
    28 Instructor’s Manual Usingan MSD with Single Ion Monitoring (SIM) While we did not use an MSD in our development work, people do routinely use an MSD for detection of organohalogen compounds. Sensitivity will likely be somewhat less than with an ECD, but can be enhanced by using the technique of single ion monitoring, which can be programmed easily with most commercial GC-MS instruments. The technique allows you to focus the spectrometer scan on several high-intensity ions characteristic of each pesticide. The four most intense ions of the pesticides analyzed in this experiment are given in Table 9 below. An advantage of this technique is that most impurities do not show up because they do not (except by coincidence) have fragment ions of the same mass as the pesticides. Sensitivity can also be enhanced in the SIM analysis by tuning the MSD for maximum response in the 100-300 mass range. Table 9: Intense Ions of Pesticides for Single Ion Monitoring by Mass Spec a The intensity of the peak is given in parentheses as a percentage of the base peak. bData from Mass Spectra of Environmental Contaminants, 2nd edition, Ronald A. Hites, Lewis Publishers (Boca Raton, FL, 1992). c Not available. TROUBLESHOOTING GUIDE FOR GC ANALYSIS There are a number of possible problems that might be encountered in any GC analysis of trace level components. Some of them have to do with the particular analysis and others relate only to the GC conditions. What follows is a list of common problems and some potential solutions. If you really get stuck, you should probably call your GC manufacturer’s technical service department. No peaks observed when sample injected • Check that there is enough sample in the autosampler vial. • Check to be sure the syringe is not clogged. • Check that the injection port insert is splitless and the split ratio is no higher Pesticide m/z of Intense Ions in Mass Spectruma,b Anilazine 239 (100), 241 (66), 178 (35), 143 (33) Captan 79 (100), 77 (42), 80 (25), 149 (21) Chlorothalonil 266 (100), 264 (85), 268 (52), 109 (30) DCPA N/Ac Dieldrin 79 (100), 82 (42), 81 (35), 108 (21) Endosulfan 195 (100), 241 (80), 197 (77), 237 (70) Iprodione 56 (100), 43 (93), 58 (61), 314 (41) Kelthane 139 (100), 111 (36), 141 (29), 250 (27) Methoxychlor 227 (100), 228 (23), 152 (10), 138 (10) Permethrin 183 (100), 163 (16), 165 (12), 184 (9) Vinclozolin N/Ac
  • 37.
    Instrument Prep: GCAnalysis 29 than 50:50. • Check that purge valve is off for at least two minutes after injection of sample. • If the column or detector has just been changed, the positioning of the capillary column in the detector or injector might be off. Check this and reposition the column if necessary. • If the column is new, be sure it is properly conditioned. • Is the detector on? Too many peaks observed during a run • Are the gas lines and gases clean? To check this, run the temperature program without injecting a sample. If you observe extra peaks, suspect the purity of your gases. If you don’t have in-line oxygen and water filters, get them. You may need to buy higher purity gases. • Is the syringe clean? If you are using an autosampler, check to be sure the wash vials are filled. Try a new syringe. • Are there contaminants in the solvent? Inject pure solvent to check. Have only Pesticide-grade solvents been used in all analyses? Are there known impurities that may be present from the procedures? If so, extract the suspected contaminant and obtain a chromatogram for cross-checking. • Are there contaminants or incompatible compounds in the sample? Some samples contain compounds that interfere with ECD pesticide analysis. These include broccoli, brussel sprouts, cabbage, cauliflower, citrus fruits, avocadoes, and carrots. Wandering baseline • Is the instrument just warming up? It may take several injections and over a day for the ECD to stabilize and give a good baseline. If this is the problem, be patient and keep injecting samples and cycling the instrument through the temperature program. • Is there methylene chloride contamination? If so, it may take several days to get the detector to calm down. • If the baseline rises during the analysis, you can still get useful data by putting in additional autozero commands at unimportant times (i.e., no peaks come out at these times) in the method. Irreproducible Retention Times • Is the carrier gas tank turned on? • Is there sufficient gas pressure in the tank? • Is the capillary column partially clogged? You can check this by detaching the detector end of the column and placing it in a beaker of water. If the column is clear, you should see a steady stream of bubbles coming out of the end. Detector signal off-scale and won’t come back on scale • Check to be sure the make-up gas is on and there is sufficient pressure in the tank. • Is the detector sufficiently warmed up and stabilized? Depending on your detector, this may take 30 minutes to a few hours. • Is it time for a new detector?
  • 38.
    30 Instructor’s Manual INSTRUMENTPREP: SFE EXTRACTION This method was developed using a Hewlett-Packard 7690T SFE system. Your system is likely to be somewhat different; however, the conditions given in Table 10 below should be readily transferable between instruments. The parameters above provide conditions for a good general extraction program, but the conditions don’t work equally well for all pesticides. If you are only going to analyze for a select few pesticides, you may want to experiment with different times, temperatures, and pressures to optimize the conditions for those particular pesticides. Instrument Supplies • Ultrapure CO2 with eductor tube to use as the supercritical extraction fluid (from your local gas supplier) • xxx-grade CO2 to use for cooling (from your local gas supplier) • Extraction thimbles, thimble caps, funnels, etc. (from SFE system manufacturer) • Pesticide-grade hexane • Pesticide-grade acetone • 2-mL GC autosampler vials with teflon-coated septa (use the supplier recommended for your instrument). You will also need a crimping tool to seal the caps onto the autosampler vials. Some Precautions for Best Performance Leaks are common in these systems and are usually caused by solid materials that find their way into the threaded part of the extraction thimble/thimble cap. The best way to avoid this problem is to clean the threads on both the thimble and the thimble cap before use and using a thimble funnel (screws into the thimble so threads Table 10: Conditions for SFE Pesticide Extraction Parameter Value Extractant Ultrapure CO2 Pressure/Density Extraction temperature Extraction time Static Flow Nozzle temperature Trap packing Stainless steel or C18 Trap temperature Rinse solvent #1 Pesticide-grade hexane 2 mL Rinse solvent #2 (cleanup solvent) Pesticide-grade acetone 5 mL??
  • 39.
    Instrument Prep: SFEExtraction 31 are not contaminated) to load the produce. Be sure to stuff all the loose ends of the plant material down into the thimble before removing the funnel. Wipe the threads clean if necessary, then put on the thimble cap. The thimble caps clog easily---proper maintenance is essential if the caps are to last for more than one extraction. After each extraction, the caps should be immediately placed in a beaker of water or acetone to prevent the plant material stuck on the caps from hardening. The caps should then be sonicated, first for 15 minutes in distilled water, then for 15 minutes in Pesticide-grade acetone. The use of an additional filter within the funnel (the Kimwipe™ in the procedure) helps to keep solid matter from contaminating the thimble caps in the first place.
  • 40.
    32 Instructor’s Manual DATAANALYSIS AND DEBATE PREPARATION The goal of this day’s lab work is to teach the students about interpreting the data they acquire from the GC and to prepare them for the upcoming debate. It is important to communicate to the students the human factor in data interpretation. The setting of tolerance levels should also be discussed in order to show students the connection between instrument accuracy and sensitivity, and laws regulating pesticide use. Reading in Laboratory Manual Gas Chromatography: pages 51–63 Pesticide Regulations: pages 76–80 The Greate Debate: pages 82–85 Time Required • Chromatogram interpretation: 30-40 minutes • Calculations and data entry: 20-30 minutes • Discussion of data: 20-30 minutes • Preparation for Pesticide Debate: 20-30 minutes Before Lab • Select students to be in the Debate Groups, Agribusiness and Envrionmentalists. Be sure to divide the strong and/or articulate students equally, so both groups are on a fairly even playing field. • Have the GC files available in case students need to reintegrate their chromatograms. • Print out chromatograms and report printouts for each student’s sample(s). Prepare a spread sheet for students to enter their data into such as the one sketched out below. A sample data set from our class can be downloaded from the web at: http://www.cchem.berkeley.edu/~chem1a/echem.S97/Pesticides/Pest2.html Pre-lab Discussion Begin by spending a few minutes introducing the importance of tolerance levels in pesticide regulation, defining them and discussing the rather random way they have been set in the past (see student manual). Emphasize that ultimately, the tolerance level depends on the technology available for detection. As detection limits have plummeted in the last 10-15 years with advances in GC and detector technology, Name (Partner) Produce tested mass (g) Pesticide(s) found Conc. µg/g Tolerance (µg/g) µg/L TCM X % recovery µg/L DCBP % recovery Gilbert (Elizabeth) Apples washed/ unpeeled 50 Methoxychlor Kelthane 0.14 0.046 14 5 17 19 17 19
  • 41.
    Data Analysis andDebate Preparation 33 tolerance levels that were once set at the detection limits are now being revised. This part of the module is also a chance to convince students of the value of skepticism in chromatogram interpretation and data analysis. Students tend to believe something if it is on a computer printout, regardless of the quality of the data. This laboratory period will give them a chance to practice with critical analysis of data. Gas chromatography It is useful to emphasize the differences between organic and inorganic substances in terms of volatility and use this to lead in to GC as a separation technique. Only volatile substances can be analyzed this way, and the analysis is for substances in the gas phase. Pages 51–61 provide detailed background information on gas chromatography. Most freshman students have no trouble understanding basic chromatographic concepts. The table below is a good way to present chromatography basics in a way that allows comparison between different types of chromatography (thin layer chromatography, paper chromatgraphy, ion chromatography, high pressure liquid chromatography). For an advanced class, this will help the students see the similarities between the different types of chromatography. Depending on the level of the class, discussion of the ECD or the MSD as a detector can range from a simple explanation of its advantages in quantifying organohalogen compounds to a complete description of the electronics involved in making it work. If possible, have your students take a "GC tour" of the instrument, so they can see it and explore how it is put together. Interpreting a chromatogram Return the chromatograms to the students. Remind them how important it is to look at the chromatogram carefully and critically, not just to read off numbers from the report. Instill in them that they should never trust a computer! Common computer mistakes students should know about include: • Sometimes the GC will label a peak as a pesticide, even though the retention time is far off from the expected retention time. Students must compare actual and expected retention time of a suspected peak. If it is within 0.15 minutes, there is a good chance it really is the component in question. If not, it is worth being suspicious. • Sometimes the GC will label a peak as a pesticide, even though the peak is not really shaped like a peak. Shapless blobs will sometimes be labeled as peaks and students must look at the chromatogram to determine if the peak is real. • The integration of the peaks may not be correct, due to computer error in drawing the baseline. This explains a surrogate recovery greater than 100% that is sometimes observed. To fix this problem, students will need to go back to the mobile phase helium gas stationary phase organic resin that compounds stick to (dipole-dipole interactions) column 0.25 mm x 30 m (capillary) chromatographic “force” high pressure gas temperature of analysis 30-400°C, as needed detector Electron Capture (ECD)
  • 42.
    34 Instructor’s Manual computeron the GC, fix the baseline, and reintegrate the peak. It is good to leave some extra time to do reintegrations during this class period. • Remind them of interference peaks. Chromatograms of expected interferences (rubber gloves, rubber stoppers, blender washers, pipet bulbs, etc.) should be posted in the lab. Overheads of these chromatograms (available in the Appendix of this Instructor’s Manual) are useful for the pre-lab lecture. Method Detection Limits and Tolerance Levels The concept of method detection limit (MDL) is an important one for students. Because of the different response ratios for the different pesticides, the MDLs are different for each pesticide. The table on p. 62 in the module text provides an estimate of the MDL (25% of the lowest standard concentration for each pesticide) for our instrument and conditions, assuming the peak shape and and retention time are acceptable. Your instrument will likely have different MDLs, so you should experiment with very low concentrations of standards. Discuss tolerance levels and point out that the differences in MDLs for the different pesticides have implications for setting tolerance levels, since they cannot be set lower than measurable levels. The students may wish to use this information in preparing their debate presentation. Data Analysis Give students 10-15 minutes to work with their extraction partners to compare the chromatograms and decide which peaks are real and should be entered into the database. Have them fill out the table on p. 63 in the module text for their chromatogram and be sure the instructor checks the results. The instructor should be actively working with the student groups to help them with any questions. Calculations Spend a few minutes going over the calculations to determine the concentration of pesticides in produce and for surrogate recovery. This part is difficult for students. An overhead transparency of Figure 3-2 in the module text will be helpful in presenting this material, but it is a good computational exercise to let them work with each other and struggle a bit to figure it out. • Calculation of Concentration of Pesticides in Produce Use the concentration of pesticides in the sample analyzed by the GC and the total volume of the GC-ready extract (5 mL) to calculate the number of µg in the entire extract. For an example, look at a pesticide with a concentration of 426 µg/L in the GC-ready extract. Knowing that only a fraction of the sample was carried through the entire analysis, correct for the actual volume of sample analyzed (the 10 mL aliquot out of 110 mL total volume of acetonitrile). Continuing with the above example: The final step is to calculate the concentration of the pesticide residue on the 50 g of produce analyzed. This number can be directly compared to the tolerance levels, 426µg L × 0.005L = 2.13µg of pesticide in GC extract 2.13µg 10mL × 110mL = 23.43µg in the entire acetonitrile extract
  • 43.
    Data Analysis andDebate Preparation 35 as given in Appendix A in the module text. • Calculation of Surrogate Recovery The surrogate recovery provides an estimate of the efficiency of the extraction procedure. First, determine the theoretical maximum percent recovery of surrogate. Correct for the actual amount of sample taken through the entire procedure. Determine the theoretical maximum concentration of surrogate in the 5 mL GC extract. Finally, compare this number to the actual number for surrogate recovery obtained for a real sample and multiply by 100% to obtain the percent recovery. If students get low surrogate recoveries, they may have lost some of the surrogate compounds and pesticides either by physical processes (spilling, not rinsing the Florisil™ column enough) or by evaporation due to heating the sample too much in the nitrogen evaporation step. Loss by evaporation is more significant for TCMX (typically 30-40% recovery) than DCBP (typically 70-80% recovery) because it boils at a much lower temperature than DCBP and is “blown-off” in the nitrogen evaporation step. There will even be differences in lab partners’ sample handling that will show up here. This difference in recovery for the two surrogates also points out that neither of the two numbers are necessarily accurate for all pesticides. Those pesticides that have boiling points similar to DCBP (and correspondingly elute later on the chromatogram) will have percent recoveries similar to DCBP. The same is true for pesticides with boiling points closer to TCMX. It should be pointed out that surrogate recoveries are only a guide to how efficient the extraction is and no exact corrections can be made. In the environmental analysis business, surrogate recoveries are only reported, not used to calculate “corrected concentrations.” Results and Discussion Have students share their raw data (pesticide and surrogate concentrations in the GC extract in µg/L) with the class, either by putting the results up on the blackboard or entering them into a spreadsheet or graphing program. Once all the data is entered and everyone can look at it, have the students critique the data set. Do all duplicates match? Are all reported results above the MDL? Look at the "hits," where measurable pesticide residues were found in the produce samples. Is there Dieldrin (banned 20 years ago)? What pesticides occur commonly on different fruits and vegetables? Are there peaks in the student chromatograms that look like pesticides but are not in the standard mixture (these may be real!)? These questions will generate discussion about the results. Preparing Students for the Pesticide Debate If the class is doing the debate, the remainder of the class period should be used 23.43µg of pesticide 50.0 g of produce = 0.47µg / g = 0.47 ppm 500µL × 10,000µg L × 1L 106 µL = 5µg of surrogate added 5µg 110mL × 10mL = 0.45µg of surrogate in GC extract 0.45µg 0.005L = 91µg / L surrogate in GC extract
  • 44.
    36 Instructor’s Manual todivide students into two groups of 8-12 students each, Agribusiness and Environmentalists. It is best for the instructor to choose the groups before the lab period. The students should be put into groups based on abilities, with an attempt to equally divide students of different abilities. The groups should meet during this lab period to look over the procedures for the debate and the data they collected, and determine who in the group will play the different roles described on p. 82 in the module text. There are 10 sets of individual readings, each set containing one or more related articles. References to these web-based readings can be found at http://mc2.cchem.berkeley.edu/MCsquared/UCB/Echem/Pesticides/Pestshort.html. Additional references are cited in the module text. On the web, the reading sets are color-coded depending on the slant the group publishing the article brings to the debate, red for the Agribusiness side, green for the Environmental side, and black for (apparently) neutral sources. The stronger students should be made responsible for the readings in Sets #7 and #8 on the regulation of pesticides, since these articles are essential for making a good argument about the existing pesticide regulations. Give each student his or her individual reading assignment and emphasize that everyone will be expected to have read not only their individual readings, but also all of the module text on pesticides and risk assessment. Fully explain the grading scheme and the fact that they must bring to class a one-page summary of their readings (and copies to hand out to all) the next week. The one-page summary is quite effective in ensuring that students take the reading assignment seriously and come prepared to present their knowledge to the group. NOTE: It is critical for students to do this assignment; otherwise the debate will be a flop because they won’t know enough to put together a good set of arguments. Be sure to make this clear to the students. Flow of Lab Begin with an overview of data analysis and chromatogram interpretation, then have the students meet with their partners to review their data and determine which peaks are real on their chromatograms. If they need to re-integrate their chromatograms, this is a good time to do it and provide students with an opportunity to learn more about the hands-on use of the gas chromatograph. Have students write their GC data on the board, then lead a class discussion about the data and its validity. Describe how to do the calculations to convert the GC data in µg per liter of extract to µg per gram of produce. Go over the expectations for the final lab report, then break the students into their debate groups to plan their debate strategy.
  • 45.
    The Great Debate37 THE GREAT DEBATE The goal of this day’s work is for students to use the data they acquired to debate the issue of pesticides in the food supply and to examine the effectiveness and fairness of the Food Quality Protection Act of 1996 from different points of view. Web Readings Each student should have read his or her assigned web reading and prepared a summary of the article to hand out to fellow students in preparation for the debate. Reading in Laboratory Manual Review: Organochlorine Pesticides: pages 9–18 Risk Assessment: pages 64–74 Pesticide Regulations: pages 76–80 The Greate Debate: pages 82–85 Time Required • Debate preparation: 60-90 minutes • The Debate: 30-45 minutes • Peer Grading: 10 minutes Before Lab • Print out a copy of the data set for students to use in their debate. • If you have an overhead projector available for students to use, bring blank transparencies and pens for students to write on them. They can give more effective presentations with visual aids. • Prepare a list of the students in the class to help you keep track of particpation in the discussion. • Make copies of the Peer Grading sheet on p. 40 in this Instructor’s Manual, one for each student. Flow of Lab Remind students about report due dates and expectations. See following section in this Instructor’s Manual. Hand out pesticide data to all students and tell them that in order to make an effective argument, they will need to use the data they obtained. Any knowledge about uncertainty in the measurements, capability of the instrument and the detector used, and other experimental details might help (or hinder!) their arguments. Students get into their groups and spend about 60-90 minutes formulating their debate plan, according to the questions in the lab manual. You should tell students they have slightly less time than you have actually allotted. Even with a timekeeper, students are usually not prepared at the end of the designated time. At this point, it is useful for the instructor to remind them to be sure to address the questions on page 83 in the module text. The group activities during this time period should flow as outlined below. Debate preparation begins with each student giving a 2-minute summary of each reading to the group (~25 minutes). The timekeeper should be sure everyone stays on track. Students who have the same set of readings (most sets contain more
  • 46.
    38 Instructor’s Manual thanone article) should alternate being the first presenter to the group. The summarizer should summarize what the group has heard, once in the middle and once at the end of the individual reports, reminding the group of the main questions they need to address. The recorder should write down the main points. The spokespeople should listen closely for any facts they might want to use in their arguments. Using the information presented, the group should now begin to formulate a position consistent with their interests (Agribusiness, Environment). The director will play a major role in reminding the group of its mission, which is to address the questions on p. 83 in the module text. The summarizer should speak every 10-15 minutes to clarify what has been discussed. The timekeeper should keep an eye on the remaining time and move the discussion along if it gets bogged down on one particular point. At the end of the discussion, the recorder will have the group go back over the questions and write down the consensus of the points to be made in the presentation by the spokespeople. The debate will follow and should last ~30-45 minutes. You, the instructor, are the director of the debate, with your mission being to ensure that as many people as possible have a chance to contribute to the debate. You should also be sure to cut it off before the students begin going in circles or just reiterating points already made. Here are some rules students must follow (write these on the board or hand them out ahead of time). • The preliminary speeches by the spokespeople may not exceed 10 minutes. • No interrupting is allowed. Students must be acknowledged by the instructor before speaking. • Any comment during the general discussion is limited to ~1 minute. No filibustering! • Courtesy is of utmost importance! Just because you disagree with someone does not mean you have to be rude to them. During the debate, it is most important for the instructor to be watching all students in the room, not just the ones who are dominating the discussion. The debate is most successful if there is participation from as many students as possible. You may wish to have a list of students on which you make a mark next to a student's name each time she or he speaks. This will provide a concrete reminder of who has contributed more or less than their share, and, while you should not try to stifle creative comments from the talkative students, you can choose to call on other students besides the "talkers." Watch out for gender bias in which students you call on. Studies have shown that males are more agressive than females at being recognized in a group where they must compete for "permission" to talk. It is easy for the hand-wavers to obscure your notice of the rest of the students. Again, keeping a list of students and how often they have responded will be useful. At times during the debate, you may need to ask for clarification from a student if a question or comment is worded in a way that is difficult to understand. Keep students to the 1 minute limit for comments. As the end of the time approaches (or as the discussion slows down or students start to repeat themselves), you should bring the debate to a close by summarizing the evolution of student opinion throughout the course of the debate. Be sure to highlight the good points the two groups have made (you should write these down as you hear them), with particular emphasis on solutions to the problem, not just differences of opinion. Often students have come to some middle ground by this time and it is useful to remind them that the problem of pesticides and food production is not just black or white and they have illustrated this first hand. Finally, compliment everyone on their participation and effort. After the debate is over, the students should spend 5-10 minutes assigning
  • 47.
    The Great Debate39 grades to the other students in their group. Students do not grade themselves. It is important that they give this careful thought, so be sure everyone takes this seriously and does it with quiet and in private. Potential problems and How to Handle Them • Overly aggressive students: A gentle way to handle these students is to compliment all talkative students for their wonderful insights, but you want to be sure that others have a chance to state their opinions and to remind them that you must call on them first before they can speak. Don't dwell on it, but move things along by immediately calling on someone else to continue the debate. If this doesn't work, you may need to stop the debate and remind all students of the rules. At worst, you may have to ask a particular student to refrain from participating. • Overly passive students: There are many students who are reluctant to speak their mind for fear of saying something "stupid" in the eyes of their classmates or just because they are uncomfortable speaking in front of a large group. Often it is possible to bring these students out of their shells if the issue excites them enough to motivate a response. As director of the debate, you should watch closely for indications that these shy students might be willing to contribute to the discussion. If you see someone with a half-raised hand or an eager look, be sure to call on him or her as soon as possible. If you wait and let another "eager beaver" student speak first, you will have lost them. If you missed the boat on getting them to contribute, you might be able to bring them back by saying something like, "Tina, I noticed you had your hand up a minute ago---would you like to say something?" • The debate is going in circles: Sometimes the students will get into a line of argument that appears to be going nowhere. At this point, it is useful to re-focus them on the questions of p. 83, perhaps saying: "But what effect does this point you're making have on the way pesticides are regulated?" or something to that effect that brings the discussion back to the broader issues. • Students who have not done the assignment: These students are a problem for the rest of the group because there will be a hole in the group's knowledge base. The best solution is prevention. Be sure all students know what will be expected of them the week before and how their performance will be graded. Peer Grading On the following page is a sheet to be handed out for students to use in grading each other for their work in preparing the debate.
  • 48.
    40 Instructor’s Manual ParticipationGrades for the Pesticide Debate (see p. 85 in the module text for guidelines) Your Name: Your Group: Names of Group Members (do not list yourself) Summary Grade Discussion Grade
  • 49.
    The Report 41 THEREPORT You may wish to customize the instructions for the students’ lab reports (see pages 94–98 in the module text). The existing instructions request a full written report, with students expected to explore the issue of pesticides in the food supply in some detail. An alternative format that is less demanding for students would be a simple report of the class data, showing detailed calculations and including comments on the significance and validity of the data. Several post-lab questions are provided as well. Answers to these questions can be found below. If instrumentation is the focus of the course, the report could be more related to the subtleties of GC analysis of organochlorine pesticides. Reading in Laboratory Manual Final Report for the Pesticide Module: pages 94–98 Answers to Post-Lab Questions 1) The yearly exposure to Alar can be calculated as follows: First, obtain an average concentration of Alar in apples and apple products by taking into account the assumptions that the concentration of Alar in apples is 30% of the tolerance level and only 5% of the pesticide measured at the farm gate is contained in the food. 5 µg/g x 0.30 x 0.05 = 0.075 µg/g Next, calculate the absolute amount of Alar ingested in a year. For a child who eats 4 oz of applesauce and 8 oz of apple juice: 12 oz/day x 28 g/oz x 365 days/yr x 0.075 µg/g = 9,198 µg/yr For an adult who eats three 6 oz apples per week: 18 oz/week x 28 g/oz x 52 weeks/yr x 0.075 µg/g = 1,966 µg/yr Finally, calculate the amount of pesticde ingested per kg of body weight: For a 10 kg child: 9.20 mg/10 kg = 0.92 mg/kg For a 70 kg adult: 1.97 mg/70 kg = 0.028 mg/kg The amount of pesticide ingested per kg of body weight is 320 times greater for a child than for an adult. Clearly, the tolerance levels should reflect this difference in exposure between adults and children. 2) Set I Chlorpyrifos, 1.12 mg/L in water at 24°C Dicamba, 5,600 mg/L at 20°C Dicamba is more water soluble because it can form hydrogen bonds to water through the carboxyl group.
  • 50.
    42 Instructor’s Manual SetII Aldicarb, 6,000 mg/L at 25°C Kepone, 7.6 mg/L at 25°C Aldicarb is more water soluble because it can form hydrogen bonds to water through the amido group. In addition, there are multiple electronegative or highly polarizable heteroatoms with unshared pairs of electrons (N, O, S) present in the aldicarb molecule. Organochlorines are typically not very water soluble. Kepone is particularly insoluble because it is a symmetric molecule, and the bond dipoles between carbon and chlorine atoms tend to cancel out.
  • 51.
  • 52.
  • 53.
  • 54.
    Appendix A: TransparencyMasters 45 0 5 10 15 20 25 MortalityRatio Never Smoked 1-9 10-20 >20 Cigarettes Smoked Per Day
  • 55.
    46 Instructor’s Manual OO OH OH benzopyrene intermediateepoxide ultimatecarcinogen
  • 56.
  • 57.
  • 58.
  • 59.
  • 60.
  • 61.
    52 Instructor’s Manual +-+-+- +- + - +- +- ++ + + - - - -
  • 62.
    Appendix A: TransparencyMasters 53 WATER MOLECULES FORM HYDROGEN-BONDED CLUSTERS
  • 63.
  • 64.
  • 65.
    56 Instructor’s Manual ClC H Cl H H3C C H3C O CH3 C N H3C CH2 CH2 CH2 CH2 CH3 H O H H O CH3 methylene chlorideacetone acetonitrile hexane water methanol
  • 66.
  • 67.
  • 68.
  • 69.
  • 70.
  • 71.
  • 72.
    Appendix A: TransparencyMasters 63 BIOACCUMULATION person 10,000 ppb DDT .. trout 3,000 ppb DDT . invertebrates 800 ppb DDT .. sediment 300 ppb DDT water 0.5 ppb DDT
  • 73.
    64 Instructor’s Manual Pesticide Solubilityin Water (mg/L) at 20°C Half-Life Chlordane 0.1 3.3 years Dieldrin 0.17 >7 years Endosulfan 0.5 35-190 days Cl Cl Cl Cl CCl2Cl Cl Cl Cl Cl Cl O CH2 CCl2 O S O O Cl Cl Cl Cl CCl2
  • 74.
    Appendix A: TransparencyMasters 65 Captan 0.5 1-12 days Dichlobenil 18 1 year Carbaryl 32 4-29 days Pesticide Solubility in Water (mg/L) at 20°C Half-Life N-S-CCl3 O O CN ClCl O C HN O CH3
  • 75.
    66 Instructor’s Manual Malathion 1434-6 days 2,4-Dichlorophenoxy- acetic acid 682 1-14 days Pesticide Solubility in Water (mg/L) at 20°C Half-Life H3CO P S S OCH3 H OCH2CH3 O OCH2CH3O Cl Cl O-CH2-C O OH
  • 76.
    Appendix A: TransparencyMasters 67 CO2CH3 Cl Cl CO2CH3 Cl Cl CN Cl Cl Cl CN Cl Cl Cl N N O O(i-Pr)HNOC N-S-CCl3 O O O S O O Cl Cl Cl Cl CCl2 N N N H NCl Cl Cl Cl Cl Cl Cl O CH2 CCl2 OC O O H CH3 CH3 H Cl Cl Chlorothalonil DCPA Iprodione Captan DieldrinEndosulfan Anilazine Permethrin Cl Cl N O O O CH3 Vinclozolin CH CCl3 H3CO OCH3 Methoxychlor C CCl3 Cl Cl Kelthane OH
  • 77.
    68 Instructor’s Manual §180.378 Permethrin; tolerances for residues. Commodity ppm Apples 0.05 Artichokes 10.0 Asparagus 1.0 Avocados 1.0 Broccoli 1.0 Cabbage 6.0 Celery 5.0 Cauliflower 1.0 Cherries 3.0 Corn, forage 60.0 Eggplant 1.0 Filberts 0.05 Garlic 0.1 Lettuce (head) 20.0 Mushrooms 6.0 Onions 0.1 Peaches 5.0 Pears 3.0 Potatoes 0.05 Soybeans 0.05 Spinach 20.0 Tomatoes 2
  • 78.
    Appendix A: TransparencyMasters 69 0 20 40 60 80 100 120 140 160 Thymus Stature Brain Kidneys Spleen Ovaries Uterus Testes Age (Years) b 2 4 8 13 17 % of Adult Organ Weight
  • 79.
  • 80.
  • 81.
  • 82.
    Appendix A: TransparencyMasters 73 total volume of acetonitrile extract, T aliquot of extract removed for further processing, A evaporation Florisil cleanup evaporation volume of sample ready for GC analysis, G volume of surrogate added, S
  • 83.
    63 Appendix B: Evaluation Dataon the Pesticide Debate
  • 84.
    64 Instructor’s Manual Whatfollows is evaluation data collected over the course of 5 semesters at the University of California, Berkeley on freshmen students taking special environmental laboratory sections as an alternative to the traditional laboratory offered with the large freshman chemistry course. The data presented here indicate the effects of the debate on the students’ opinions of the exercise, in addition to an evaluation of the effect of the debate on students’ views towards pesticide use. Overview In the pesticide lab, students extract organochlorine pesticides from fruits and vegetables and use their data in a role-playing exercise. The students are divided into two groups, one representing the Agribusiness and Chemical Manufacturing Industry and the other representing the "die-hard" Environmentalists. A week before the lab, they are provided with readings (each reading had two students responsible for reporting on it) that supports their sides of the story (somewhat---a few of the readings were the same) and their mission is to debate the issue, after formulating plans within their groups. Students in each group are assigned the tasks of spokesperson, timekeeper, recorder, summarizer, and director, a structure which helps the students stay on track. The individual group discussions begin with each student summarizing his or her own particular article to the group. After all the summaries are given, the groups then tackle the issues below and use the information to make a case for their side. The specific issues debated are: • Students begin by presenting the class data on pesticide residues in produce. They are expected to use this data to support their point of view and comment on whether their group perceives there is a problem with pesticides in the food supply. • Do you support or reject the new Food Quality Protection Act of 1996 that regulates pesticide use? • Should we: a) regulate pesticides more heavily than the new law dictates? b) forbid them entirely? c) decrease the regulatory burden on pesticide producers and users? d) re-write the laws for pesticide regulations? If so, how? e) keep the status quo? f) some combination of the above? • Is our present method of regulation effective? Over burdensome? While the groups formulate their debate plan, the instructor is available to help clarify issues, but does not guide the discussion. When the debate begins, each group has 10 minutes to present its case, then the floor is opened for general discussion. The instructor's role is one of referee (for the outgoing students) and encourager (for the less aggressive students). The Agribusiness versus Environmentalists debate was a success with most students, with words like "exciting," "fun," and "interesting" dominating the comments. Students who were very pro-environment found themselves arguing for the side of the Agribusiness interests, which required them to see a different side of the issue and forced a realization that not all environmental problems have clear-cut solutions. With very few exceptions, all students came to class prepared and participated fully in the discussion. Students graded each other on participation. The detailed instructions students received for the debate and for the peer-grading scheme can be found on pp. 82–85 in the module text.
  • 85.
    65 Evaluation Data Over thefive semesters the course was evaluated, the debate was carried out by 9 lab sections of students; a total of 184 students. At the end of the course, students were asked several questions about the debate and the grading scheme and to provide additional comments if they desired. The results of these questions follow. Did you like the discussion/debate on the pesticide module? The debate was popular with the students, with a large fraction (80%) giving it a "thumbs-up." Nineteen percent of the students did not like this alternative approach. DID STUDENTS LIKE THE DEBATE? Did you think the grading scheme for the debate was fair? The debate assignment was peer-graded, with students grading each other on both the quality of the summary of their article and their level of participation in the pre-debate discussion. Students were provided with the guidelines shown on p. 85 in the student laboratory manual to rate the performance of their fellow students. The teaching assistants were given discretionary points to use if they felt it necessary, but these were used only rarely. Grades given to students by their peers were generally B or better, with only those students who did not come prepared graded down significantly. In light of the full participation of all of the students observed, the teaching staff in the course would have given very similar grades for the most part. Students were generally accepting of this method of grading, with 75% in favor and 24% opposed. 80% 19% 1% Yes No In-Between N = 184
  • 86.
    66 Instructor’s Manual DIDSTUDENTS THINK THE PEER GRADING APPROACH WAS FAIR? If you did not think the grading scheme was fair, why not? The 25% of the students who did not like the grading scheme cited several reasons. They thought their peers lacked the maturity to do a good job and were concerned that competitiveness and self-interest might influence the grading. Some students felt that their peers would give higher grades than a TA might have. It was also clear that some students were uncomfortable grading their peers, remarking that they were not qualified or that it was not their job. In the last semester the class was surveyed, we asked additional questions to find out the effect of the debate on shaping students' opinions on the issue of pesticide use. Because of the small number of students (N = 41), it is difficult to obtain precise conclusions, only a general overview. Did the debate serve to reinforce your present views on issues related to pesticide use? If so, which issues? More than half of the students (61%) indicated that the debate reinforced their present views on pesticide use, while 37% indicated the opposite. 75% 24% 1% Yes No N/A N = 182
  • 87.
    67 DID THE DEBATEREINFORCE STUDENTS' VIEWS ON PESTICIDE USE? When asked to cite on which issues their views were reinforced, students didn't really seem to answer the question that was asked; instead, they mostly cited new revelations they had arrived at during the debate. Sixty-one percent (N = 24) of the students provided comments which fell into several general categories. Percentages are expressed as the number of comments out of 24 total comments. • Students became more aware of the societal costs of pesticides (33%). • Students became more aware of the health risks of pesticides (29%). • Students became convinced that pesticide use should be minimized and alternatives explored (21%). • Students decided that the pesticide problem was not as bad as they had thought (8%). • Miscellaneous, not related to any of the above (8%). Did the debate serve to change your views on issues related to pesticide use? If so, which issues? Nearly half of the students (44%) were influenced by the debate to change their opinions related to pesticide use. 61%37% 2% Yes No no answer N = 41
  • 88.
    68 Instructor’s Manual DIDTHE DEBATE CHANGE STUDENTS' VIEWS ON PESTICIDE USE? Forty-four percent (N = 18) of the students provided comments which fell into several general categories. Percentages are expressed as the number of comments out of 18 total comments. • Students became convinced that it would be difficult to completely do away with pesticides (33%). • Students decided that the pesticide problem was not as bad as they had thought (22%). • Students became convinced that pesticide use should be minimized and alternatives explored (17%). • Students decided that the pesticide problem was worse than they had thought (11%). • Students were confused about the issue (6%). • Miscellaneous--not related to any of the above (11%). Additional comments on the debate. Space was provided on the questionnaire for additional comments on the debate. Forty-six percent (N = 84) of the 184 students responded over the three semesters the debate was included in the curriculum. The categories of responses and their percentages are shown below. Percentages are expressed as the number of comments out of 84 total comments. The comments fell into six major categories: • Some students were dissatisfied with the organization and format of the debate (32%). • The pesticide issue is not black and white. Some students appreciated this and others did not (24%). 44% 54% 2% Yes No no answer N = 41
  • 89.
    69 • Nonspecific positivecomments (20%). • The relationship of chemistry to the debate (9%). • Students felt like they learned a great deal (7%) • Students liked the change of pace (7%). I. Some students were dissatisfied with the organization and format of the debate (32%) The largest percentage of students (32%) were dissatisfied with some aspect of the organization or format of the debate. Fifteen percent thought the debate could be more organized or that more time should be provided for constructing their arguments. "The discussion was good, but needed more structure and organization to it. There was little resolved in the end. A good debate experience and good practice working in groups." "We needed more preparation time and less time to debate." These comments were well-placed and matched our own assessment of a problem area. We changed the structure of the debate over the course of the project, imposing more structure and providing more time for discussion and debate planning. Thorough TA preparation and greater attention to moderating the debate solved many of the organizational problems. Some students (7%) wanted more information on the topic. Since the two sides (Agribusiness and Environmentalists) were given a combination of identical readings and other readings specific to only their own group, students felt as if information was being withheld. In the first two semesters, we did make all readings available on reserve at the library, but students didn't remember this in-class announcement or they didn't take the time to go to the reserve section. We initially addressed this problem by making a course "reader" available for purchase that contained all of the readings. Because permissions for reprints are expensive, this was a costly route for the students, with readers selling for $22. We have now modified this part of the module so students can access the readings for the debate on the world wide web. This appears to be the best solution to this problem, with many good articles available from reliable sources. Students also commented that the debate was too hostile and competitive (4%). These comments came exclusively from two different occasions (out of a total of nine times the debate was staged), where one aggressive individual from the class behaved in a way that created outright hostility between the two sides. As might be anticipated, this was not well-received by the students. We countered this problem by providing the instructors with some tactics to deal with aggressive students. These suggestions are included on p. 38 in this Instructor’s Manual. A small group of students was dissatisfied with the fact that grades were based on participation. The shy students felt as if they were being penalized for being quiet (4%) and the outgoing students felt like they were not getting enough credit for being leaders (2%).
  • 90.
    70 Instructor’s Manual II.The pesticide issue is not black and white. Some students appreciated this and others did not (24%). A discussion about the use of pesticides in the food supply is a true debate. There are good points to be made on both sides and there are many issues which are not clear-cut. Trade-offs must be made to reach a workable compromise in our present political and economic climate. The debate was successful in making students think about the multiple issues involved in regulating pesticides. While 6% of the students were dissatisfied that they had not been able to choose the side of the issue they were debating, 9% of the comments indicated that students thought the act of debating was particularly effective in educating them to the issues faced by "the other side." "I thought the set-up was thought-provoking---some of us had to seriously argue the "other" side of the picture, thus it was enormously beneficial to step into the shoes of an agribusiness woman." "It was very nice to take "hard core" science and apply it socially with human nature clouding the facts---as it does in real society." "I think it is a gateway to get people involved in the issues we study in lab. It forces people to take a side and argue that point of view. What better way is than to make people think about both sides of an issue? I think that debate is a great idea." Students (5%) also commented that others were not really taking sides during the debate. It is true that a class full of environmentalists (as is typical for this class) are usually all on the same side. We had the most success and the most lively debate when students were encouraged (either by an instructor or by peers) to really play their roles as much as possible. Some students (4%) were very uncomfortable with the fuzzy nature of the problem. They wanted a right answer to exist and be presented to them. "The pesticide debate was very biased. If there was going to be a true debate, there should be a few people (pereferably the TAs and standing on neutral ground) overlooking the debate without pointing out either sides's faults but only the right (italics added) statements." III. Nonspecific Positive Comments (20%) A significant fraction (20%) of the students simply made enthusiastic comments about the debate. "It was one of the best things I've had this year." "It was fun and helpful!" "I loved it!!!" "It's cool!" IV. The relationship of chemistry to the debate (9%) Students also brought out the relationship of chemistry to the debate, with 5% of the comments indicating that students felt that the debate had shown them the relevance of chemistry to the real world.
  • 91.
    71 "Made the restof the lab more interesting because I understood the impact and relevance of what we are studying. Helped me to notice connections in other labs. Made me think!" Four percent of the students felt there was not enough chemistry involved in the debate. "The discussion for the pesticide module was good because it was a different approach to the material and I learned a lot about the debate, but strictly in terms of chemistry, it wasn't as effective. I was forced to really learn about the stuff in the lab manual because I had to do those big old lab reports. For the pesticide one I didn't learn so much about organic compounds, polar/non-polar substances, etc. --- but keep it anyway. Because it was a refreshing aspect of the material." The lack of chemistry discussed in the debate was a concern for the instructors in the course as well. While the goal of the debate was for the students to use their data to help make their points, discussion of data did not typically dominate the students' debate. Indeed, students more often resorted to anecdotal evidence to support their statements rather than real data they had collected. It is very clear that if students are given an opportunity to skirt the real science, they will take it and rely more heavily on ways of thinking and arguing they are more accustomed to. Because the students in our class were freshmen, this is not surprising, since their level of scientific sophistication was still low. It would be interesting to see how upper-level chemistry students handle this aspect of the debate. Our solution to this problem was to change the debate format so the presentation of data is required as the initial part of the debate presentation, as indicated in the instructions for the debate. V. Students felt like they learned a great deal (7%) Some students (7%) commented on the fact that they learned and remembered a great deal from the debate experience. "I learned more from that discussion than I did from the other labs." "I learned a lot from the discussion, and more importantly, I remember a lot." "I learned a great deal. I also feel more at ease about the issue now that I understand it a little better. I can recognize media hype of the issue has expanded the proportions of the issue. Pesticides are lousy and do lousy things to the soil, but I don't believe we are at a serious risk right now and I learned this through the discussion." VI. Students liked the change of pace (7%) We planned the debate to take place at the end of the semester to partially take the place of the large lab reports expected of the students for the other three modules earlier in the semester. The students had worked hard the entire semester, and this activity was meant to create a bit of a break and a change of pace for the students at this stress-filled time in the semester. The students noticed this and were grateful for a chance to do something different. "Three modules and the debate were more realistic than 4 modules."
  • 92.
    72 Instructor’s Manual ". . . It also eased the final crunch by pardoning us from another massive report."