Download to read offline


![YSI
CastAway-CTD User’s Manual (July 2010) 83
A-11. References
International Temperature Scales of 1948, 1968 and 1990
http://www.ices.dk/ocean/procedures/its.htm [4/28/2010 7:24:44 PM]
Millard & Fofonoff, “Algorithms for computation of fundamental properties of seawater”, UN-
ESCO technical papers in marine science 44, 1983.
WGS84 Ellipsoidal Gravity Formula, Department of Defense World Geodetic System 1984,
NIMA TR8350.2, 3rd
edition amendment 1, January 2000, Technical Report pages 3-5 to 4-2.
It is worth noting that a new standard for CTD calculations has been proposed to the scientific
community; the Thermodynamic Equation of State of Seawater (TEOS-10). However, the me-
thods shown in the UNESCO 1983 publication are still the most commonly used calculations and
are the only ones supported by the CastAway-CTD. Users interested in applying the TEOS-10
equations can export raw data from the CastAway-CTD to perform these calculations.](https://image.slidesharecdn.com/e4b9b83b-bda5-4ba4-834a-b6fc73b855bf-160808215812/85/ysi-castaway-ctd-principles-of-operation-16-320.jpg)

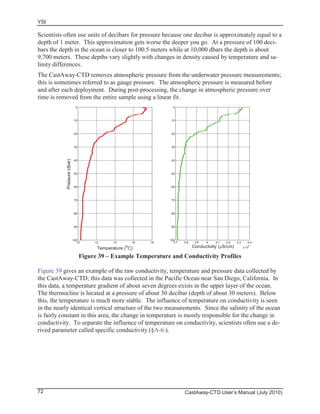
The document provides an overview of conductivity, temperature, and depth (CTD) sensors and the principles behind how they are used to collect water quality data. It explains that a CTD device measures conductivity, temperature, and pressure to derive other useful parameters like salinity, sound speed, density, and depth. It also provides best practices for collecting CTD data, such as allowing the device to free fall at a steady rate and not pausing during casts.


