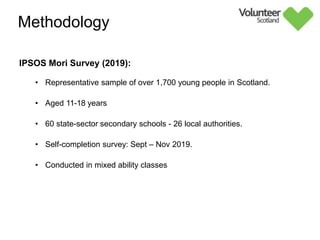
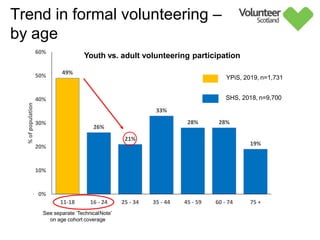
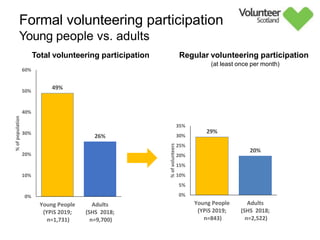
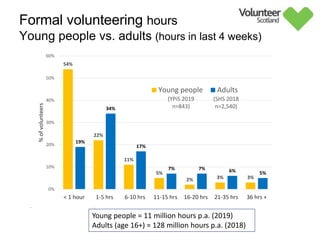
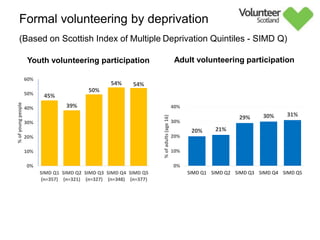
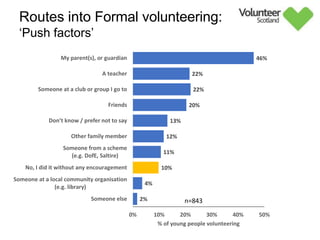
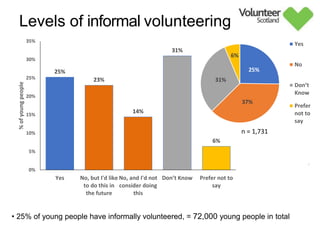
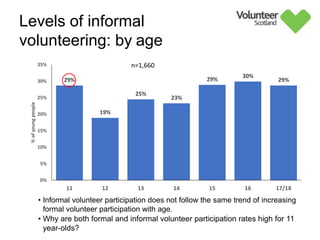
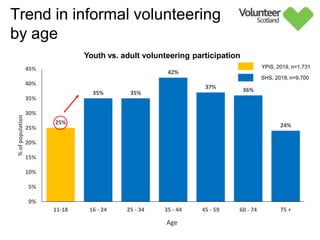
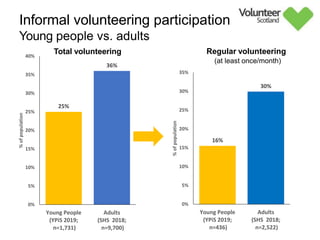
Debbie Maltman and Matthew Linning
Volunteer Scotland, Research and Evaluation
W www.volunteerscotland.org.uk @VolScotland
Young People in Scotland Survey, 2019
Analysis of volunteering – summary results
August 2020
Structure
• Methodology
• Formal volunteering
o Participation rates
o Adults vs. young people
o Key influences
• Informal volunteering
• Summary
IPSOS Mori Survey (2019):
• Representative sample of over 1,700 young people in Scotland.
• Aged 11-18 years
• 60 state-sector secondary schools - 26 local authorities.
• Self-completion survey: Sept – Nov 2019.
• Conducted in mixed ability classes
Methodology
Further information on the methodology is provided in
the separate ‘Technical Note’
YOUNG PEOPLE VOLUNTEERING
Formal volunteering –
participation rates
Trend in formal youth volunteering
Year % of young
people
Sample size
2014 45% 2,016
2016 52% 1,550
2019 49% 1,731
Formal volunteering participation
• 140,000 young people volunteering formally
• 13% of young people volunteer in both their own time and in school time
n=1731
21%
40%
17%
13%
17%
4%
0%
5%
10%
15%
20%
25%
30%
35%
40%
45%
Yes, in school
time
Yes, in my own
spare time
No, but I'd like to
do this in the
future
No, and I'd not
consider doing
this
Don’t Know Prefer not to say
%
of
young
people
n = 1,731
49%
30%
17%
4% Yes
No
Don’t Know
Prefer not
to say
Formal volunteering participation
- by age
n=1,660
49%
44%
41%
46%
49%
59%
68%
0%
10%
20%
30%
40%
50%
60%
70%
80%
11 12 13 14 15 16 17/18
%
of
young
people
Age
Long-term
health condition
Yes 55%
No 50%
Ethnicity
White 50%
Other ethnic 47%
Geography
Rural 52%
Urban 48%
Religion
Christian faiths 60%
Non-Christian 43%
Gender
Girls 53%
Boys 45%
Formal volunteering participation -
key demographics
Young people volunteer formally in the following
areas:
11%
4%
2%
4%
3%
4%
4%
6%
7%
8%
9%
15%
19%
23%
33%
37%
39%
0% 5% 10% 15% 20% 25% 30% 35% 40% 45%
Don’t know / prefer not to say
Other
Trade Unions, justice and human rights
Politics
Emergency services, first aid and public safety
Online volunteering
Culture and heritage
Groups aimed at supporting older people
Religion and belief
Environmental protection
Animal welfare
Health, disability and wellbeing
Local community or neighbourhood
Hobbies and recreation
Children or young people (in schools)
Children or youth groups (outside school)
Physical activity, sport and exercise
% of young people volunteering
n=843
YOUNG PEOPLE VOLUNTEERING
Formal volunteering –
adults vs. young people
49%
26%
21%
33%
28% 28%
19%
0%
10%
20%
30%
40%
50%
60%
11-18 16 - 24 25 - 34 35 - 44 45 - 59 60 - 74 75 +
%
of
population
Youth vs. adult volunteering participation
Trend in formal volunteering –
by age
YPiS, 2019, n=1,731
SHS, 2018, n=9,700
See separate ‘TechnicalNote’
on age cohort coverage
Formal volunteering participation
Young people vs. adults
Total volunteering participation Regular volunteering participation
(at least once per month)
49%
26%
0%
10%
20%
30%
40%
50%
60%
Young People
(YPiS 2019;
n=1,731)
Adults
(SHS 2018;
n=9,700)
%
of
population
29%
20%
0%
5%
10%
15%
20%
25%
30%
35%
Young People
(YPiS 2019;
n=843)
Adults
(SHS 2018;
n=2,522)
%
of
volunteers
Formal volunteering hours
Young people vs. adults (hours in last 4 weeks)
54%
22%
11%
5%
2% 3% 3%
19%
34%
17%
7% 7% 6% 5%
0%
10%
20%
30%
40%
50%
60%
< 1 hour 1-5 hrs 6-10 hrs 11-15 hrs 16-20 hrs 21-35 hrs 36 hrs +
%
of
volunteers
Young people Adults
(YPiS 2019
n=843)
(SHS 2018
n=2,540)
Young people = 11 million hours p.a. (2019)
Adults (age 16+) = 128 million hours p.a. (2018)
Formal volunteering by deprivation
(Based on Scottish Index of Multiple Deprivation Quintiles - SIMD Q)
Adult volunteering participation
Youth volunteering participation
45%
39%
50%
54% 54%
0%
10%
20%
30%
40%
50%
60%
SIMD Q1
(n=357)
SIMD Q2
(n=321)
SIMD Q3
(n=327)
SIMD Q4
(n=348)
SIMD Q5
(n=377)
%
of
young
people
20% 21%
29% 30% 31%
0%
10%
20%
30%
40%
SIMD Q1 SIMD Q2 SIMD Q3 SIMD Q4 SIMD Q5
%
of
adults
(age
16)
YOUNG PEOPLE VOLUNTEERING
Formal volunteering –
‘influences’
Routes into Formal volunteering:
‘Push factors’
2%
4%
10%
11%
12%
13%
20%
22%
22%
46%
0% 10% 20% 30% 40% 50%
Someone else
Someone at a local community organisation
(e.g. library)
No, I did it without any encouragement
Someone from a scheme
(e.g. DofE, Saltire)
Other family member
Don’t know / prefer not to say
Friends
Someone at a club or group I go to
A teacher
My parent(s), or guardian
% of young people volunteering
n=843
Actual benefits of formal volunteering
Wellbeing benefits Career benefits
n = 817
20%
20%
23%
26%
35%
36%
37%
37%
39%
43%
52%
67%
0% 20% 40% 60% 80%
Feeling less lonely or isolated
Improved mental health
Improved physical health
Increased trust in others
Feeling better about myself
Feeling happier
Feeling appreciated
Feeling I've made a difference
Making new friends
Feeling part of a team
Increasing confidence
Having fun
% of young people volunteering
12%
15%
22%
24%
40%
54%
0% 20% 40% 60%
Feeling I've improved my
study prospects
Feeling I've improved my
job prospects
Increased understanding of
what I can achieve
Learning how to overcome
challenges
Being a leader
Learning new skills
% of young people volunteering
n=843
n=843
Formal Volunteering – ‘Influences’
(Top 10)
13%
14%
15%
18%
21%
21%
23%
24%
24%
27%
0% 5% 10% 15% 20% 25% 30%
If there were more volunteering
opportunities available for people under…
If I knew I would be appreciated
If I could volunteer close to where I live
If it fitted around my other commitments
(e.g. homework, weekend job, etc.)
Don’t know
If I knew I would be making a difference
If it would improve my skills
If it would improve my career/job prospects
If I could volunteer in something that
interested me or was important to me
If I could do it with my friends
% of young people
n = 1,731
YOUNG PEOPLE VOLUNTEERING
Informal volunteering
Levels of informal volunteering
• 25% of young people have informally volunteered, = 72,000 young people in total
25%
23%
14%
31%
6%
0%
5%
10%
15%
20%
25%
30%
35%
Yes No, but I'd like
to do this in
the future
No, and I'd not
consider doing
this
Don’t Know Prefer not to
say
%
of
young
people
25%
37%
31%
6%
Yes
No
Don’t
Know
Prefer
not to
say
n = 1,731
Levels of informal
volunteering: by age
• Informal volunteer participation does not follow the same trend of increasing
formal volunteer participation with age.
• Why are both formal and informal volunteer participation rates high for 11
year-olds?
29%
19%
25%
23%
29%
30%
29%
0%
5%
10%
15%
20%
25%
30%
35%
11 12 13 14 15 16 17/18
%
of
young
people
n=1,660
25%
35% 35%
42%
37% 36%
24%
0%
5%
10%
15%
20%
25%
30%
35%
40%
45%
11-18 16 - 24 25 - 34 35 - 44 45 - 59 60 - 74 75 +
%
of
population
Youth vs. adult volunteering participation
Trend in informal volunteering
by age
YPiS, 2019, n=1,731
SHS, 2018, n=9,700
Age
Informal volunteering participation
Young people vs. adults
Regular volunteering
(at least once/month)
25%
36%
0%
5%
10%
15%
20%
25%
30%
35%
40%
Young People
(YPiS 2019;
n=1,731)
Adults
(SHS 2018;
n=9,700)
%
of
population
16%
30%
0%
5%
10%
15%
20%
25%
30%
35%
Young People
(YPiS 2019;
n=436)
Adults
(SHS 2018;
n=2,522)
%
of
population
Total volunteering
YOUNG PEOPLE VOLUNTEERING
Summary
Formal volunteering
• 49% participation rate = 11 million hours p.a. (adults = 26%)
• But frequency and intensity much lower than adult formal volunteering
• Importance of wellbeing benefits…not just career benefits
• Improved ‘reach’ into deprived communities
o 45% for SIMD Q1 (vs. 20% for adults)
• Influence of parents/guardians critically important re. engagement
Informal volunteering
• 25% participation rate vs. formal rate of 49% (adult informal = 36%)
• Only 16% for ‘regular’ informal volunteering
• Factors: limited school influence; altruism focus; less opportunity;
personal risk, etc.
Youth volunteering summary, 2019

YPiS 2019 summary report

  • 1.
    Debbie Maltman andMatthew Linning Volunteer Scotland, Research and Evaluation W www.volunteerscotland.org.uk @VolScotland Young People in Scotland Survey, 2019 Analysis of volunteering – summary results August 2020
  • 2.
    Structure • Methodology • Formalvolunteering o Participation rates o Adults vs. young people o Key influences • Informal volunteering • Summary
  • 3.
    IPSOS Mori Survey(2019): • Representative sample of over 1,700 young people in Scotland. • Aged 11-18 years • 60 state-sector secondary schools - 26 local authorities. • Self-completion survey: Sept – Nov 2019. • Conducted in mixed ability classes Methodology Further information on the methodology is provided in the separate ‘Technical Note’
  • 4.
    YOUNG PEOPLE VOLUNTEERING Formalvolunteering – participation rates
  • 5.
    Trend in formalyouth volunteering Year % of young people Sample size 2014 45% 2,016 2016 52% 1,550 2019 49% 1,731
  • 6.
    Formal volunteering participation •140,000 young people volunteering formally • 13% of young people volunteer in both their own time and in school time n=1731 21% 40% 17% 13% 17% 4% 0% 5% 10% 15% 20% 25% 30% 35% 40% 45% Yes, in school time Yes, in my own spare time No, but I'd like to do this in the future No, and I'd not consider doing this Don’t Know Prefer not to say % of young people n = 1,731 49% 30% 17% 4% Yes No Don’t Know Prefer not to say
  • 7.
    Formal volunteering participation -by age n=1,660 49% 44% 41% 46% 49% 59% 68% 0% 10% 20% 30% 40% 50% 60% 70% 80% 11 12 13 14 15 16 17/18 % of young people Age
  • 8.
    Long-term health condition Yes 55% No50% Ethnicity White 50% Other ethnic 47% Geography Rural 52% Urban 48% Religion Christian faiths 60% Non-Christian 43% Gender Girls 53% Boys 45% Formal volunteering participation - key demographics
  • 9.
    Young people volunteerformally in the following areas: 11% 4% 2% 4% 3% 4% 4% 6% 7% 8% 9% 15% 19% 23% 33% 37% 39% 0% 5% 10% 15% 20% 25% 30% 35% 40% 45% Don’t know / prefer not to say Other Trade Unions, justice and human rights Politics Emergency services, first aid and public safety Online volunteering Culture and heritage Groups aimed at supporting older people Religion and belief Environmental protection Animal welfare Health, disability and wellbeing Local community or neighbourhood Hobbies and recreation Children or young people (in schools) Children or youth groups (outside school) Physical activity, sport and exercise % of young people volunteering n=843
  • 10.
    YOUNG PEOPLE VOLUNTEERING Formalvolunteering – adults vs. young people
  • 11.
    49% 26% 21% 33% 28% 28% 19% 0% 10% 20% 30% 40% 50% 60% 11-18 16- 24 25 - 34 35 - 44 45 - 59 60 - 74 75 + % of population Youth vs. adult volunteering participation Trend in formal volunteering – by age YPiS, 2019, n=1,731 SHS, 2018, n=9,700 See separate ‘TechnicalNote’ on age cohort coverage
  • 12.
    Formal volunteering participation Youngpeople vs. adults Total volunteering participation Regular volunteering participation (at least once per month) 49% 26% 0% 10% 20% 30% 40% 50% 60% Young People (YPiS 2019; n=1,731) Adults (SHS 2018; n=9,700) % of population 29% 20% 0% 5% 10% 15% 20% 25% 30% 35% Young People (YPiS 2019; n=843) Adults (SHS 2018; n=2,522) % of volunteers
  • 13.
    Formal volunteering hours Youngpeople vs. adults (hours in last 4 weeks) 54% 22% 11% 5% 2% 3% 3% 19% 34% 17% 7% 7% 6% 5% 0% 10% 20% 30% 40% 50% 60% < 1 hour 1-5 hrs 6-10 hrs 11-15 hrs 16-20 hrs 21-35 hrs 36 hrs + % of volunteers Young people Adults (YPiS 2019 n=843) (SHS 2018 n=2,540) Young people = 11 million hours p.a. (2019) Adults (age 16+) = 128 million hours p.a. (2018)
  • 14.
    Formal volunteering bydeprivation (Based on Scottish Index of Multiple Deprivation Quintiles - SIMD Q) Adult volunteering participation Youth volunteering participation 45% 39% 50% 54% 54% 0% 10% 20% 30% 40% 50% 60% SIMD Q1 (n=357) SIMD Q2 (n=321) SIMD Q3 (n=327) SIMD Q4 (n=348) SIMD Q5 (n=377) % of young people 20% 21% 29% 30% 31% 0% 10% 20% 30% 40% SIMD Q1 SIMD Q2 SIMD Q3 SIMD Q4 SIMD Q5 % of adults (age 16)
  • 15.
    YOUNG PEOPLE VOLUNTEERING Formalvolunteering – ‘influences’
  • 16.
    Routes into Formalvolunteering: ‘Push factors’ 2% 4% 10% 11% 12% 13% 20% 22% 22% 46% 0% 10% 20% 30% 40% 50% Someone else Someone at a local community organisation (e.g. library) No, I did it without any encouragement Someone from a scheme (e.g. DofE, Saltire) Other family member Don’t know / prefer not to say Friends Someone at a club or group I go to A teacher My parent(s), or guardian % of young people volunteering n=843
  • 17.
    Actual benefits offormal volunteering Wellbeing benefits Career benefits n = 817 20% 20% 23% 26% 35% 36% 37% 37% 39% 43% 52% 67% 0% 20% 40% 60% 80% Feeling less lonely or isolated Improved mental health Improved physical health Increased trust in others Feeling better about myself Feeling happier Feeling appreciated Feeling I've made a difference Making new friends Feeling part of a team Increasing confidence Having fun % of young people volunteering 12% 15% 22% 24% 40% 54% 0% 20% 40% 60% Feeling I've improved my study prospects Feeling I've improved my job prospects Increased understanding of what I can achieve Learning how to overcome challenges Being a leader Learning new skills % of young people volunteering n=843 n=843
  • 18.
    Formal Volunteering –‘Influences’ (Top 10) 13% 14% 15% 18% 21% 21% 23% 24% 24% 27% 0% 5% 10% 15% 20% 25% 30% If there were more volunteering opportunities available for people under… If I knew I would be appreciated If I could volunteer close to where I live If it fitted around my other commitments (e.g. homework, weekend job, etc.) Don’t know If I knew I would be making a difference If it would improve my skills If it would improve my career/job prospects If I could volunteer in something that interested me or was important to me If I could do it with my friends % of young people n = 1,731
  • 19.
  • 20.
    Levels of informalvolunteering • 25% of young people have informally volunteered, = 72,000 young people in total 25% 23% 14% 31% 6% 0% 5% 10% 15% 20% 25% 30% 35% Yes No, but I'd like to do this in the future No, and I'd not consider doing this Don’t Know Prefer not to say % of young people 25% 37% 31% 6% Yes No Don’t Know Prefer not to say n = 1,731
  • 21.
    Levels of informal volunteering:by age • Informal volunteer participation does not follow the same trend of increasing formal volunteer participation with age. • Why are both formal and informal volunteer participation rates high for 11 year-olds? 29% 19% 25% 23% 29% 30% 29% 0% 5% 10% 15% 20% 25% 30% 35% 11 12 13 14 15 16 17/18 % of young people n=1,660
  • 22.
    25% 35% 35% 42% 37% 36% 24% 0% 5% 10% 15% 20% 25% 30% 35% 40% 45% 11-1816 - 24 25 - 34 35 - 44 45 - 59 60 - 74 75 + % of population Youth vs. adult volunteering participation Trend in informal volunteering by age YPiS, 2019, n=1,731 SHS, 2018, n=9,700 Age
  • 23.
    Informal volunteering participation Youngpeople vs. adults Regular volunteering (at least once/month) 25% 36% 0% 5% 10% 15% 20% 25% 30% 35% 40% Young People (YPiS 2019; n=1,731) Adults (SHS 2018; n=9,700) % of population 16% 30% 0% 5% 10% 15% 20% 25% 30% 35% Young People (YPiS 2019; n=436) Adults (SHS 2018; n=2,522) % of population Total volunteering
  • 24.
  • 25.
    Formal volunteering • 49%participation rate = 11 million hours p.a. (adults = 26%) • But frequency and intensity much lower than adult formal volunteering • Importance of wellbeing benefits…not just career benefits • Improved ‘reach’ into deprived communities o 45% for SIMD Q1 (vs. 20% for adults) • Influence of parents/guardians critically important re. engagement Informal volunteering • 25% participation rate vs. formal rate of 49% (adult informal = 36%) • Only 16% for ‘regular’ informal volunteering • Factors: limited school influence; altruism focus; less opportunity; personal risk, etc. Youth volunteering summary, 2019