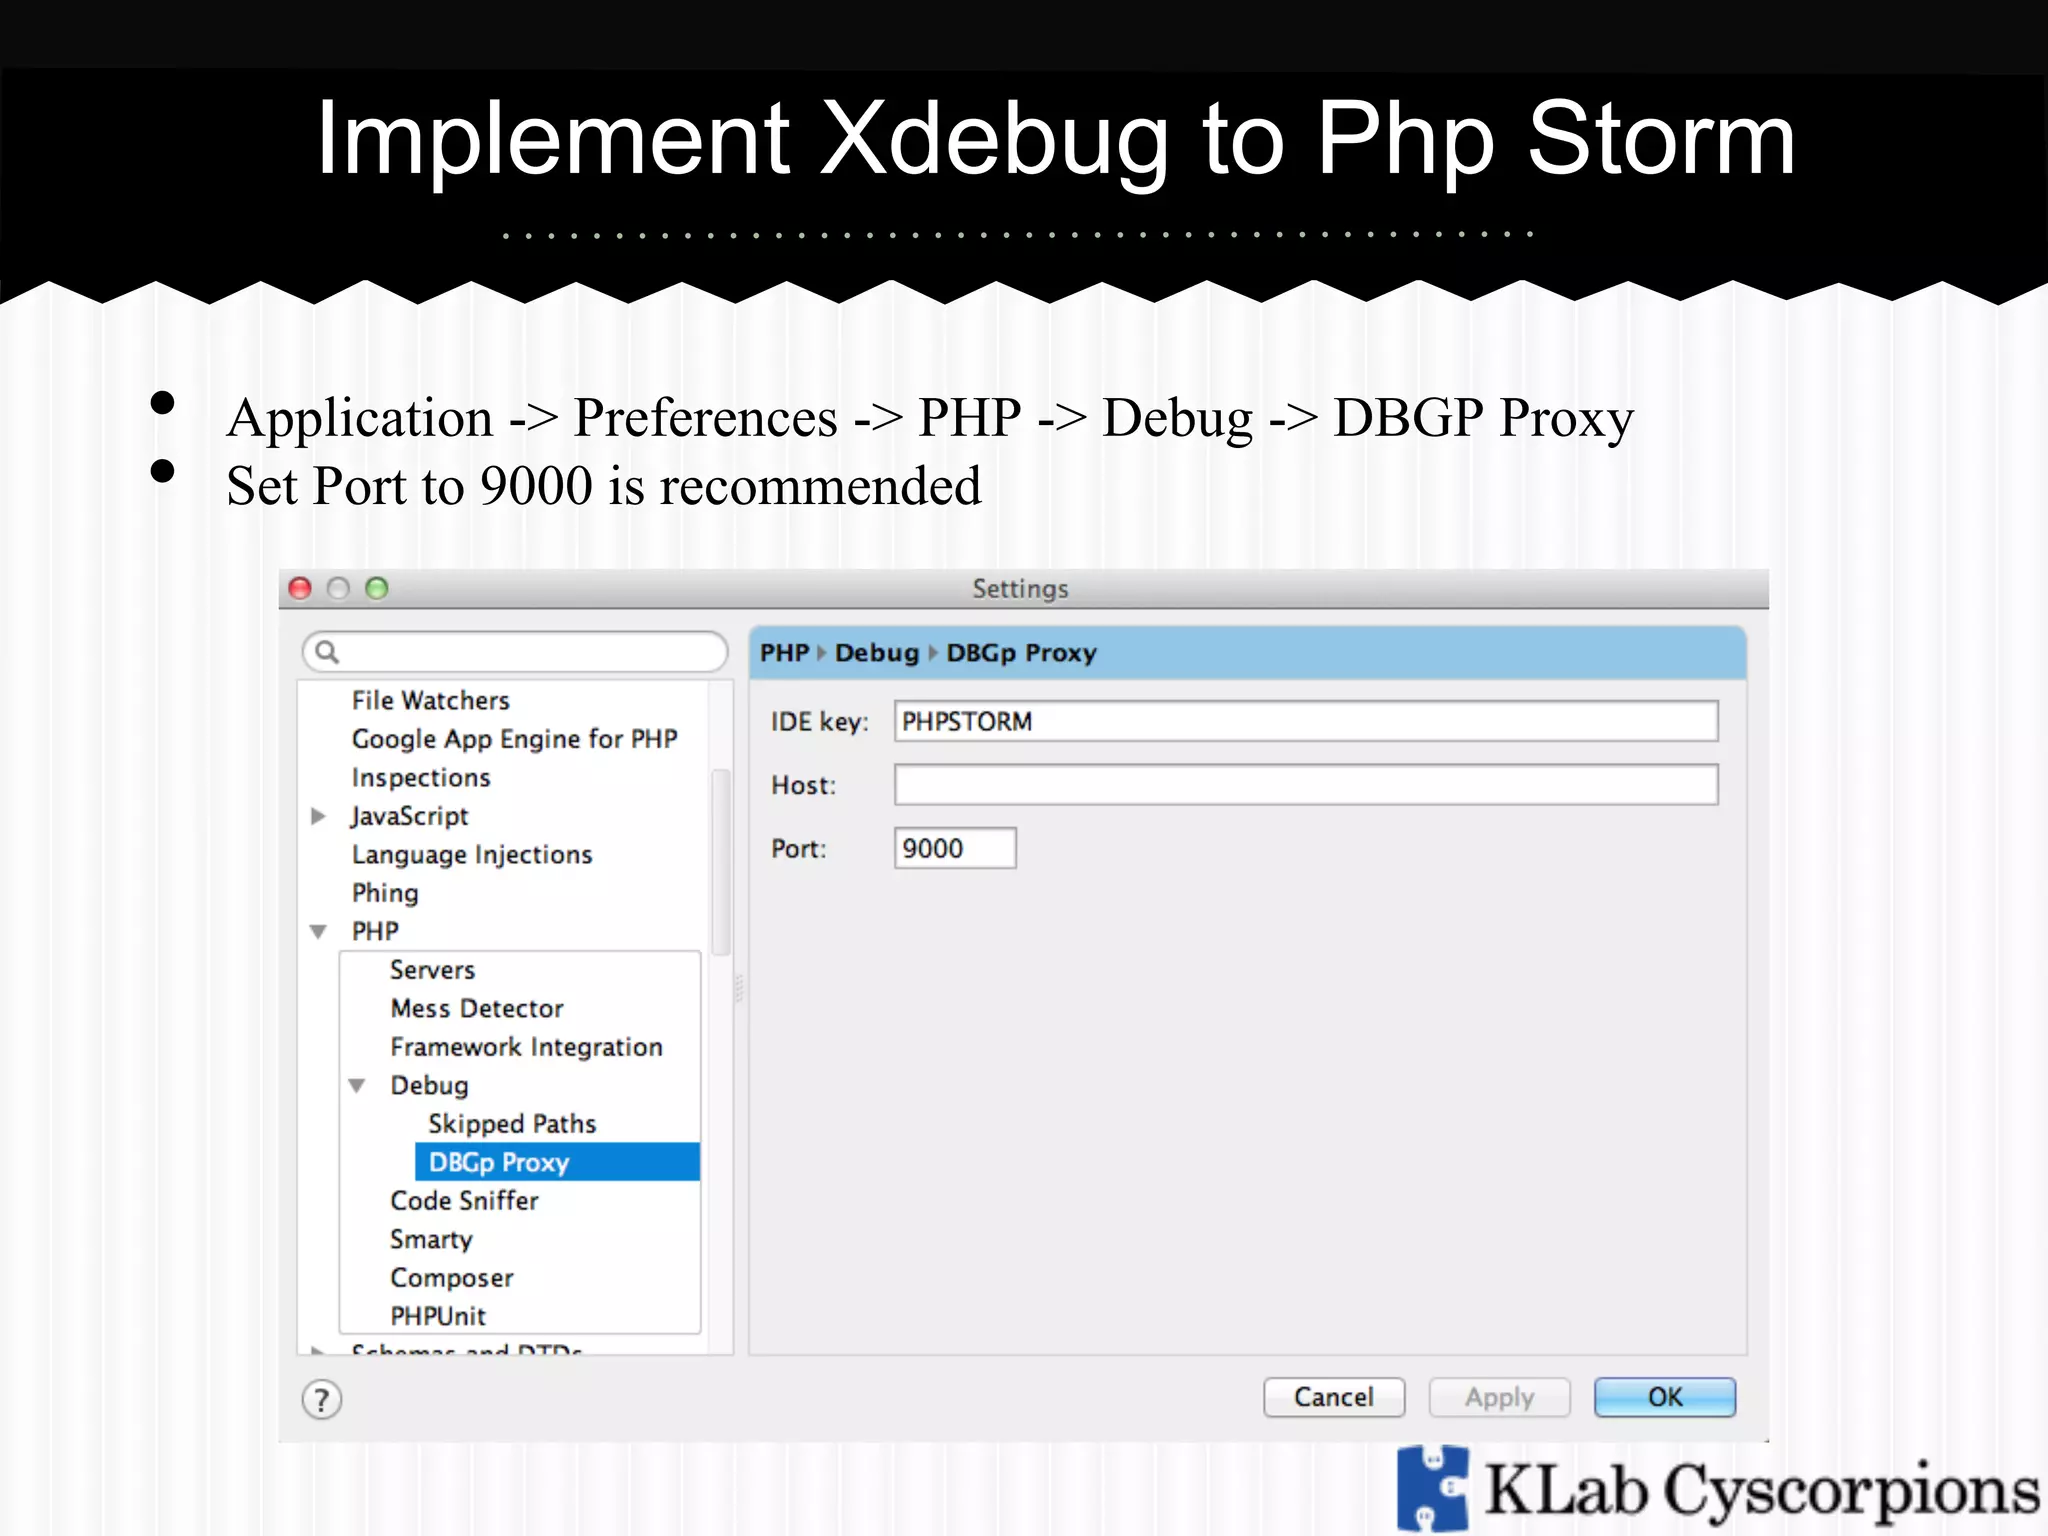
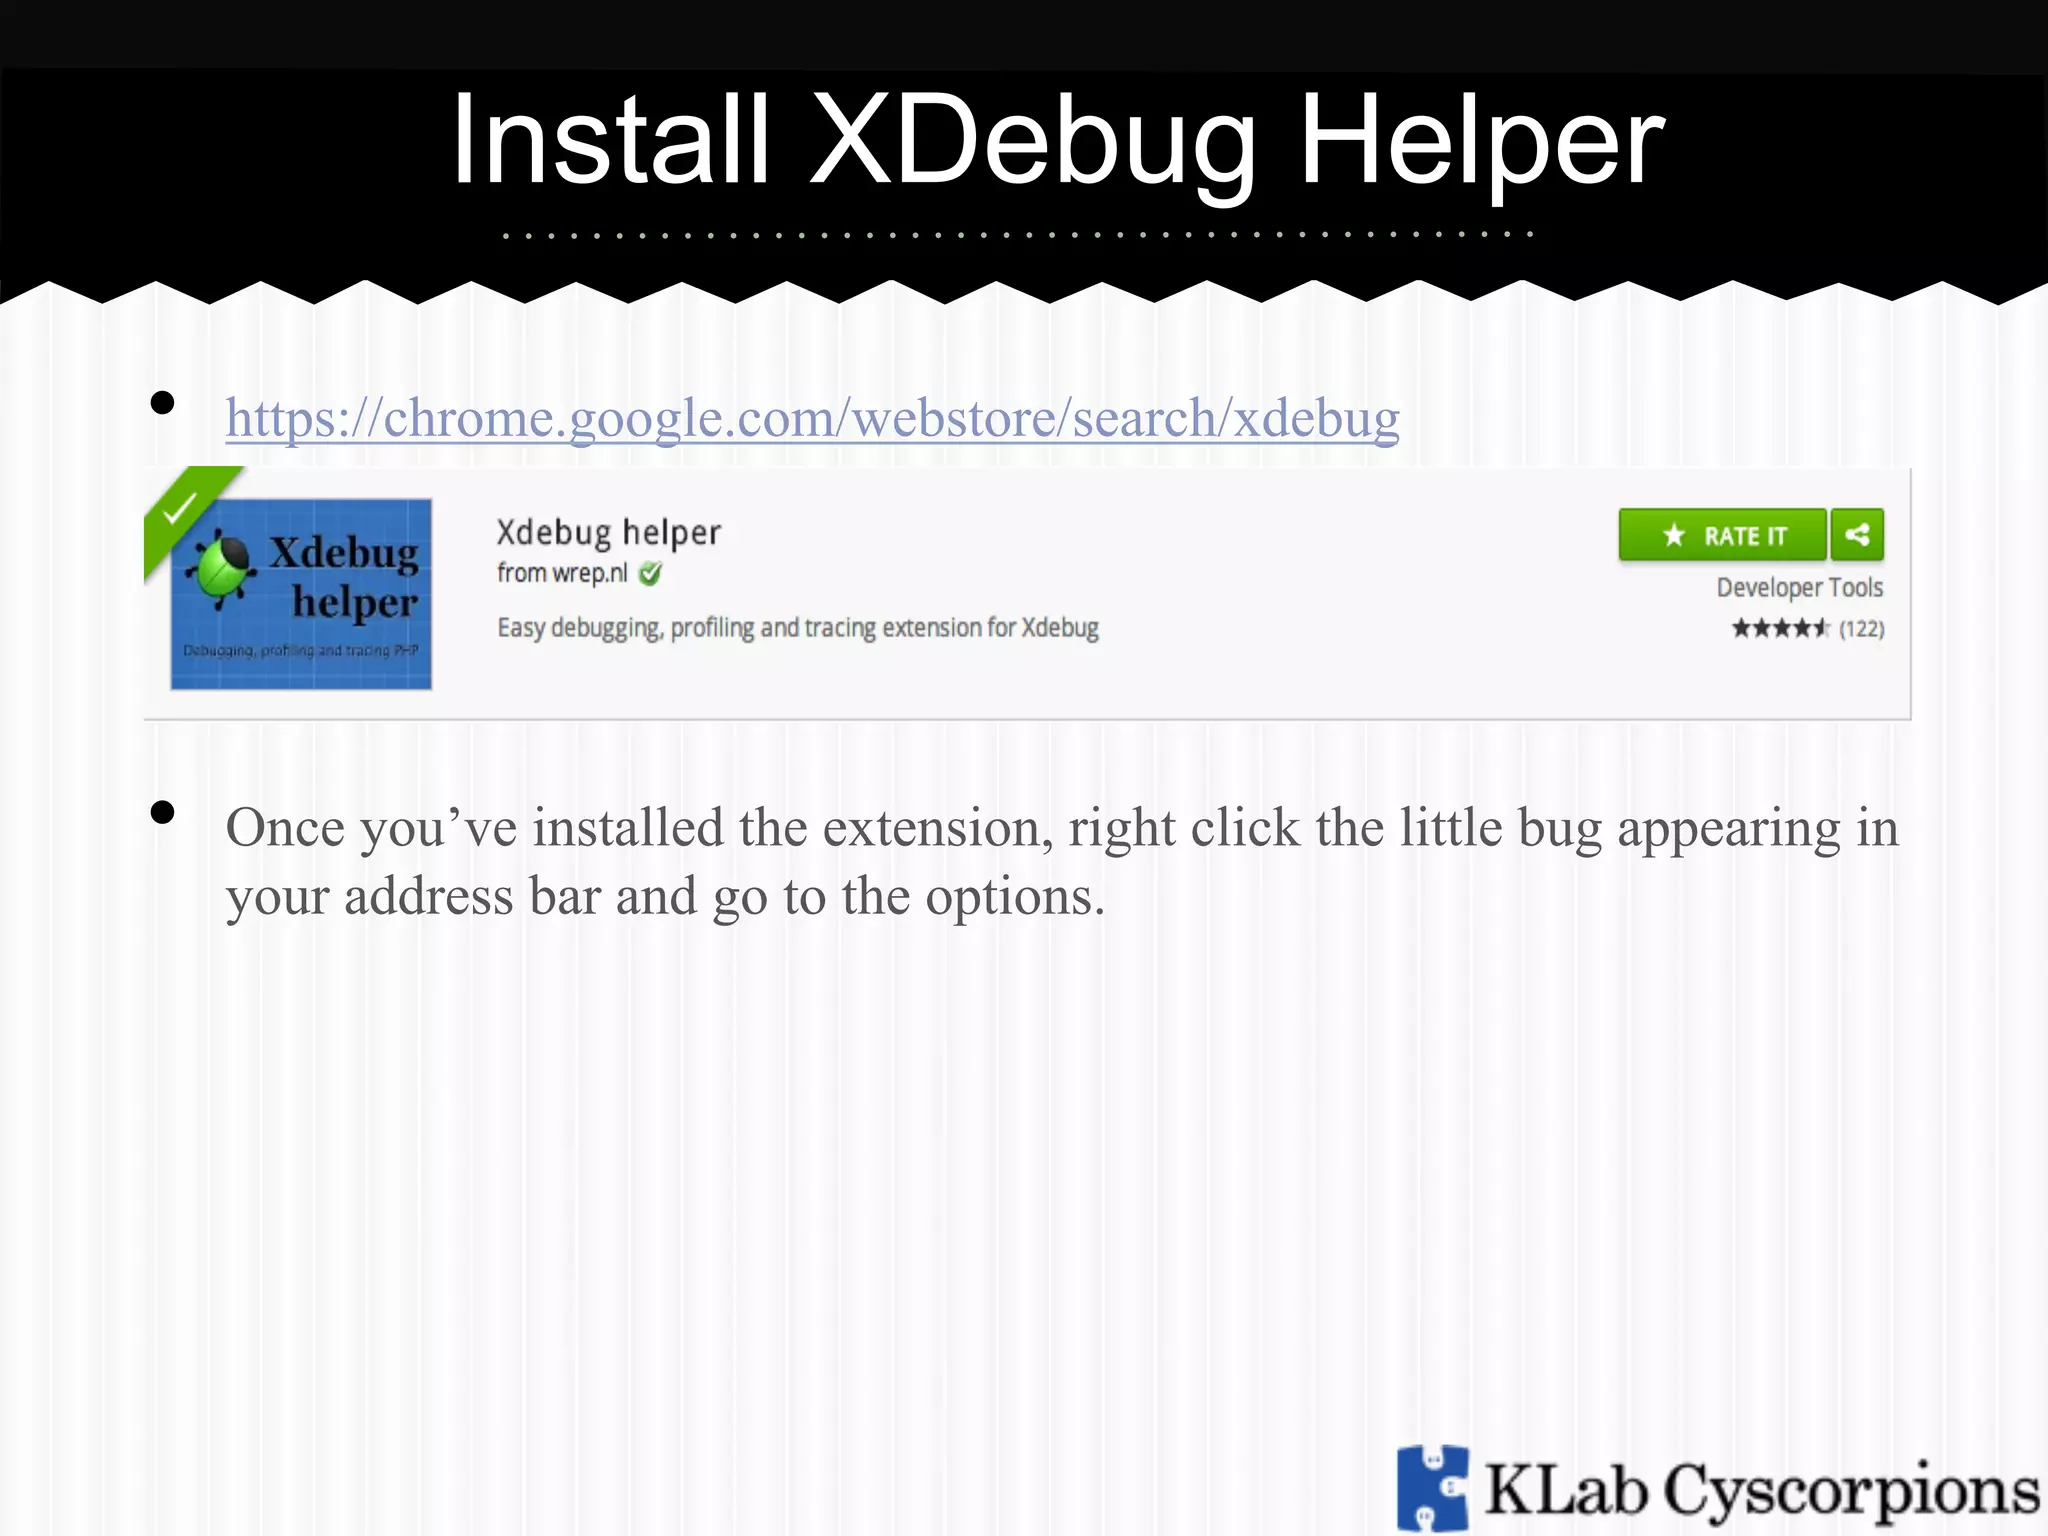
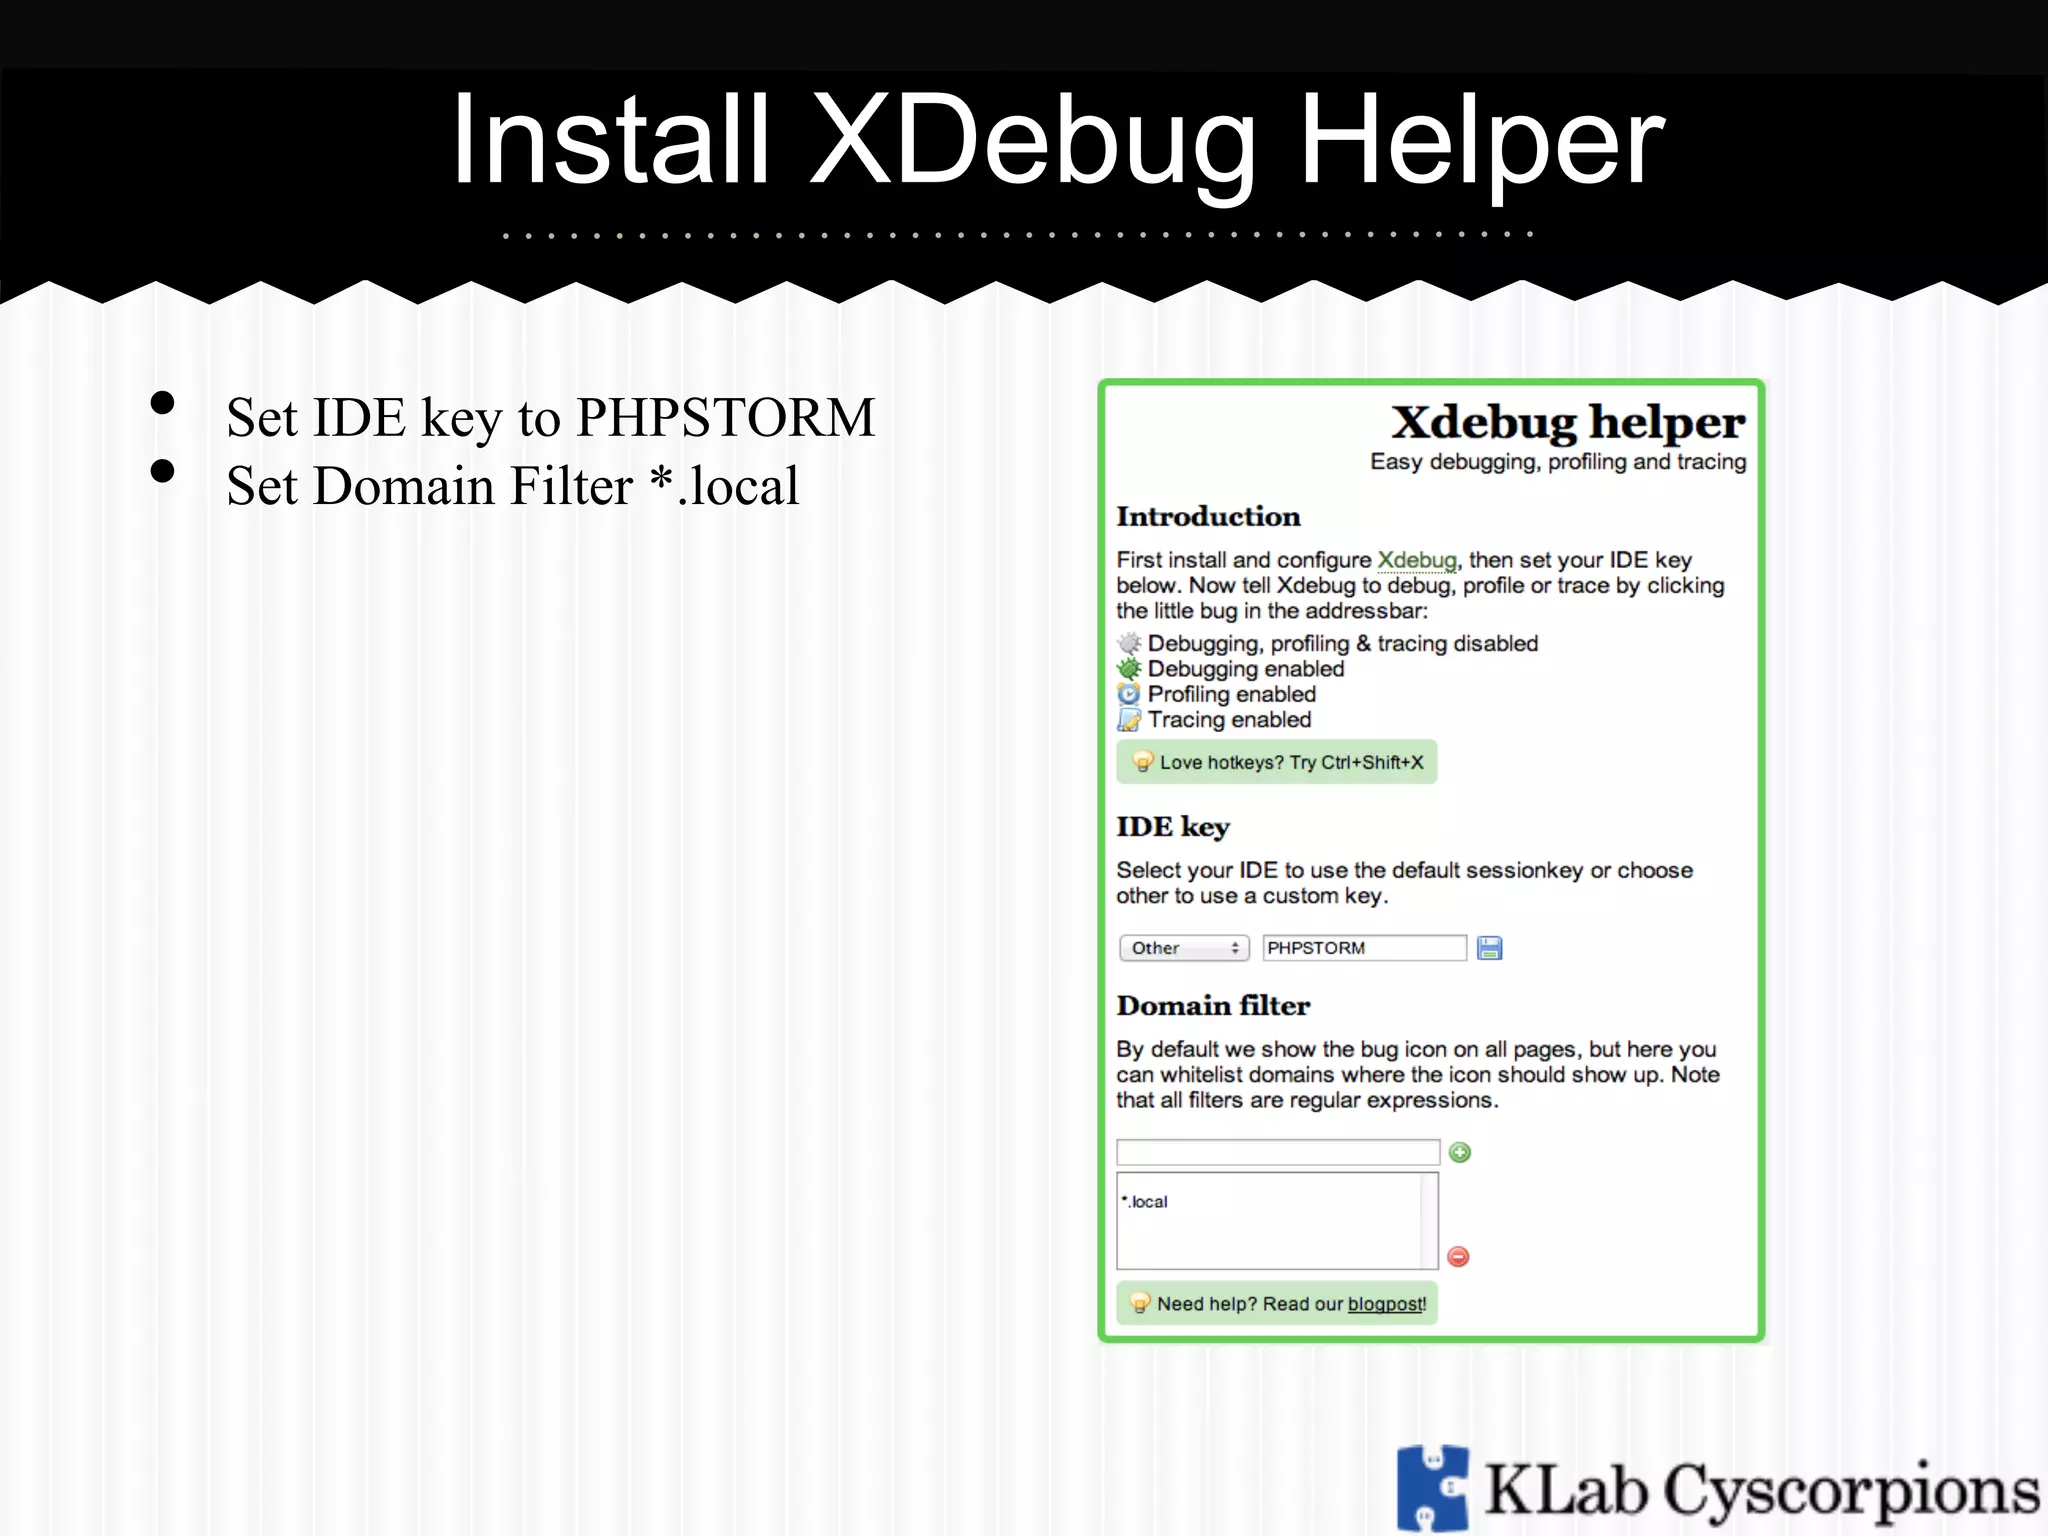
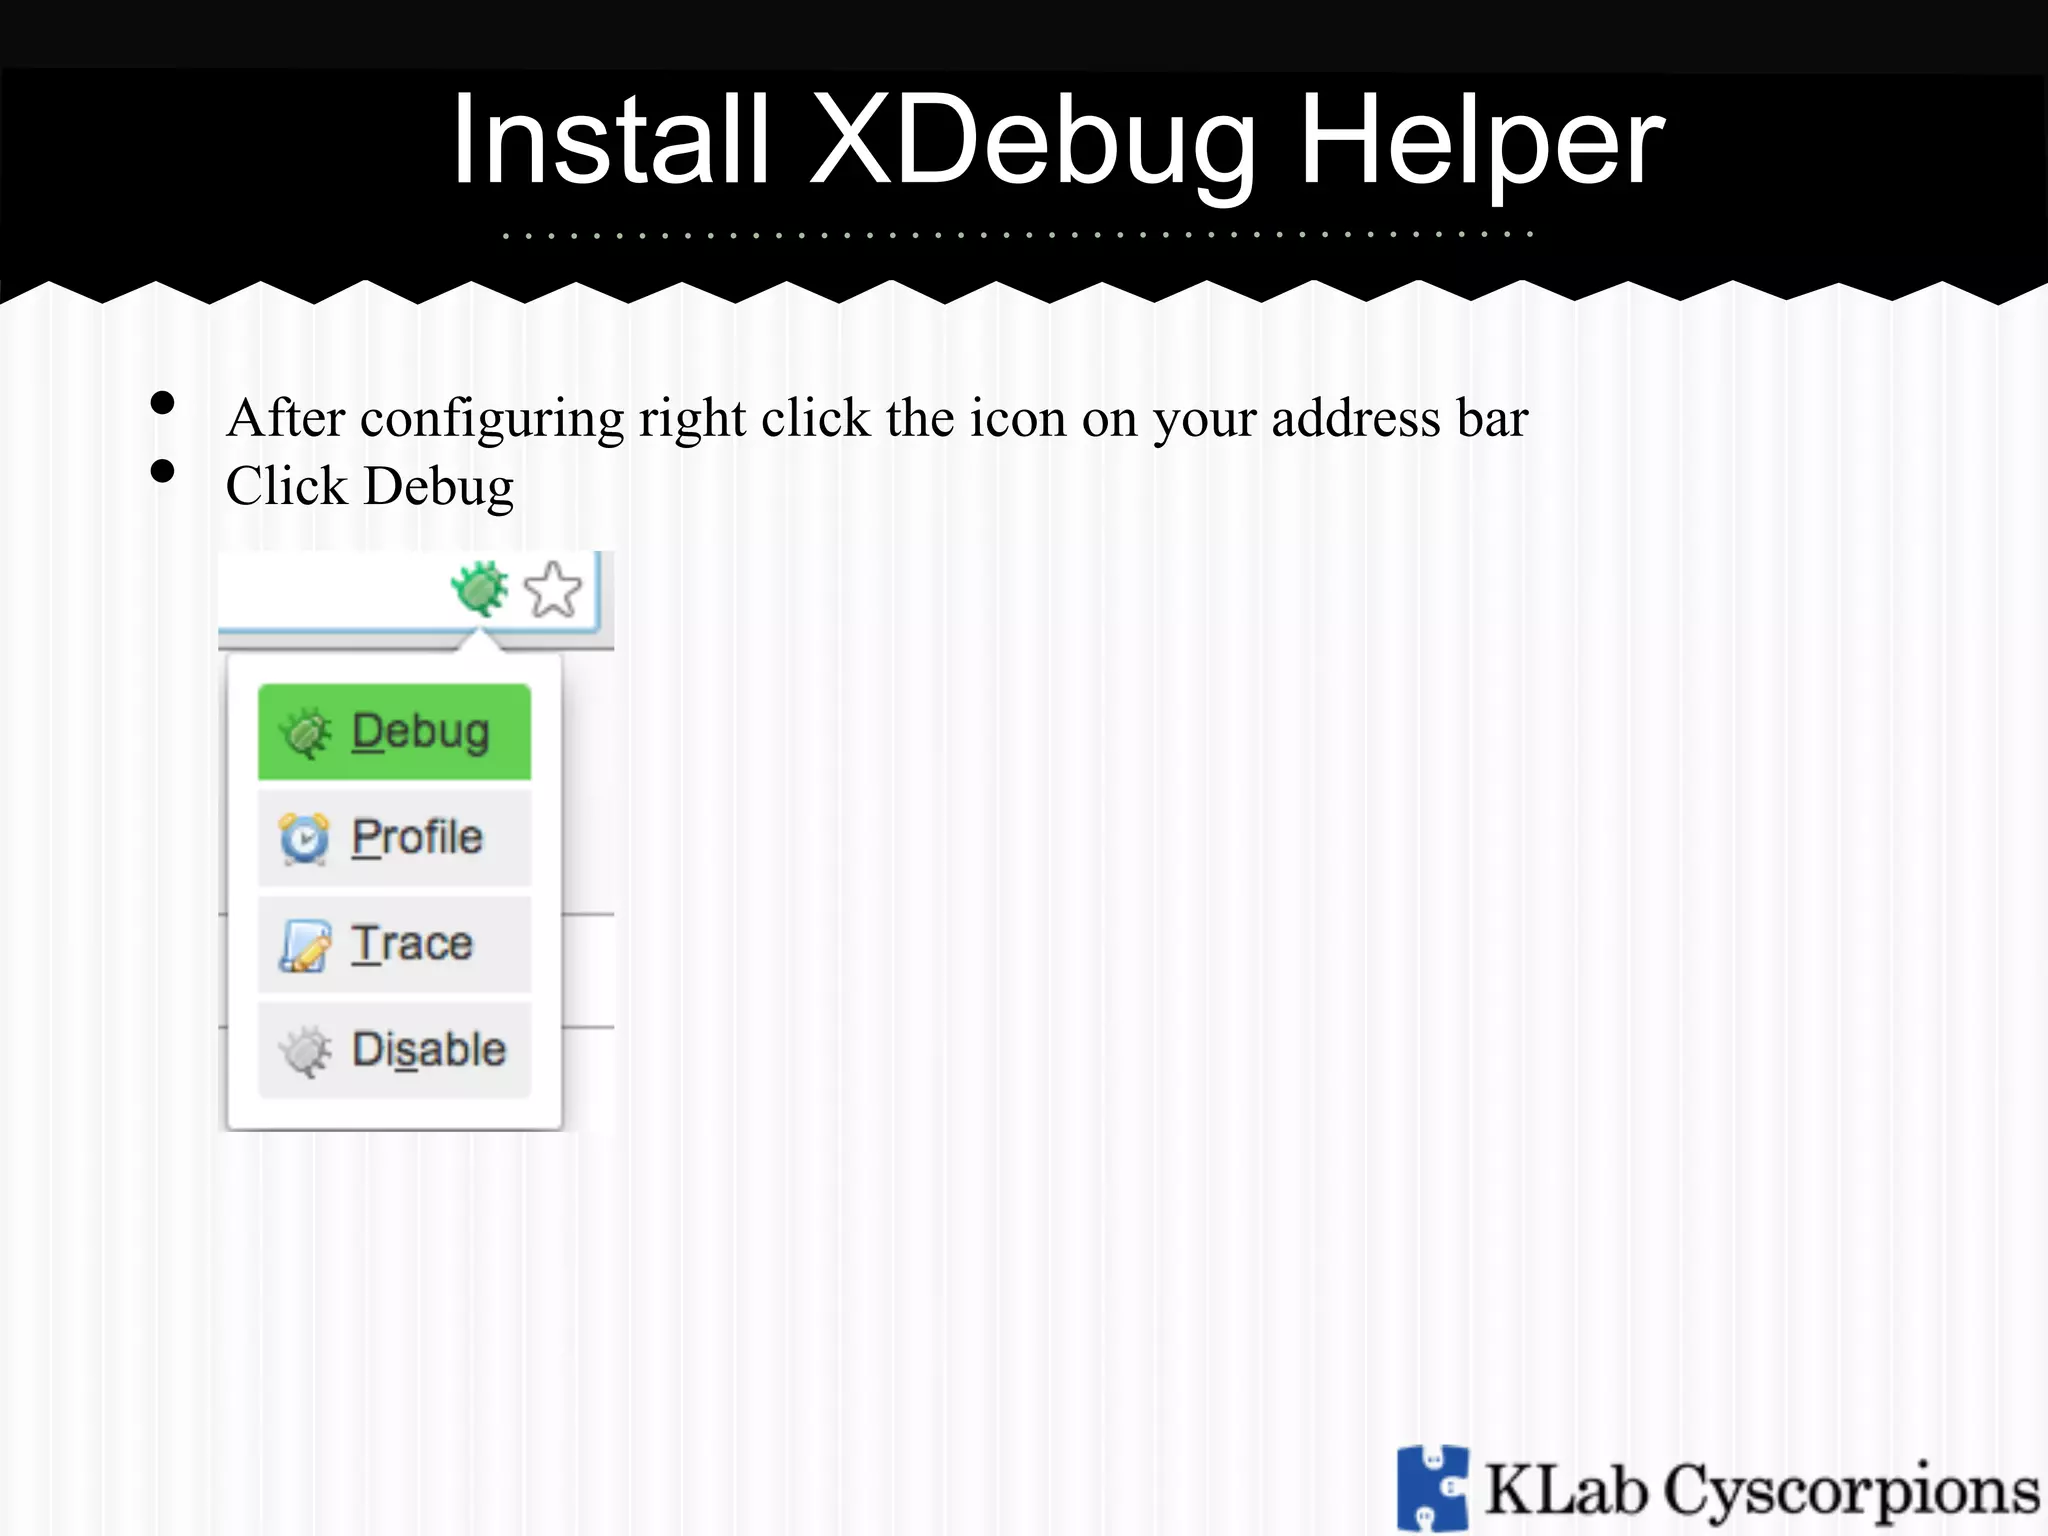
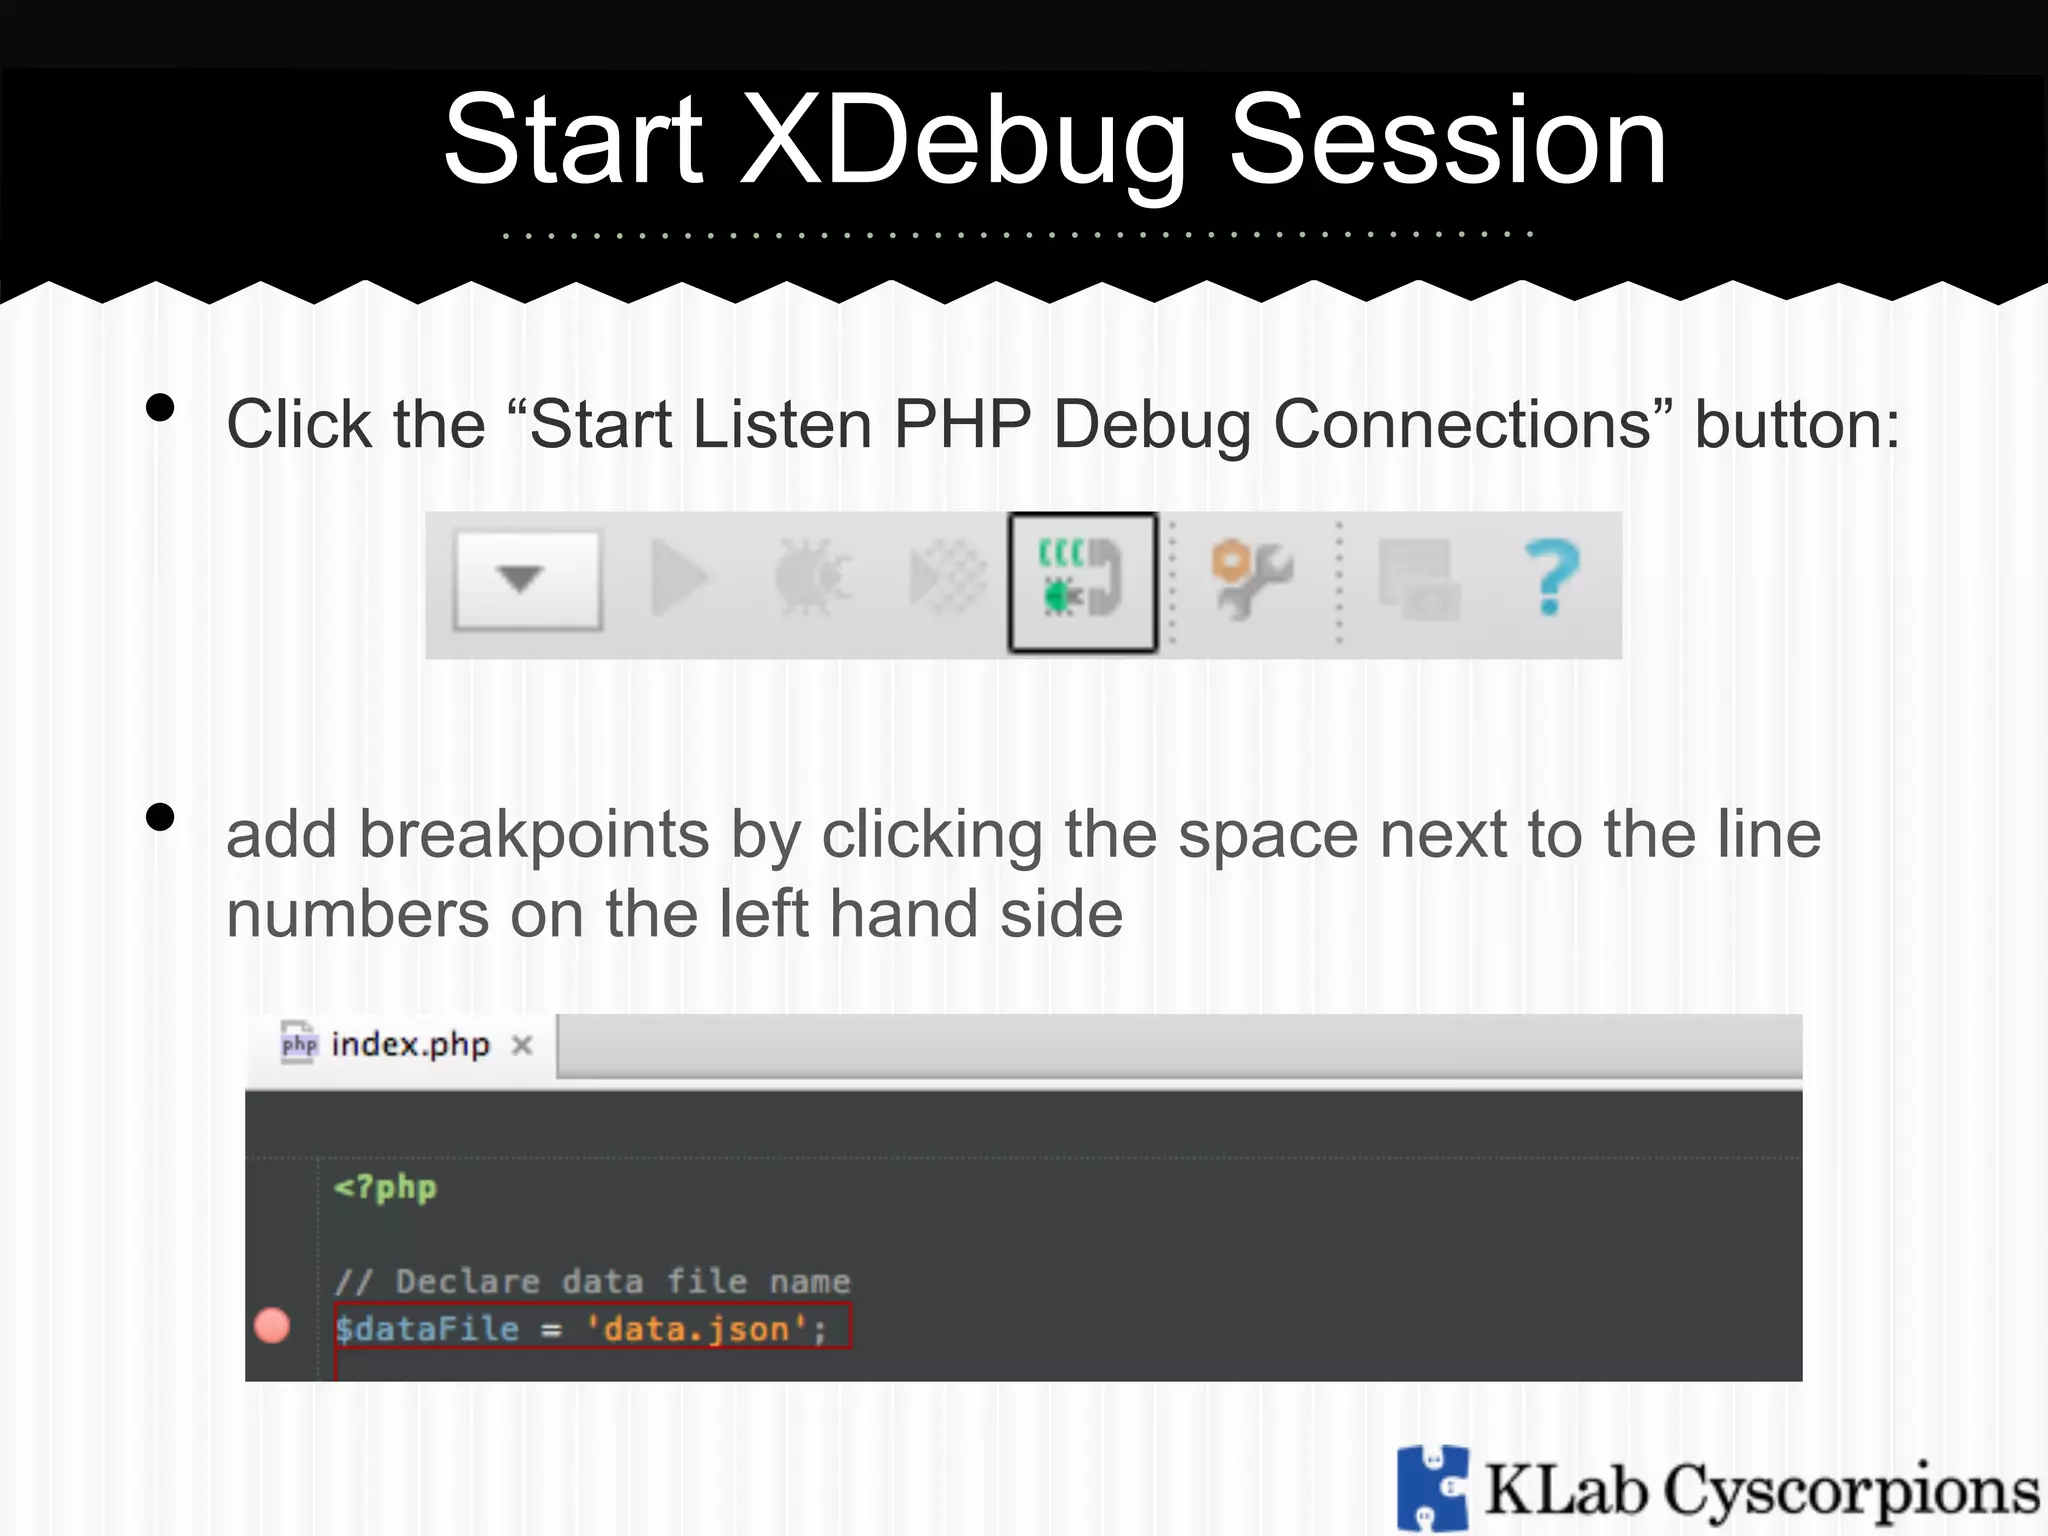
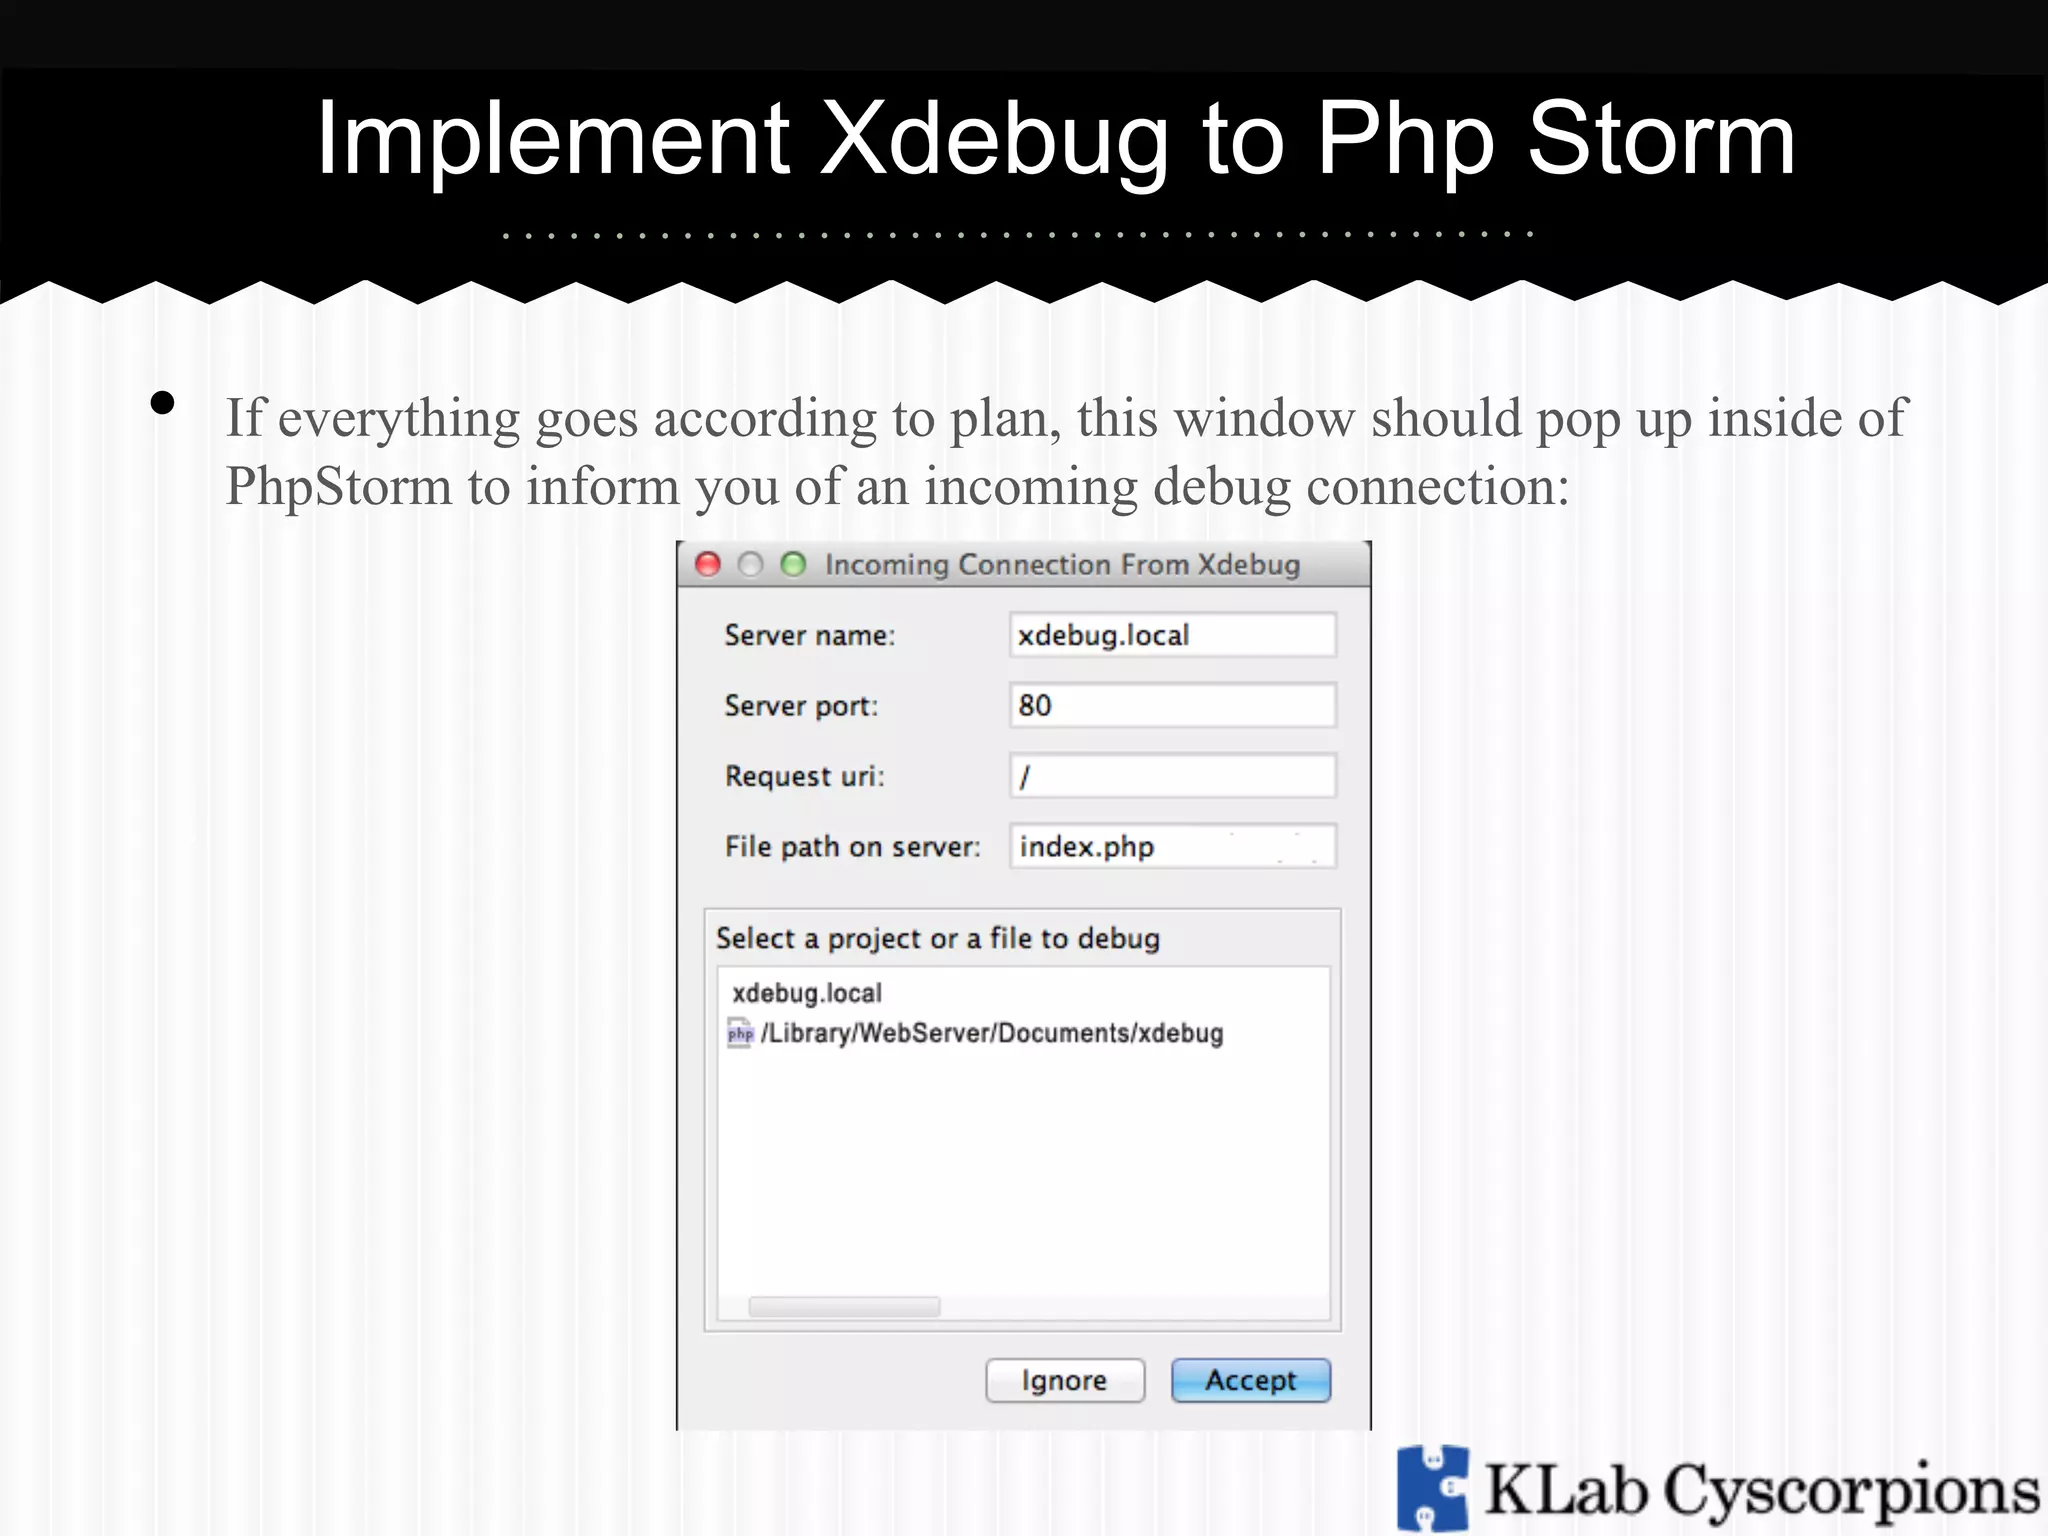
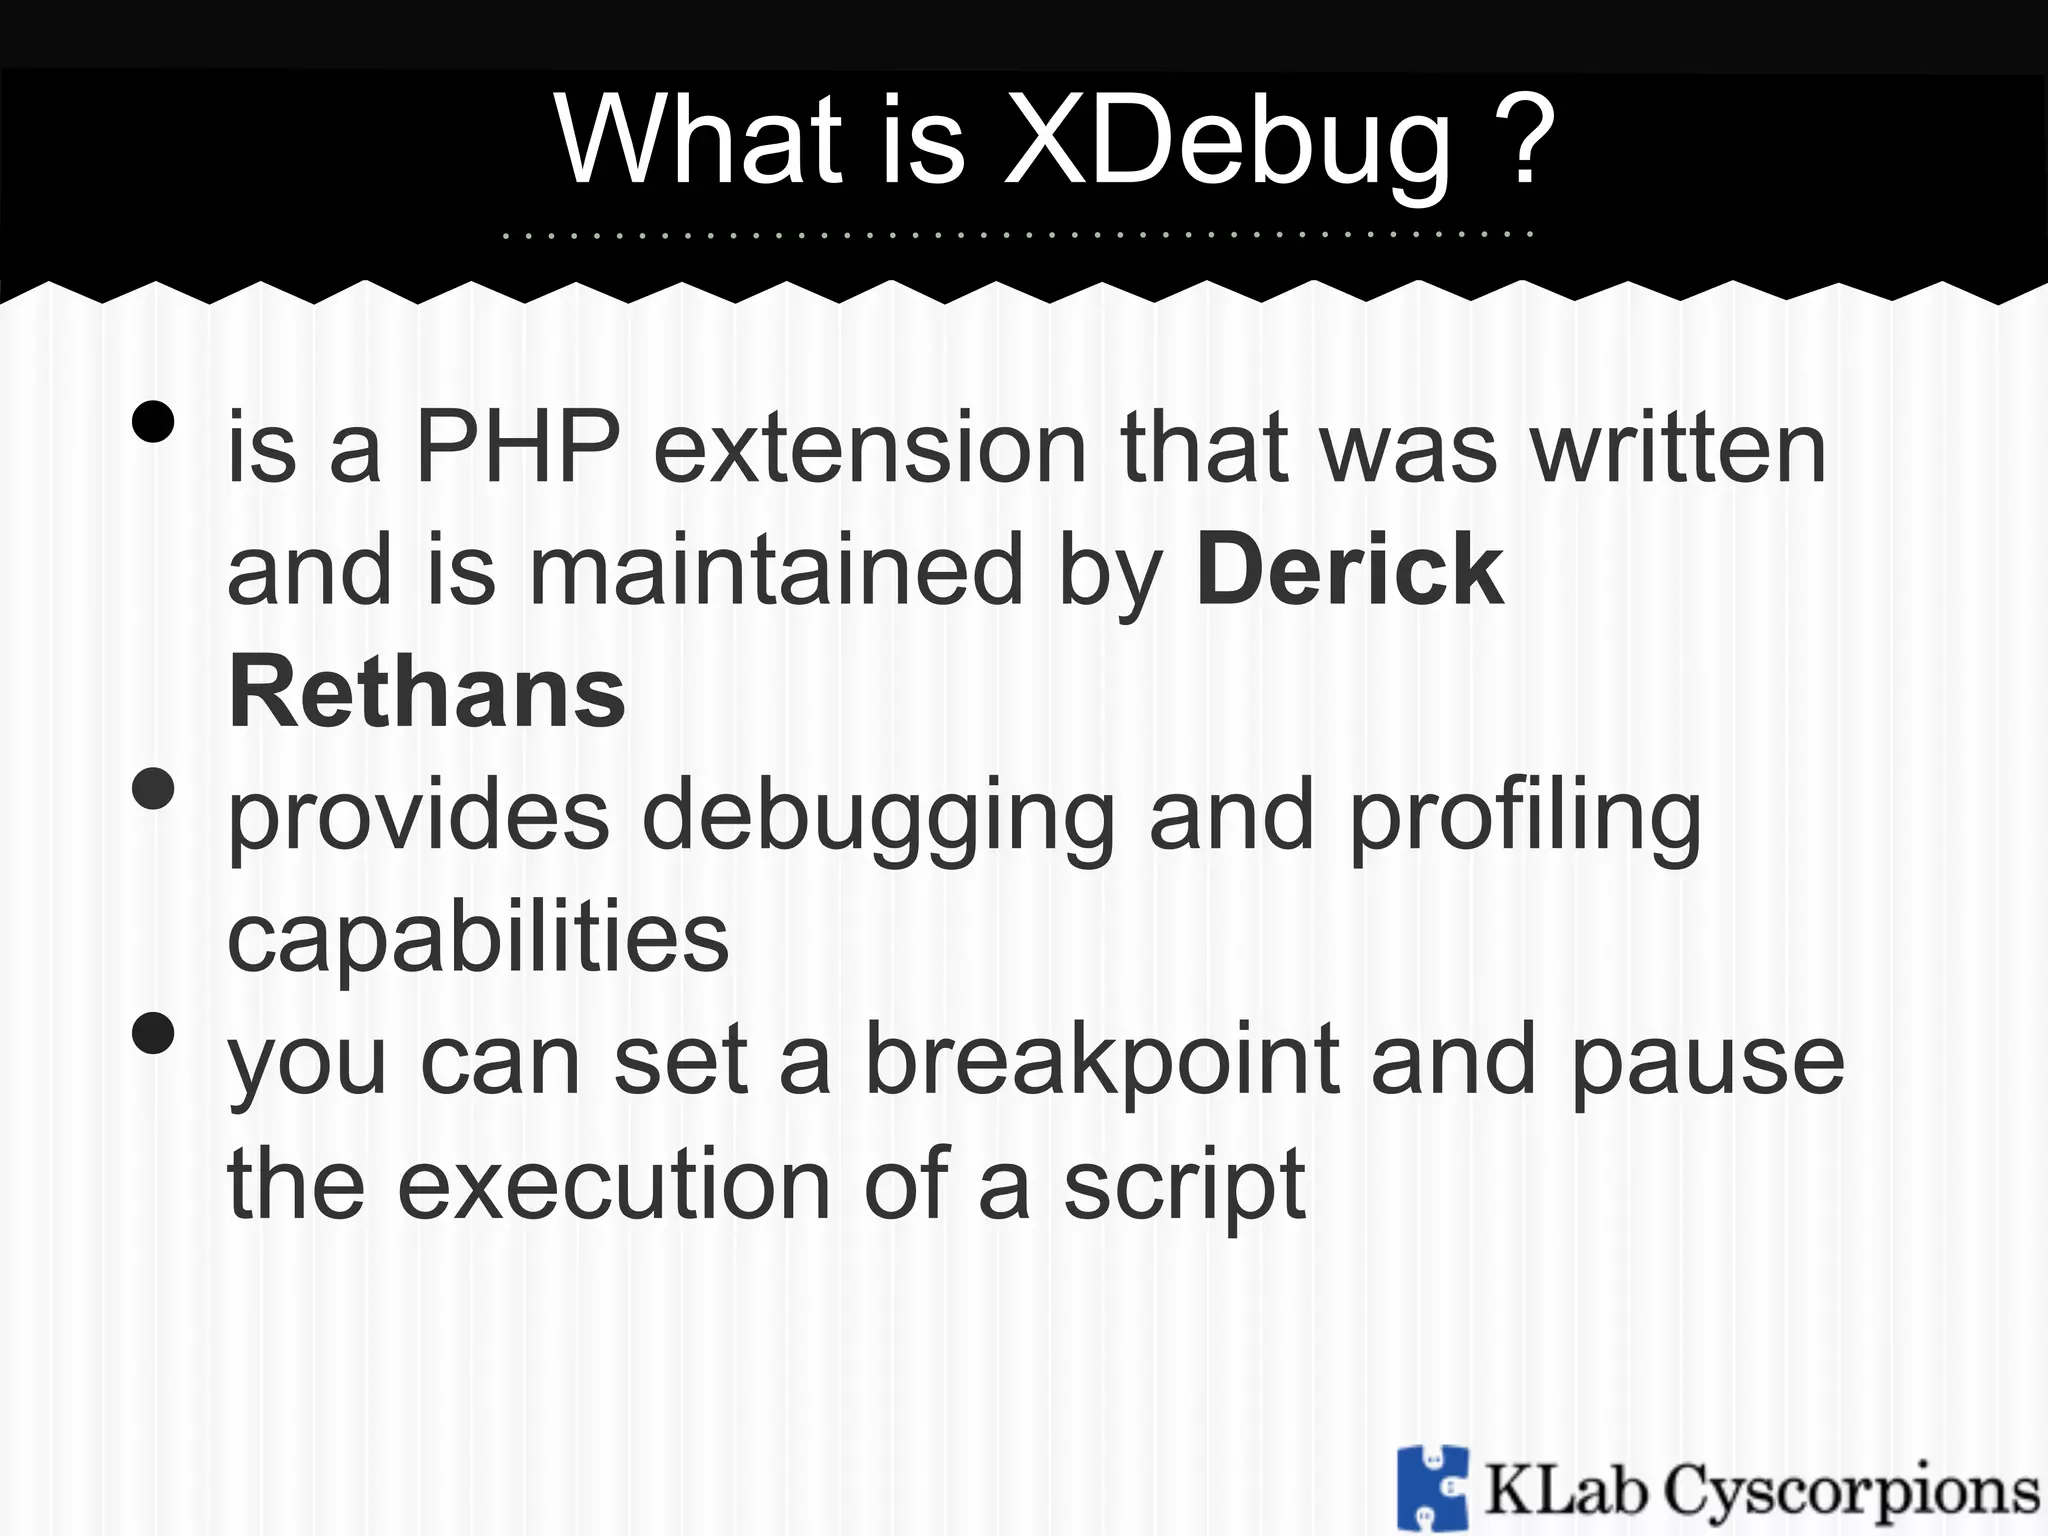
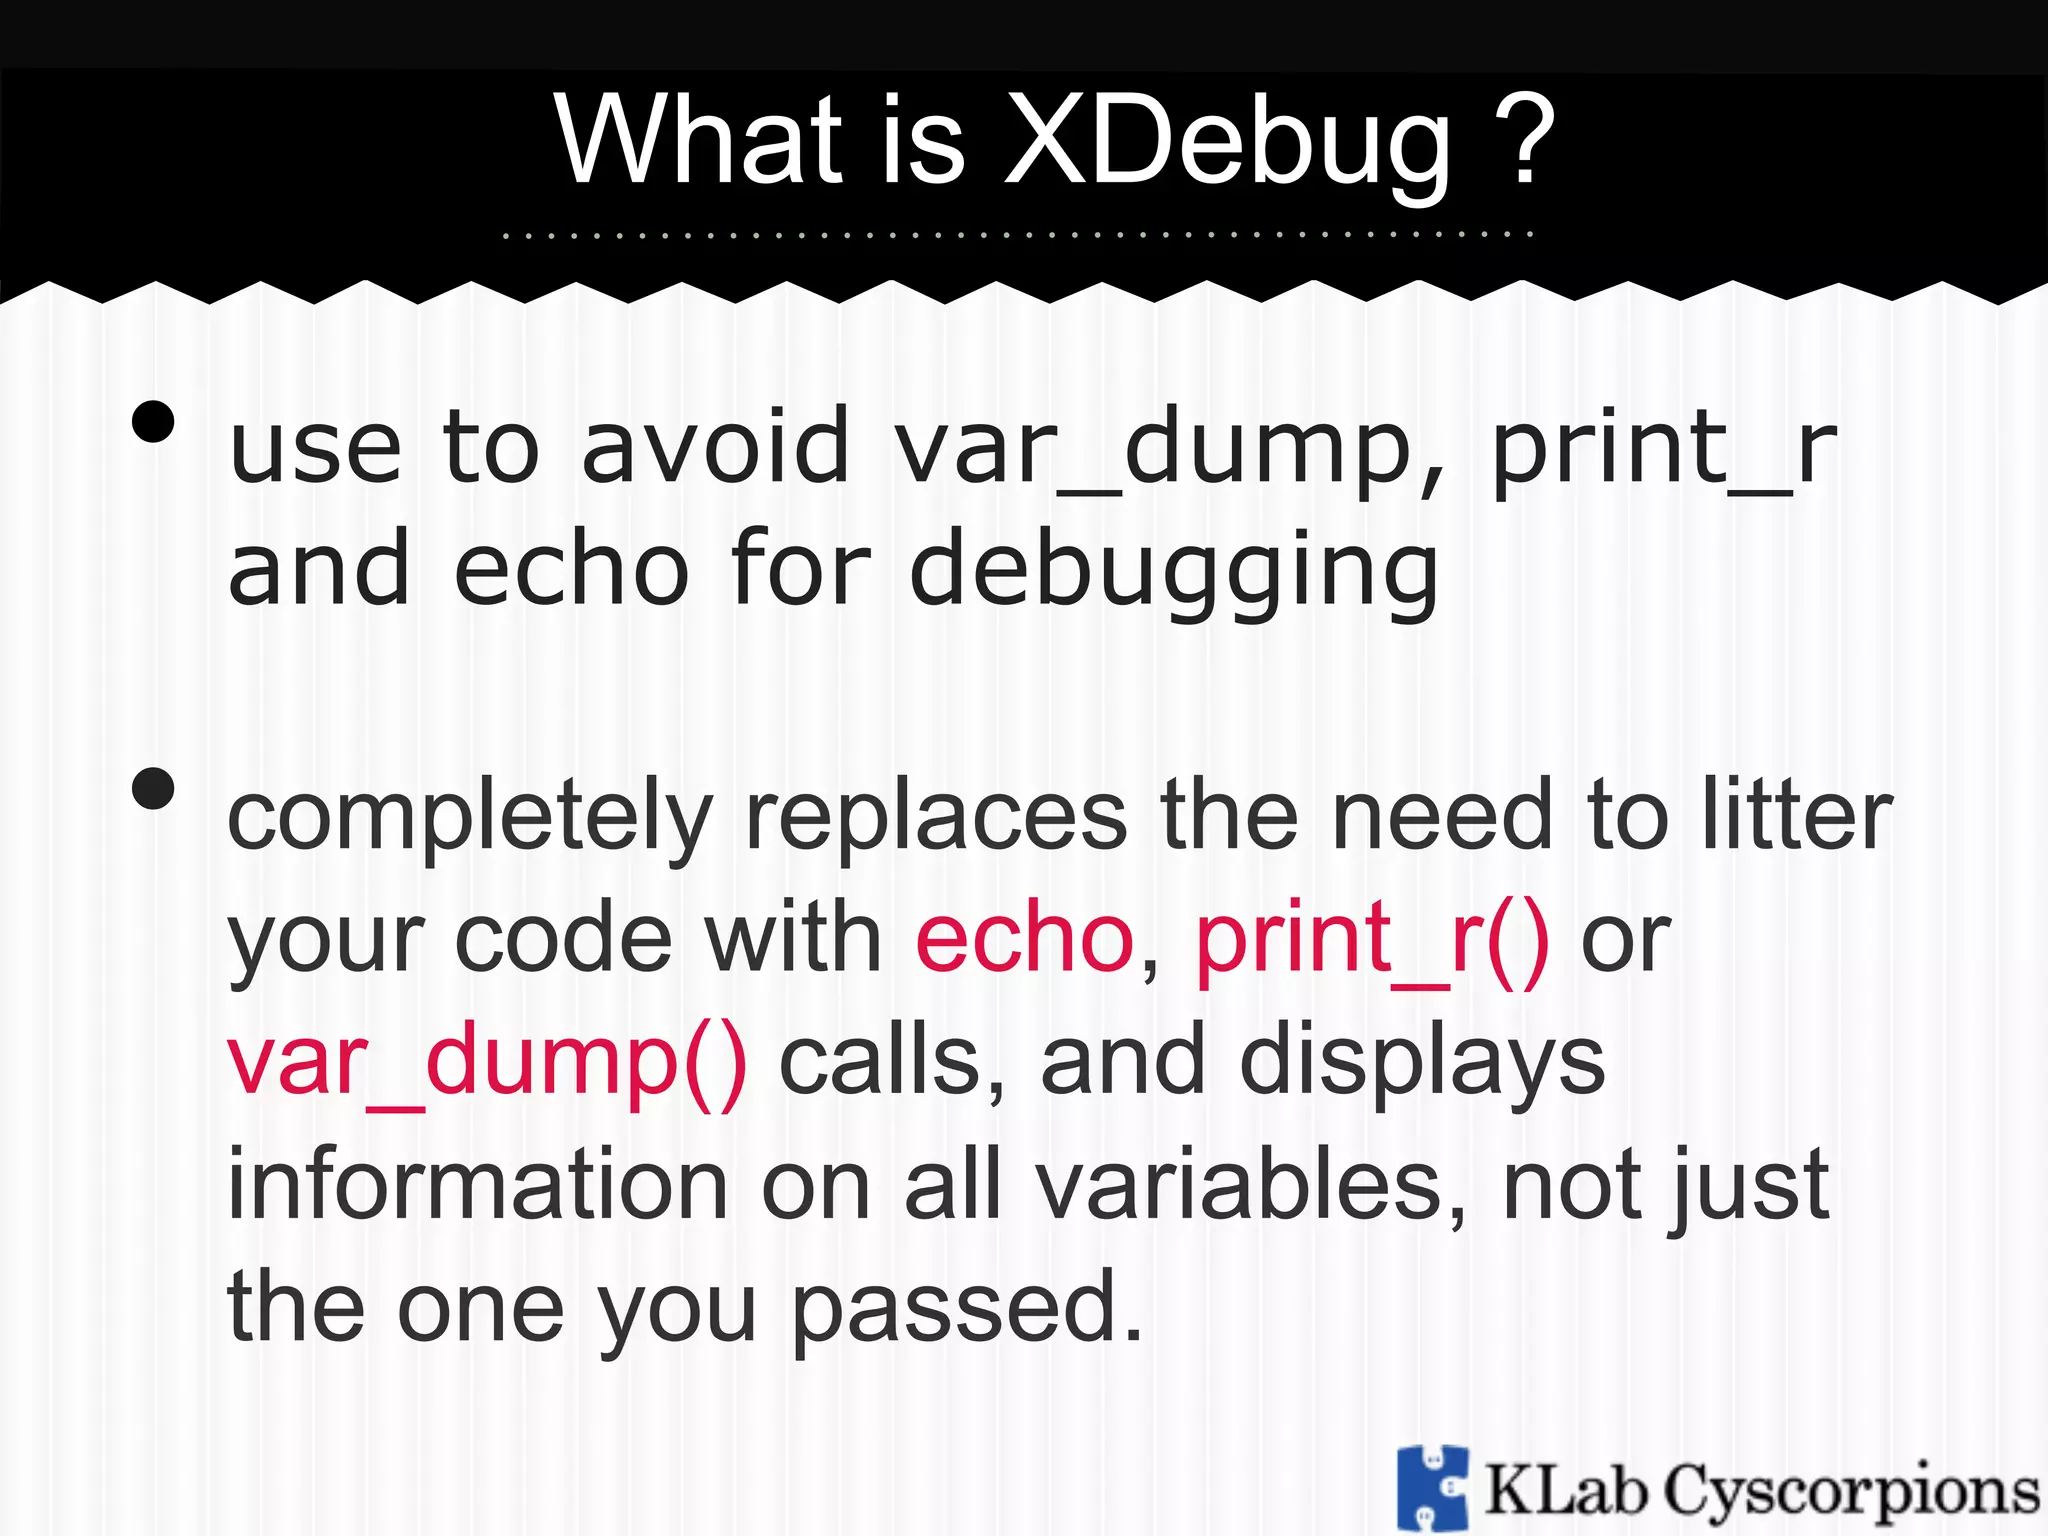
XDebug is a PHP extension that provides debugging and profiling capabilities. It allows you to set breakpoints and pause script execution, avoiding the need to add print/echo statements for debugging. XDebug works with IDEs like PHPStorm, Sublime Text, and Vim. The document provides instructions for installing XDebug on Ubuntu, Mac, and Windows systems, and configuring it to work with PHPStorm or Sublime Text. It also describes various debugging tools available in the IDEs like breakpoints, stepping, and viewing variables.
![Installation
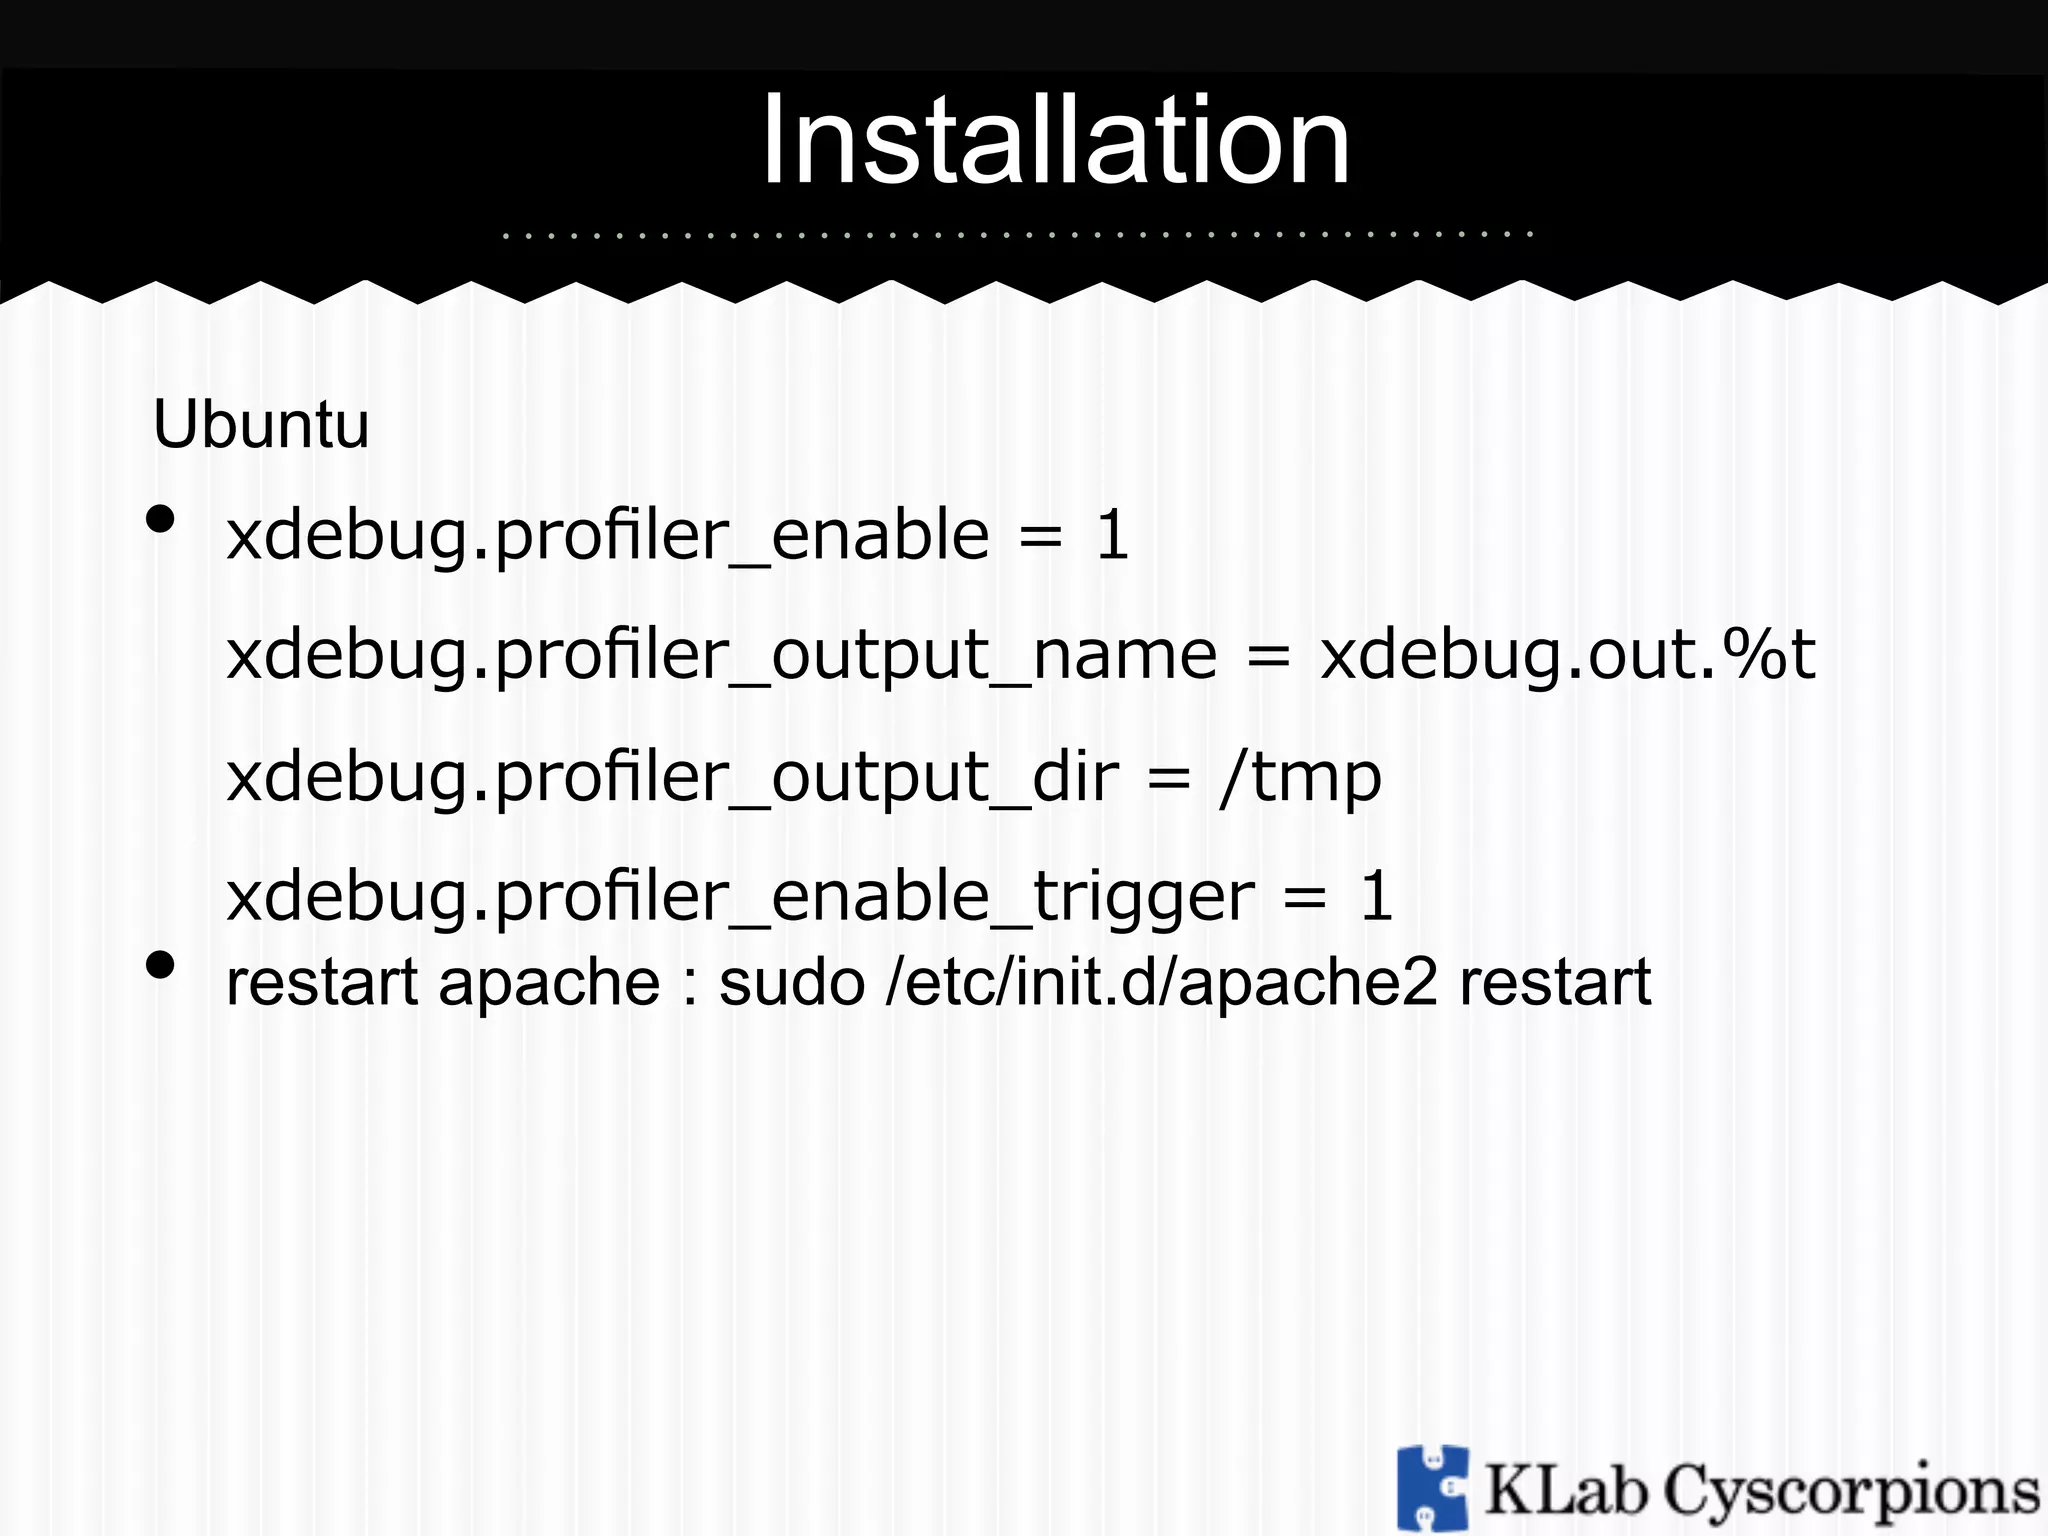
Ubuntu
sudo apt-get install php5-dev php-pear
Install xdebug thru PECL
o sudo pecl install xdebug
Then edit php.in add:
o zend_extension="/usr/lib/php5/20060613/xdebug.so"
o [xdebug]
o xdebug.file_link_format="txmt://open?url=file://
%f&line=%1"
o xdebug.remote_enable = On
o xdebug.remote_autostart = 1
•
•
•
•
restart apache : sudo /etc/init.d/apache2 restart](https://image.slidesharecdn.com/xdebugphpstorm-140226023938-phpapp01/75/X-Debug-in-Php-Storm-5-2048.jpg)
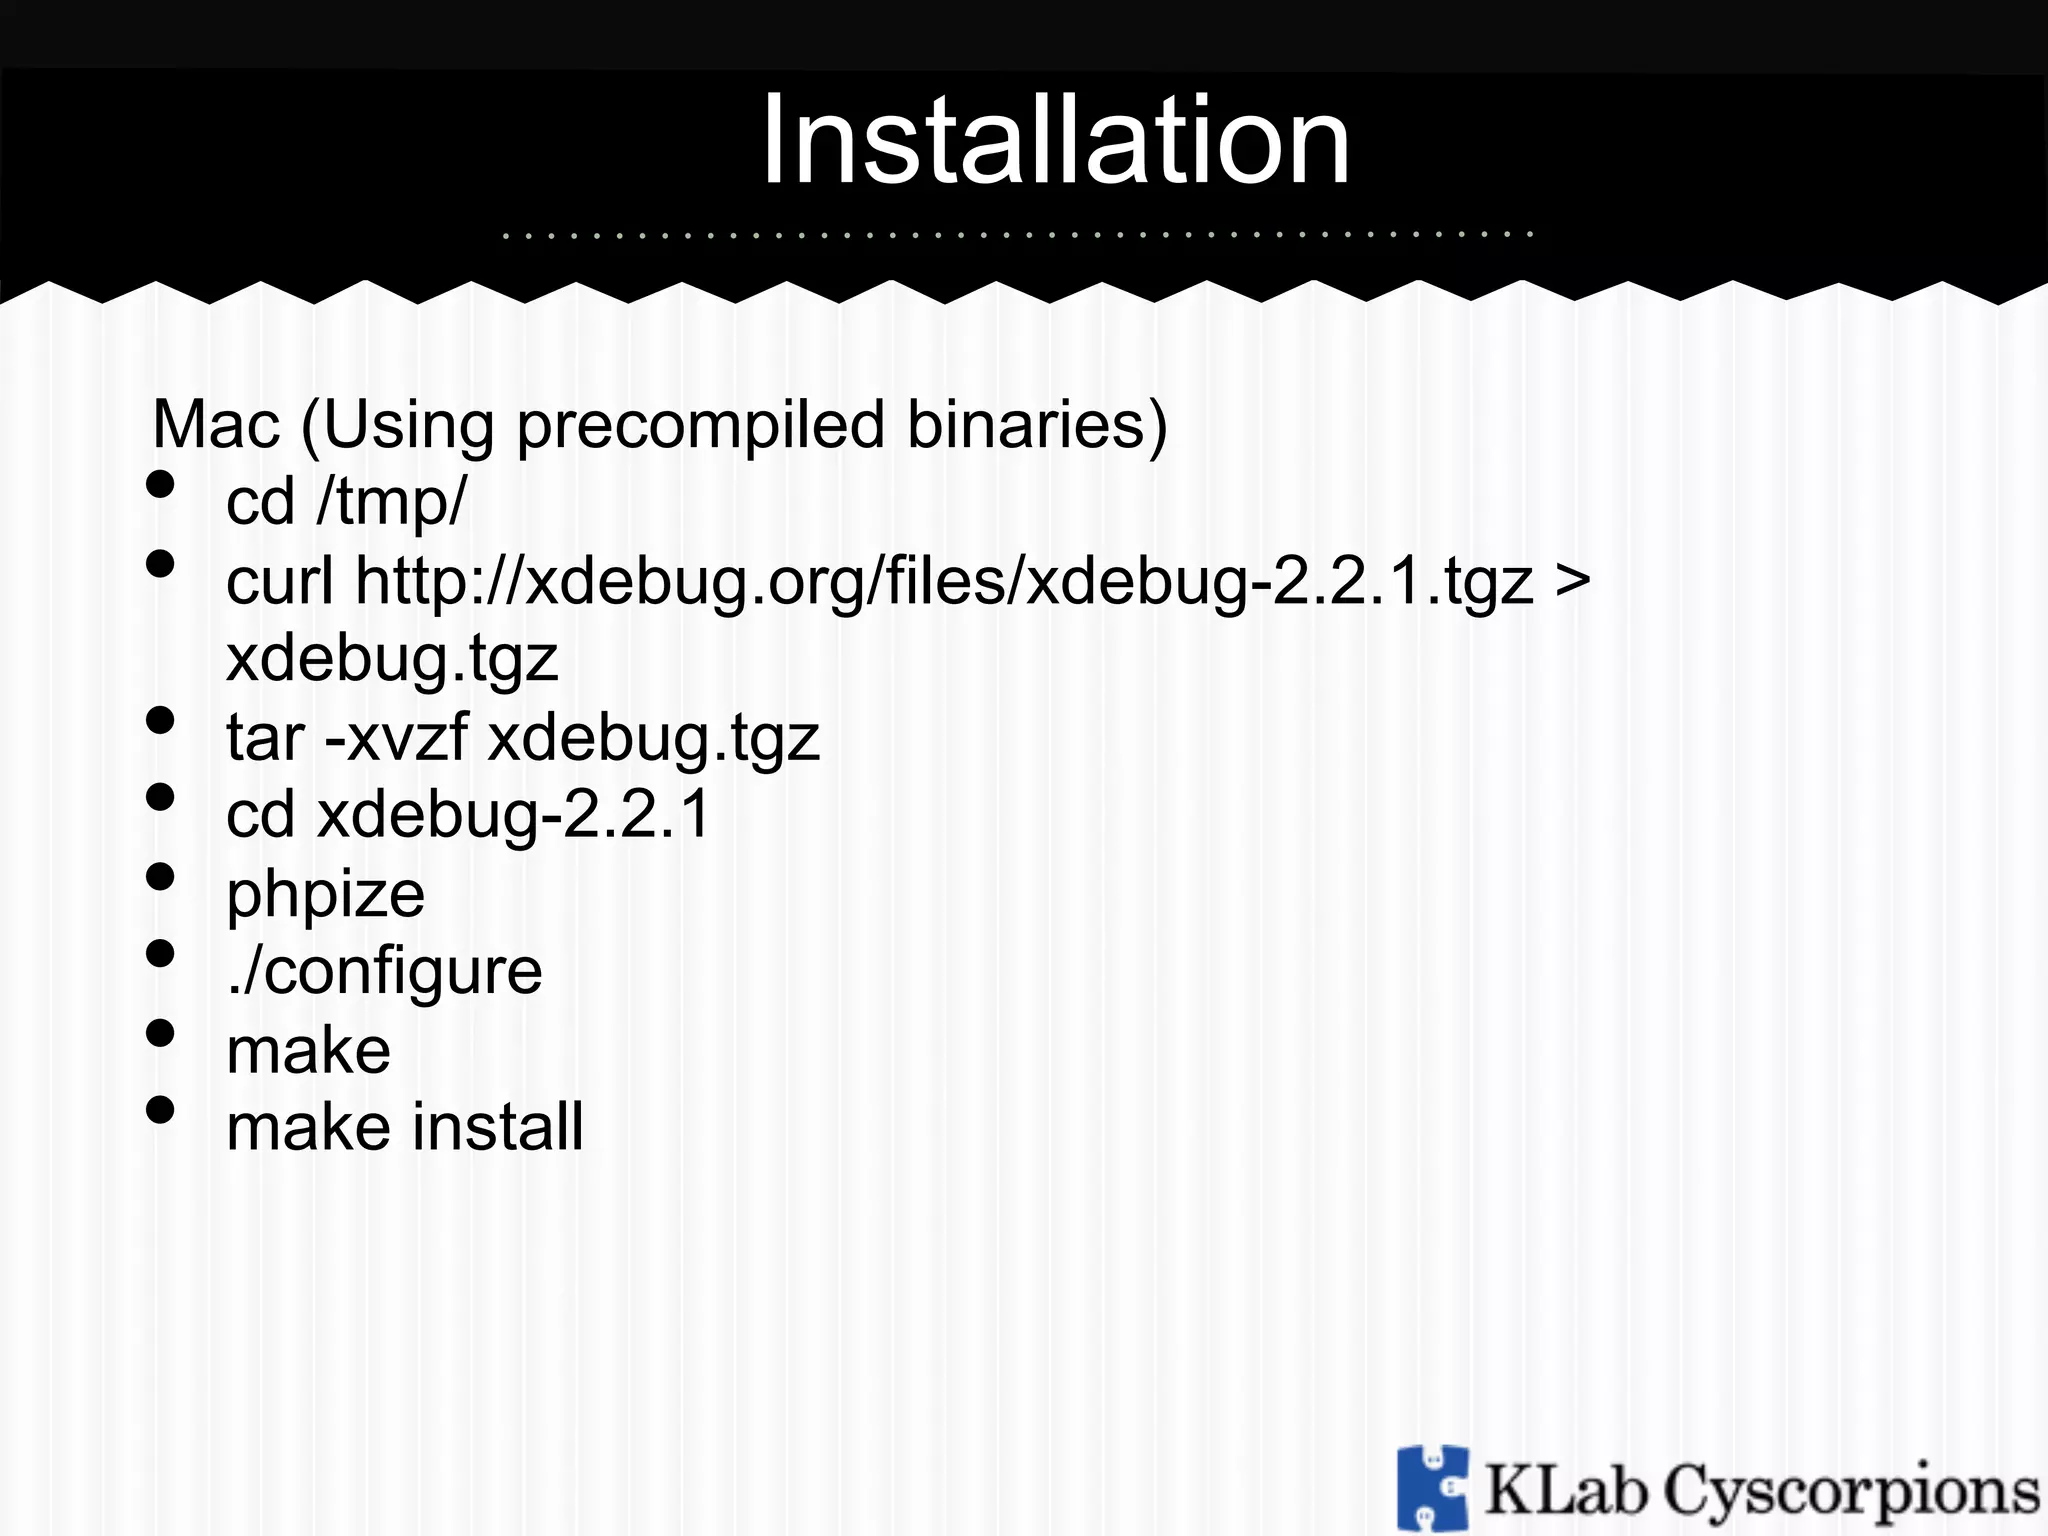
![Installation
Mac (Using precompiled binaries)
• on php.ini add the following line:
o zend_extension="/usr/lib/php5/20060613/xdebug.so"
o [xdebug]
o xdebug.file_link_format="txmt://open?
url=file://%f&line=%1"
o xdebug.remote_enable = On
o xdebug.remote_autostart = 1
• Restart Apache](https://image.slidesharecdn.com/xdebugphpstorm-140226023938-phpapp01/75/X-Debug-in-Php-Storm-8-2048.jpg)
![Installation
Windows
• Download appropriate xdebug version in
http://xdebug.org/download.php
• Save the .dll file to apache/modules folder
• On php.ini add the following lines
•
o zend_extension="path/to/xdebug.dll"
o [xdebug]
o xdebug.remote_enable = On
o xdebug.remote_autostart = 1
Restart Apache](https://image.slidesharecdn.com/xdebugphpstorm-140226023938-phpapp01/75/X-Debug-in-Php-Storm-9-2048.jpg)