SlideShare a Scribd company logo
Data and Results
References
The main instrument used for analysis in this study was a LC/MS/MS produced
by waters, which is a two-part instrument containing a Waters e2695 separations
module, and a Quattro micro micromass mass spectrometer. The two components
were connected by a Phenomenex Kinetex 5µ C18 100Å column that was 150 x
2.1mm. The instrument contained an auto sampler, and the wash used in between
sample collections was a mixture of 50% ASC grade methanol and 50% R.O. water.
There were several different solvent gradients tried, and the primary method
developed used a eluent of 80% R.O. water and 20% ACS grade methanol. The
primary method was also optimized for caffeine and its derivatives, and the MRM
component was programmed to look for all expected mass transitions of
theobromine, caffeine, and theophylline, as indicated by the NIST online database.
The water samples were collected either from public access points, or with
permission of the property owner. Approximately 1000 ml of each sample was
collected using plastic quart Ziploc bags, and were stored in the dark for no longer
than 10 days before undergoing the extraction procedure.
500 ml of each sample was used for the extraction, which was performed by first
using heat to reduce the samples to 100ml, and then adding ACS grade 2-propanol
as the organic phase, and mixing in ACS grade sodium chloride to increase the
Materials and Methods
Discussion
Conclusions
Introduction
After water, coffee and tea are two of the most consumed beverages on the
planet. According to a study done by the FDA, the average American
consumes 300mg of caffeine per day1, and metabolize about 95-98% of it into
paraxanthine, theobromine, and theophylline. In highly populated areas, the
excreted caffeine then goes through standardized waste water treatment where,
on average, 60-70% of the remaining caffeine is removed, and the rest enters
the local streams and rivers intact.
There is growing concern among environmentalists about modern
consumption of caffeine, because for muscles, tadpoles, snails, and other
aquatic life, the caffeine molecule is significantly more toxic than it is to
humans. Caffeine has been shown to be harmful at a mere 0.097mg/L2,
which, to put in perspective, is only 0.045mg/16oz. A recent study on inter-
tidal salt water muscles discovered that they produce significant amounts of
stress proteins when exposed to concentrations as low as 50ng/L, and while
caffeine does not bio-accumulate, reduced populations of these organisms
could cause major shifts in the entire ecosystem.
Multiple previous studies have shown higher than expected amounts of
caffeine in both salt and fresh water, and in North America, there are published
numbers for caffeine content from multiple states. However, since there was
little to no data found in the literature regarding the concentration of caffeine
or its metabolites in the water systems in and around Shepherdstown, this
study examined the levels of caffeine in local rivers, streams, and drinking
water sources.
Acknowledgments
This project was funded by the WV EPSCoR Summer
Undergraduate Research Experience Grant
Testing of Local Water Samples for Caffeine and Theobromine:
Potential Aquatic Pollutants
Megan Behrmann; Jacquelyn Cole, PhD
Shepherd University; Shepherdstown, WV 25443
1) Somogyi, L. P. Caffeine Intake by US population. USDA report,
Subcontract Number: 70000073494. completed Sept. 2009,
revised Aug. 2010.
2) Stephanie L. Fraker, Feoffrey R. Smith. Interactive Effects of
Ecologically Relevant Concentrations of Organic Wastewater
Contaminants on Rana pipiens Tadpoles. Environ Toxicol 19:
250–256, 2004.
While no significant amounts of caffeine or its derivatives were
detected in this study, it is still possible that there are measurable
amounts of caffeine in the water sources that were examined. To
further study this, an instrument with a lower detection threshold could
be used, or a larger sample of water could be treated with solvent in
the extraction. Additionally, alternate extraction methods could be
experimented with.
While caffeine itself can be toxic, some scientists speculate that the
molecule may also be a marker for even more concerning pollutants
like pharmaceuticals and industrial waste. Future studies may want to
examine water samples for other pollutants as well, and observe if
there is any correlation between caffeine and other waste water
molecules.
Other future work might include looking at the change in
concentration of caffeine overtime, to see if there is ecological
accumulation and what the possible sources may be. To gain a better
estimation of concentration levels in the area, more samples could be
collected, and at more regular distance intervals. To obtain more
accurate approximations of the concentration at each location, samples
could be collected at regular time intervals from each location, and the
data averaged.
As can clearly be seen by the MRM spectra shown, the theophylline
internal standard is clearly visible around the 4.8 minute mark. Since
the internal standard was not added before the extraction procedure, a
standard deviation test was performed to ensure accuracy of the
theophylline volumes. The percent standard deviation was 7.0%.
All samples were run first under the MS basic scan, and then run
through the instrument a second time using the MRM scan. For both
trials, no caffeine was visible and the internal standard was clearly
visible. While it is possible that one may expect slight variance in the
caffeine levels due to extraction efficiency, the total lack of caffeine in
all samples suggests that the results are accurate and consistent.
Therefore, since no caffeine was detected by the instrument, it is
clear that there is most likely no caffeine present in the local water
systems tested, and if there is, it is below the detectable limit of the
instrument.
Fig. 1
Initially, to ensure instrument
precision and to help with optimization,
a solution was mixed containing all
three of the compounds of interest. This
solution was run using the same primary
method as the water samples, and as you
can see in the figure to the left, all three
molecules are clearly visible and
separated, and the retention time is listed
above the peaks.
The figure shown is a product of the
multiple reaction monitoring (MRM)
capabilities of the type of instrument
used. MRM spectra are valuable,
because they allow for narrowing down
of the MS parameters to only look for
specific mass transitions. The
transitions used for this experiment were
taken from the NIST online data base for
mass spectrometry, and were optimized
based on the data.
The water samples collected were from a variety of
sources, and the locations of the sample collections are shown
on the map to the left by stars at the collection sites. Care was
taken to ensure that samples were not collected on or right
after days when precipitation occurred.
density of the aqueous layer to create
clear separation. After extraction, the
organic solvent was evaporated using a
heated water bath, until only crystals
remained. It was then reconstituted in
10 ml of a mixture of 80% R.O. water
and 20% ACS grade methanol, and
theophylline was added as an internal
standard.
The reconstituted sample was stored
in glass bottles at 40*C for less than 24
hours before being analyzed.
Molecule images courtesy of Discovery Studio Visualizer
Shown to the left is the data collected from each sample.
The data was collected using the MRM capabilities of the
instrument, and the mass transitions selected were those that
had been optimized during the course of the study.
As can clearly be seen, there is a large peak that
corresponds to the theophylline internal standard located
around 4.7 minutes, and this is consistent with the
theophylline peak shown above in the mixed solution. It is
also apparent that there is no other peaks visible.
When the MRMs were analyzed using the computer, no
significant caffeine or theobromine was detected.
Fig. 2
Fig. 3

More Related Content

What's hot

Determination of Bacteriological and Physiochemical Properties of Som-Breiro ...
Determination of Bacteriological and Physiochemical Properties of Som-Breiro ...Determination of Bacteriological and Physiochemical Properties of Som-Breiro ...
Determination of Bacteriological and Physiochemical Properties of Som-Breiro ...
RSIS International
 
2015 - Archaeal populations in full-scale autotrophic nitrogen removal biorea...
2015 - Archaeal populations in full-scale autotrophic nitrogen removal biorea...2015 - Archaeal populations in full-scale autotrophic nitrogen removal biorea...
2015 - Archaeal populations in full-scale autotrophic nitrogen removal biorea...
WALEBUBLÉ
 
Isotope ratio mass spectrometry minireview
Isotope ratio mass spectrometry   minireviewIsotope ratio mass spectrometry   minireview
Isotope ratio mass spectrometry minireview
Mahbubul Hassan
 
Optimization of Lipid Quantification for Analysis of Algae in Pulsed Electric...
Optimization of Lipid Quantification for Analysis of Algae in Pulsed Electric...Optimization of Lipid Quantification for Analysis of Algae in Pulsed Electric...
Optimization of Lipid Quantification for Analysis of Algae in Pulsed Electric...Brandon Rowley
 
Advances in Capillary Liquid Chromatography for High-Throughput Top Down Prot...
Advances in Capillary Liquid Chromatography for High-Throughput Top Down Prot...Advances in Capillary Liquid Chromatography for High-Throughput Top Down Prot...
Advances in Capillary Liquid Chromatography for High-Throughput Top Down Prot...
Expedeon
 
Capstone Presentation
Capstone PresentationCapstone Presentation
Capstone PresentationZofshan Khan
 
Univ of Iowa Research on Best Methods to Detect Radioactivity in Marcellus Sh...
Univ of Iowa Research on Best Methods to Detect Radioactivity in Marcellus Sh...Univ of Iowa Research on Best Methods to Detect Radioactivity in Marcellus Sh...
Univ of Iowa Research on Best Methods to Detect Radioactivity in Marcellus Sh...
Marcellus Drilling News
 
LCMS
LCMSLCMS
Kott_Applied spectrocopy_2014_68_1108
Kott_Applied spectrocopy_2014_68_1108Kott_Applied spectrocopy_2014_68_1108
Kott_Applied spectrocopy_2014_68_1108Laila Kott
 
TessRogersPresenationDraft1
TessRogersPresenationDraft1TessRogersPresenationDraft1
TessRogersPresenationDraft1Tess Rogers
 
Using lc ms to quantify and identify natural toxins in food and environmental...
Using lc ms to quantify and identify natural toxins in food and environmental...Using lc ms to quantify and identify natural toxins in food and environmental...
Using lc ms to quantify and identify natural toxins in food and environmental...
泰聖 葉
 
Fast, Sensitive, and Cost-effective Analysis of Trace Metals in Water by EPA ...
Fast, Sensitive, and Cost-effective Analysis of Trace Metals in Water by EPA ...Fast, Sensitive, and Cost-effective Analysis of Trace Metals in Water by EPA ...
Fast, Sensitive, and Cost-effective Analysis of Trace Metals in Water by EPA ...
Shimadzu Scientific Instruments
 
Quantitative Analysis of 30 Drugs in Whole Blood by SPE and UHPLC-TOF-MS
Quantitative Analysis of 30 Drugs in Whole Blood by SPE and UHPLC-TOF-MSQuantitative Analysis of 30 Drugs in Whole Blood by SPE and UHPLC-TOF-MS
Quantitative Analysis of 30 Drugs in Whole Blood by SPE and UHPLC-TOF-MS
Annex Publishers
 
Separation and Quantitation of Oxysterol Compounds Using LC-MS/MS
Separation and Quantitation of Oxysterol Compounds Using LC-MS/MSSeparation and Quantitation of Oxysterol Compounds Using LC-MS/MS
Separation and Quantitation of Oxysterol Compounds Using LC-MS/MS
Shimadzu Scientific Instruments
 
DEVELOPMENT OF A NITRATE CONCENTRATON PREDICTION MODEL USING UV
DEVELOPMENT OF A NITRATE CONCENTRATON PREDICTION MODEL USING UVDEVELOPMENT OF A NITRATE CONCENTRATON PREDICTION MODEL USING UV
DEVELOPMENT OF A NITRATE CONCENTRATON PREDICTION MODEL USING UVEvan Forney
 
SFEI&ASC NIST factsheet web_0
SFEI&ASC NIST factsheet web_0SFEI&ASC NIST factsheet web_0
SFEI&ASC NIST factsheet web_0Rebecca Sutton
 

What's hot (20)

thesis
thesisthesis
thesis
 
Determination of Bacteriological and Physiochemical Properties of Som-Breiro ...
Determination of Bacteriological and Physiochemical Properties of Som-Breiro ...Determination of Bacteriological and Physiochemical Properties of Som-Breiro ...
Determination of Bacteriological and Physiochemical Properties of Som-Breiro ...
 
MSc Report
MSc ReportMSc Report
MSc Report
 
KG Final Paper for EWRI[1]
KG Final Paper for EWRI[1]KG Final Paper for EWRI[1]
KG Final Paper for EWRI[1]
 
2015 - Archaeal populations in full-scale autotrophic nitrogen removal biorea...
2015 - Archaeal populations in full-scale autotrophic nitrogen removal biorea...2015 - Archaeal populations in full-scale autotrophic nitrogen removal biorea...
2015 - Archaeal populations in full-scale autotrophic nitrogen removal biorea...
 
Isotope ratio mass spectrometry minireview
Isotope ratio mass spectrometry   minireviewIsotope ratio mass spectrometry   minireview
Isotope ratio mass spectrometry minireview
 
Optimization of Lipid Quantification for Analysis of Algae in Pulsed Electric...
Optimization of Lipid Quantification for Analysis of Algae in Pulsed Electric...Optimization of Lipid Quantification for Analysis of Algae in Pulsed Electric...
Optimization of Lipid Quantification for Analysis of Algae in Pulsed Electric...
 
Poster 2 - AqTox
Poster 2 - AqToxPoster 2 - AqTox
Poster 2 - AqTox
 
Advances in Capillary Liquid Chromatography for High-Throughput Top Down Prot...
Advances in Capillary Liquid Chromatography for High-Throughput Top Down Prot...Advances in Capillary Liquid Chromatography for High-Throughput Top Down Prot...
Advances in Capillary Liquid Chromatography for High-Throughput Top Down Prot...
 
Capstone Presentation
Capstone PresentationCapstone Presentation
Capstone Presentation
 
Univ of Iowa Research on Best Methods to Detect Radioactivity in Marcellus Sh...
Univ of Iowa Research on Best Methods to Detect Radioactivity in Marcellus Sh...Univ of Iowa Research on Best Methods to Detect Radioactivity in Marcellus Sh...
Univ of Iowa Research on Best Methods to Detect Radioactivity in Marcellus Sh...
 
LCMS
LCMSLCMS
LCMS
 
Kott_Applied spectrocopy_2014_68_1108
Kott_Applied spectrocopy_2014_68_1108Kott_Applied spectrocopy_2014_68_1108
Kott_Applied spectrocopy_2014_68_1108
 
TessRogersPresenationDraft1
TessRogersPresenationDraft1TessRogersPresenationDraft1
TessRogersPresenationDraft1
 
Using lc ms to quantify and identify natural toxins in food and environmental...
Using lc ms to quantify and identify natural toxins in food and environmental...Using lc ms to quantify and identify natural toxins in food and environmental...
Using lc ms to quantify and identify natural toxins in food and environmental...
 
Fast, Sensitive, and Cost-effective Analysis of Trace Metals in Water by EPA ...
Fast, Sensitive, and Cost-effective Analysis of Trace Metals in Water by EPA ...Fast, Sensitive, and Cost-effective Analysis of Trace Metals in Water by EPA ...
Fast, Sensitive, and Cost-effective Analysis of Trace Metals in Water by EPA ...
 
Quantitative Analysis of 30 Drugs in Whole Blood by SPE and UHPLC-TOF-MS
Quantitative Analysis of 30 Drugs in Whole Blood by SPE and UHPLC-TOF-MSQuantitative Analysis of 30 Drugs in Whole Blood by SPE and UHPLC-TOF-MS
Quantitative Analysis of 30 Drugs in Whole Blood by SPE and UHPLC-TOF-MS
 
Separation and Quantitation of Oxysterol Compounds Using LC-MS/MS
Separation and Quantitation of Oxysterol Compounds Using LC-MS/MSSeparation and Quantitation of Oxysterol Compounds Using LC-MS/MS
Separation and Quantitation of Oxysterol Compounds Using LC-MS/MS
 
DEVELOPMENT OF A NITRATE CONCENTRATON PREDICTION MODEL USING UV
DEVELOPMENT OF A NITRATE CONCENTRATON PREDICTION MODEL USING UVDEVELOPMENT OF A NITRATE CONCENTRATON PREDICTION MODEL USING UV
DEVELOPMENT OF A NITRATE CONCENTRATON PREDICTION MODEL USING UV
 
SFEI&ASC NIST factsheet web_0
SFEI&ASC NIST factsheet web_0SFEI&ASC NIST factsheet web_0
SFEI&ASC NIST factsheet web_0
 

Viewers also liked

BUSH PEPPER
BUSH PEPPERBUSH PEPPER
Cocoa chocolate a dream company
Cocoa chocolate  a dream companyCocoa chocolate  a dream company
Cocoa chocolate a dream company
Manish Kumar Sharma
 
Chocolate production process-Hersheys
Chocolate production process-HersheysChocolate production process-Hersheys
Chocolate production process-HersheysKaustubh Kokane
 
Food of the gods
Food of the godsFood of the gods
Food of the gods
Rione Drevale
 
Amalan Pertanian Yang Baik Untuk Penanaman Lada
Amalan Pertanian Yang Baik Untuk Penanaman LadaAmalan Pertanian Yang Baik Untuk Penanaman Lada
Amalan Pertanian Yang Baik Untuk Penanaman Lada
Yudep Apoi
 
Cocoa fermentation
Cocoa fermentationCocoa fermentation
Cocoa fermentation
Raga Madhuri Reddam
 
Cocoa - chemistry processing and technology
Cocoa - chemistry processing and technologyCocoa - chemistry processing and technology
Cocoa - chemistry processing and technology
Ammar Babar
 
Cocoa production ppt
Cocoa production pptCocoa production ppt
Cocoa production pptSRG14
 
Alkaloids
AlkaloidsAlkaloids
Black pepper :Rmm and vcm –a revolutionary method for boosting black pepper p...
Black pepper :Rmm and vcm –a revolutionary method for boosting black pepper p...Black pepper :Rmm and vcm –a revolutionary method for boosting black pepper p...
Black pepper :Rmm and vcm –a revolutionary method for boosting black pepper p...
Muhammed Abdul Jamiah
 
Final Lab Report-Caffeine
Final Lab Report-CaffeineFinal Lab Report-Caffeine
Final Lab Report-CaffeineAndrew LeSage
 
Succession “Losers”: What Happens to Executives Passed Over for the CEO Job?
Succession “Losers”: What Happens to Executives Passed Over for the CEO Job? Succession “Losers”: What Happens to Executives Passed Over for the CEO Job?
Succession “Losers”: What Happens to Executives Passed Over for the CEO Job?
Stanford GSB Corporate Governance Research Initiative
 

Viewers also liked (16)

BUSH PEPPER
BUSH PEPPERBUSH PEPPER
BUSH PEPPER
 
9 112 Samaradivakara S DNA barcoding of cinnamon
9 112 Samaradivakara S DNA barcoding of cinnamon9 112 Samaradivakara S DNA barcoding of cinnamon
9 112 Samaradivakara S DNA barcoding of cinnamon
 
Cocoa chocolate a dream company
Cocoa chocolate  a dream companyCocoa chocolate  a dream company
Cocoa chocolate a dream company
 
Chocolate production process-Hersheys
Chocolate production process-HersheysChocolate production process-Hersheys
Chocolate production process-Hersheys
 
Food of the gods
Food of the godsFood of the gods
Food of the gods
 
Amalan Pertanian Yang Baik Untuk Penanaman Lada
Amalan Pertanian Yang Baik Untuk Penanaman LadaAmalan Pertanian Yang Baik Untuk Penanaman Lada
Amalan Pertanian Yang Baik Untuk Penanaman Lada
 
Cadbury
CadburyCadbury
Cadbury
 
Cocoa fermentation
Cocoa fermentationCocoa fermentation
Cocoa fermentation
 
Cocoa - chemistry processing and technology
Cocoa - chemistry processing and technologyCocoa - chemistry processing and technology
Cocoa - chemistry processing and technology
 
Cocoa production ppt
Cocoa production pptCocoa production ppt
Cocoa production ppt
 
Alkaloids
AlkaloidsAlkaloids
Alkaloids
 
Chocolates presentation
Chocolates presentationChocolates presentation
Chocolates presentation
 
Chocolate Presentation
Chocolate PresentationChocolate Presentation
Chocolate Presentation
 
Black pepper :Rmm and vcm –a revolutionary method for boosting black pepper p...
Black pepper :Rmm and vcm –a revolutionary method for boosting black pepper p...Black pepper :Rmm and vcm –a revolutionary method for boosting black pepper p...
Black pepper :Rmm and vcm –a revolutionary method for boosting black pepper p...
 
Final Lab Report-Caffeine
Final Lab Report-CaffeineFinal Lab Report-Caffeine
Final Lab Report-Caffeine
 
Succession “Losers”: What Happens to Executives Passed Over for the CEO Job?
Succession “Losers”: What Happens to Executives Passed Over for the CEO Job? Succession “Losers”: What Happens to Executives Passed Over for the CEO Job?
Succession “Losers”: What Happens to Executives Passed Over for the CEO Job?
 

Similar to WV-AS poster 2016

Quantitative and Qualitative analysis of Toxicology pharm 402
Quantitative and Qualitative analysis of Toxicology pharm 402Quantitative and Qualitative analysis of Toxicology pharm 402
Quantitative and Qualitative analysis of Toxicology pharm 402Justas Lauzadis
 
Analysis of Atrazine Using DLLME and HS-LPME
Analysis of Atrazine Using DLLME and HS-LPMEAnalysis of Atrazine Using DLLME and HS-LPME
Analysis of Atrazine Using DLLME and HS-LPMEEleanor K. Skelton
 
Rapid Quantification of Perfluorinated Compounds in Drinking and Surface Wate...
Rapid Quantification of Perfluorinated Compounds in Drinking and Surface Wate...Rapid Quantification of Perfluorinated Compounds in Drinking and Surface Wate...
Rapid Quantification of Perfluorinated Compounds in Drinking and Surface Wate...
Shimadzu Scientific Instruments
 
Zina Al-Saffar 2016- BACT control biosenor_final article
Zina Al-Saffar 2016- BACT control biosenor_final articleZina Al-Saffar 2016- BACT control biosenor_final article
Zina Al-Saffar 2016- BACT control biosenor_final articleZina Al-Saffar
 
Haemolysis effect of Mefenamic Acid 250 mg Capsule in Bio analysis by liquid ...
Haemolysis effect of Mefenamic Acid 250 mg Capsule in Bio analysis by liquid ...Haemolysis effect of Mefenamic Acid 250 mg Capsule in Bio analysis by liquid ...
Haemolysis effect of Mefenamic Acid 250 mg Capsule in Bio analysis by liquid ...
IOSR Journals
 
Kyle Planck Report 2016
Kyle Planck Report 2016Kyle Planck Report 2016
Kyle Planck Report 2016Kyle Planck
 
Art%3 a10.1007%2fs12161 013-9618-4
Art%3 a10.1007%2fs12161 013-9618-4Art%3 a10.1007%2fs12161 013-9618-4
Art%3 a10.1007%2fs12161 013-9618-4Nádia Paracampo
 
Conceição et al, 2009. characterization of a new bioactive peptide from potam...
Conceição et al, 2009. characterization of a new bioactive peptide from potam...Conceição et al, 2009. characterization of a new bioactive peptide from potam...
Conceição et al, 2009. characterization of a new bioactive peptide from potam...
pryloock
 
10.1021@ac3033245
10.1021@ac303324510.1021@ac3033245
10.1021@ac3033245
Audry Arias
 
Physicochemical and Bacteriological Analysis of Drinking Water Samples from U...
Physicochemical and Bacteriological Analysis of Drinking Water Samples from U...Physicochemical and Bacteriological Analysis of Drinking Water Samples from U...
Physicochemical and Bacteriological Analysis of Drinking Water Samples from U...
SSR Institute of International Journal of Life Sciences
 
Blood amps poster_090210
Blood amps poster_090210Blood amps poster_090210
Blood amps poster_090210
Jervin22000
 
Analysis Of Atrazine Using DLLME and HS-LPME
Analysis Of Atrazine Using DLLME and HS-LPMEAnalysis Of Atrazine Using DLLME and HS-LPME
Analysis Of Atrazine Using DLLME and HS-LPMEEclecticElegance
 
Hw9 solutions 16-1
Hw9 solutions 16-1Hw9 solutions 16-1
Hw9 solutions 16-1
Mohamed Elbehlil
 
SGSLSS-EL_Poster-PT-1-2016
SGSLSS-EL_Poster-PT-1-2016SGSLSS-EL_Poster-PT-1-2016
SGSLSS-EL_Poster-PT-1-2016Kenneth Wong
 
Carotenoid
CarotenoidCarotenoid
Carotenoid
ssuserdc1efa
 
Organic Chemistry Lab Report Example
Organic Chemistry Lab Report ExampleOrganic Chemistry Lab Report Example
Organic Chemistry Lab Report Example
Writers Per Hour
 
Coacervates Experiment
Coacervates ExperimentCoacervates Experiment
Coacervates Experiment
Kimberly Thomas
 
Total phenolics and total flavonoids of extracts from freshwater Clam (Corbic...
Total phenolics and total flavonoids of extracts from freshwater Clam (Corbic...Total phenolics and total flavonoids of extracts from freshwater Clam (Corbic...
Total phenolics and total flavonoids of extracts from freshwater Clam (Corbic...
Innspub Net
 

Similar to WV-AS poster 2016 (20)

Quantitative and Qualitative analysis of Toxicology pharm 402
Quantitative and Qualitative analysis of Toxicology pharm 402Quantitative and Qualitative analysis of Toxicology pharm 402
Quantitative and Qualitative analysis of Toxicology pharm 402
 
Analysis of Atrazine Using DLLME and HS-LPME
Analysis of Atrazine Using DLLME and HS-LPMEAnalysis of Atrazine Using DLLME and HS-LPME
Analysis of Atrazine Using DLLME and HS-LPME
 
Rapid Quantification of Perfluorinated Compounds in Drinking and Surface Wate...
Rapid Quantification of Perfluorinated Compounds in Drinking and Surface Wate...Rapid Quantification of Perfluorinated Compounds in Drinking and Surface Wate...
Rapid Quantification of Perfluorinated Compounds in Drinking and Surface Wate...
 
Zina Al-Saffar 2016- BACT control biosenor_final article
Zina Al-Saffar 2016- BACT control biosenor_final articleZina Al-Saffar 2016- BACT control biosenor_final article
Zina Al-Saffar 2016- BACT control biosenor_final article
 
Haemolysis effect of Mefenamic Acid 250 mg Capsule in Bio analysis by liquid ...
Haemolysis effect of Mefenamic Acid 250 mg Capsule in Bio analysis by liquid ...Haemolysis effect of Mefenamic Acid 250 mg Capsule in Bio analysis by liquid ...
Haemolysis effect of Mefenamic Acid 250 mg Capsule in Bio analysis by liquid ...
 
Kyle Planck Report 2016
Kyle Planck Report 2016Kyle Planck Report 2016
Kyle Planck Report 2016
 
Art%3 a10.1007%2fs12161 013-9618-4
Art%3 a10.1007%2fs12161 013-9618-4Art%3 a10.1007%2fs12161 013-9618-4
Art%3 a10.1007%2fs12161 013-9618-4
 
Conceição et al, 2009. characterization of a new bioactive peptide from potam...
Conceição et al, 2009. characterization of a new bioactive peptide from potam...Conceição et al, 2009. characterization of a new bioactive peptide from potam...
Conceição et al, 2009. characterization of a new bioactive peptide from potam...
 
10.1021@ac3033245
10.1021@ac303324510.1021@ac3033245
10.1021@ac3033245
 
Physicochemical and Bacteriological Analysis of Drinking Water Samples from U...
Physicochemical and Bacteriological Analysis of Drinking Water Samples from U...Physicochemical and Bacteriological Analysis of Drinking Water Samples from U...
Physicochemical and Bacteriological Analysis of Drinking Water Samples from U...
 
Blood amps poster_090210
Blood amps poster_090210Blood amps poster_090210
Blood amps poster_090210
 
Analysis Of Atrazine Using DLLME and HS-LPME
Analysis Of Atrazine Using DLLME and HS-LPMEAnalysis Of Atrazine Using DLLME and HS-LPME
Analysis Of Atrazine Using DLLME and HS-LPME
 
Hw9 solutions 16-1
Hw9 solutions 16-1Hw9 solutions 16-1
Hw9 solutions 16-1
 
NanoSAFE Poster
NanoSAFE PosterNanoSAFE Poster
NanoSAFE Poster
 
SGSLSS-EL_Poster-PT-1-2016
SGSLSS-EL_Poster-PT-1-2016SGSLSS-EL_Poster-PT-1-2016
SGSLSS-EL_Poster-PT-1-2016
 
Carotenoid
CarotenoidCarotenoid
Carotenoid
 
journal published article
journal published articlejournal published article
journal published article
 
Organic Chemistry Lab Report Example
Organic Chemistry Lab Report ExampleOrganic Chemistry Lab Report Example
Organic Chemistry Lab Report Example
 
Coacervates Experiment
Coacervates ExperimentCoacervates Experiment
Coacervates Experiment
 
Total phenolics and total flavonoids of extracts from freshwater Clam (Corbic...
Total phenolics and total flavonoids of extracts from freshwater Clam (Corbic...Total phenolics and total flavonoids of extracts from freshwater Clam (Corbic...
Total phenolics and total flavonoids of extracts from freshwater Clam (Corbic...
 

WV-AS poster 2016

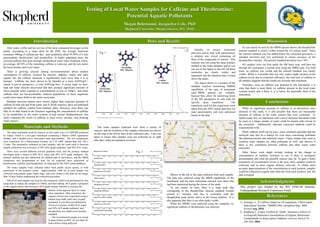
  • 1. Data and Results References The main instrument used for analysis in this study was a LC/MS/MS produced by waters, which is a two-part instrument containing a Waters e2695 separations module, and a Quattro micro micromass mass spectrometer. The two components were connected by a Phenomenex Kinetex 5µ C18 100Å column that was 150 x 2.1mm. The instrument contained an auto sampler, and the wash used in between sample collections was a mixture of 50% ASC grade methanol and 50% R.O. water. There were several different solvent gradients tried, and the primary method developed used a eluent of 80% R.O. water and 20% ACS grade methanol. The primary method was also optimized for caffeine and its derivatives, and the MRM component was programmed to look for all expected mass transitions of theobromine, caffeine, and theophylline, as indicated by the NIST online database. The water samples were collected either from public access points, or with permission of the property owner. Approximately 1000 ml of each sample was collected using plastic quart Ziploc bags, and were stored in the dark for no longer than 10 days before undergoing the extraction procedure. 500 ml of each sample was used for the extraction, which was performed by first using heat to reduce the samples to 100ml, and then adding ACS grade 2-propanol as the organic phase, and mixing in ACS grade sodium chloride to increase the Materials and Methods Discussion Conclusions Introduction After water, coffee and tea are two of the most consumed beverages on the planet. According to a study done by the FDA, the average American consumes 300mg of caffeine per day1, and metabolize about 95-98% of it into paraxanthine, theobromine, and theophylline. In highly populated areas, the excreted caffeine then goes through standardized waste water treatment where, on average, 60-70% of the remaining caffeine is removed, and the rest enters the local streams and rivers intact. There is growing concern among environmentalists about modern consumption of caffeine, because for muscles, tadpoles, snails, and other aquatic life, the caffeine molecule is significantly more toxic than it is to humans. Caffeine has been shown to be harmful at a mere 0.097mg/L2, which, to put in perspective, is only 0.045mg/16oz. A recent study on inter- tidal salt water muscles discovered that they produce significant amounts of stress proteins when exposed to concentrations as low as 50ng/L, and while caffeine does not bio-accumulate, reduced populations of these organisms could cause major shifts in the entire ecosystem. Multiple previous studies have shown higher than expected amounts of caffeine in both salt and fresh water, and in North America, there are published numbers for caffeine content from multiple states. However, since there was little to no data found in the literature regarding the concentration of caffeine or its metabolites in the water systems in and around Shepherdstown, this study examined the levels of caffeine in local rivers, streams, and drinking water sources. Acknowledgments This project was funded by the WV EPSCoR Summer Undergraduate Research Experience Grant Testing of Local Water Samples for Caffeine and Theobromine: Potential Aquatic Pollutants Megan Behrmann; Jacquelyn Cole, PhD Shepherd University; Shepherdstown, WV 25443 1) Somogyi, L. P. Caffeine Intake by US population. USDA report, Subcontract Number: 70000073494. completed Sept. 2009, revised Aug. 2010. 2) Stephanie L. Fraker, Feoffrey R. Smith. Interactive Effects of Ecologically Relevant Concentrations of Organic Wastewater Contaminants on Rana pipiens Tadpoles. Environ Toxicol 19: 250–256, 2004. While no significant amounts of caffeine or its derivatives were detected in this study, it is still possible that there are measurable amounts of caffeine in the water sources that were examined. To further study this, an instrument with a lower detection threshold could be used, or a larger sample of water could be treated with solvent in the extraction. Additionally, alternate extraction methods could be experimented with. While caffeine itself can be toxic, some scientists speculate that the molecule may also be a marker for even more concerning pollutants like pharmaceuticals and industrial waste. Future studies may want to examine water samples for other pollutants as well, and observe if there is any correlation between caffeine and other waste water molecules. Other future work might include looking at the change in concentration of caffeine overtime, to see if there is ecological accumulation and what the possible sources may be. To gain a better estimation of concentration levels in the area, more samples could be collected, and at more regular distance intervals. To obtain more accurate approximations of the concentration at each location, samples could be collected at regular time intervals from each location, and the data averaged. As can clearly be seen by the MRM spectra shown, the theophylline internal standard is clearly visible around the 4.8 minute mark. Since the internal standard was not added before the extraction procedure, a standard deviation test was performed to ensure accuracy of the theophylline volumes. The percent standard deviation was 7.0%. All samples were run first under the MS basic scan, and then run through the instrument a second time using the MRM scan. For both trials, no caffeine was visible and the internal standard was clearly visible. While it is possible that one may expect slight variance in the caffeine levels due to extraction efficiency, the total lack of caffeine in all samples suggests that the results are accurate and consistent. Therefore, since no caffeine was detected by the instrument, it is clear that there is most likely no caffeine present in the local water systems tested, and if there is, it is below the detectable limit of the instrument. Fig. 1 Initially, to ensure instrument precision and to help with optimization, a solution was mixed containing all three of the compounds of interest. This solution was run using the same primary method as the water samples, and as you can see in the figure to the left, all three molecules are clearly visible and separated, and the retention time is listed above the peaks. The figure shown is a product of the multiple reaction monitoring (MRM) capabilities of the type of instrument used. MRM spectra are valuable, because they allow for narrowing down of the MS parameters to only look for specific mass transitions. The transitions used for this experiment were taken from the NIST online data base for mass spectrometry, and were optimized based on the data. The water samples collected were from a variety of sources, and the locations of the sample collections are shown on the map to the left by stars at the collection sites. Care was taken to ensure that samples were not collected on or right after days when precipitation occurred. density of the aqueous layer to create clear separation. After extraction, the organic solvent was evaporated using a heated water bath, until only crystals remained. It was then reconstituted in 10 ml of a mixture of 80% R.O. water and 20% ACS grade methanol, and theophylline was added as an internal standard. The reconstituted sample was stored in glass bottles at 40*C for less than 24 hours before being analyzed. Molecule images courtesy of Discovery Studio Visualizer Shown to the left is the data collected from each sample. The data was collected using the MRM capabilities of the instrument, and the mass transitions selected were those that had been optimized during the course of the study. As can clearly be seen, there is a large peak that corresponds to the theophylline internal standard located around 4.7 minutes, and this is consistent with the theophylline peak shown above in the mixed solution. It is also apparent that there is no other peaks visible. When the MRMs were analyzed using the computer, no significant caffeine or theobromine was detected. Fig. 2 Fig. 3