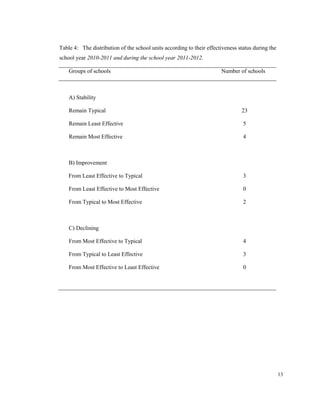
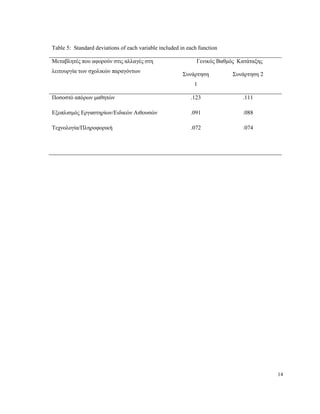
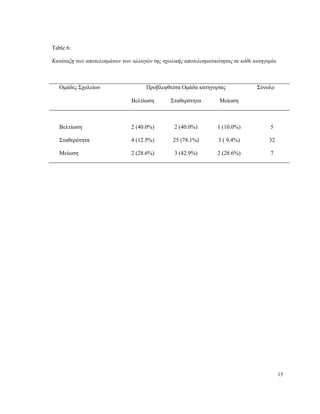
1
The link between educational expenditures and student learning outcomes:
Evidence from Cyprus
Eliophotou-Menon, Maria, Stylianou, Andreas, Kyriakides, Leonidas
Abstract
The paper attempts to investigate the relationship between educational expenditures and student
learning outcomes in Cyprus, a Southern European country severely hit by the financial crisis.
Specifically, our research investigates the extent to which changes in the effectiveness status of
schools can be related to changes in educational investment. The population of the study
consisted of approximately 9500 public secondary school graduates who had taken the
Pancyprian Examinations (admissions examinations for Cypriot and Greek Universities). The
study used the results of the examinations for a five-year period (2008 to 2012) in order to
determine whether there is any causal relationship between educational expenditure and student
learning outcomes. The impact of additional variables (student gender, class size etc.) on
student achievement was also investigated. The methodology of this study was based on
quantitative methods, namely, Multilevel Analysis and Discriminant Function Analysis (DFA).
Based on the findings, educational investment had a positive effect on the effectiveness status of
a school if invested in least effective schools and not in other types of schools (Typical or Most
Effective). Investment in specific types of equipment was found to have a significant effect on
student learning outcomes. While gender appeared to have a significant effect on learning
outcomes, this was not the case with class size. The implications of our findings are drawn and
suggestions for further research are presented. We expect that the results of our study will
inform the literature on the link between educational investment and student outcomes and
provide the basis for strategies that can be used to improve school effectiveness. Specifically,
the findings of this study are important for educational policy makers since they provide useful
information and recommendations relevant to educational expenditure policy.
Keywords: Educational Finance; Educational Outcomes; Educational effectiveness
Introduction
The economic crisis brought the narrowness of financial resources and inevitably affected
education expenditure. The probability of impending reductions of such expenditures appears to
be the focus of interest for many parties, such as scientific researchers, community groups,
parents, students, teachers, employers, political parties, the church and others.
2
Due to the different views expressed by the above parties for the appropriate level of costs of
education and because of the pluralism of these different positions and arguments expressed, a
great concern is created for the formation of an education policy. Consequently, the surrounding
atmosphere may, very often, affect crucial decisions made in relation to the funding of
education in Cyprus.
Based on Cyprus data, in recent years the total expenditure on education as a percentage of the
Gross National Product (GNP), were quite large, placing Cyprus at the most senior positions in
comparison with the average of European Union countries (EU). According to the European
Statistical Office (Eurostat, 2014), during the year 2010 the proportion of total expenditure in
Cyprus to its GDP amounted to 7.92%, whereas for the EU countries the average rate was
5.44%, yet, without proving that, education provided in Cyprus is qualitatively better than in
other countries, whose total expenditure on education corresponds to a lesser rate in their GDP.
Therefore, an urgent question arises as to whether or not the amount of money provided for
expenditure on education have the desired results and reflect any degree of impact on students’
performance.
Background
Each State seeks prosperity, progress, development and improvement of the quality of life of its
citizens. These efforts also include the provision of educational facilities by the state with a
decisive role in the education system and educational institutions in general, to ensure
effectiveness in the education provided. Achieving the goal of quality education through
effective schools is a major goal of modern societies which justifies the increased interest
around the research in question.
The concept of effectiveness is linked, but often contrasted with the sense of effectiveness. The
use of these terms belongs in the field of Economics and relates to a production process. The
efficiency of such process usually refers to the transformation of inputs into outputs in the best
possible way, to the maximum possible amount, using the lowest in number possible inputs
quantities and with the least cost (Antony & Herzlinger, 1989). Effectiveness means the ability
of someone to produce an expected result, while efficiency is the ability to produce a
satisfactory task to make a profit. (Levine & Lezotte, 1990).
To calculate the magnitude of the effects of schools in relation to their effectiveness, the
research covered factors originally referring to the school level and subsequently to the class
level and the effects those factors had on student performance (Creemers, 1994˙ Scheerens &
Bosker, 1997). In a later stage, using multilevel modeling techniques in investigations of the
3
Educational Effectiveness, the research emerged that in many countries the most important level
is that of the class in relation to the school level and the education system in general (e.g.
Kyriakides, Campell & Gagatsis, 2000˙ Yair, 1997).
With the recent development of dynamic models of educational effectiveness of Creemers &
Kyriakides (2006), which belong to the multilevel models, nonlinear relationships between
effectiveness factors and student performance are sought. Therefore, the possibility of
examining relationships in effectiveness factors at the same level is provided.
Our research, attempted a connection with the Human Capital Theory , because it highlights the
importance of changes in the variables of input, not only as material resources, but also as
human capital. The concept of human capital includes all natural and acquired abilities of an
individual, talent, skills, knowledge and competencies. Apart from the natural abilities, all other
skills can be acquired through activities such as education, apprenticeship, training, etc., and
even physical abilities have a prospect of improvement in this way (Becker, 2009˙
Psacharopoulos, 1999). According to this position and as noted by Mark Blaug (1972), people
invest in themselves through education, in order to enjoy monetary or non-monetary benefits in
the future. A second opinion on the Human Capital Theory, is that through education and
training individuals acquire abilities and skills, a kind of added human capital, that render such
individuals more productive in their workplace. Therefore, our research, examines if under the
Human Capital Theory, inflows as a variable of a multilevel model of effectiveness are
associated with learning outcomes.
Methodology: Research design and data collection
In regards to the methodology for conducting our research, quantitative research methods were
used. Specifically, data analysis was performed using the statistical program SPSS and MlwiN
for multilevel data analysis. The use of multilevel analysis aimed to identifying the effects of
exercising on the effectiveness variable inputs used, taking into account two levels, the student
and the school. The variables of our research are presented both in detail and based on the
school and student level and can be found below:
At the student level: gender
At the school level:
(a) The percentage of girls
(b) The number of poor students
(c) The province of each school
(d) The educational expenditures have been grouped into the following five categories and
relate to:
4
(i) Improvements / Extensions / Maintenance / Construction of buildings /
Classrooms
(ii) Workshops Equipment / Special Exhibits
(iii) Heating / air conditioning
(iv) Technology / Computers
(v) Grants provided by School Boards (Consumables)
The research questions that required an answer were the following:
(a) Do the changes, presented in public expenditures on education, either in kind or in total,
require changes in the effectiveness of schools?
(b) Does the class size (number of students) affect their performance in the pancyprian
examinations?
(c) Does the geographical area in which the school units falls and were students attend;
affect their performance in the pancyprian examinations?
(d) Does the gender of students affect their performance?
(e) Can changes of directors of schools affect student performance?
(f) Which type of Student grants appears to affect more students’ performances?
Two methods were used to investigate possible causal relations between changes of input and
changes in learning outcomes. The first method is based on the simple correlation between
investment and learning outcomes, a method previously used by other researchers in the field of
educational economy. The second method, not yet used in similar studies up until to date, is the
method of Discriminant Function Analysis which tested whether changes in educational inputs
are able to interpret changes in the effectiveness of school units.
Secondary sources and population research
The research data used constitute secondary data analysis as it was formulated, by the
Examinations Office, the Directorate General Education Medium, the Accounts of the Ministry
of Education and Culture and the Statistical Service of Cyprus. The total number of training
units and the population of our research includes 42 high schools from 2008 to 2010 and 44
high schools from 2011 until 2012 (two new high schools).
Two methods were used to investigate possible causal relations between changes of input and
changes in learning outcomes. The first method (first phase) is already used by other researchers
in the field of educational economy. However the second method (second phase), which is the
specific distinction in our investigation in relation with others that have been made so far, is the
method of discriminant analysis, which tested whether changes in educational inputs are
5
possible to interpret changes in the effectiveness of schools. Multilevel analysis models will be
used in both stages. These phases are analyzed below.
Phase A: Investigation of the potential impact of each school inputs on learning outcomes
for each individual year from 2008 to 2012 (Grade Classification in the Pancyprian
Examinations)
This research aims to investigate the possible existence of cause and effect relationships
between inputs and outputs of a school unit. Specifically, it is examined whether the possible
changes to the educational expenditures can bring the proportional effect on students' learning
outcomes.
In this phase, an attempt was made to identify the factors each year from 2008 to 2012 and
explore how such factors may affect learning outcomes in two different levels, the student’s and
the school’s level. Then we proceeded to analyze student data for each year separately and
investigated if student’s performance can influenced by the attending school attending and from
the investments made in this school.
Phase B: Investigate whether the changes observed in the effectiveness of schools from
year to year can be explained by changes in their inputs
Phase B was based on Phase A and based on the results of model 1, the following categories for
schools were registered:
i. Typical
ii. Least Effective
iii. Most Effective
Typical schools are defined as the schools which intersect zero under the terms of the
investigation, as explained below. The Least Effective schools identified below zero and Most
Effective are above zero. In particular, to better explain the procedure followed, it should be
noted that each school has its own residual, accompanied by a standard error. This value
generally ranges from -3 to +3. Suppose for example that the first school 1 has unexplained
remainder -0.3 and standard error is 0.2, then the school’s range is from -0.1 to +0.5, so its
range includes zero. Therefore, such school is considered to be a Typical school. Subsequently,
removing 0.2 which is the worst case scenario, we have -0.5 and the best scenario is -0.1.
Therefore, in this case the value zero is not included and so we believe that the school belongs
to the Least Effective list of schools.
The above two elements, the residual and standard error, allow us to see which schools are
statistically significant in terms of their effectiveness and are above zero, which schools are
6
below zero or which schools contain zero. In this way, it is possible to classify the schools in the
three above-mentioned categories. Yet, due to the fact that, the classification is performed
separately for each year, is possible to conclude whether there are schools that changed their
effectiveness level from one year to another. Thus, when we compared two years, e.g. 2008 to
2009, it became feasible to rank schools, to those that showed improvement, those who
remained the same (constant) and those with the worst image (decreased). The same tactic was
followed for classification of schools under the above categories, expanding the range to three
years, from 2008 to 2010 or from 2009 until 2011, or even in four years, etc.
Summary of the main findings of the investigation that resulted in the first method
(conducting separate analyzes for each year and related to the possible influence of inputs
to the learning outcomes).
From Tables 1, 2 and 3 shown below we see that the variables appear to have a statistically
significant effect on learning outcomes (p<0.5) relate to gender, the improvements / expansions,
Workshops equipment / special rooms and costs for Technology and Computers. The variables
that appear not to have any influence learning outcomes relate to the age of the students, the
class size and the school’s principals. Finally, the variables related to the province, heating / air
conditioning and consumables show a small statistically vital influence in some years but not in
all.
Summary of the main findings from the second the second method (conducting separate
analyzes for each year concerning whether the changes observed in the effectiveness of
schools from year to year can be explained by changes in their expenditures).
Table 4 shows the distribution of schools according to their effectiveness (Overall ranking
grade) during 2010-2011 and 2011-2012. Based on the data, it can be seen from the column
groups of schools that 32 out of 44 schools remained constant (rate 72.73%). Also, it was
observed that in 5 out of 44 schools, the level of effectiveness had been improved (percentage
11.36%), while 3 schools were Least Effective in 2010-2011 and enlisted in the list of Typical
schools in 2011-2012. In addition, 2 schools which were listed as Typical schools in 2010-2011,
were listed as Most Effective schools in 2011-2012. It should be noted that no such change had
been observed in any school, which in 2010-2011 was among the Least Effective schools, to be
classified between 2011-2012 as Most Effective school. Thus there is no rapid change in the
movements of the schools observed. Thereafter, in 7 of the 44 schools the level of effectiveness
was decreased, i.e. 4 schools were among the Most Effective schools in 2010-2011 and in 2011-
2012 the same schools became Typical schools, while 3 schools already classified as Typical
schools in 2010-2011 they had been classified as Least Effective schools in 2011-2012.
7
In Table 5, wherein the formal estimates are shown for each variable included in each function,
the following procedure was followed for our analyzes. Based on the three categories, in which
we had previously classified the schools, we took the first case, i.e. we compared all schools
that showed improvement in their effectiveness level in relation to all other schools, either
retained their constant level or decreased their constant level. In other case we compared all
schools that decrease their level in relation to all other schools. Then, we examined which
variables can explain the changes of schools in their effectiveness level. Column 1 presents the
variables related to changes in connection with the operation of school factors. These factors are
taken into account in function 1, which can distinguish which schools improved their
effectiveness level during the two years from 2010-2011 to 2011-2012. Function 2 helps us to
identify the schools, which their effectiveness level of the biennium 2010-2011 to 2011-2012
may had decreased.
In Table 6, wherein the ranking of change of school effectiveness in each category is shown,
using both functions of Table 5, a person can classify schools into those that had improved their
level of effectiveness, into those schools that their level remained stable and into those schools
that decreased their level (see. first column). This provision may be compared with what
actually happened, following the course of the fifth column, where the distribution of schools is
based on the actual image.
Thus, one can see from Table 6 that 29 out of 44 schools, the prediction was correct.
Specifically, the prediction about two schools to improve their effectiveness level became a
reality and actually improved. Furthermore, the prediction for 25 schools to remain stable in
relation to their effectiveness was also correct. In addition, the prediction for two schools in
relation to the reduction of their level of effectiveness was also accurate.
Suggestions for developing educational policy
Following the discussion of the results of this research and based on the interpretations given,
the following recommendations are addressed to the responsible parties for the formation of an
educational policy and practice in secondary schools in Cyprus:
Any necessary reductions in educational expenditure should not be made proportionally to all
school units, as this can affect schools already listed in the category of the Least Effective
schools, depriving their ability to improve their level of effectiveness.
Also, another suggestion is that the educational expenditures should not be allocated based on
the number of students in a school, a common practice nowadays, but instead, such allocation
should be based on the real needs of a school.
8
References
Greek
Παπαναστασίου, Κ., & Παπαναστασίου, Ε. (2005). Μεθοδολογία εκπαιδευτικής έρευνας.
Λευκωσία: Έκδοση συγγραφέων.
Στατιστική Υπηρεσία Κύπρου (2012). Στατιστικές της εκπαίδευσης 2009/2010. Λευκωσία:
Έκδοση Κυβερνητικού Τυπογραφείου.
English
Antony, A. R., & Herzlinger, R. E. (1989). Management control nonprofit organizations. In
Levacic (Ed.), Financial management in education. Milton Keynes: The Open University Press.
Becker, G. S. (2009). Human capital: A theoretical and empirical analysis, with special
reference to education. University of Chicago Press.
Blaug, M. (1972). The correlation between education and earnings: What does it signify?
Higher Education, 1(1), 53–76.
Creemers, B. P. M. (1994). The effective classroom. London: Cassell.
Creemers, B. P. M., & Kyriakides, L. (2006). A critical analysis of the current approaches to
modelling educational effectiveness: The importance of establishing a dynamic model. School
Effectiveness and School Improvement, 17(3), 347-366.
Creemers, B. P. M., & Kyriakides, L. (2010). School factors explaining achievement on
cognitive and affective outcomes: Establishing a dynamic model of educational effectiveness.
Scandinavian Journal of Educational Research, 54(3), 263-294.
Eurostat (2014). Expenditure on education as % of GDP or public expenditure. Retrieved from
http://appsso.eurostat.ec.europa.eu/nui/show.do?dataset=educ_figdp&lang=en
Hanushek, E. A. (1986). The economics of schooling: Production and efficiency in public
schools. Journal of Economic Literature, 24(3), 1141-1177.
Holland, P. W. (1986). Statistics and causal inference. Journal of the American Statistics
Association, 81(396), 945–960.
9
Kyriakides, L., Campbell, R. J., & Gagatsis, A. (2000). The significance of the classroom effect
in primary schools: An application of Creemers comprehensive model of educational
effectiveness. School Effectiveness and School Improvement, 11(4), 501-529.
Kyriakides, L., & Creemers, B. P. M. (2008b). A longitudinal study on the stability over time of
school and teacher effects. Oxford Review of Education, 34(5), 521-545.
Levine, D. U., & Lezotte, L. W. (1990). Unusually effective schools: A review and analysis of
research and practice. Madison, WI: National Center for Effective Schools Research and
Development.
Oliver, P. (2010). Student’s guide to research ethics (2nd
ed.). Maidenhead, GBR: Open
University Press.
Psacharopoulos, G. (1999). The opportunity cost of child labor: A review of the benefits of
education. University of Athens (mimeo).
Robson, C. (2002). Real world research. A resource for social scientists and practitioner
researchers (2nd
ed.). Oxford: Blackwell.
Sammons, P., Thomas, S., & Mortimore, P. (1997). Forging links: Effective schools and
effective departments. London: Paul Chapman.
Scheerens, J., & Bosker, R. J. (1997). The foundations of educational effectiveness. Oxford,
UK: Pergamon.
Shadish, W. R., Cook, T. D., & Campbell, D. T. (2002). Experimental and quasi-experimental
designs for generalized causal inference. Boston, MA: Houghton Mifflin Company.
Yair, G. (1997). When classrooms matter: Implications of between–classroom variability for
educational policy in Israel. Assessment in Education, 4(2), 225-248.
10
Table 1: Parameter estimates for each variable on students’ achievement in the Pancyprian Examinations and standard errors of each estimation,
which appears in the parenthesis.
Year 2008 2009
Factors Model 0 Model 1 Model 2 Model 0 Model 1 Model 2
Fixed part/intercept 7.10(.30) 4.06(.25) 3.12(.20) 8.00(.30) 7.00(.20) 5.21(.20)
Student Level
Context
Sex (boys=0, girls=1) .20(.05) .20(.04) .12 (.04) .13 (.04)
School Level
Context
Percentage of girls .11(.03) .12(.04) .08(.03) .08 (.03)
District of Limassol N.S.S. N.S.S. -.06(.02) -.06(.02)
District of Larnaca -.08(.04) -.08 (.04) N.S.S. N.S.S.
District of Paphos N.S.S. N.S.S. .07(.03) .07(.03)
District of Famagusta .06 (.03) .07 (.03) Μ.Σ.Σ. Μ.Σ.Σ.
Expenditures
Improvements/extensions/maintenance/construction of classrooms N.S.S. .10 (.05)
workshops’ equipment/special exhibits .10 (.04) N.S.S.
Heating/air-conditioning N.S.S. N.S.S.
I.T./computers .11(.03) N.S.S.
Grants provided by school Boards (consumables) N.S.S. N.S.S.
Variance
School 15 12 9 18 16 13
Student 85 71 69 82 70 69
Explained 17 22 14 18
Significance test
X2
712,35 601,21 550,01 810,81 700,01 660,01
Reduction of X2
111,14 51,20 110,80 40,00
Degrees of freedom 4 2 4 1
p-value .001 .001 .001 .001
N.S.S = No statistically significant effect at the .05 level.
11
Table 2: Parameter estimates for each variable on students’ achievement in the Pancyprian Examinations and standard errors of each estimation,
which appears in the parenthesis.
Year 2010 2011
Factors Model 0 Model 1 Model 2 Model 0 Model 1 Model 2
Fixed part/intercept 5.10(.30) 3.26(.25) 2.72(.25) 8.20(.38) 7.40(.32) 5.14(.30)
Student Level
Context
Sex (boys=0, girls=1) .11(.05) .10(.04) .12 (.04) .13 (.04)
School Level
Context
Percentage of girls N.S.S. N.S.S. N.S.S. N.S.S.
District of Limassol N.S.S. N.S.S. N.S.S. N.S.S.
District of Larnaca -.08(.04) -.07 (.03) N.S.S. N.S.S.
District of Paphos -.07 (.03) -.07 (.03) .10(.04) .10(.03)
District of Famagusta N.S.S. N.S.S. -.09(.04) -.09(.04)
Expenditures
Improvements/extensions/maintenance/construction of classrooms .11(.03) N.S.S.
workshops’ equipment/special exhibits N.S.S. .14 (.05)
Heating/air-conditioning N.S.S. N.S.S.
I.T./computers N.S.S. N.S.S.
Grants provided by school Boards (consumables) N.S.S. N.S.S.
Variance
School 19 16 14 17 16 14
Student 81 74 72 83 72 71
Explained 10 14 12 15
Significance test
X2
732,35 611,21 580,11 460,81 370,51 330,11
Reduction of X2
121,14 31,1 0 90,30 40,40
Degrees of freedom 3 1 3 1
p-value .001 .001 .001 .001
N.S.S = No statistically significant effect at the .05 level.
12
Table 3:
Table 2: Parameter estimates for each variable on students’ achievement in the Pancyprian
Examinations and standard errors of each estimation, which appears in the parenthesis.
Year 2012
Factors Model 0 Model 1 Model 2
Fixed part/intercept 5.10(.30) 3.26(.25) 2.72(.25)
Student Level
Context
Sex (boys=0, girls=1) .11(.05) .10(.04)
School Level
Context
Percentage of girls N.S.S. N.S.S.
District of Limassol N.S.S. N.S.S.
District of Larnaca -.08(.04) -.07 (.03)
District of Paphos -.07 (.03) -.07 (.03)
District of Famagusta N.S.S. N.S.S.
Expenditures
Improvements/extensions/maintenance/construction of classrooms .11(.03)
workshops’ equipment/special exhibits N.S.S.
Heating/air-conditioning N.S.S.
I.T./computers N.S.S.
Grants provided by school Boards (consumables) N.S.S.
Variance
School 19 16 14
Student 81 74 72
Explained 10 14
Significance test
X2
732,35 611,21 580,11
Reduction of X2
121,14 31,1 0
Degrees of freedom 3 1
p-value .001 .001
N.S.S = No statistically significant effect at the .05 level.
13
Table 4: The distribution of the school units according to their effectiveness status during the
school year 2010-2011 and during the school year 2011-2012.
Groups of schools Number of schools
Α) Stability
Remain Typical 23
Remain Least Effective 5
Remain Most Effective 4
Β) Improvement
From Least Effective to Typical 3
From Least Effective to Most Effective 0
From Typical to Most Effective 2
C) Declining
From Most Effective to Typical 4
From Typical to Least Effective 3
From Most Effective to Least Effective 0
14
Table 5: Standard deviations of each variable included in each function
Μεταβλητές που αφορούν στις αλλαγές στη
λειτουργία των σχολικών παραγόντων
Γενικός Βαθμός Κατάταξης
Συνάρτηση
1
Συνάρτηση 2
Ποσοστό απόρων μαθητών .123 .111
Εξοπλισμός Εργαστηρίων/Ειδικών Αιθουσών .091 .088
Τεχνολογία/Πληροφορική .072 .074
15
Table 6:
Κατάταξη των αποτελεσμάτων των αλλαγών της σχολικής αποτελεσματικότητας σε κάθε κατηγορία
Ομάδες Σχολείων Προβλεφθείσα Ομάδα κατηγορίας Σύνολο
Βελτίωση Σταθερότητα Μείωση
Βελτίωση 2 (40.0%) 2 (40.0%) 1 (10.0%) 5
Σταθερότητα 4 (12.5%) 25 (78.1%) 3 ( 9.4%) 32
Μείωση 2 (28.6%) 3 (42.9%) 2 (28.6%) 7

The link between educational expenditures and student learning outcomes

  • 1.
    1 The link betweeneducational expenditures and student learning outcomes: Evidence from Cyprus Eliophotou-Menon, Maria, Stylianou, Andreas, Kyriakides, Leonidas Abstract The paper attempts to investigate the relationship between educational expenditures and student learning outcomes in Cyprus, a Southern European country severely hit by the financial crisis. Specifically, our research investigates the extent to which changes in the effectiveness status of schools can be related to changes in educational investment. The population of the study consisted of approximately 9500 public secondary school graduates who had taken the Pancyprian Examinations (admissions examinations for Cypriot and Greek Universities). The study used the results of the examinations for a five-year period (2008 to 2012) in order to determine whether there is any causal relationship between educational expenditure and student learning outcomes. The impact of additional variables (student gender, class size etc.) on student achievement was also investigated. The methodology of this study was based on quantitative methods, namely, Multilevel Analysis and Discriminant Function Analysis (DFA). Based on the findings, educational investment had a positive effect on the effectiveness status of a school if invested in least effective schools and not in other types of schools (Typical or Most Effective). Investment in specific types of equipment was found to have a significant effect on student learning outcomes. While gender appeared to have a significant effect on learning outcomes, this was not the case with class size. The implications of our findings are drawn and suggestions for further research are presented. We expect that the results of our study will inform the literature on the link between educational investment and student outcomes and provide the basis for strategies that can be used to improve school effectiveness. Specifically, the findings of this study are important for educational policy makers since they provide useful information and recommendations relevant to educational expenditure policy. Keywords: Educational Finance; Educational Outcomes; Educational effectiveness Introduction The economic crisis brought the narrowness of financial resources and inevitably affected education expenditure. The probability of impending reductions of such expenditures appears to be the focus of interest for many parties, such as scientific researchers, community groups, parents, students, teachers, employers, political parties, the church and others.
  • 2.
    2 Due to thedifferent views expressed by the above parties for the appropriate level of costs of education and because of the pluralism of these different positions and arguments expressed, a great concern is created for the formation of an education policy. Consequently, the surrounding atmosphere may, very often, affect crucial decisions made in relation to the funding of education in Cyprus. Based on Cyprus data, in recent years the total expenditure on education as a percentage of the Gross National Product (GNP), were quite large, placing Cyprus at the most senior positions in comparison with the average of European Union countries (EU). According to the European Statistical Office (Eurostat, 2014), during the year 2010 the proportion of total expenditure in Cyprus to its GDP amounted to 7.92%, whereas for the EU countries the average rate was 5.44%, yet, without proving that, education provided in Cyprus is qualitatively better than in other countries, whose total expenditure on education corresponds to a lesser rate in their GDP. Therefore, an urgent question arises as to whether or not the amount of money provided for expenditure on education have the desired results and reflect any degree of impact on students’ performance. Background Each State seeks prosperity, progress, development and improvement of the quality of life of its citizens. These efforts also include the provision of educational facilities by the state with a decisive role in the education system and educational institutions in general, to ensure effectiveness in the education provided. Achieving the goal of quality education through effective schools is a major goal of modern societies which justifies the increased interest around the research in question. The concept of effectiveness is linked, but often contrasted with the sense of effectiveness. The use of these terms belongs in the field of Economics and relates to a production process. The efficiency of such process usually refers to the transformation of inputs into outputs in the best possible way, to the maximum possible amount, using the lowest in number possible inputs quantities and with the least cost (Antony & Herzlinger, 1989). Effectiveness means the ability of someone to produce an expected result, while efficiency is the ability to produce a satisfactory task to make a profit. (Levine & Lezotte, 1990). To calculate the magnitude of the effects of schools in relation to their effectiveness, the research covered factors originally referring to the school level and subsequently to the class level and the effects those factors had on student performance (Creemers, 1994˙ Scheerens & Bosker, 1997). In a later stage, using multilevel modeling techniques in investigations of the
  • 3.
    3 Educational Effectiveness, theresearch emerged that in many countries the most important level is that of the class in relation to the school level and the education system in general (e.g. Kyriakides, Campell & Gagatsis, 2000˙ Yair, 1997). With the recent development of dynamic models of educational effectiveness of Creemers & Kyriakides (2006), which belong to the multilevel models, nonlinear relationships between effectiveness factors and student performance are sought. Therefore, the possibility of examining relationships in effectiveness factors at the same level is provided. Our research, attempted a connection with the Human Capital Theory , because it highlights the importance of changes in the variables of input, not only as material resources, but also as human capital. The concept of human capital includes all natural and acquired abilities of an individual, talent, skills, knowledge and competencies. Apart from the natural abilities, all other skills can be acquired through activities such as education, apprenticeship, training, etc., and even physical abilities have a prospect of improvement in this way (Becker, 2009˙ Psacharopoulos, 1999). According to this position and as noted by Mark Blaug (1972), people invest in themselves through education, in order to enjoy monetary or non-monetary benefits in the future. A second opinion on the Human Capital Theory, is that through education and training individuals acquire abilities and skills, a kind of added human capital, that render such individuals more productive in their workplace. Therefore, our research, examines if under the Human Capital Theory, inflows as a variable of a multilevel model of effectiveness are associated with learning outcomes. Methodology: Research design and data collection In regards to the methodology for conducting our research, quantitative research methods were used. Specifically, data analysis was performed using the statistical program SPSS and MlwiN for multilevel data analysis. The use of multilevel analysis aimed to identifying the effects of exercising on the effectiveness variable inputs used, taking into account two levels, the student and the school. The variables of our research are presented both in detail and based on the school and student level and can be found below: At the student level: gender At the school level: (a) The percentage of girls (b) The number of poor students (c) The province of each school (d) The educational expenditures have been grouped into the following five categories and relate to:
  • 4.
    4 (i) Improvements /Extensions / Maintenance / Construction of buildings / Classrooms (ii) Workshops Equipment / Special Exhibits (iii) Heating / air conditioning (iv) Technology / Computers (v) Grants provided by School Boards (Consumables) The research questions that required an answer were the following: (a) Do the changes, presented in public expenditures on education, either in kind or in total, require changes in the effectiveness of schools? (b) Does the class size (number of students) affect their performance in the pancyprian examinations? (c) Does the geographical area in which the school units falls and were students attend; affect their performance in the pancyprian examinations? (d) Does the gender of students affect their performance? (e) Can changes of directors of schools affect student performance? (f) Which type of Student grants appears to affect more students’ performances? Two methods were used to investigate possible causal relations between changes of input and changes in learning outcomes. The first method is based on the simple correlation between investment and learning outcomes, a method previously used by other researchers in the field of educational economy. The second method, not yet used in similar studies up until to date, is the method of Discriminant Function Analysis which tested whether changes in educational inputs are able to interpret changes in the effectiveness of school units. Secondary sources and population research The research data used constitute secondary data analysis as it was formulated, by the Examinations Office, the Directorate General Education Medium, the Accounts of the Ministry of Education and Culture and the Statistical Service of Cyprus. The total number of training units and the population of our research includes 42 high schools from 2008 to 2010 and 44 high schools from 2011 until 2012 (two new high schools). Two methods were used to investigate possible causal relations between changes of input and changes in learning outcomes. The first method (first phase) is already used by other researchers in the field of educational economy. However the second method (second phase), which is the specific distinction in our investigation in relation with others that have been made so far, is the method of discriminant analysis, which tested whether changes in educational inputs are
  • 5.
    5 possible to interpretchanges in the effectiveness of schools. Multilevel analysis models will be used in both stages. These phases are analyzed below. Phase A: Investigation of the potential impact of each school inputs on learning outcomes for each individual year from 2008 to 2012 (Grade Classification in the Pancyprian Examinations) This research aims to investigate the possible existence of cause and effect relationships between inputs and outputs of a school unit. Specifically, it is examined whether the possible changes to the educational expenditures can bring the proportional effect on students' learning outcomes. In this phase, an attempt was made to identify the factors each year from 2008 to 2012 and explore how such factors may affect learning outcomes in two different levels, the student’s and the school’s level. Then we proceeded to analyze student data for each year separately and investigated if student’s performance can influenced by the attending school attending and from the investments made in this school. Phase B: Investigate whether the changes observed in the effectiveness of schools from year to year can be explained by changes in their inputs Phase B was based on Phase A and based on the results of model 1, the following categories for schools were registered: i. Typical ii. Least Effective iii. Most Effective Typical schools are defined as the schools which intersect zero under the terms of the investigation, as explained below. The Least Effective schools identified below zero and Most Effective are above zero. In particular, to better explain the procedure followed, it should be noted that each school has its own residual, accompanied by a standard error. This value generally ranges from -3 to +3. Suppose for example that the first school 1 has unexplained remainder -0.3 and standard error is 0.2, then the school’s range is from -0.1 to +0.5, so its range includes zero. Therefore, such school is considered to be a Typical school. Subsequently, removing 0.2 which is the worst case scenario, we have -0.5 and the best scenario is -0.1. Therefore, in this case the value zero is not included and so we believe that the school belongs to the Least Effective list of schools. The above two elements, the residual and standard error, allow us to see which schools are statistically significant in terms of their effectiveness and are above zero, which schools are
  • 6.
    6 below zero orwhich schools contain zero. In this way, it is possible to classify the schools in the three above-mentioned categories. Yet, due to the fact that, the classification is performed separately for each year, is possible to conclude whether there are schools that changed their effectiveness level from one year to another. Thus, when we compared two years, e.g. 2008 to 2009, it became feasible to rank schools, to those that showed improvement, those who remained the same (constant) and those with the worst image (decreased). The same tactic was followed for classification of schools under the above categories, expanding the range to three years, from 2008 to 2010 or from 2009 until 2011, or even in four years, etc. Summary of the main findings of the investigation that resulted in the first method (conducting separate analyzes for each year and related to the possible influence of inputs to the learning outcomes). From Tables 1, 2 and 3 shown below we see that the variables appear to have a statistically significant effect on learning outcomes (p<0.5) relate to gender, the improvements / expansions, Workshops equipment / special rooms and costs for Technology and Computers. The variables that appear not to have any influence learning outcomes relate to the age of the students, the class size and the school’s principals. Finally, the variables related to the province, heating / air conditioning and consumables show a small statistically vital influence in some years but not in all. Summary of the main findings from the second the second method (conducting separate analyzes for each year concerning whether the changes observed in the effectiveness of schools from year to year can be explained by changes in their expenditures). Table 4 shows the distribution of schools according to their effectiveness (Overall ranking grade) during 2010-2011 and 2011-2012. Based on the data, it can be seen from the column groups of schools that 32 out of 44 schools remained constant (rate 72.73%). Also, it was observed that in 5 out of 44 schools, the level of effectiveness had been improved (percentage 11.36%), while 3 schools were Least Effective in 2010-2011 and enlisted in the list of Typical schools in 2011-2012. In addition, 2 schools which were listed as Typical schools in 2010-2011, were listed as Most Effective schools in 2011-2012. It should be noted that no such change had been observed in any school, which in 2010-2011 was among the Least Effective schools, to be classified between 2011-2012 as Most Effective school. Thus there is no rapid change in the movements of the schools observed. Thereafter, in 7 of the 44 schools the level of effectiveness was decreased, i.e. 4 schools were among the Most Effective schools in 2010-2011 and in 2011- 2012 the same schools became Typical schools, while 3 schools already classified as Typical schools in 2010-2011 they had been classified as Least Effective schools in 2011-2012.
  • 7.
    7 In Table 5,wherein the formal estimates are shown for each variable included in each function, the following procedure was followed for our analyzes. Based on the three categories, in which we had previously classified the schools, we took the first case, i.e. we compared all schools that showed improvement in their effectiveness level in relation to all other schools, either retained their constant level or decreased their constant level. In other case we compared all schools that decrease their level in relation to all other schools. Then, we examined which variables can explain the changes of schools in their effectiveness level. Column 1 presents the variables related to changes in connection with the operation of school factors. These factors are taken into account in function 1, which can distinguish which schools improved their effectiveness level during the two years from 2010-2011 to 2011-2012. Function 2 helps us to identify the schools, which their effectiveness level of the biennium 2010-2011 to 2011-2012 may had decreased. In Table 6, wherein the ranking of change of school effectiveness in each category is shown, using both functions of Table 5, a person can classify schools into those that had improved their level of effectiveness, into those schools that their level remained stable and into those schools that decreased their level (see. first column). This provision may be compared with what actually happened, following the course of the fifth column, where the distribution of schools is based on the actual image. Thus, one can see from Table 6 that 29 out of 44 schools, the prediction was correct. Specifically, the prediction about two schools to improve their effectiveness level became a reality and actually improved. Furthermore, the prediction for 25 schools to remain stable in relation to their effectiveness was also correct. In addition, the prediction for two schools in relation to the reduction of their level of effectiveness was also accurate. Suggestions for developing educational policy Following the discussion of the results of this research and based on the interpretations given, the following recommendations are addressed to the responsible parties for the formation of an educational policy and practice in secondary schools in Cyprus: Any necessary reductions in educational expenditure should not be made proportionally to all school units, as this can affect schools already listed in the category of the Least Effective schools, depriving their ability to improve their level of effectiveness. Also, another suggestion is that the educational expenditures should not be allocated based on the number of students in a school, a common practice nowadays, but instead, such allocation should be based on the real needs of a school.
  • 8.
    8 References Greek Παπαναστασίου, Κ., &Παπαναστασίου, Ε. (2005). Μεθοδολογία εκπαιδευτικής έρευνας. Λευκωσία: Έκδοση συγγραφέων. Στατιστική Υπηρεσία Κύπρου (2012). Στατιστικές της εκπαίδευσης 2009/2010. Λευκωσία: Έκδοση Κυβερνητικού Τυπογραφείου. English Antony, A. R., & Herzlinger, R. E. (1989). Management control nonprofit organizations. In Levacic (Ed.), Financial management in education. Milton Keynes: The Open University Press. Becker, G. S. (2009). Human capital: A theoretical and empirical analysis, with special reference to education. University of Chicago Press. Blaug, M. (1972). The correlation between education and earnings: What does it signify? Higher Education, 1(1), 53–76. Creemers, B. P. M. (1994). The effective classroom. London: Cassell. Creemers, B. P. M., & Kyriakides, L. (2006). A critical analysis of the current approaches to modelling educational effectiveness: The importance of establishing a dynamic model. School Effectiveness and School Improvement, 17(3), 347-366. Creemers, B. P. M., & Kyriakides, L. (2010). School factors explaining achievement on cognitive and affective outcomes: Establishing a dynamic model of educational effectiveness. Scandinavian Journal of Educational Research, 54(3), 263-294. Eurostat (2014). Expenditure on education as % of GDP or public expenditure. Retrieved from http://appsso.eurostat.ec.europa.eu/nui/show.do?dataset=educ_figdp&lang=en Hanushek, E. A. (1986). The economics of schooling: Production and efficiency in public schools. Journal of Economic Literature, 24(3), 1141-1177. Holland, P. W. (1986). Statistics and causal inference. Journal of the American Statistics Association, 81(396), 945–960.
  • 9.
    9 Kyriakides, L., Campbell,R. J., & Gagatsis, A. (2000). The significance of the classroom effect in primary schools: An application of Creemers comprehensive model of educational effectiveness. School Effectiveness and School Improvement, 11(4), 501-529. Kyriakides, L., & Creemers, B. P. M. (2008b). A longitudinal study on the stability over time of school and teacher effects. Oxford Review of Education, 34(5), 521-545. Levine, D. U., & Lezotte, L. W. (1990). Unusually effective schools: A review and analysis of research and practice. Madison, WI: National Center for Effective Schools Research and Development. Oliver, P. (2010). Student’s guide to research ethics (2nd ed.). Maidenhead, GBR: Open University Press. Psacharopoulos, G. (1999). The opportunity cost of child labor: A review of the benefits of education. University of Athens (mimeo). Robson, C. (2002). Real world research. A resource for social scientists and practitioner researchers (2nd ed.). Oxford: Blackwell. Sammons, P., Thomas, S., & Mortimore, P. (1997). Forging links: Effective schools and effective departments. London: Paul Chapman. Scheerens, J., & Bosker, R. J. (1997). The foundations of educational effectiveness. Oxford, UK: Pergamon. Shadish, W. R., Cook, T. D., & Campbell, D. T. (2002). Experimental and quasi-experimental designs for generalized causal inference. Boston, MA: Houghton Mifflin Company. Yair, G. (1997). When classrooms matter: Implications of between–classroom variability for educational policy in Israel. Assessment in Education, 4(2), 225-248.
  • 10.
    10 Table 1: Parameterestimates for each variable on students’ achievement in the Pancyprian Examinations and standard errors of each estimation, which appears in the parenthesis. Year 2008 2009 Factors Model 0 Model 1 Model 2 Model 0 Model 1 Model 2 Fixed part/intercept 7.10(.30) 4.06(.25) 3.12(.20) 8.00(.30) 7.00(.20) 5.21(.20) Student Level Context Sex (boys=0, girls=1) .20(.05) .20(.04) .12 (.04) .13 (.04) School Level Context Percentage of girls .11(.03) .12(.04) .08(.03) .08 (.03) District of Limassol N.S.S. N.S.S. -.06(.02) -.06(.02) District of Larnaca -.08(.04) -.08 (.04) N.S.S. N.S.S. District of Paphos N.S.S. N.S.S. .07(.03) .07(.03) District of Famagusta .06 (.03) .07 (.03) Μ.Σ.Σ. Μ.Σ.Σ. Expenditures Improvements/extensions/maintenance/construction of classrooms N.S.S. .10 (.05) workshops’ equipment/special exhibits .10 (.04) N.S.S. Heating/air-conditioning N.S.S. N.S.S. I.T./computers .11(.03) N.S.S. Grants provided by school Boards (consumables) N.S.S. N.S.S. Variance School 15 12 9 18 16 13 Student 85 71 69 82 70 69 Explained 17 22 14 18 Significance test X2 712,35 601,21 550,01 810,81 700,01 660,01 Reduction of X2 111,14 51,20 110,80 40,00 Degrees of freedom 4 2 4 1 p-value .001 .001 .001 .001 N.S.S = No statistically significant effect at the .05 level.
  • 11.
    11 Table 2: Parameterestimates for each variable on students’ achievement in the Pancyprian Examinations and standard errors of each estimation, which appears in the parenthesis. Year 2010 2011 Factors Model 0 Model 1 Model 2 Model 0 Model 1 Model 2 Fixed part/intercept 5.10(.30) 3.26(.25) 2.72(.25) 8.20(.38) 7.40(.32) 5.14(.30) Student Level Context Sex (boys=0, girls=1) .11(.05) .10(.04) .12 (.04) .13 (.04) School Level Context Percentage of girls N.S.S. N.S.S. N.S.S. N.S.S. District of Limassol N.S.S. N.S.S. N.S.S. N.S.S. District of Larnaca -.08(.04) -.07 (.03) N.S.S. N.S.S. District of Paphos -.07 (.03) -.07 (.03) .10(.04) .10(.03) District of Famagusta N.S.S. N.S.S. -.09(.04) -.09(.04) Expenditures Improvements/extensions/maintenance/construction of classrooms .11(.03) N.S.S. workshops’ equipment/special exhibits N.S.S. .14 (.05) Heating/air-conditioning N.S.S. N.S.S. I.T./computers N.S.S. N.S.S. Grants provided by school Boards (consumables) N.S.S. N.S.S. Variance School 19 16 14 17 16 14 Student 81 74 72 83 72 71 Explained 10 14 12 15 Significance test X2 732,35 611,21 580,11 460,81 370,51 330,11 Reduction of X2 121,14 31,1 0 90,30 40,40 Degrees of freedom 3 1 3 1 p-value .001 .001 .001 .001 N.S.S = No statistically significant effect at the .05 level.
  • 12.
    12 Table 3: Table 2:Parameter estimates for each variable on students’ achievement in the Pancyprian Examinations and standard errors of each estimation, which appears in the parenthesis. Year 2012 Factors Model 0 Model 1 Model 2 Fixed part/intercept 5.10(.30) 3.26(.25) 2.72(.25) Student Level Context Sex (boys=0, girls=1) .11(.05) .10(.04) School Level Context Percentage of girls N.S.S. N.S.S. District of Limassol N.S.S. N.S.S. District of Larnaca -.08(.04) -.07 (.03) District of Paphos -.07 (.03) -.07 (.03) District of Famagusta N.S.S. N.S.S. Expenditures Improvements/extensions/maintenance/construction of classrooms .11(.03) workshops’ equipment/special exhibits N.S.S. Heating/air-conditioning N.S.S. I.T./computers N.S.S. Grants provided by school Boards (consumables) N.S.S. Variance School 19 16 14 Student 81 74 72 Explained 10 14 Significance test X2 732,35 611,21 580,11 Reduction of X2 121,14 31,1 0 Degrees of freedom 3 1 p-value .001 .001 N.S.S = No statistically significant effect at the .05 level.
  • 13.
    13 Table 4: Thedistribution of the school units according to their effectiveness status during the school year 2010-2011 and during the school year 2011-2012. Groups of schools Number of schools Α) Stability Remain Typical 23 Remain Least Effective 5 Remain Most Effective 4 Β) Improvement From Least Effective to Typical 3 From Least Effective to Most Effective 0 From Typical to Most Effective 2 C) Declining From Most Effective to Typical 4 From Typical to Least Effective 3 From Most Effective to Least Effective 0
  • 14.
    14 Table 5: Standarddeviations of each variable included in each function Μεταβλητές που αφορούν στις αλλαγές στη λειτουργία των σχολικών παραγόντων Γενικός Βαθμός Κατάταξης Συνάρτηση 1 Συνάρτηση 2 Ποσοστό απόρων μαθητών .123 .111 Εξοπλισμός Εργαστηρίων/Ειδικών Αιθουσών .091 .088 Τεχνολογία/Πληροφορική .072 .074
  • 15.
    15 Table 6: Κατάταξη τωναποτελεσμάτων των αλλαγών της σχολικής αποτελεσματικότητας σε κάθε κατηγορία Ομάδες Σχολείων Προβλεφθείσα Ομάδα κατηγορίας Σύνολο Βελτίωση Σταθερότητα Μείωση Βελτίωση 2 (40.0%) 2 (40.0%) 1 (10.0%) 5 Σταθερότητα 4 (12.5%) 25 (78.1%) 3 ( 9.4%) 32 Μείωση 2 (28.6%) 3 (42.9%) 2 (28.6%) 7