
Downloaded 182 times


![Macroeconomic policies and poverty reduction 85
conditionalities in the IMF rescue packages as the World Bank pursued struc-
tural adjustment (trade liberalization, financial deregulation and privatization)
through loan agreements.
The present chapter offers a critical evaluation of the impact of the macro-
economic policy framework of the Washington Consensus on growth and
poverty reduction. The evaluation of structural adjustment programmes (eco-
nomic liberalization) is the theme of chapter VI. After assessing the impacts
of macroeconomic policies on economic growth, poverty and inequality, the
chapter will review the underlying reasons for the outcomes and then offer an
alternative framework for pro-poor macroeconomic policies aimed at achiev-
ing employment creation with price stability.
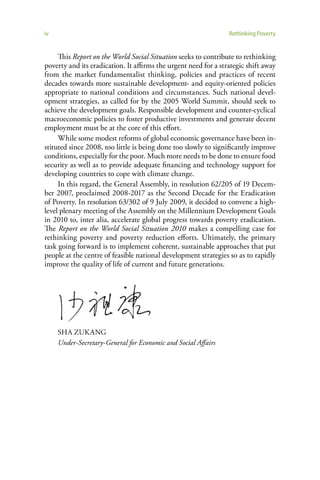
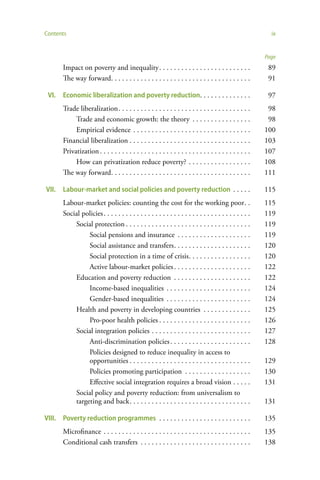
Growth performance
If growth was undermined by the high inflation generated by macroeconomic
instability and the protectionism driven by statism, the elimination of these
obstacles should have unleashed the energies of the private sector in full force
and economic growth should have accelerated. However, that has not hap-
pened: “Economic growth rates in those countries that adopted the ‘stabilize,
liberalize, and privatize’ agenda has turned out to be low not only in absolute
terms, but also relative to other countries that were reluctant reformers and
relative to the reforming countries’ own historical experience” (Rodrik, 2004,
pp. 1-2). The World Bank (2005, p. 95) notes:
Macroeconomic policies improved in a majority of developing countries
in the 1990s, but the expected growth benefits failed to materialize, at
least to the extent that many observers had forecast. In addition, a series of
financial crises severely depressed growth and worsened poverty … [B]oth
slow growth and multiple crises were symptoms of deficiencies in the de-
sign and execution of the pro-growth reform strategies that were adopted
in the 1990s with macroeconomic stability as their centrepiece.
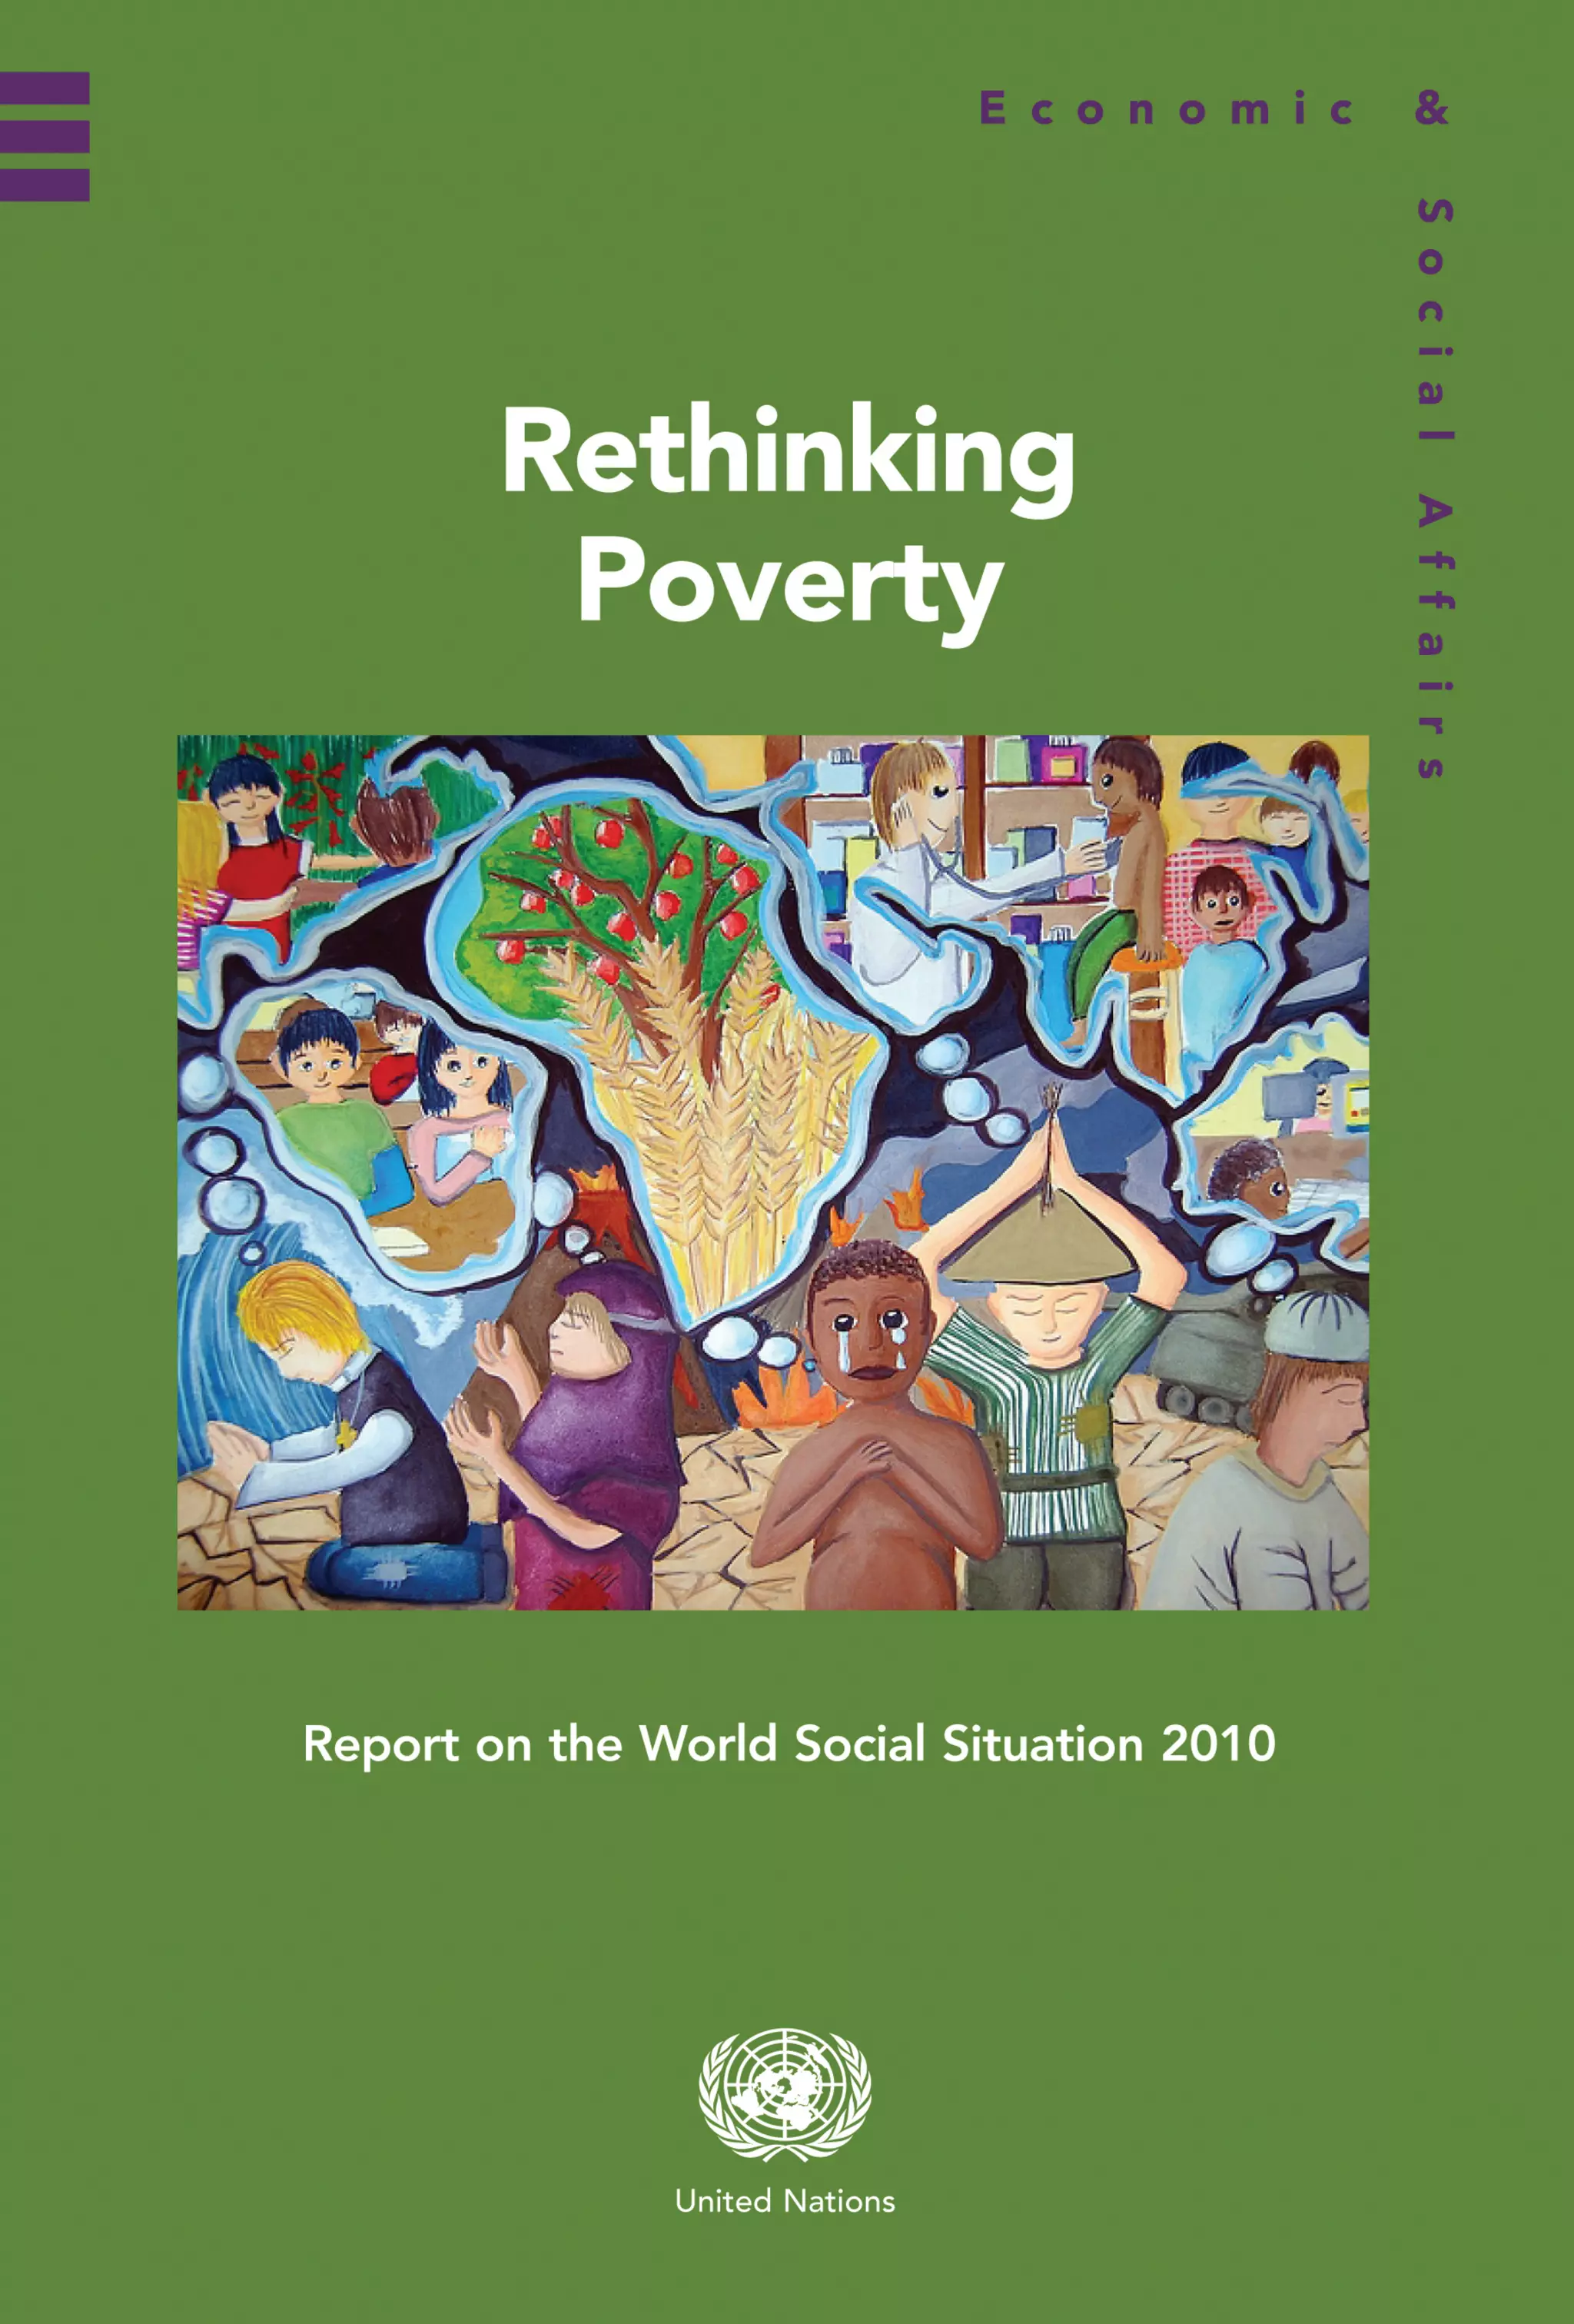
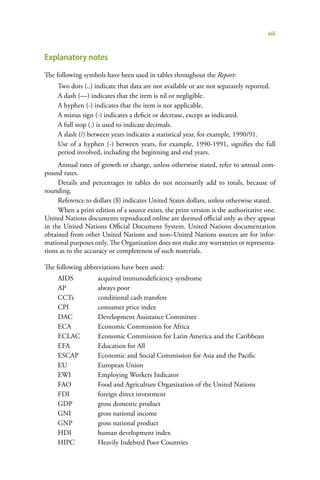
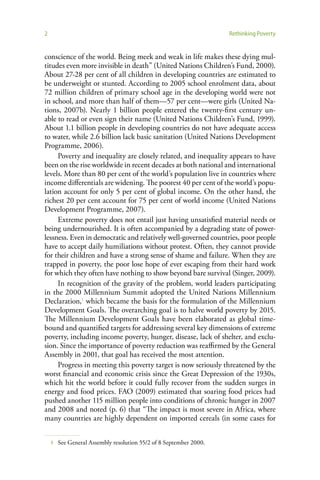
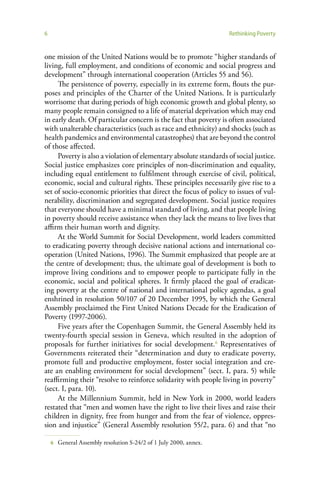
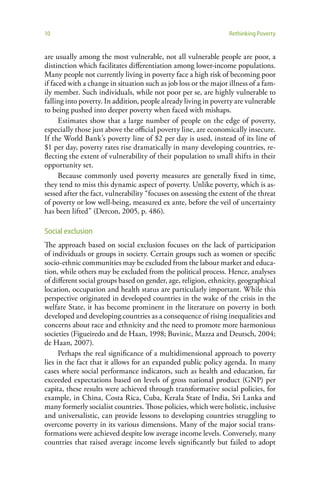
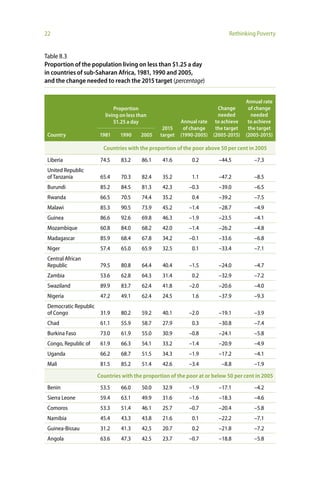
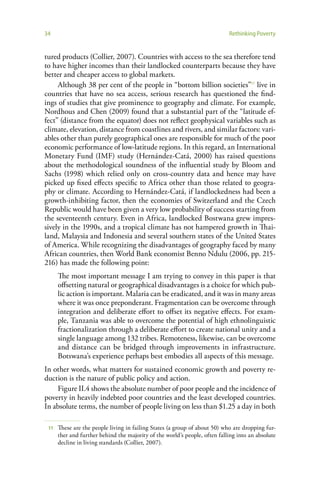
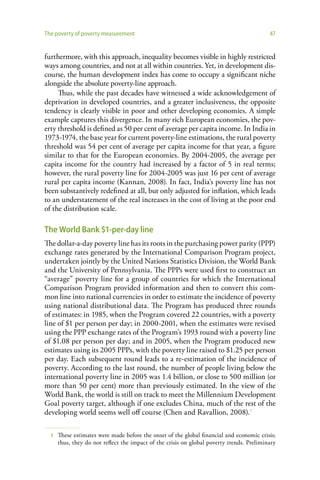
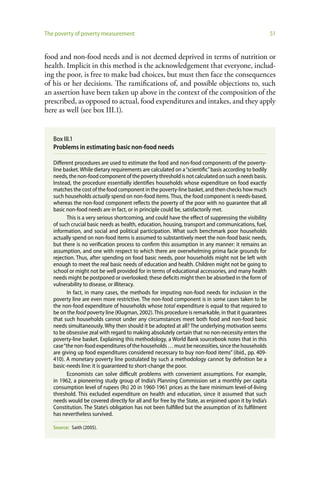
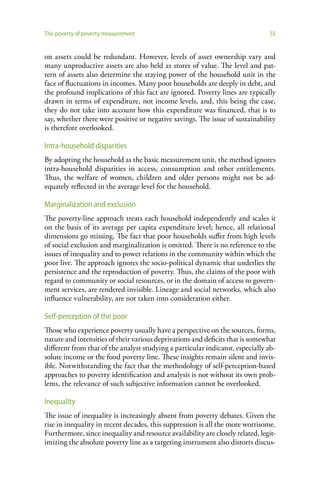
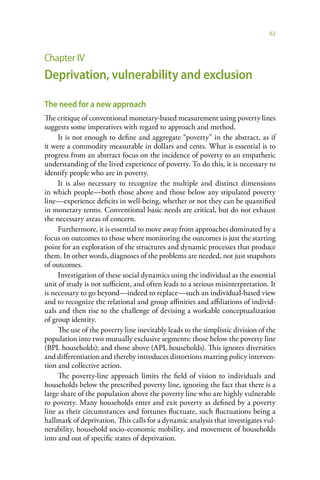
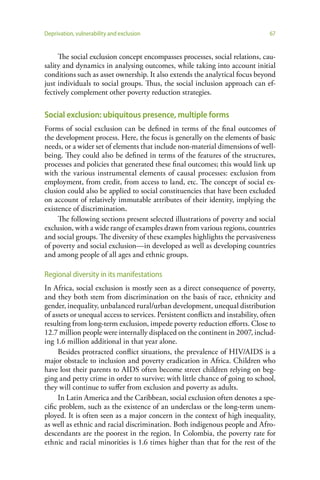
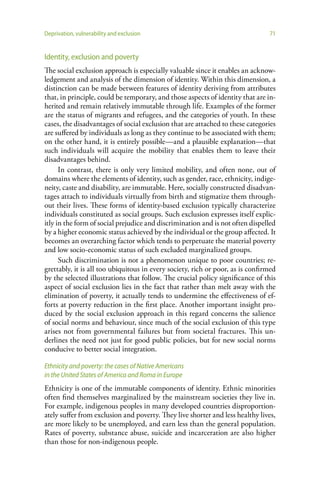
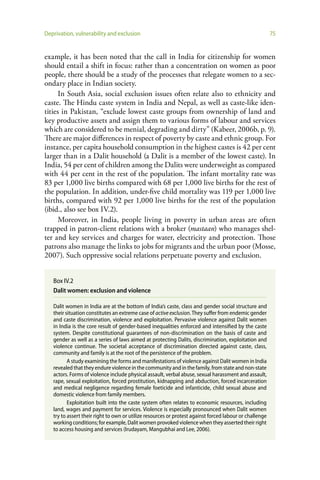
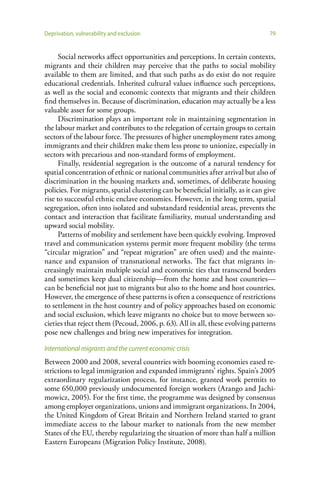
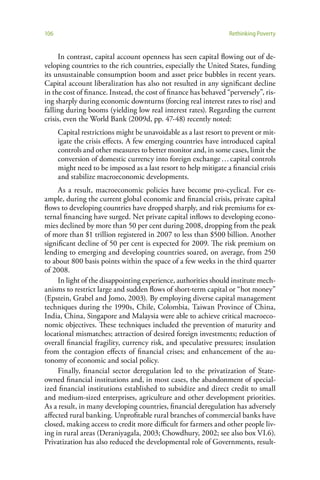
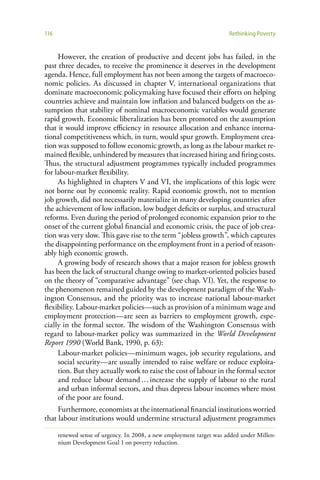
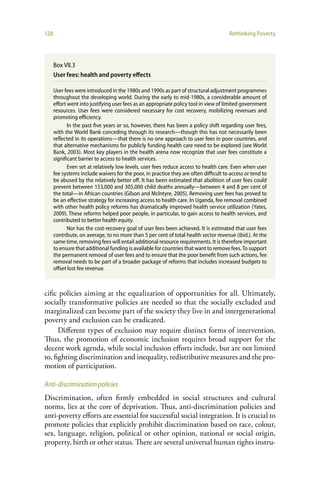
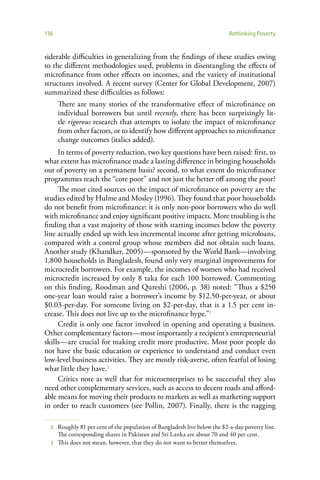
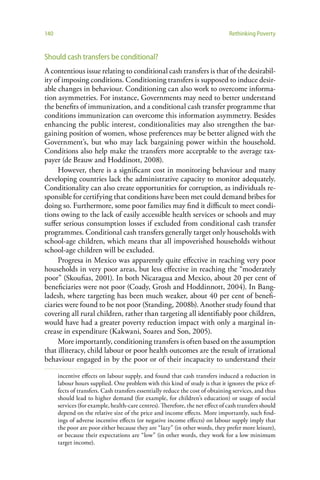
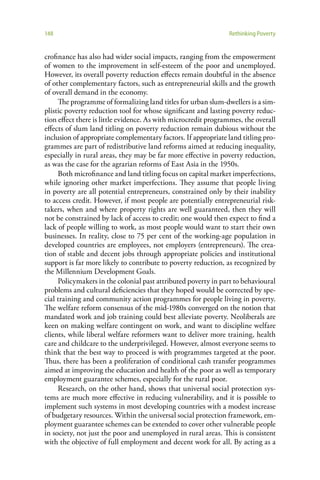
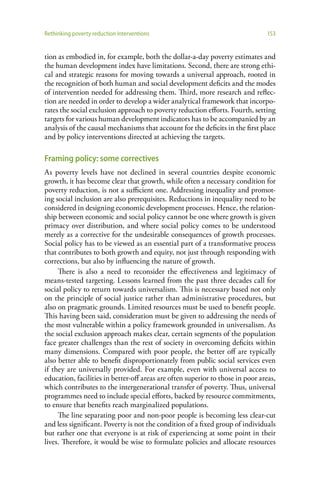
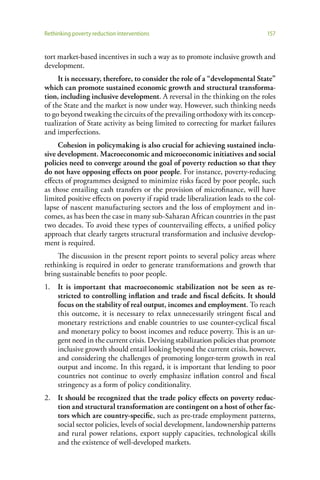
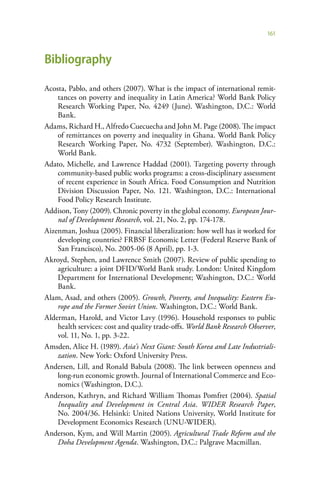
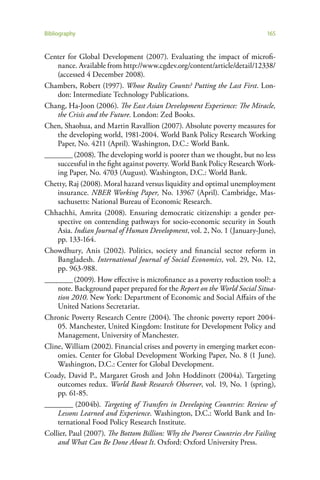
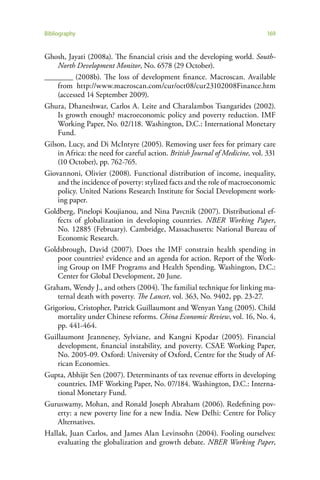
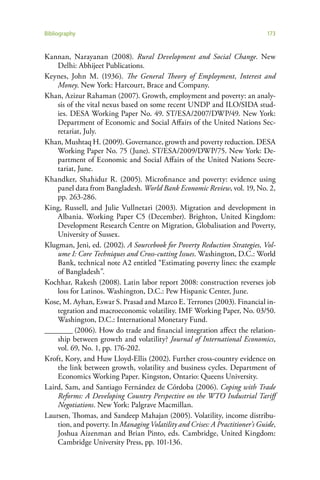
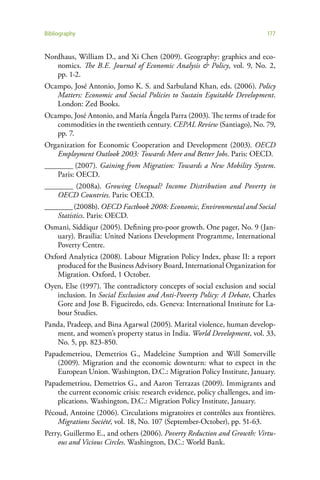
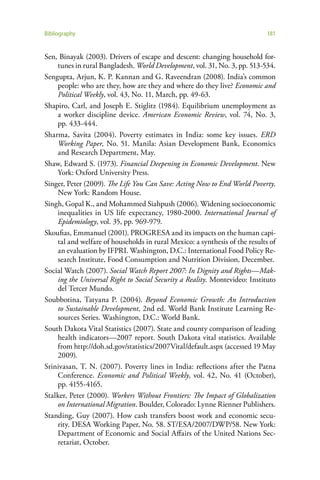
In Latin America, after radical reforms had been pursued, mostly un-
der IMF/World Bank stabilization and structural adjustment programmes,
growth performance did not even begin to match the performance achieved
when Governments exerted tight control over the economy (table V.1).3 Most
of the transition economies of Eastern Europe experienced modest or nega-
tive growth rates following the Washington Consensus–inspired reforms and
macroeconomic policies.
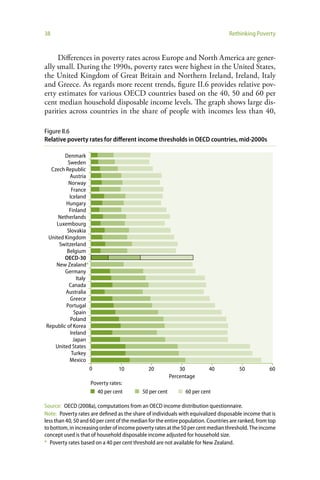
3 In the 1990s, Argentina pursued International Monetary Fund (IMF) and World Bank
programmes strictly. However, the unemployment rate soared from 6.5 per cent in 1991 to
over 17 per cent in 1995 and the number of people living in poverty increased from 22 per
cent in 1993 to over 27 per cent in 1995, as the Gini coefficient (a conventional measure
of inequality) rose from 0.45 in 1992 to 0.47 in 1995.](https://image.slidesharecdn.com/fullreport1-120214140553-phpapp01/85/Fullreport-1-102-320.jpg)
![Macroeconomic policies and poverty reduction 93
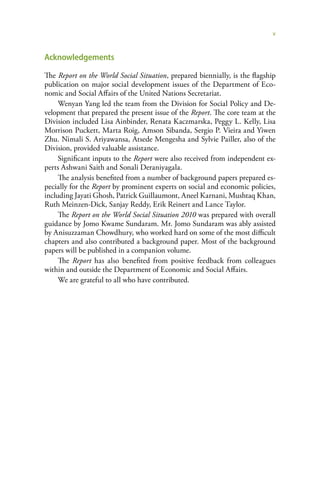
This means fiscal policy must be dominant at all times, not just when mon-
etary policy loses its effectiveness.8 Recognizing that both the level and com-
position of government expenditure can have significant impacts on growth,
poverty and inequality9 means abandoning the narrow concept of “sound”
finance measured by the debt/gross domestic product (GDP) ratio. Instead, the
concept of “functional” finance, which evaluates government finance based
on its impact, should be adopted.10 From this perspective, a better measure of
fiscal sustainability is the debt-servicing ratio ([principal + interest payments]/
GDP), that is to say, debt will be sustainable if government expenditure is both
productivity- and growth-enhancing. In other words, Governments still need
to guard against unproductive expenditures.
Fiscal space: Owing to the volatile nature of aid (see box V.2) and the
increased vulnerability to shocks, there has to be a renewed commitment to
domestic resource mobilization in developing countries, which should also
be seriously counter-cyclical by accumulating fiscal resources during boom
periods and using such resources to finance expansionary policies or targeted
interventions during downturns. The goal of a “stabilization fund” is to cre-
ate the necessary fiscal space within which to sustain investments in human
capital and basic infrastructure across business cycles and to scale up passive
and active labour-market policies (such as job guarantee schemes) as well as
social protection so as to minimize the impact of external shocks on poverty.
Monetary and exchange-rate policies should play a supportive role and ac-
commodate the Government’s need for development activities and counter-
cyclical measures. This means more active coordination between fiscal and
monetary authorities and a limiting of central bank independence.11 Confi-
8 For example, in a situation like the current global crisis or the stagnation of Japan in the
1990s, many orthodox economists, including those at IMF and the World Bank, favour
fiscal stimulus as the effectiveness of monetary easing hits its limit with interest rates
hovering near zero (as was also the case during the stagnation of Japan in the 1990s).
However, they consider this only a short-term measure until the monetary policy regains
its effectiveness.
9 See Domar (1946). Domar (1944, pp. 801 and 804) notes the following:
That deficit financing may have some effect on income … has received a different
treatment. Opponents of deficit financing often disregard it completely, or imply,
without any proof, that income will not rise as fast as the debt … There is something
inherently odd about any economy with a continuous stream of investment expendi-
tures and a stationary national income.
10 Lerner (1943, p. 39) notes:
The central idea is that government fiscal policy, its spending and taxing, its borrow-
ing and repayment of loans, its issue of new money and its withdrawal of money, shall
all be undertaken with an eye only to the results of these actions on the economy and
not to any established traditional doctrine about what is sound or unsound (italics
in original).
11 Leaving aside technical arguments, a broader issue of democratic governance and tech-
nocratic insulation of institutions is at stake. Milton Friedman (1962, p. 219) noted that](https://image.slidesharecdn.com/fullreport1-120214140553-phpapp01/85/Fullreport-1-110-320.jpg)
![102 Rethinking Poverty
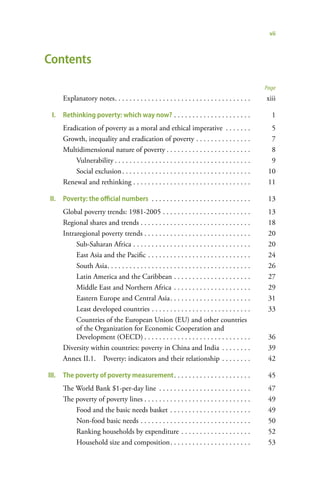
A later study by the World Bank (2002) of both economic growth and
equality in developing countries from 1977 to 1997 found that the more glo-
balized countries (as measured by trade relative to GDP) enjoyed faster eco-
nomic growth, but did not experience significant changes in income inequal-
ity. However, as Rodrik (2001, p. 1) points out, “the countries that integrated
into the world economy most rapidly were not necessarily those that adopted
the most pro-trade policies”. According to Rodrik, “the Bank is acknow-
ledging that trade liberalization may not be an effective instrument, not just
for stimulating growth, but even for integration in world markets”. Rodrik
concludes that “rapid integration into global markets is a consequence, not
of trade liberalization or adherence to World Trade Organization strictures
per se, but of successful growth strategies with often highly idiosyncratic
characteristics”.5
Thus, both the 1993 and 2002 studies of the World Bank recognize that
high growth was not necessarily due to trade liberalization or export orienta-
tion. What matters most is the successful growth strategies based on countries’
own historical and socio-economic circumstances. The empirical work claim-
ing a positive causal relationship between trade liberalization and growth suf-
fers from serious methodological flaws. After careful evaluation of the major
cross-country empirical work, one study states that “[w]hen we ask whether the
results are informative for the practice of trade policy, we conclude that the
answer is ‘no’ ” (Hallak and Levinsohn, 2004, p. 3).6 A later study (Andersen
and Babula, 2008) which addresses some flaws of earlier ones finds likely posi-
tive links between trade and economic growth, but doubts the ability of devel-
oping countries to achieve productivity growth through trade liberalization.
To do so, it may well be necessary to invest enough in appropriate education
and training facilities. However, by removing an important source of revenue
through tariff reductions—which is not compensated for by other sources of
revenue—trade liberalization further restricts Governments’ fiscal space for
such productivity-enhancing investment (see box VI.3).
Summarizing lessons from a decade of reforms in the 1990s, the World
Bank (2005, p. 134) notes:
The distributive effects of trade liberalization are diverse, and not always
pro-poor. … evidence from the 1990s suggests that even in instances where
trade policy has reduced poverty, there are still distributive issues … Glo-
bal markets are the most hostile to the products produced by the world’s
poor—such as agricultural products and textiles and apparel.
5 The admission in question comes when the report describes its sample of “more globalized”
countries: “We label the top third ‘more globalized’ without in any sense implying that
they adopted pro-trade policies. The rise in trade may have been due to other policies or
even to pure chance” (World Bank, 2002, p. 34).
6 For a similar conclusion, see Rodríguez (2007).](https://image.slidesharecdn.com/fullreport1-120214140553-phpapp01/85/Fullreport-1-119-320.jpg)
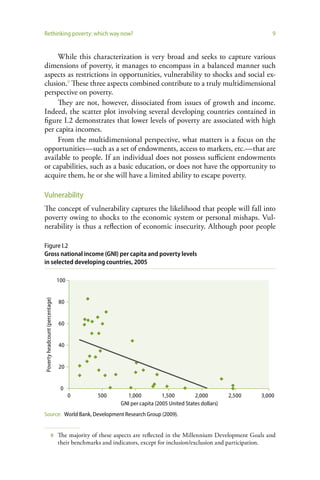
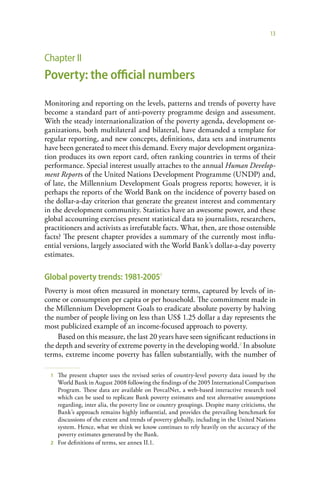
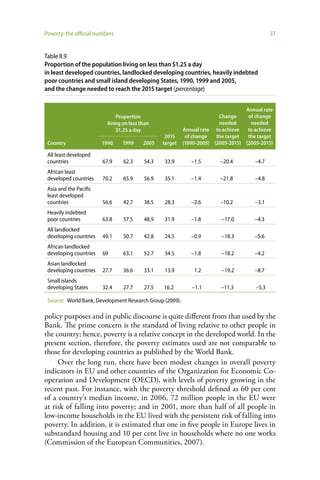
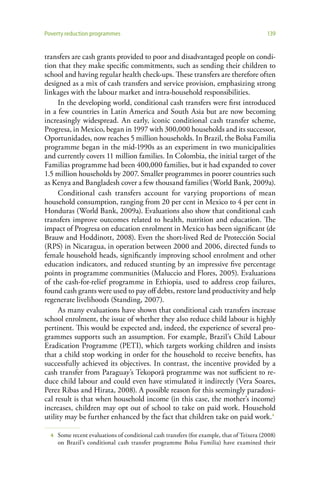
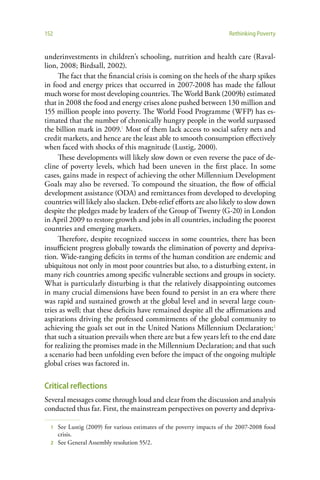
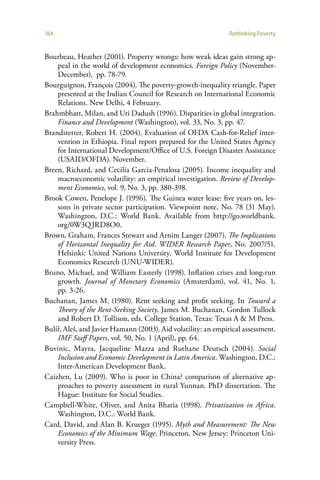
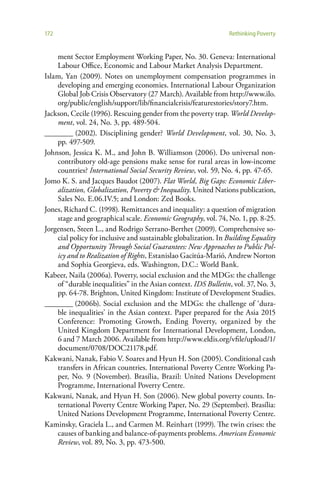
![Economic liberalization and poverty reduction 107
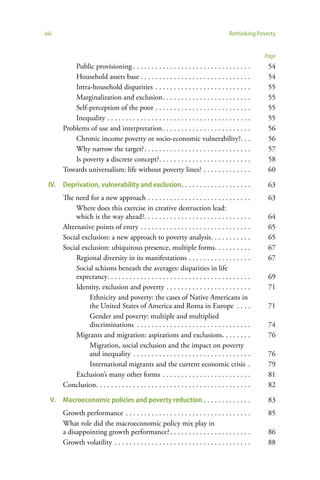
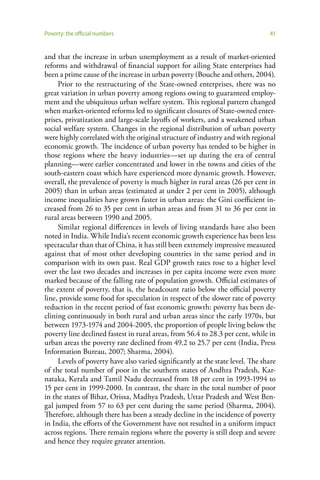
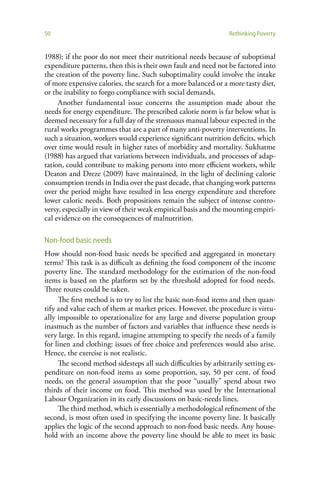
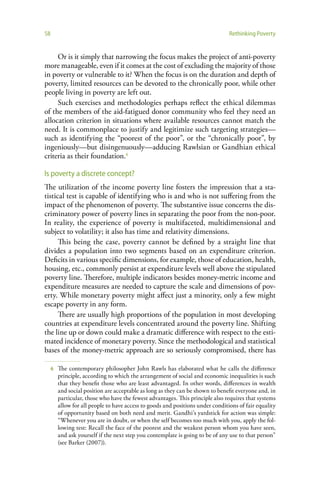
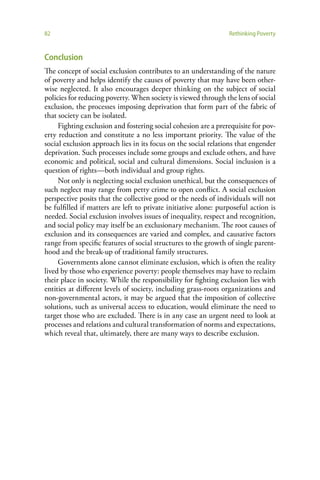
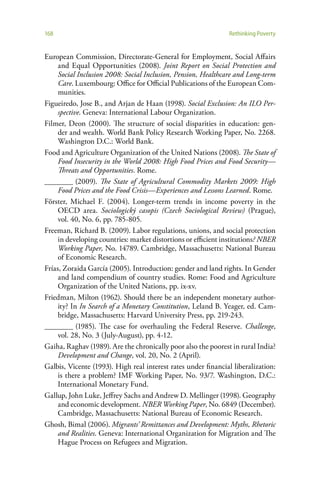
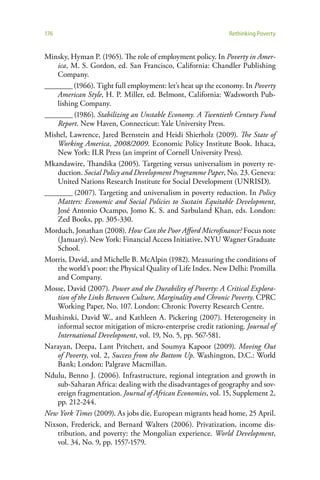
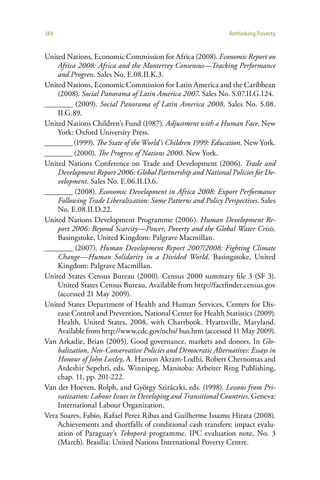
Box VI.6
Financial deregulation, inequality and poverty
Developing countries need to invest in both agriculture and manufacturing in order to diversify
their economies as well as to reduce poverty through employment creation and food price
stabilization. However, despite much higher social returns to agricultural and manufacturing
investment, following financial sector deregulation, banks and financial institutions have
increasingly financed collateralized stock market and real estate investments. Private
commercial banks discriminate against employment-intensive sectors such as agriculture and
small-scale enterprises owing to the higher transaction costs of lending to a larger number of
small borrowers and the lack of collateralizable assets of small farmers and owners of small and
medium-sized enterprises. Ghosh (2008b) maintains that “[t]he agrarian crisis in most parts
of the developing world is at least partly, and often substantially, related to the decline in
the access of peasant farmers to institutional finance, which is the direct result of financial
liberalization”.
The situation has been made worse by the closing of Government-run specialized
financial institutions for agriculture and small and medium-sized enterprises as part of
financial deregulation. Furthermore, previously Government-owned privatized banks have
closed rural branches deemed not to be profitable, as there is no longer any requirement to
ensure rural banking services. These measures have reduced credit availability for farmers and
small producers, and have contributed to the rising costs of needed working capital, thereby
exacerbating rural distress. In rural India, for example, there is strong evidence that the deep
crisis in farming communities—resulting in farmer suicides, mass migration and even deaths
from hunger—has been related to the decline of institutional credit, forcing farmers to turn to
usurious private moneylenders. A study by the Inter-American Development Bank (2007) of 17
Latin American countries for the period 1977-2000 found that financial liberalization has had a
significant effect on increasing inequality and poverty.
In sum, financial deregulation has undermined important social functions of finance
by making it less inclusive. It has also destroyed an important industrial policy instrument
historically utilized by most successful late industrializers. Most late industrializing countries, at
least since the twentieth century, have created well-regulated financial markets and often State-
controlled financial institutions designed to mobilize savings to support priority investments.
They used directed credit policies and differential interest rates to support nascent industries
with the potential to expand into export markets. They also created development banks with
the mandate to provide long-term credit on attractive terms. These financial sector policies
contributed significantly to rapid economic transformation and poverty declines in those
countries.
ing in the poor performance of small and medium-sized enterprises and ag-
riculture as well as deindustrialization, with adverse impacts for employment
and poverty reduction.
Privatization
The privatization of State-owned enterprises, including utilities, is another cen-
tral component of adjustment policies for developing countries. Privatization is
often a crucial requirement for securing aid funding, and is a key policy of the
Poverty Reduction Strategy Papers (PRSPs), with the World Bank continuing
to link privatization to poverty reduction.](https://image.slidesharecdn.com/fullreport1-120214140553-phpapp01/85/Fullreport-1-124-320.jpg)


This document is the Report on the World Social Situation 2010 published by the United Nations. It discusses the need to rethink strategies for poverty eradication. The report argues that eradicating poverty is a moral imperative. While some countries have reduced poverty through economic growth, overall global poverty levels have not changed significantly in 20 years except in China. The report calls for a strategic shift away from market-focused policies towards more equitable and sustainable national development strategies centered on achieving social and economic goals. It also stresses the need to address the multidimensional nature of poverty, including vulnerability and social exclusion.


![Getting Started with Apache Spark: Big Data Made Simple [Free Meetup]](https://cdn.slidesharecdn.com/ss_thumbnails/apachesparkgettingstarted-260203175547-8361bcc3-thumbnail.jpg?width=640&height=640&fit=bounds)
