Download to read offline


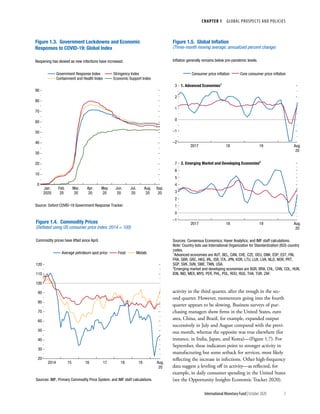
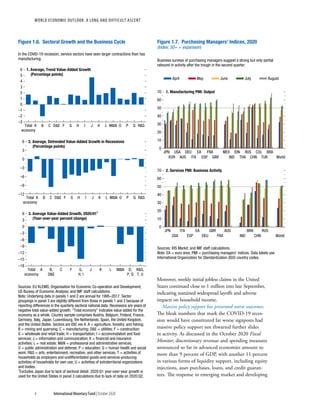
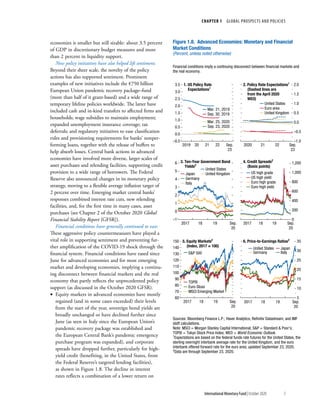
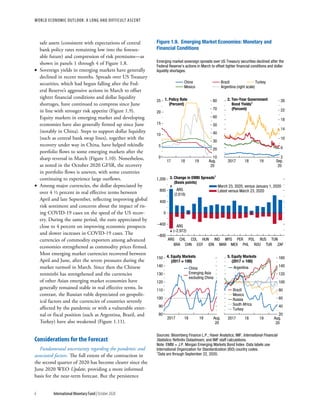
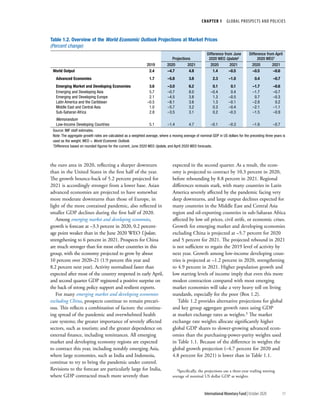
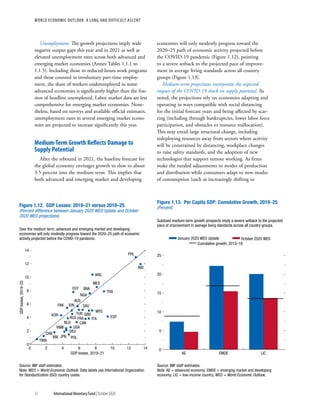
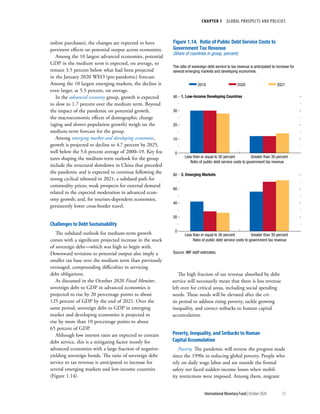
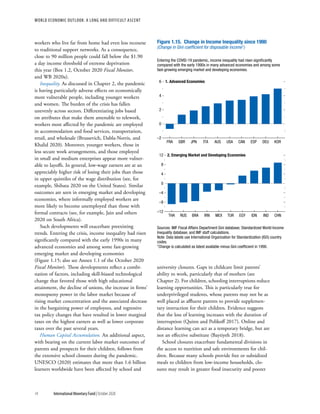


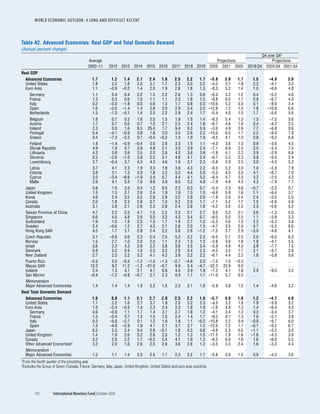
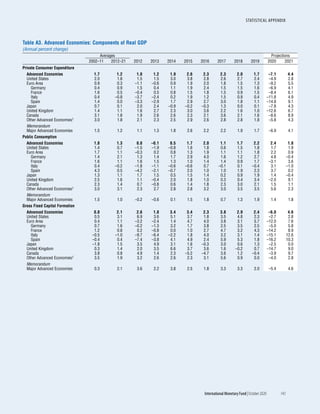
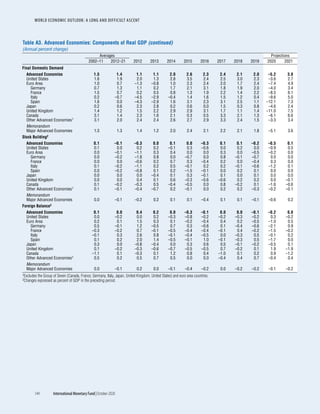
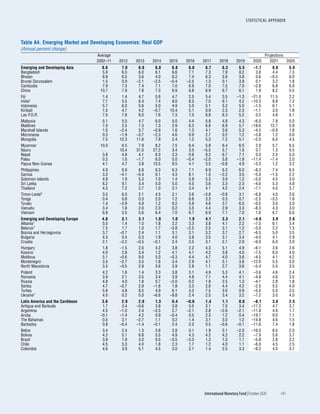

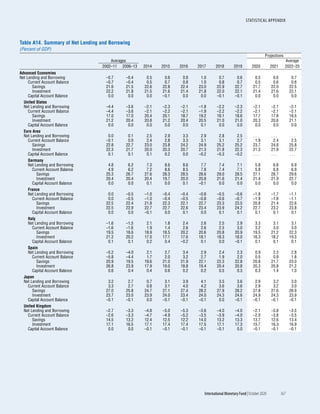
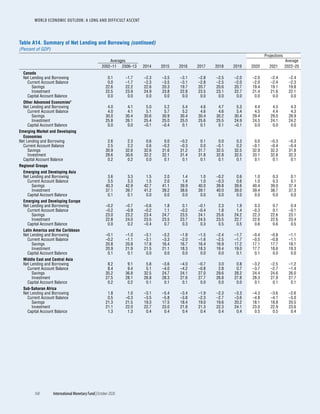
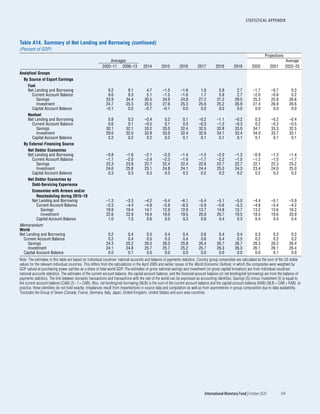
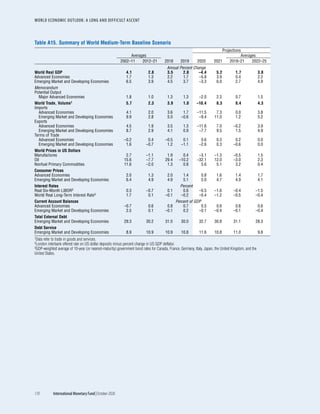

This document is the October 2020 World Economic Outlook report published by the International Monetary Fund. It provides projections for the global economy following the COVID-19 pandemic, finding that while activity is climbing out of recession, the recovery will be partial and uneven. Near-term policy priorities are ensuring adequate health resources and limiting economic damage, while medium-term policies aim to address challenges to potential output. Significant risks remain, including additional waves of the pandemic, and multilateral cooperation will be important for economic and health outcomes.


