Downloaded 37 times


![WORLD ECONOMIC OUTLOOK: RECOVERY STRENGTHENS, REMAINS UNEVEN
84 International Monetary Fund|April 2014
(that is, less than one year), and even at longer maturi-
ties few countries have good data coverage (King and
Low, 2014).7 In the absence of inflation-protected
securities, real rates can be approximated by the differ-
ence between the nominal interest rate and inflation
expectations over the relevant time horizon:
rt
[n] = it
[n] – Etpt,t+n, (3.1)
in which it
[n] is the nominal yield of a zero cou-
pon bond of maturity n at time t, and Etpt,t+n is
the expected consumer price inflation over the life
7Markets for indexed bonds are not deep and are susceptible to
changes in the liquidity premium and to technical factors. Following
Blanchard (1993), because of tax considerations, for the United
Kingdom, the real rate is adjusted by adding τ/(1 − τ) × π, in which
τ denotes the income tax rate on coupon payments and is set at 20
percent (see Blanchard, 1993) and π denotes the expected inflation
rate over the life of the security.
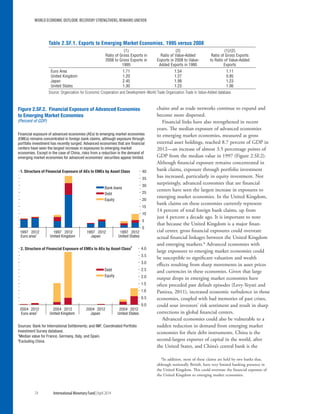
of the bond. Bond yields are observable, but infla-
tion expectations are not (at least not directly). For
estimates of expected inflation, the analysis relies on
survey information and on forecasts from an estimated
autoregressive process. Because the parameters of this
autoregressive process are likely to change over time,
rolling windows are used. To maximize sample cover-
age, three-month and ten-year maturities are used to
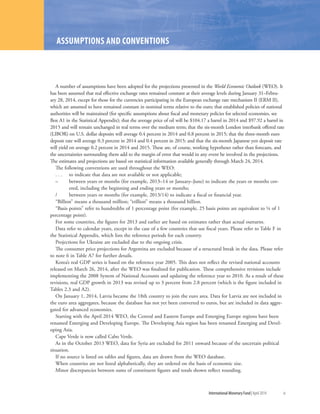
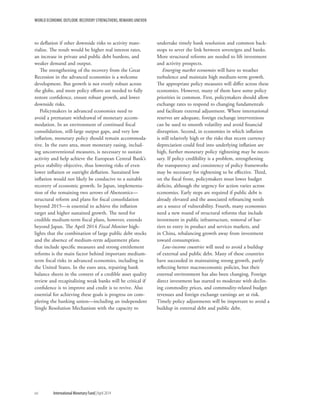
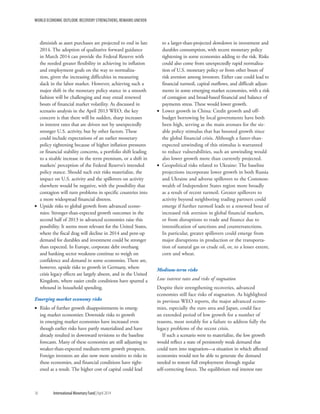
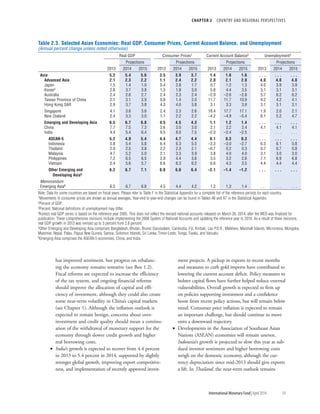
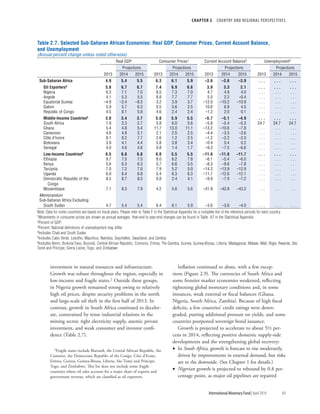
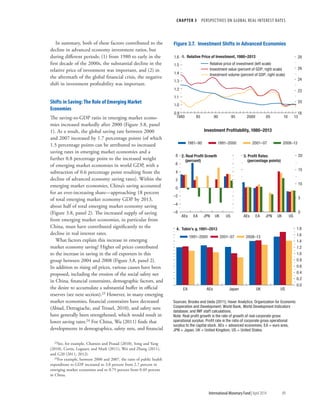
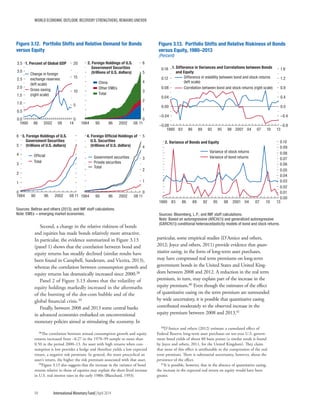
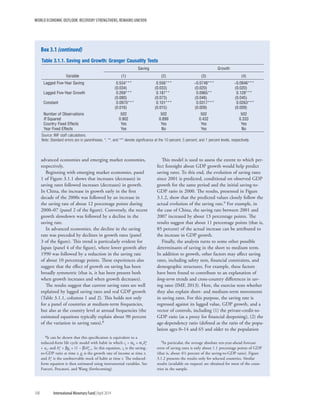
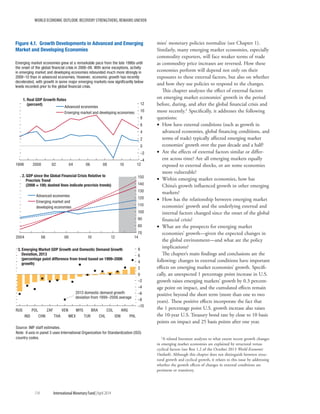
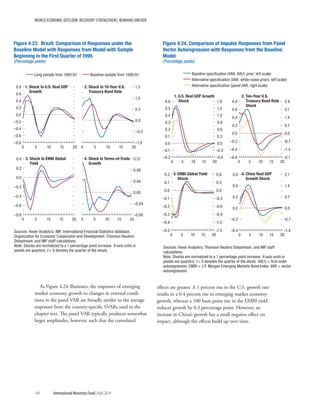
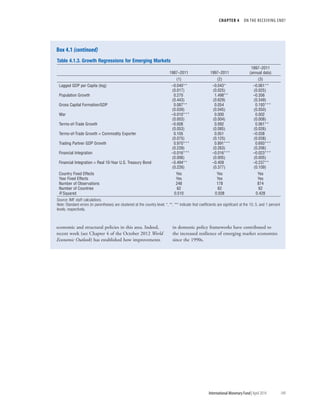
represent short- and long-term real rates, respectively.8
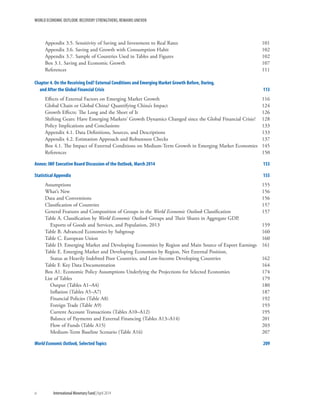
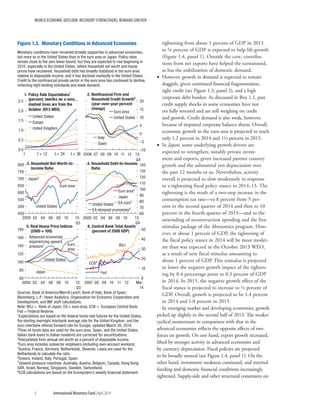
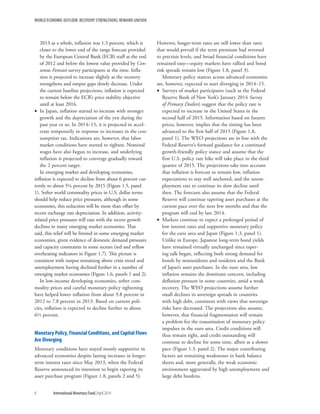
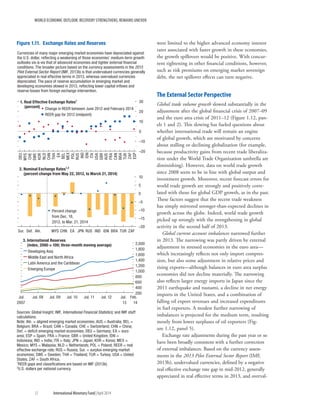
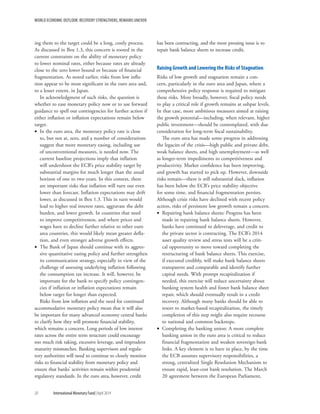
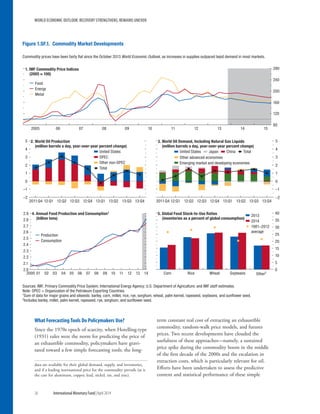
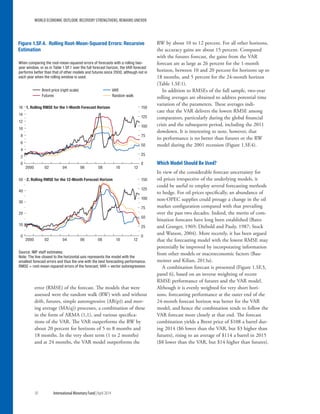
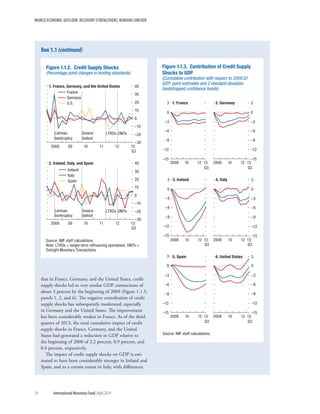
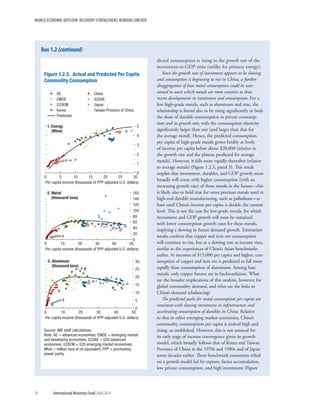
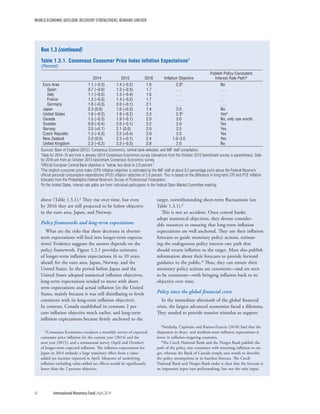
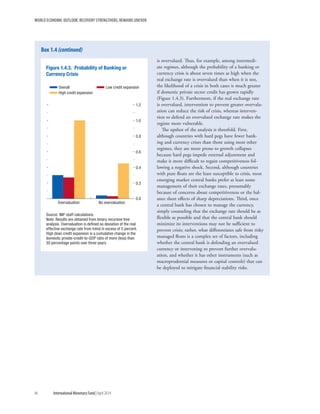
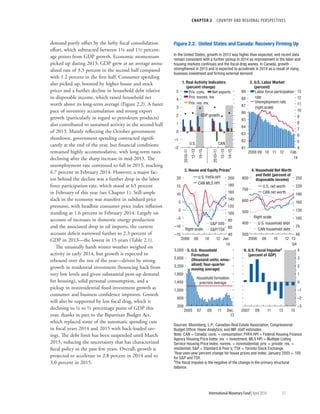
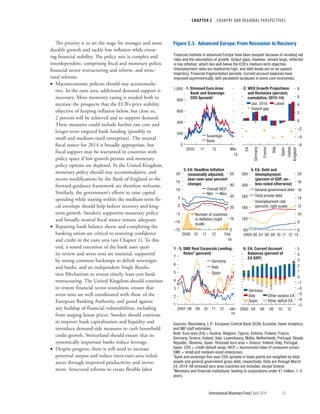
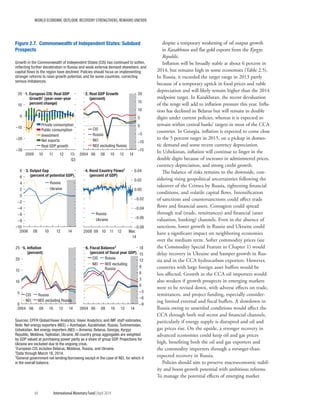
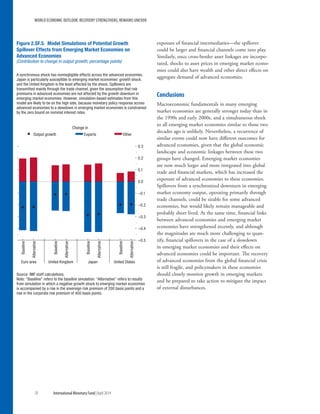
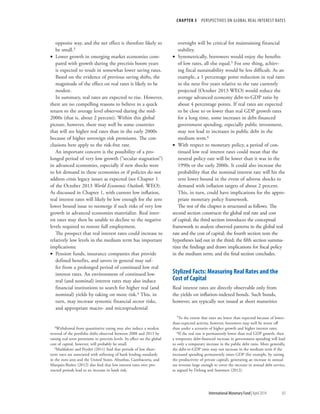
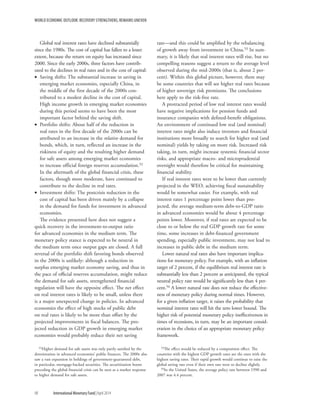
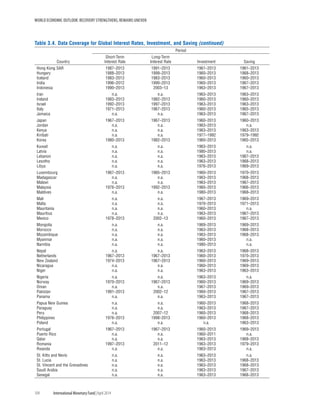
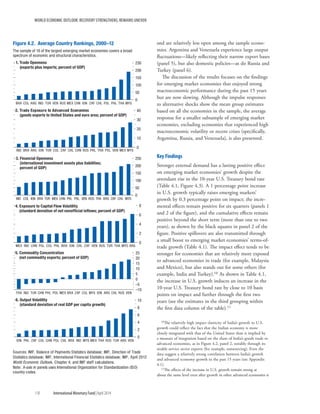
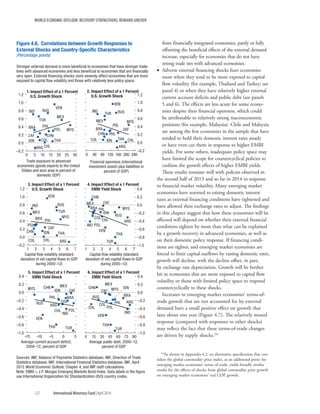
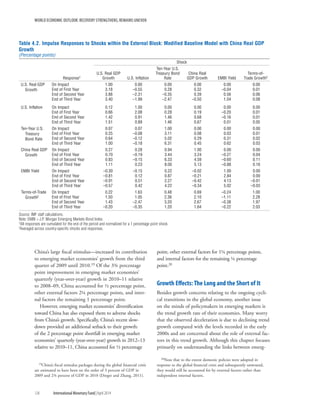
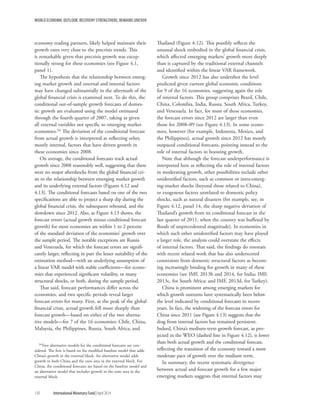
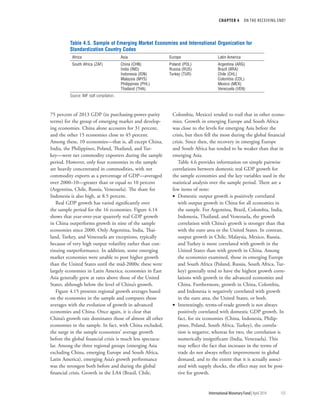
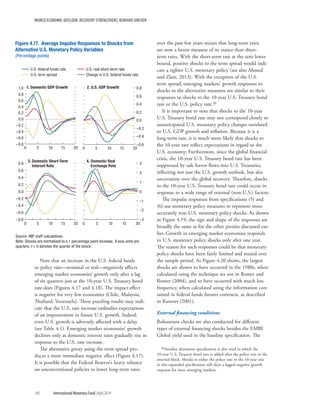
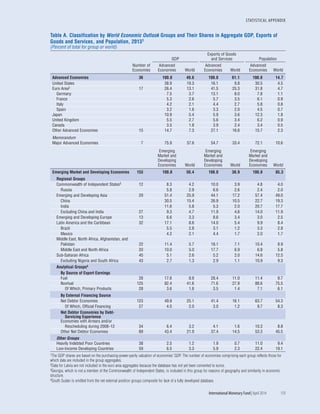
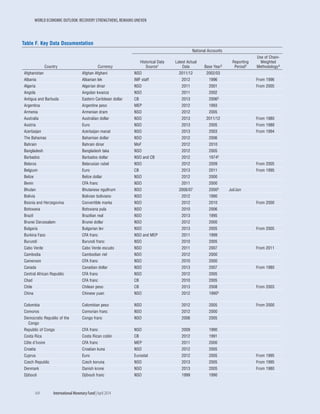
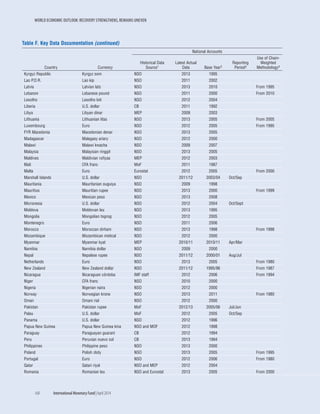
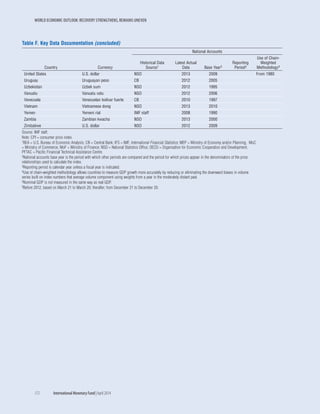
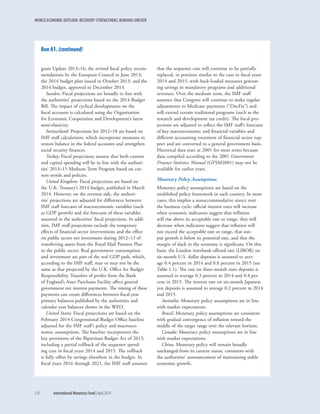
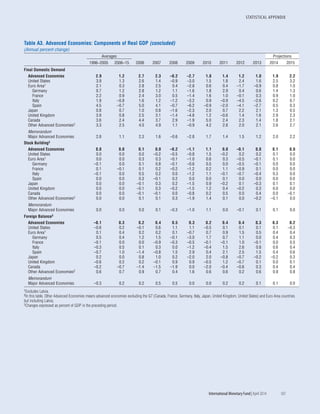
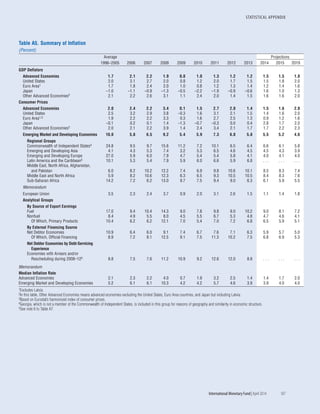
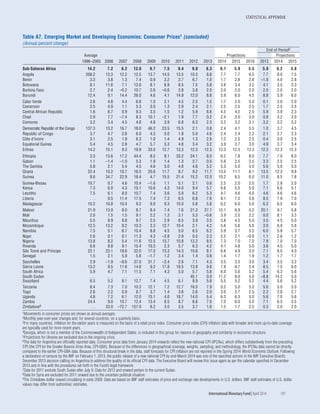
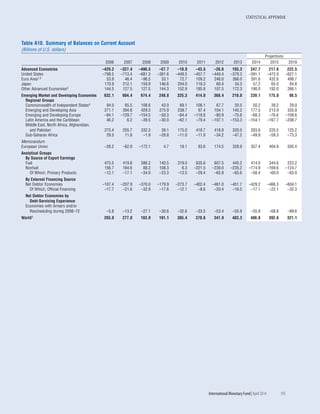
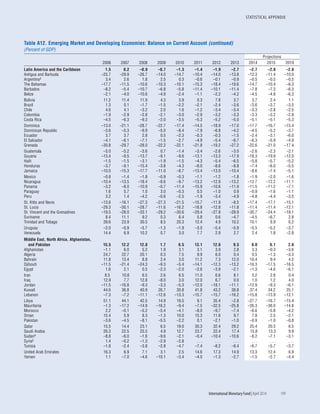
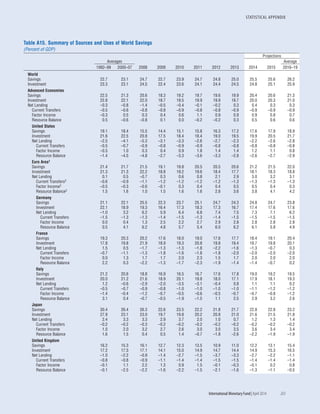
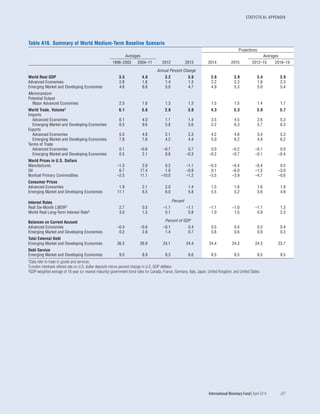
Estimated three-month real rates for the United States
and ten-year real rates for the United States and the
United Kingdom are shown in Figure 3.2. The model-
and survey-based approaches give very similar estimates.
The figure suggests that real rates in the two countries
have declined sharply since the early 1980s. Moreover,
the rate decline has been global (Figure 3.3). The aver-
age global ten-year real rate declined from a high of
6 percent in 1983 to approximately zero in 2012.9
The relevance of common forces driving the worldwide
decline in real rates is confirmed by a principal component
analysis. The results show that the contribution of the first
common factor to the variation in real rates increased from
about 55 percent in 1980–95 to almost 75 percent in
1995–2012 (Figure 3.4, panel 1).10 The greater relevance
of common factors can also be seen in the evolution of the
cross-country dispersion in real rates over time.
Figure 3.4 (panel 2) shows that the cross-sectional
standard deviation of ten-year real rates declined from
about 400 basis points in the early 1980s to 100 basis
points in the most recent years.11 This decline is consis-
tent with the view that within-country factors driving
rates away from the common global mean have become
8See Appendix 3.1 for details. The sample comprises 40 countries:
25 advanced economies and 15 emerging market economies. The
interest rates used are those on government securities, where avail-
able; otherwise interbank rates are used.
9These are GDP-weighted averages. A similar pattern emerges from
simple averages for Group of Seven (G7) countries (Canada, France,
Germany, Italy, Japan, United Kingdom, United States) and for GDP-
weighted averages excluding the United States (see Appendix 3.7).
10Similar results are obtained when changes in real interest rates
are used.
11Similar results can be found for short-term emerging market
economy securities using a sample starting in 1990 (the data for
long-term rates are scant for emerging market economies). These
results show that the contribution of emerging market economies
to overall real rate dispersion has declined markedly. The analysis
excludes those countries that have experienced a significant increase
in default risk in the aftermath of the global financial crisis (that is,
some noncore euro area countries), because analyzing the deter-
minants of default risks goes beyond the scope of the chapter. It is
possible to observe, in regard to the euro area, that whereas the
–4
–2
0
2
4
6
8
1967 72 77 82 87 92 97 2002 07 13
Figure 3.2. Real Interest Rate Comparison
(Percent a year)
Model
Philadelphia FRB
Cleveland FRB
–4
–2
0
2
4
6
8
10
1967 77 87 97 2007 13
–4
–2
0
2
4
6
8
10
1967 77 87 97 2007 13
Model
IPS
CF
1. Three-Month Real Interest Rate Comparison
(United States)
Ten-Year Real Interest Rate Comparison
2. United States 3. United Kingdom
Sources: Consensus Economics; Federal Reserve Bank of Cleveland; Federal
Reserve Bank of Philadelphia, Livingston Survey; Federal Reserve Bank of
Philadelphia, Survey of Professional Forecasters; Haver Analytics; and IMF staff
calculations.
Note: CF = Consensus Forecasts; FRB = Federal Reserve Bank; IPS =
inflation-protected securities.
Model
IPS
Cleveland FRB
Livingston](https://image.slidesharecdn.com/worldeconomicoutlook-2014-140719164259-phpapp01/85/World-Economic-Outlook-2014-IMF-102-320.jpg)
![WORLD ECONOMIC OUTLOOK: RECOVERY STRENGTHENS, REMAINS UNEVEN
86 International Monetary Fund|April 2014
monetary policy frameworks that ensure low and stable
inflation. However, such simultaneous adoption would
not explain the trend decline in short-term real rates,
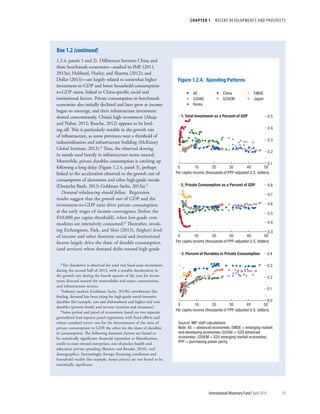
because such rates are little affected by inflation risk. In
other words, a worldwide decline in the inflation risk
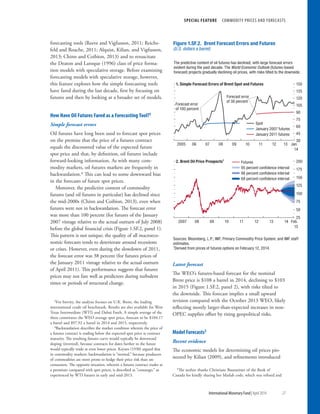
premium would have caused a similar decline in the
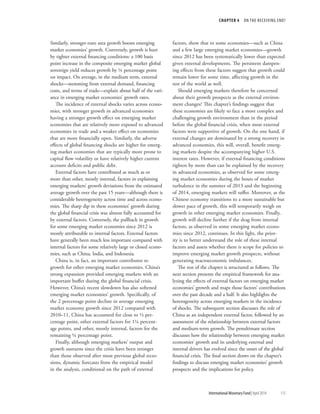
term spread, which has not happened (Figure 3.3, panel
1).12 An alternative hypothesis for the increased rel-
evance of common factors is increased financial market
integration. Figure 3.4 (panel 2) shows the evolution of
cross-holdings of banks’ assets and liabilities (a measure
of financial market integration). According to this mea-
sure, financial integration has steadily and substantially
increased during the past three decades. The correlation
between the financial integration and real-rate dispersion
variables is −0.74, supporting the hypothesis.
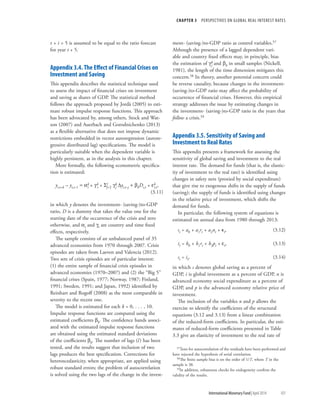
Financing decisions are not limited to short-term
borrowing or the fixed-income market. A firm’s evalu-
ation of whether it is worthwhile to undertake a given
investment project requires that the expected return on
the project be greater than the overall cost of capital,
which includes the cost of equity finance as well as that
of borrowing.
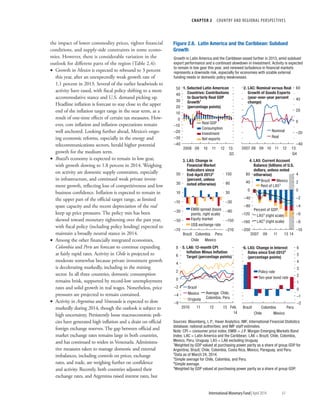
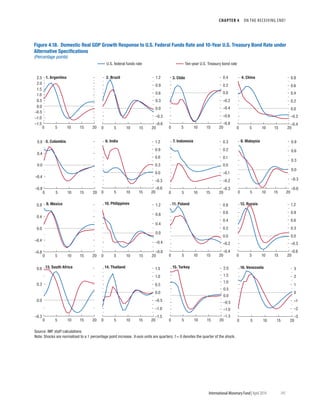
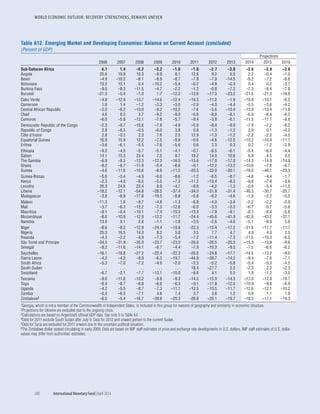
For the cost of equity, a measure of expected real
return on major stock markets is constructed.13 Stated
roughly, the expected return on equity is equal to the
dividend yield plus the expected long-term growth
rate of real dividends. Expected dividend growth is
estimated through a vector autoregressive process of
dividend and GDP growth. Figure 3.3 (panel 2) shows
the expected long-term real return on equity con-
structed for the U.S. and U.K. stock markets.
The estimated cost of capital is a weighted average
of the estimates for the real long-term interest rate
and the required return on equity.14 The ex ante real
12The average real term spread (the difference between long- and
short-term real rates) for the entire period is about 100 basis points. The
absence of a trend suggests a stable term premium (at short and medium
frequency, the term spread varies because of the business cycle). More
recently, default risk has been a factor in the euro area. The evolution of
default risk, however, is beyond the scope of this chapter.
13The real required (internal) rate of return on equity in period t
for a horizon n, Re,t
[n], is estimated from the following equation:
St/Dt = Sn
j=0(1 + Re,t
[n])–jEt gt,t+1+j,
in which S is a stock price index, D denotes dividends consistent
with the stock index chosen, and Et gt,t+j = Dt+j/Dt is the expected
cumulated dividend growth.
14Equal weights for the two variables are assumed for the United
States, and two-thirds (cost of debt) and one-third (cost of equity)
for all the other countries. Weights are chosen based on average val-
ues of corporate bond and stock market capitalization in the United
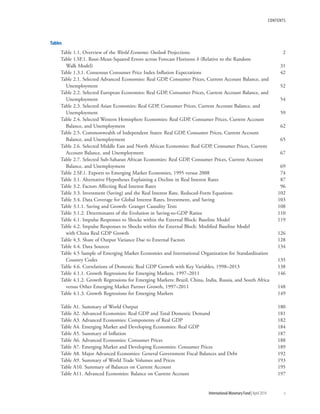
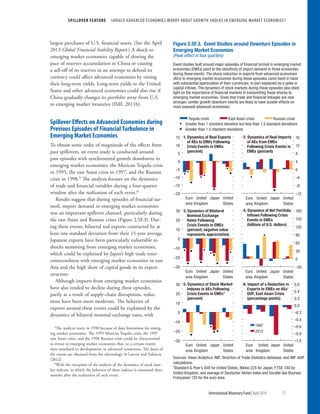
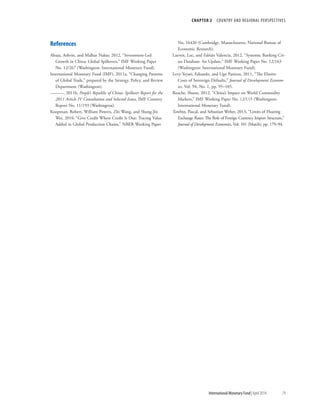
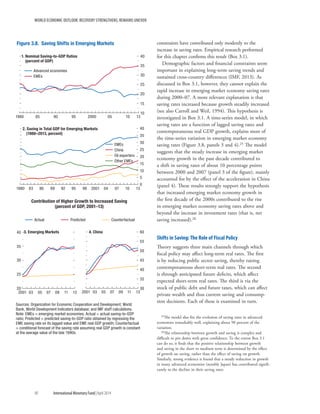
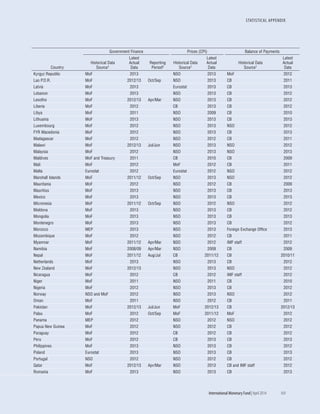
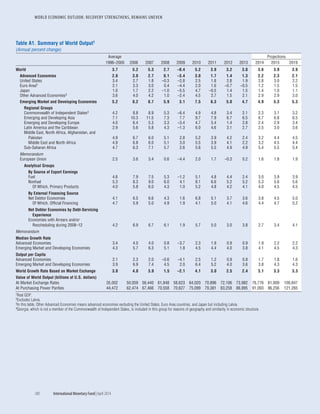
returns on both bonds and equity declined between
the 1980s and the late 1990s, but after the dot-com
bubble burst in 2000–01, the expected return on
equity increased. The decline in the overall cost of
capital was therefore less than the decline in the real
interest rate.15 Thus, although the estimated global real
interest rate in the first part of the 2000s was 1.15 per-
centage points lower than in the 1990s, the estimated
global cost of capital was only 0.62 percentage point
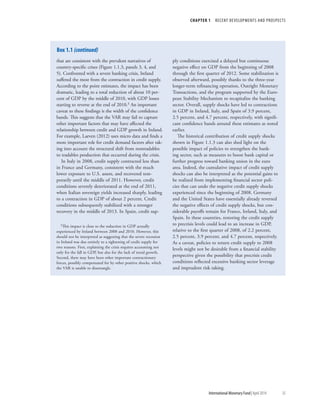
lower (Figure 3.3, panel 3).
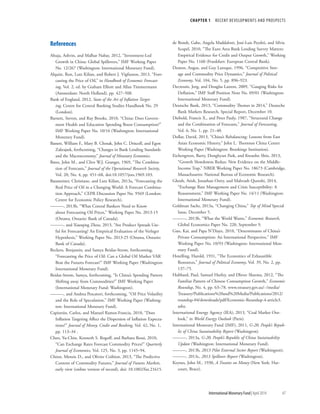
Determinants of Real Rates: A Saving-
Investment Framework
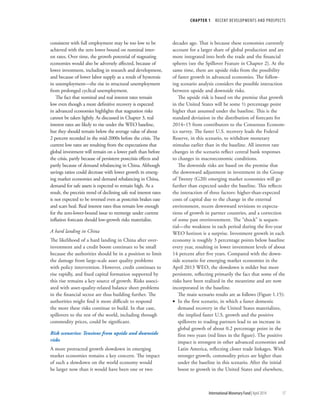
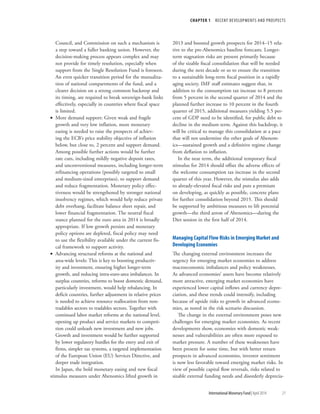
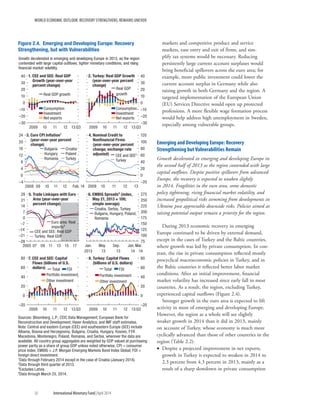
The equilibrium real interest rate is the price that
equilibrates the desired demand for and supply of
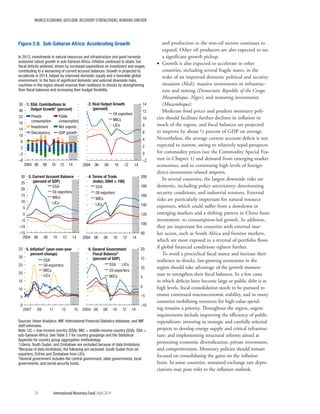
funds. Factors affecting the equilibrium real rate shift
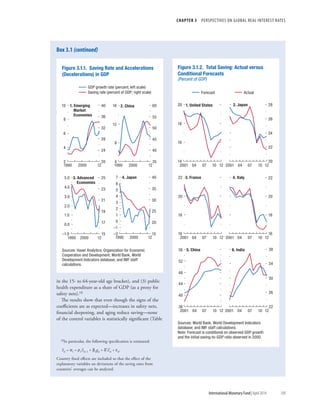
or tilt the demand or supply schedules (Figure 3.5).
A reduction in the equilibrium real rate would be
produced by an outward shift in the supply schedule of
funds or an inward shift in the demand schedule. The
supply of funds may come from private saving, public
saving (the budget surplus), or monetary policy
actions.
Changes in expected investment profitability and
in the relative price of investment goods (for example,
machinery, equipment, information technology) may
shift the demand for funds. A decrease in the profit-
ability of investment reduces investment and real rates,
and the economy converges to a smaller capital stock.
A reduction in the relative price of investment, for a
given investment volume, reduces the value of loan
demand. At the same time, it is likely to increase the
volume of investment. Thus, in theory, the net effect
on the value of global investment, and on real interest
rates, depends on the elasticity of the volume of invest-
ment to its relative price.
Shifts in private saving can be induced by several
factors: changes in current and expected income, social
safety nets, and demographics, as well as financial
innovations, among others. For example, the permanent
income hypothesis predicts a decrease in the saving rate
whenever a new development increases expected future
income growth. A different result may arise, however, in
the presence of consumption habits: an increase in GDP
States and in other countries, and tax corrections are not included.
Nevertheless, since 2000, for any possible choice of weights, the cost
of capital has declined less than the real rate.
15Similar results are obtained when the cost of debt is measured
using real corporate yields.](https://image.slidesharecdn.com/worldeconomicoutlook-2014-140719164259-phpapp01/85/World-Economic-Outlook-2014-IMF-104-320.jpg)
![CHAPTER 3 PERSPECTIVES ON GLOBAL REAL INTEREST RATES
International Monetary Fund|April 2014 91
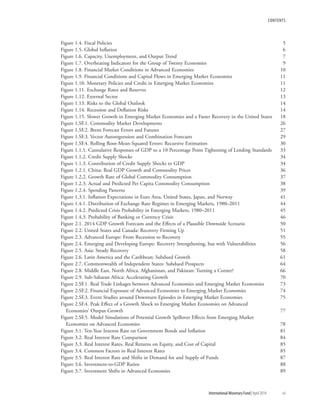
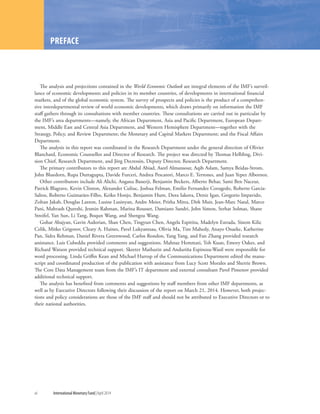
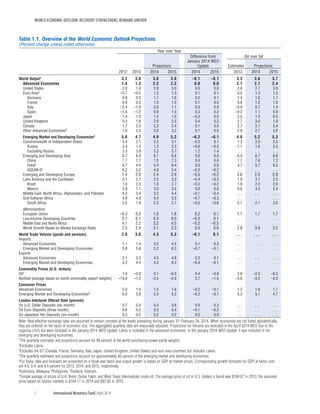
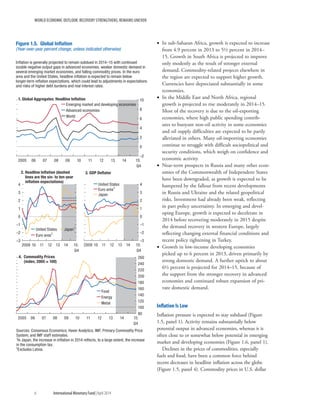
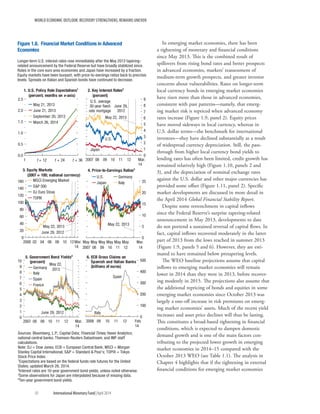
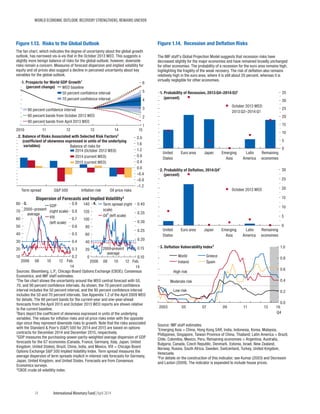
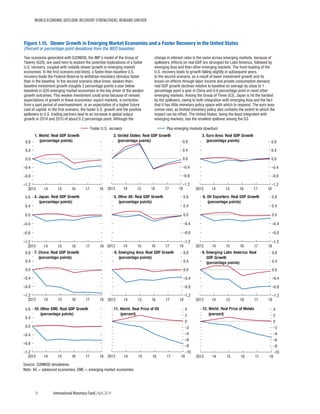
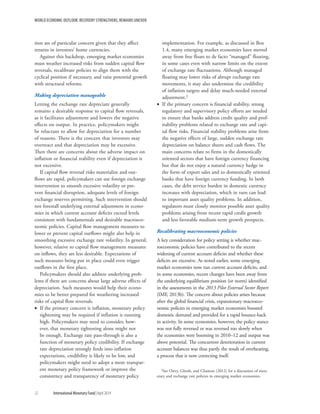
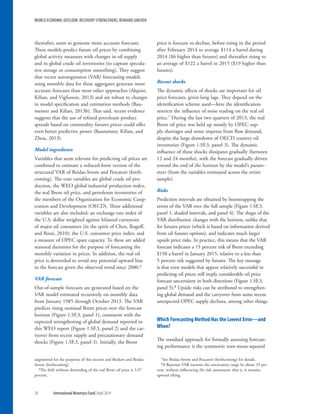
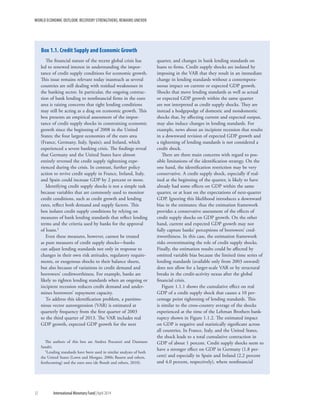
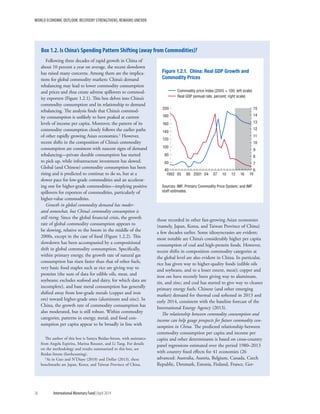
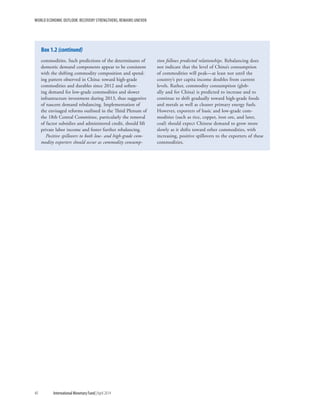
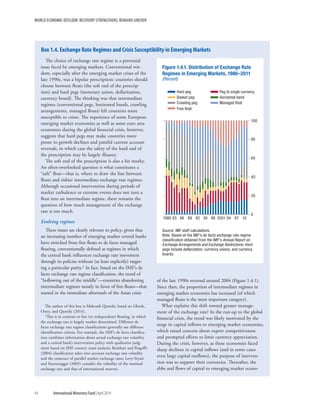
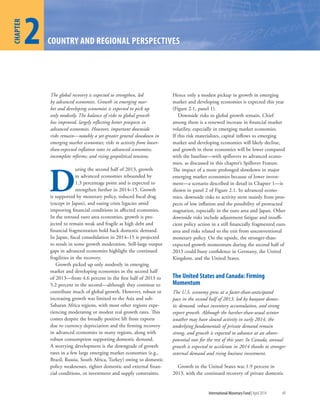
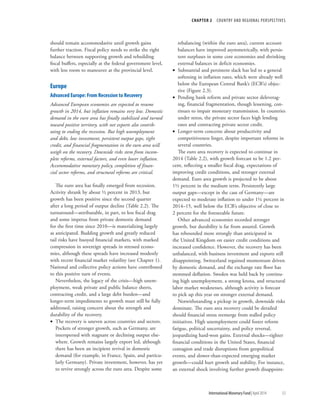
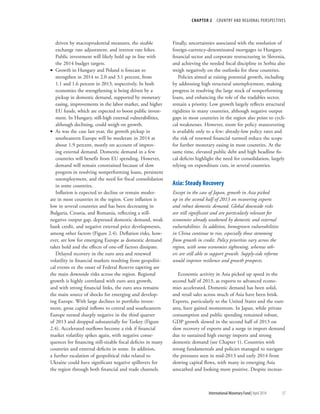
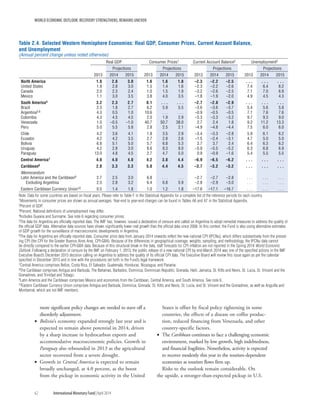
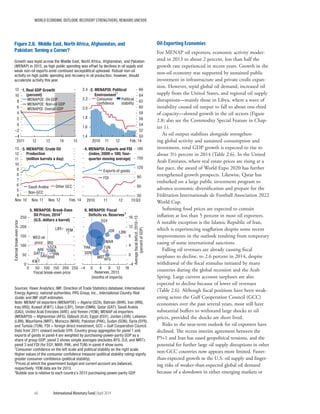
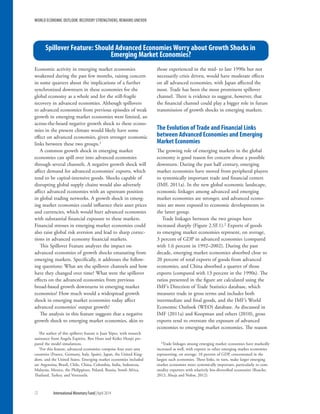
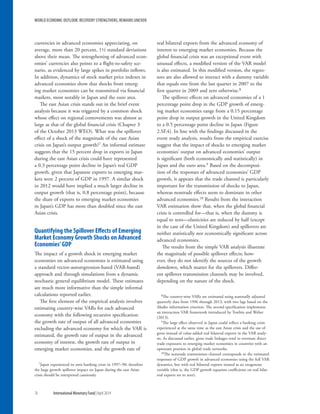
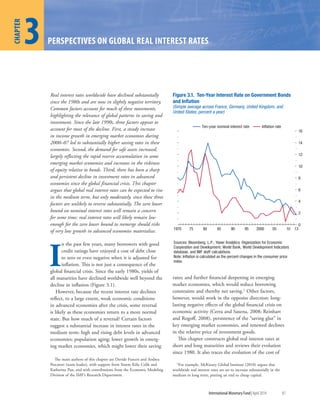
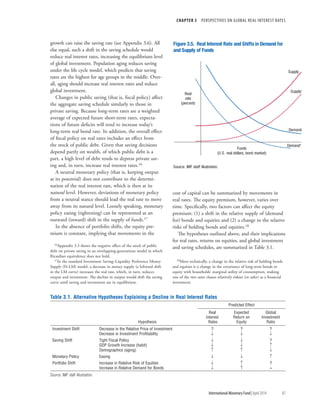
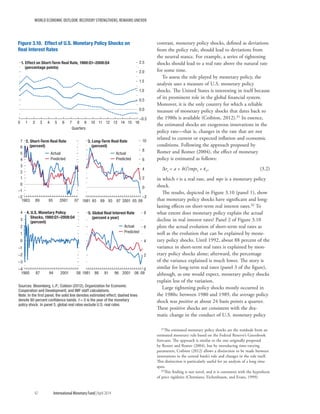
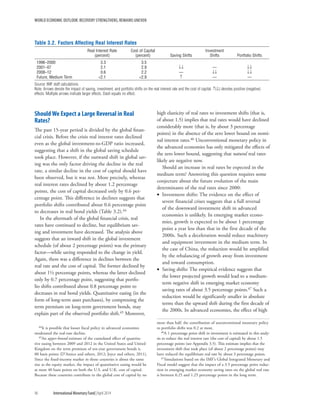
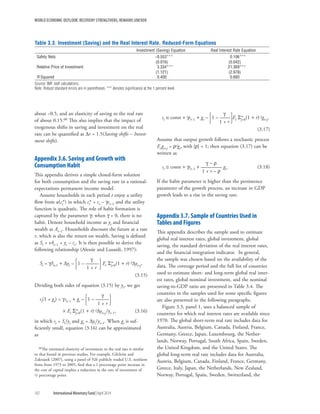
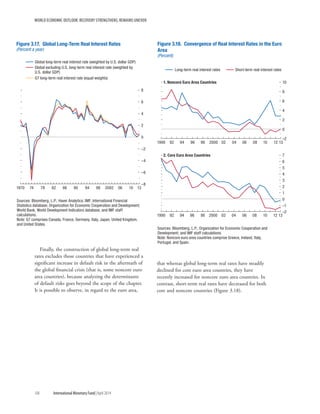
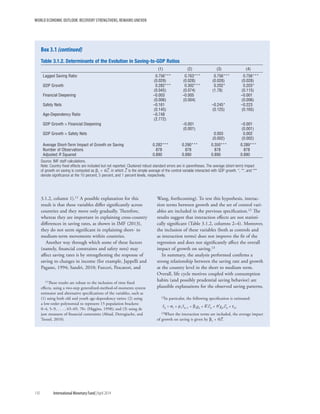
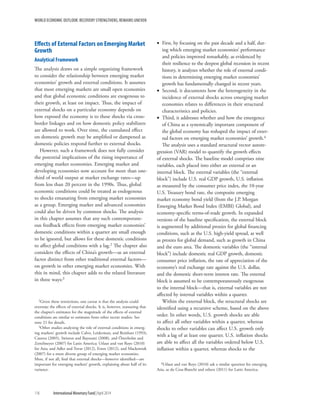
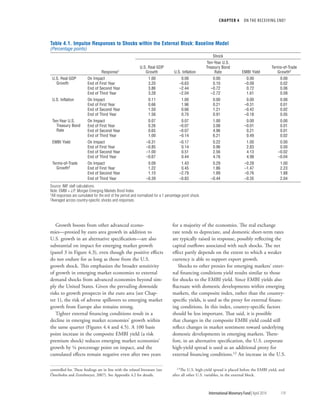
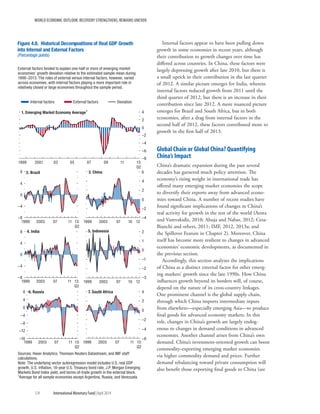
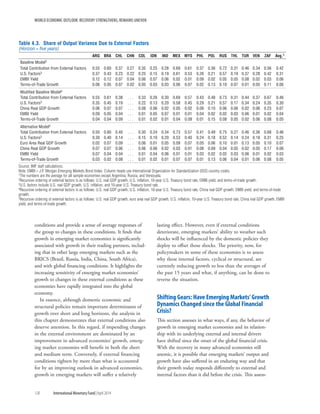
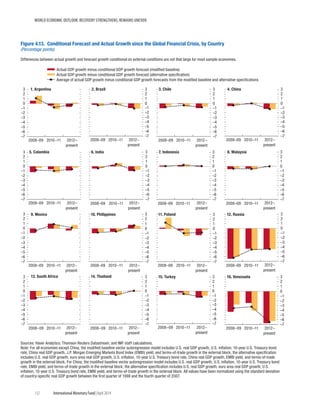
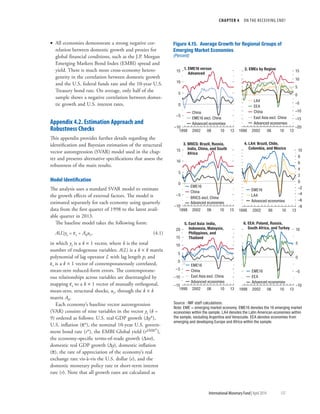
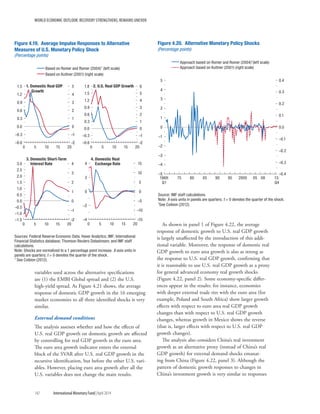
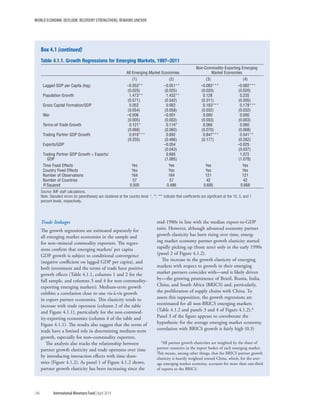
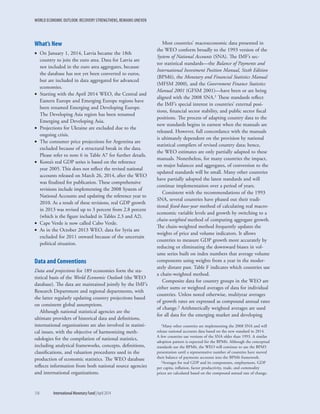
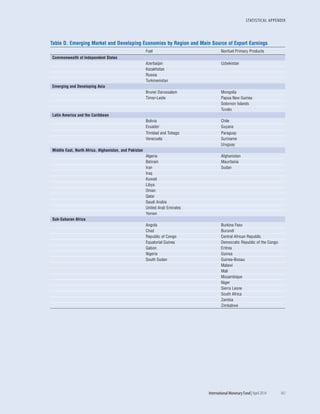
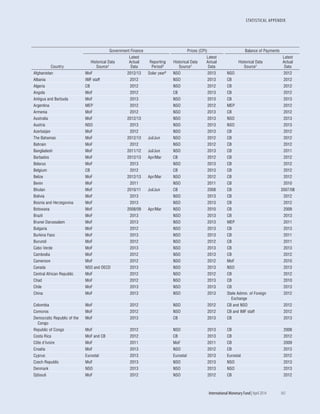
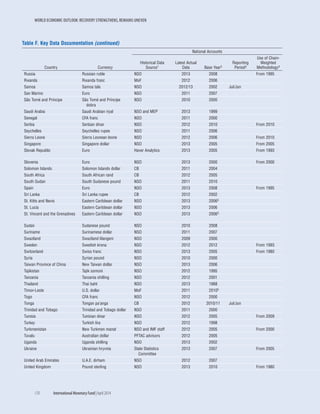
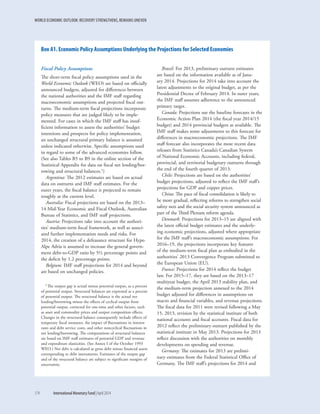
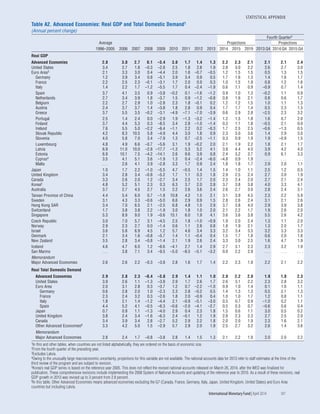
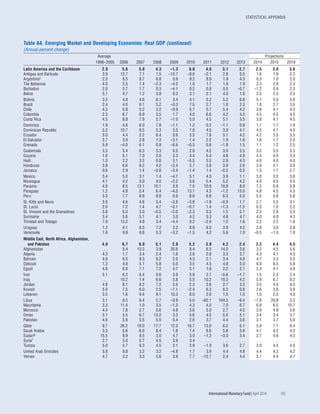
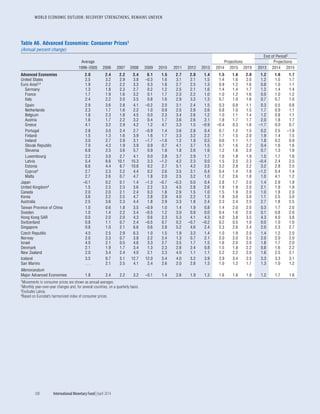
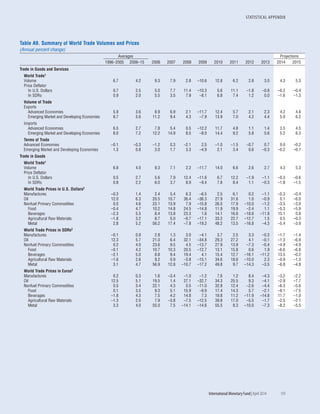
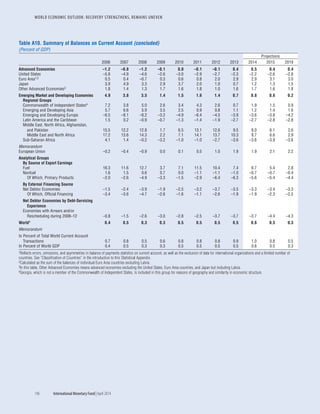
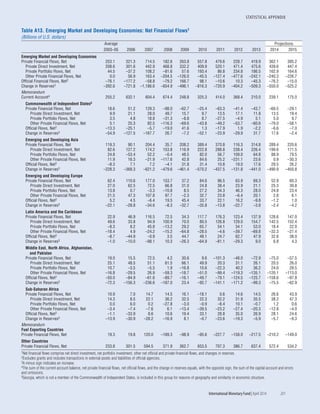
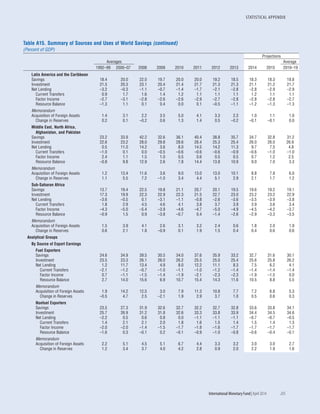
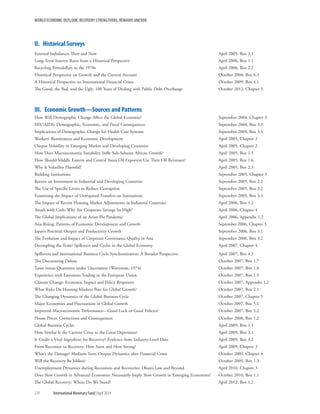
•• Panel 1 of Figure 3.9 shows the historical evolu-
tion of world public sector saving as a percentage
of world GDP. The global public saving ratio rose
during the mid- to late 1980s and mid- to late
1990s, broadly reflecting the profile of the advanced
economy ratio (Figure 3.9, panels 2 and 3).
•• Figure 3.9 (panel 4) shows expected fiscal posi-
tions, as represented by WEO forecasts. These, too,
improved considerably in the second part of the
1990s.27
•• Finally, following Blanchard and Summers (1984)
and Blanchard (1985), a forward-looking index is
constructed that depends on the current level of debt
and ten-year forecasts of primary deficits. A decrease
in the index over time indicates a reduction in private
wealth due to fiscal policy and, thus, a positive shift in
total saving.28 The evolution of the aggregate index for
advanced economies shows a decline of 2.1 percentage
points from 1994 to 2000 (Figure 3.9, panel 5).29
Thus, the evidence regarding all three channels indi-
cates that advanced economy fiscal policies contributed
significantly to the decline in real interest rates in the
1990s. Outside of that decade, however, they had the
opposite effect. The fact that real rates nevertheless
continued to decline during the 2000s means that
other factors more than offset the effect of fiscal policy.
Monetary Policy
To the extent that monetary policy is neutral (that is,
keeping output at its potential), it does not contribute
to the determination of the real interest rate, which
is then anchored at its natural level. In practice, it is
reasonable to assume that whenever a central bank
does not deviate from the systematic behavior implied
by its long-standing monetary policy rule, its stance
is approximately neutral across business cycles.30 In
27These forecasts are available beginning in 1990, but unfortu-
nately only for advanced economies.
28The index is constructed as xt = 0.1[bt + ∑∞
i=0(1.1)–ipdt,t+i], in
which pdt,t+i is the WEO forecast for the primary-deficit-to-GDP
ratio in year t + i, and bt is the debt-to-GDP ratio at time t. See
Appendix 3.3 for details.
29This suggests an arc elasticity of about 0.21. In all other periods,
the index has increased, putting upward pressure on real rates.
30This is clearly an approximation. For example, over the business
cycle, whenever there is a trade-off between output gap and inflation
stabilization, the monetary authority has too few instruments to
achieve the first-best allocation. This, in turn, implies that over the
cycle, the actual real rate cannot be equal to the natural (Wicksell-
ian) rate.
Sources: Organization for Economic Cooperation and Development; World
Bank, World Development Indicators database; and IMF staff calculations.
Figure 3.9. Effect of Fiscal Policy on Real Interest Rates
(Percent of GDP)
Public-saving-to-GDP ratio
Public saving net of interest as percent of GDP
2
4
6
8
10
12
14
16
1990 96 2002 08 13
5. Advanced Economies,
Fiscal Index Based
on Debt and
Expected Deficits
–9
–6
–3
0
3
1990 94 98 02 06 10 13
4. Advanced Economies,
Expected Deficits
Five-year-ahead
forecasts
Average of one- to
five-year-ahead
forecasts
–3
–2
–1
0
1
2
3
4
5
6
1980–84 1990–94 2000–04 2010–12
0
2
4
6
8
10
12
1980–84 1990–94 2000–04 2010–12
–2
–1
0
1
2
3
4
5
6
1980–84 1985–89 1990–94 1995–99 2000–04 2005–09 2010–12
1. World
2. Advanced Economies 3. Emerging Market
Economies](https://image.slidesharecdn.com/worldeconomicoutlook-2014-140719164259-phpapp01/85/World-Economic-Outlook-2014-IMF-109-320.jpg)
![CHAPTER 3 PERSPECTIVES ON GLOBAL REAL INTEREST RATES
International Monetary Fund|April 2014 99
Appendix 3.1. Model-Based Inflation and
Dividend Growth Expectations
This appendix describes the empirical methodology
used to construct real interest rates and real returns
on equity for an unbalanced sample of 25 advanced
economies and 15 emerging market economies from
1970 through 2013.
Real Interest Rates
Real rates can be approximated by computing the
difference between the nominal bond yield and the
relevant inflation expectations. Survey information
and forecasts from an estimated autoregressive process
for inflation are used to obtain inflation expectations
(model-based inflation expectations).
In particular, model-based inflation expectations
over any horizon j are estimated using a monthly
autoregressive process AR(p) for the variable gt =
lnPt − lnPt–12, in which P is the consumer price index
and p = 12 is the order of the process. The AR(p)
process is estimated on a rolling window of 60 months
to minimize the effect of parameter instability. Using
out-of-sample forecasts of gt, Et lnPt+j – lnPt, which is
the inflation expectation at time t for the period t + j,
is calculated.55
Real rates are then constructed as
(1 – g)
rt
[n] = it
[n] – ——— Sn
i=1 giEtpt,t+i, (3.3)
(1 – gn)
with g = (1 + I
–
)–i, in which rt
[n] and it
[n] are the real and
nominal rates, respectively, on a bond of maturity n;
Etpt,t+i is the inflation expectation at time t for period
t + i; and I
–
is the average nominal rate for the period
examined. In sum, the real rate is defined as the nomi-
nal rate minus the weighted average inflation expecta-
tion over the entire life of the bond.
Real Returns on Equity
The real required internal rate of return on equity in
period t for horizon n is estimated as
St/Dt = Sn
j=0(1 + Re,t
[n])–j Et gt,t+1+j, (3.4)
55This methodology produces smaller forecast errors, and matches
survey expectations better, than an autoregressive process with con-
sumer price index log differences over the previous month, a vector
autoregression (VAR) with commodity prices, and a VAR with GDP
growth.
in which S is an equity price index and gt,t+j = Dt+j/Dt
is cumulated dividend growth, consistent with the
equity index chosen. Stated roughly, the expected
return on equity (Re,t
[n]) is equal to the dividend
yield plus the expected long-term growth rate of
real dividends. Expected dividend growth rates
are constructed by estimating a quarterly bivariate
VAR(p) of dividend and GDP growth, with p = 4.
The VAR(p) process is estimated on a rolling window
of 60 months to minimize the effect of parameter
instability.
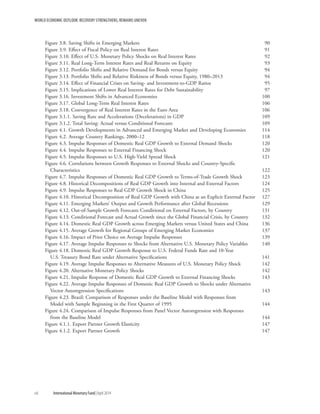
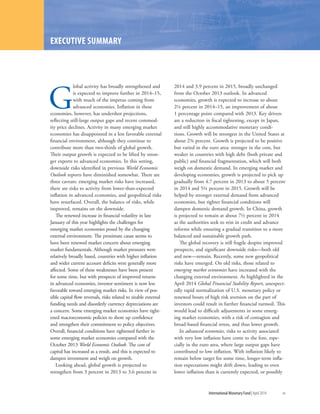
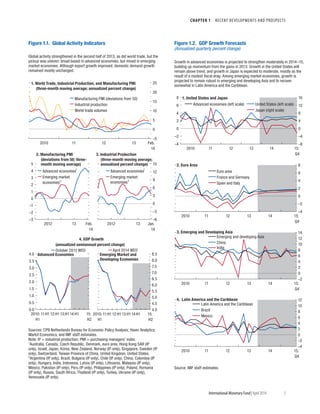
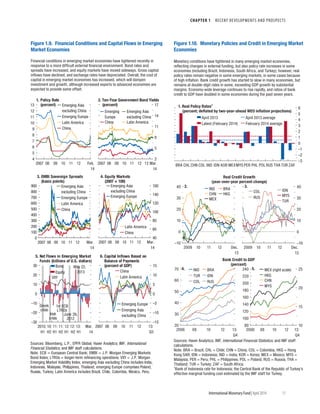
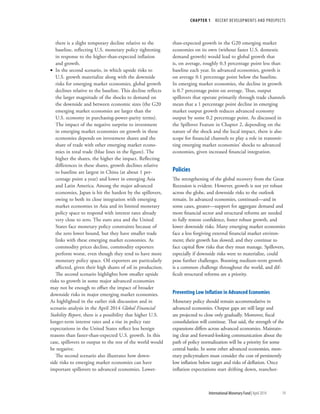
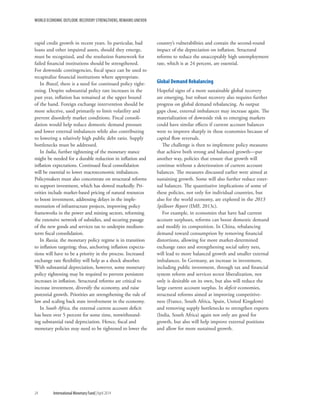
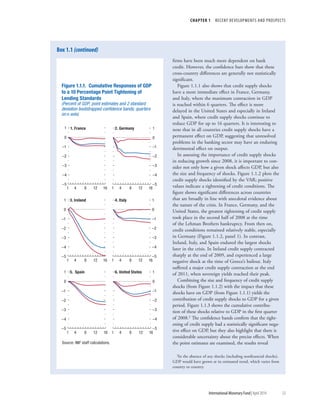
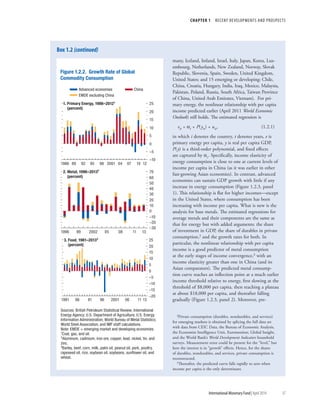
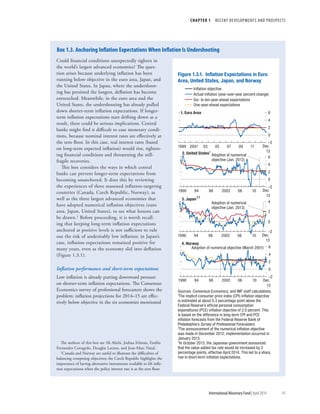
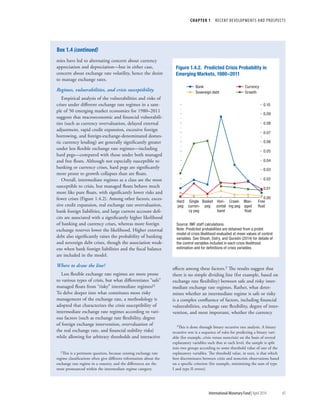
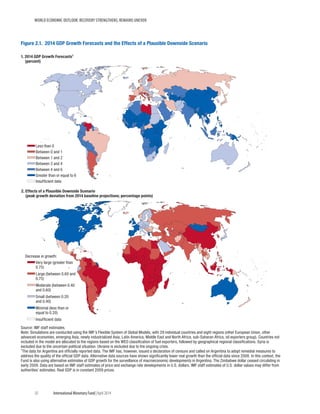
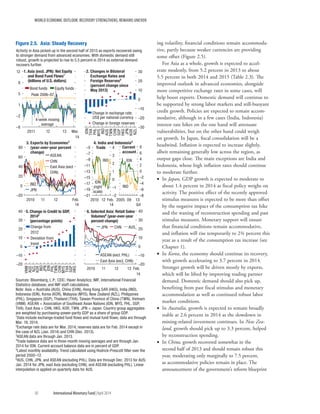
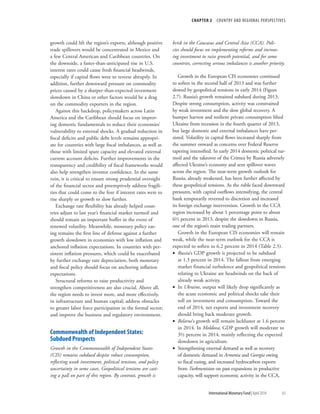
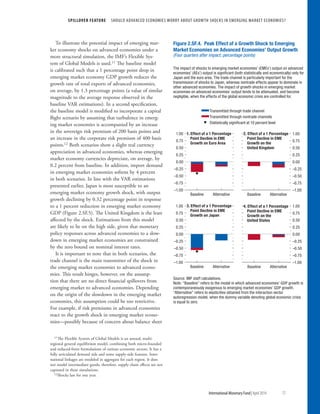
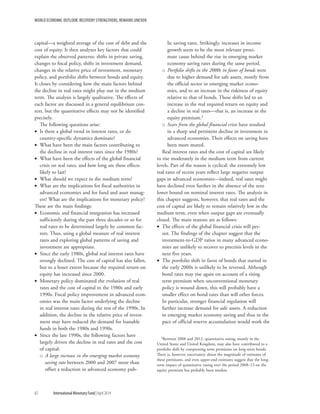
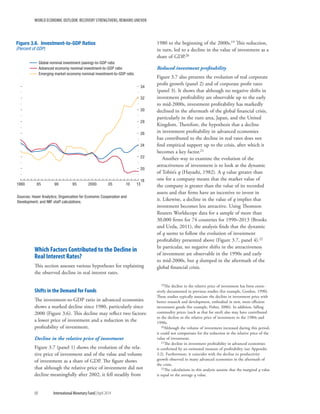
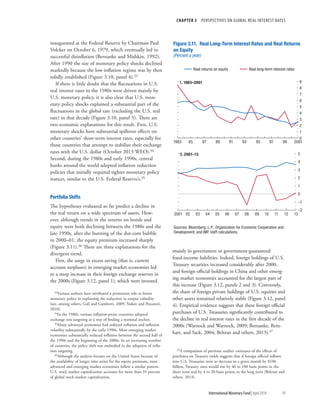
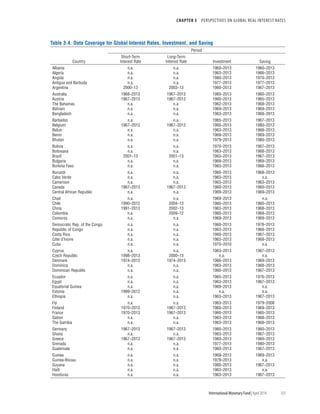
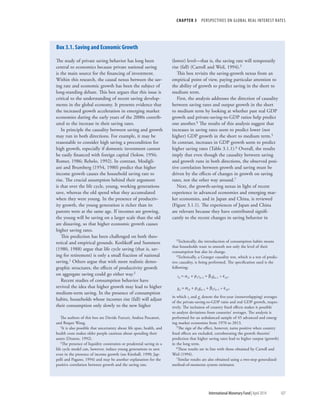
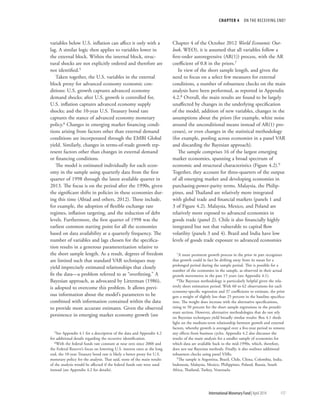
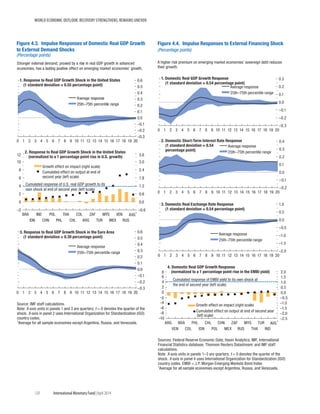
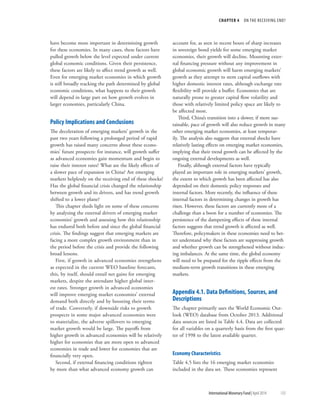
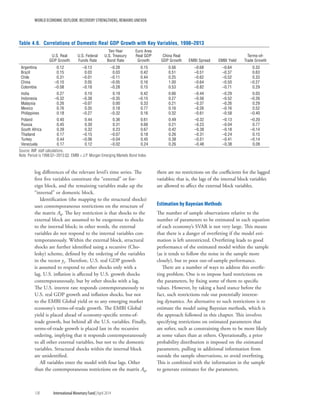
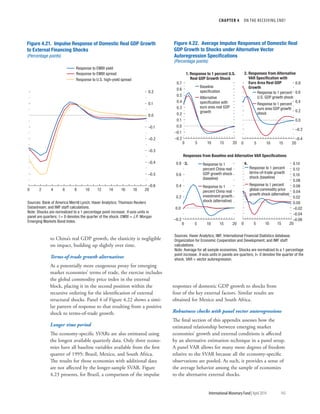
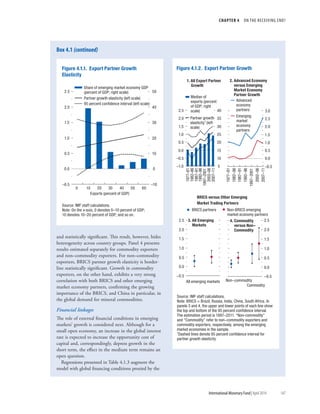
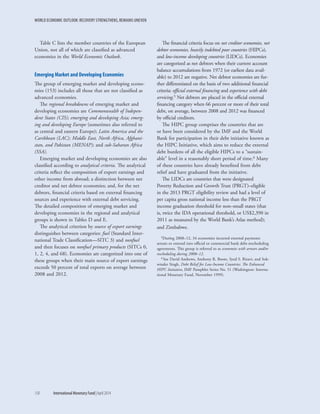
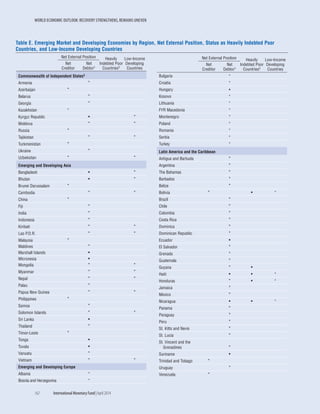
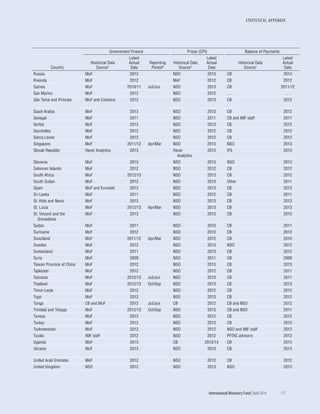
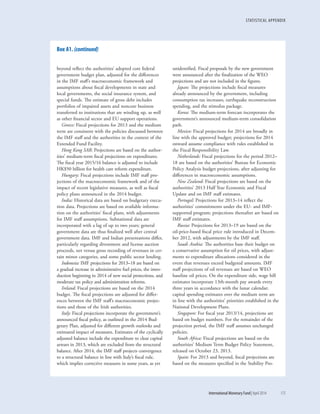
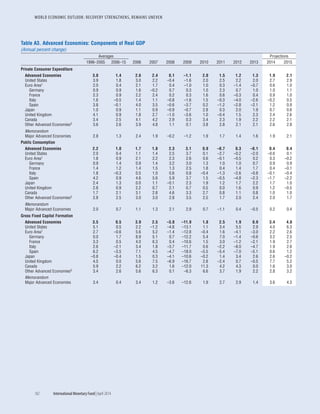
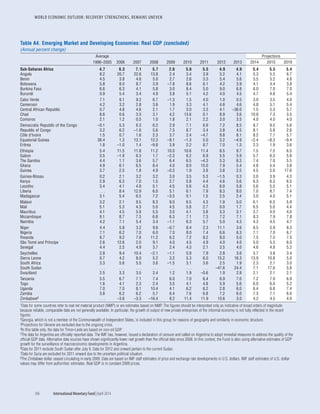
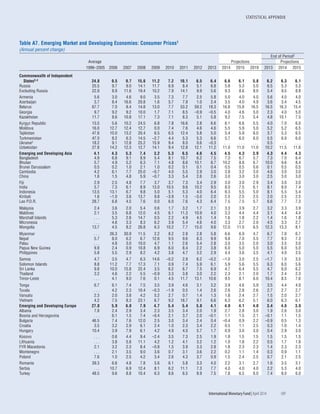
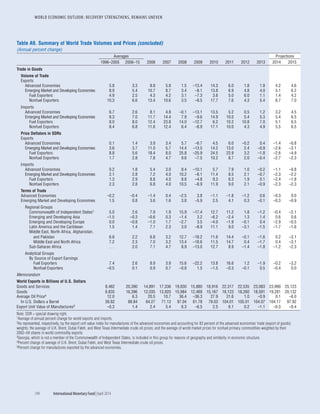
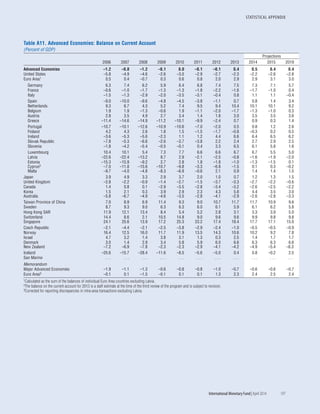
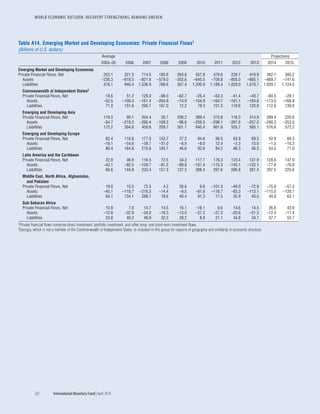
Appendix 3.2. Investment Profitability
One possible explanation for the decrease in invest-
ment-to-GDP ratios in many advanced economies
is that investment profitability has declined. Various
factors can explain shifts in investment profitability
(including changes in business taxation, factor prices,
productivity, and uncertainty), and quantifying them
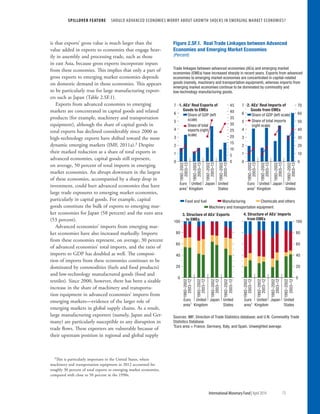
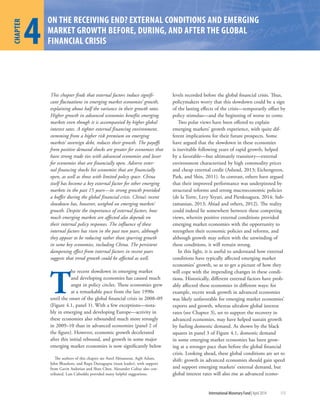
is difficult. As an alternative, the analysis assesses
whether the reduction in the investment-to-GDP
ratio can be attributed to the unexpected strengthen-
ing of GDP or instead to an anticipated decline in
profitability. To discriminate between these two fac-
tors, following Blanchard and Summers (1984), the
following regression is estimated for each country in
the sample:
ln It = a + S2
i=0 bilnYt–i + ut, (3.5)
in which
ut = rut–1 + et, (3.6)
with I denoting real private investment and Y real
GDP. Under the hypothesis that there has been
a negative shift in expected profitability, invest-
ment should have declined more than predicted by
the evolution in output, thus implying a negative
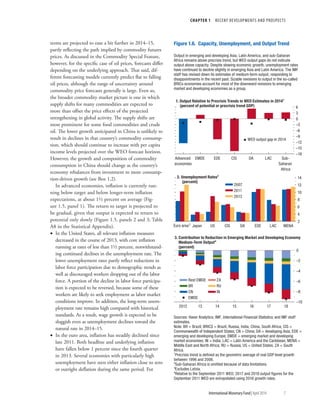
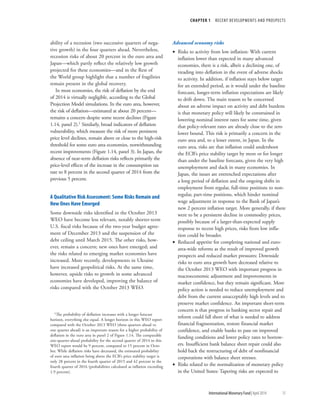
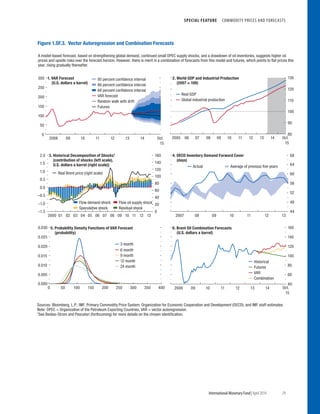
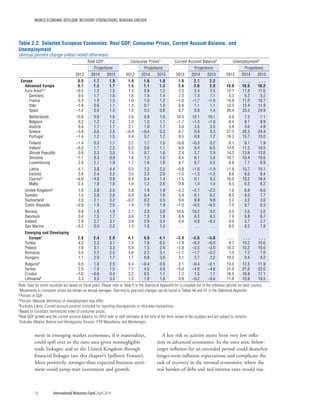
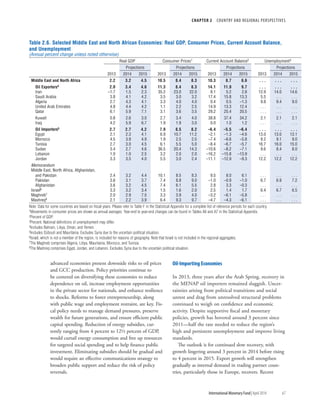
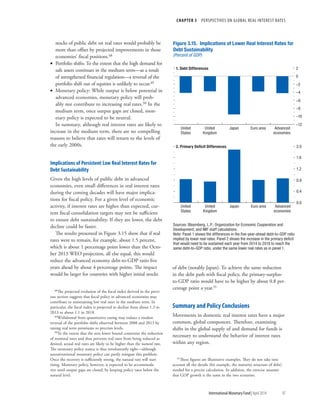
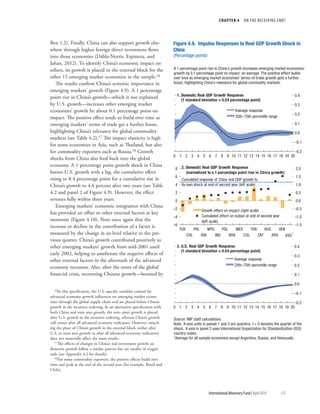
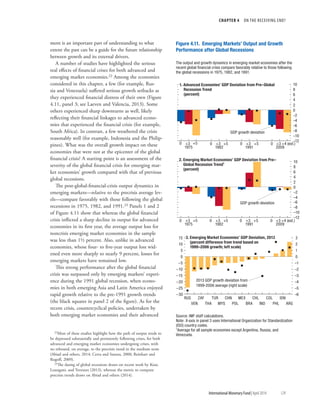
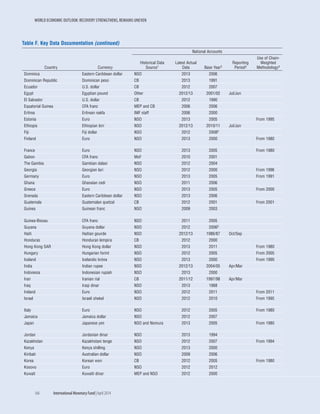
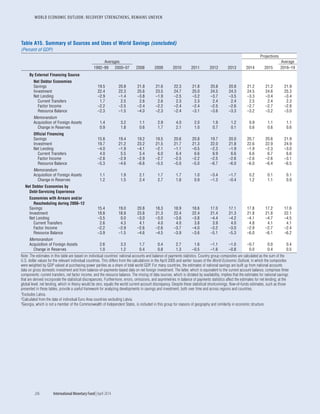
forecast error eˆt. Panel 1 of Figure 3.16 presents the
aggregated forecast errors for advanced economies.
The figure suggests that the hypothesis that a decline
in investment profitability has contributed to the
decline in real interest rates does not find empirical
support up to the global financial crisis, after which
it becomes a key factor. A similar conclusion can be
reached by looking at the evolution of total factor
productivity (Figure 3.16, panel 2).](https://image.slidesharecdn.com/worldeconomicoutlook-2014-140719164259-phpapp01/85/World-Economic-Outlook-2014-IMF-117-320.jpg)
![WORLD ECONOMIC OUTLOOK: RECOVERY STRENGTHENS, REMAINS UNEVEN
100 International Monetary Fund|April 2014
Appendix 3.3. Fiscal Indicator
This appendix describes the framework for assessing
the impact of debt on total saving and real interest
rates. As noted in the chapter text, measuring the
impact of fiscal policy on real rates requires looking
not only at current and future anticipated deficits, but
also at the level of the stock of public debt. Following
Blanchard and Summers (1984) and Blanchard (1985),
a fiscal index is derived.
In a standard life cycle model, consumption is
related to wealth. Formally, this can be formulated as
C = ω[K + B + p(W − T; r + p)], (3.7)
in which C denotes consumption, K + B financial
wealth, ω the marginal propensity to consume out of
wealth, and p(W − T; r + p) the present value of after-
tax labor income discounted at rate r + p. The term r
is the real interest rate, and p is a myopia coefficient,
reflecting the mortality of current consumers or their
myopia about the future. Focusing on the share of
aggregate demand (X ) that depends directly on fiscal
policy and subtracting the present value of government
spending yields
X = ω[B + p(D; r + p)] + [G – ωp(G; r + p)], (3.8)
in which G is government spending, and D denotes
primary deficits. The first term of equation (3.8)
represents the effect of debt and government finance
on demand; the second term represents the effect of
government spending financed by current taxes.
If consumers are not myopic (p = 0), the first term
of equation (3.8) is equal to zero, because consumers
fully anticipate the fiscal implications of the govern-
ment’s budget constraint: if consumers discount future
taxes at the interest rate, the timing of a change in
taxes does not affect their level of spending (Ricardian
equivalence). If consumers are myopic, however, the
first term is positive, because they do not fully antici-
pate that taxes will go up to finance higher interest
payments on the stock of public debt.
To construct an empirical counterpart of X, given
the more limited reliability of forecasts for G, the
focus is on the first term of equation (3.8). Dividing
each term of equation (3.8) by GDP and focusing on
the first term of the equation, equation (3.8) can be
rewritten as
x = ω[b + p(d; r + p – g)], (3.9)
in which lowercase letters indicate shares of GDP, and
g is the rate of GDP growth. Assuming a value for ω
equal to 0.1, and a value of r + p – g equal to 10 per-
cent a year,56 the empirical index is determined as
xt = 0.1[bt + S∞
i=0(1.1)–ipdt,t+i], (3.10)
in which bt is the stock of public debt at time t, and
pdt,t+i is the forecast of primary deficits at time t for
the period t + i. In particular, anticipated deficits are
constructed using WEO forecasts. These forecasts are
available beginning only in 1990, and they should, in
principle, incorporate changes in current policies, as
well as forecasts of output growth and the evolution
of debt and interest payments over time. However,
because the forecasts are available only for a time hori-
zon of five years, the ratio of deficits to GDP for year
56The value is chosen as in Blanchard and Summers (1984) and
is based on Hayashi’s (1982) estimates. Although choosing a differ-
ent value would affect the level of the index, it would not affect its
evolution, which is the main interest in this analysis.
–0.06
–0.04
–0.02
0.00
0.02
0.04
0.06
United States United
Kingdom
Japan Advanced
economies
Euro area
Figure 3.16. Investment Shifts in Advanced Economies
1981–90 1991–2000 2001–07 2008–13
1. Estimated Investment Profitability Forecast Errors, 1980–2013
–1.5
–1.0
–0.5
0.0
0.5
1.0
1.5
2.0
2.5
3.0
3.5
4.0
OECD United
Kingdom
Japan United
States
France Germany Italy
1991–2000 2001–07 2008–13
2. Productivity Growth, 1991–2013
(percent)
Sources: Haver Analytics; Organization for Economic Cooperation and
Development (OECD); World Bank, World Development Indicators database;
and IMF staff calculations.
Note: Investment profitability is computed as described in the appendix text.](https://image.slidesharecdn.com/worldeconomicoutlook-2014-140719164259-phpapp01/85/World-Economic-Outlook-2014-IMF-118-320.jpg)


![CHAPTER 4 ON THE RECEIVING END?
International Monetary Fund|April 2014 139
The prior used in this chapter is a so-called Min-
nesota prior, inspired by Litterman (1986), in which
each variable is assumed to follow a first-order autore-
gressive (AR(1)) process with independent, normally
distributed errors. Given that the variables have already
been transformed to induce stationarity, a random
walk, with a unit AR(1) coefficient for the prior, would
not be appropriate. Simple AR(1) regressions, however,
do suggest estimated AR(1) coefficients of about 0.8,
which is the AR(1) coefficient used in the prior for the
baseline estimation. Some of this persistence reflects
the fact that all growth rates are calculated as year-
over-year differences.
The weight of the prior versus the sample in the
estimation is determined according to the Bayesian
approach presented in Sims and Zha (1998). If twice
the number of parameters to be estimated in an equa-
tion is greater than the estimation sample size, the
chapter applies a rule of thumb that gives the prior a
(T – p)
relative weight of 1 – ————∈ [0,1], in which
2(kp + 1)
T is the number of available sample observations and k
and p are defined as above.25
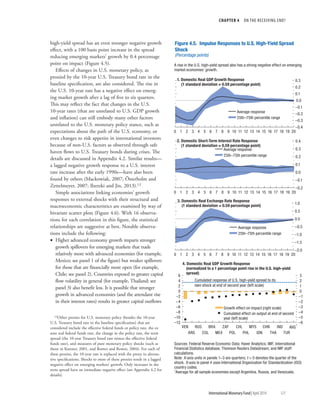
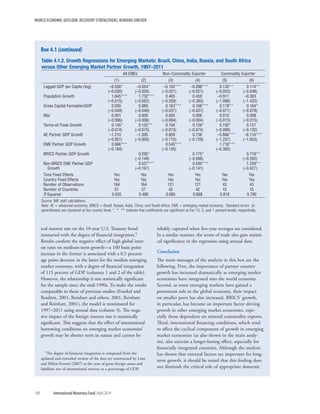
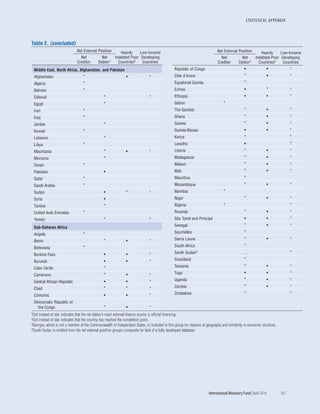
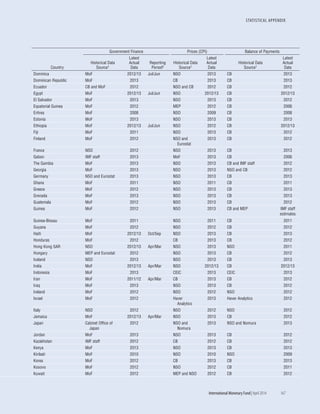
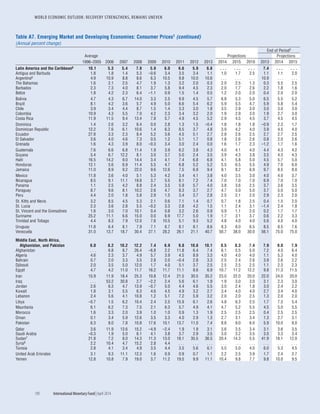
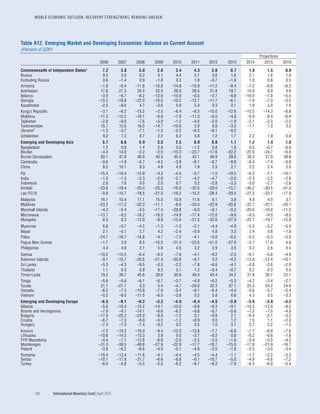
Figure 4.16 compares the average baseline SVAR
results using the AR(1) priors with those from an
alternative white-noise prior. As expected, with a
white-noise prior, the impulse responses show lower
persistence and amplitude. The conditional out-of-
sample forecasts from these specifications are largely
similar to those shown in Figures 4.12 and 4.13,
although the forecast performance improves with a
less persistent prior for some economies (for example,
Malaysia, Mexico, and the Philippines).
Robustness of the Baseline Results
A variety of alternative specifications are used to assess
the robustness of the main results. In particular, a
number of additional variables are introduced as prox-
ies for external demand, U.S. monetary policy, external
financing conditions, and the terms of trade. The
results are described in the following.
25In the case of China, there are 60 observations for the reduced-
form VAR. With 37 coefficients to estimate, the priors receive
a weight (importance) of slightly less than 0.25 in the baseline
specification (and a maximum weight of 0.50 in the specification for
out-of-sample forecasting reported in the chapter text).
Alternative U.S. monetary policy measures
As described in the chapter, alternative proxies for global
financing conditions are tried to assess the robustness
of the findings: the 10-year U.S. Treasury bond rate,
which is in the baseline specification (see Figure 4.16);
and alternative specifications in which the 10-year U.S.
Treasury bond rate is replaced by (1) the U.S. effec-
tive federal funds rate; (2) the ex ante U.S. real federal
funds rate; (3) the change in the U.S. federal funds rate;
(4) the U.S. term spread (defined as the 10-year U.S.
Treasury bond rate minus the U.S. federal funds rate);
(5) Kuttner (2001)–style unanticipated monetary policy
shocks, inferred from the behavior of federal funds
futures; and (6) an extension of the Romer and Romer
(2004) exogenous monetary policy shock series, based
on Coibion (2012).
–0.01
0.00
0.01
0.02
0.03
0.04
0.05
0 5 10 15 20
–0.4
–0.3
–0.2
–0.1
0.0
0.1
0.2
0 5 10 15 20
–0.2
–0.1
0.0
0.1
0.2
0.3
0.4
0.5
0.6
0 5 10 15 20
Figure 4.16. Impact of Prior Choice on Average Impulse
Responses
(Percentage points)
Baseline specification: AR(1) prior, ρ = 0.8
Alternative specification: white-noise prior
4. Terms-of-Trade
Growth Shock
1. U.S. GDP Growth
Shock
2. U.S. Treasury Bond
Rate Shock
3. EMBI Spread Shock
–0.6
–0.4
–0.2
0.0
0.2
0.4
0.6
0.8
0 5 10 15 20
Source : IMF staff calculations.
Note: AR(1) = first-order autoregression; EMBI = J.P. Morgan Emerging Markets
Bond Index. Shocks are normalized to a 1 percentage point increase. X-axis units are
quarters; t = 0 denotes the quarter of the shock.](https://image.slidesharecdn.com/worldeconomicoutlook-2014-140719164259-phpapp01/85/World-Economic-Outlook-2014-IMF-157-320.jpg)


![SELECTED TOPICS
International Monetary Fund|April 2014 213
Improved Emerging Market Fiscal Performance: Cyclical or Structural? September 2006, Box 2.1
When Does Fiscal Stimulus Work? April 2008, Box 2.1
Fiscal Policy as a Countercyclical Tool October 2008, Chapter 5
Differences in the Extent of Automatic Stabilizers and Their Relationship with Discretionary Fiscal Policy October 2008, Box 5.1
Why Is It So Hard to Determine the Effects of Fiscal Stimulus? October 2008, Box 5.2
Have the U.S. Tax Cuts Been “TTT” [Timely, Temporary, and Targeted]? October 2008, Box 5.3
Will It Hurt? Macroeconomic Effects of Fiscal Consolidation October 2010, Chapter 3
Separated at Birth? The Twin Budget and Trade Balances September 2011, Chapter 4
Are We Underestimating Short-Term Fiscal Multipliers? October 2012, Box 1.1
The Implications of High Public Debt in Advanced Economies October 2012, Box 1.2
The Good, the Bad, and the Ugly: 100 Years of Dealing with Public Debt Overhangs October 2012, Chapter 3
The Great Divergence of Policies April 2013, Box 1.1
Public Debt Overhang and Private Sector Performance April 2013, Box 1.2
VI. Monetary Policy, Financial Markets, and Flow of Funds
Adjustable- or Fixed-Rate Mortgages: What Influences a Country’s Choices? September 2004, Box 2.2
What Are the Risks from Low U.S. Long-Term Interest Rates? April 2005, Box 1.2
Regulating Remittances April 2005, Box 2.2
Financial Globalization and the Conduct of Macroeconomic Policies April 2005, Box 3.3
Monetary Policy in a Globalized World April 2005, Box 3.4
Does Inflation Targeting Work in Emerging Markets? September 2005, Chapter 4
A Closer Look at Inflation Targeting Alternatives: Money and Exchange Rate Targets September 2005, Box 4.1
How Has Globalization Affected Inflation? April 2006, Chapter 3
The Impact of Petrodollars on U.S. and Emerging Market Bond Yields April 2006, Box 2.3
Globalization and Inflation in Emerging Markets April 2006, Box 3.1
Globalization and Low Inflation in a Historical Perspective April 2006, Box 3.2
Exchange Rate Pass-Through to Import Prices April 2006, Box 3.3
Trends in the Financial Sector’s Profits and Savings April 2006, Box 4.2
How Do Financial Systems Affect Economic Cycles? September 2006, Chapter 4
Financial Leverage and Debt Deflation September 2006, Box 4.1
Financial Linkages and Spillovers April 2007, Box 4.1
Macroeconomic Conditions in Industrial Countries and Financial Flows to Emerging Markets April 2007, Box 4.2
Macroeconomic Implications of Recent Market Turmoil: Patterns from Previous Episodes October 2007, Box 1.2
What Is Global Liquidity? October 2007, Box 1.4
The Changing Housing Cycle and the Implications for Monetary Policy April 2008, Chapter 3
Is There a Credit Crunch? April 2008, Box 1.1
Assessing Vulnerabilities to Housing Market Corrections April 2008, Box 3.1
Financial Stress and Economic Downturns October 2008, Chapter 4
Policies to Resolve Financial System Stress and Restore Sound Financial Intermediation October 2008, Box 4.1
The Latest Bout of Financial Distress: How Does It Change the Global Outlook? October 2008, Box 1.1
How Vulnerable Are Nonfinancial Firms? April 2009, Box 1.2
The Case of Vanishing Household Wealth April 2009, Box 2.1
Impact of Foreign Bank Ownership during Home-Grown Crises April 2009, Box 4.1
A Financial Stress Index for Emerging Economies April 2009, Appendix 4.1
Financial Stress in Emerging Economies: Econometric Analysis April 2009, Appendix 4.2
How Linkages Fuel the Fire April 2009, Chapter 4](https://image.slidesharecdn.com/worldeconomicoutlook-2014-140719164259-phpapp01/85/World-Economic-Outlook-2014-IMF-231-320.jpg)


The World Economic Outlook report from April 2014 discusses the strengthening yet uneven recovery of the global economy post-financial crisis, highlighting varied growth projections across regions. The document outlines economic developments, risks, and policy considerations, emphasizing the need for targeted policies to support growth in advanced and emerging market economies. Key themes include commodity price fluctuations, real interest rates, and the impact of external factors on emerging market growth dynamics.


![Awareness of digital currency[1] (1).pptx](https://cdn.slidesharecdn.com/ss_thumbnails/awarenessofdigitalcurrency11-260125155504-b1badee4-thumbnail.jpg?width=640&height=640&fit=bounds)


