Download to read offline

![INDIVIDUAL COUNTRY PROFILES
Table of contents Introduction
Chapter 1
Key Findings
from the Report
Chapter 2
Country Statistical
Profiles
List of Country
Statistical Profiles
31
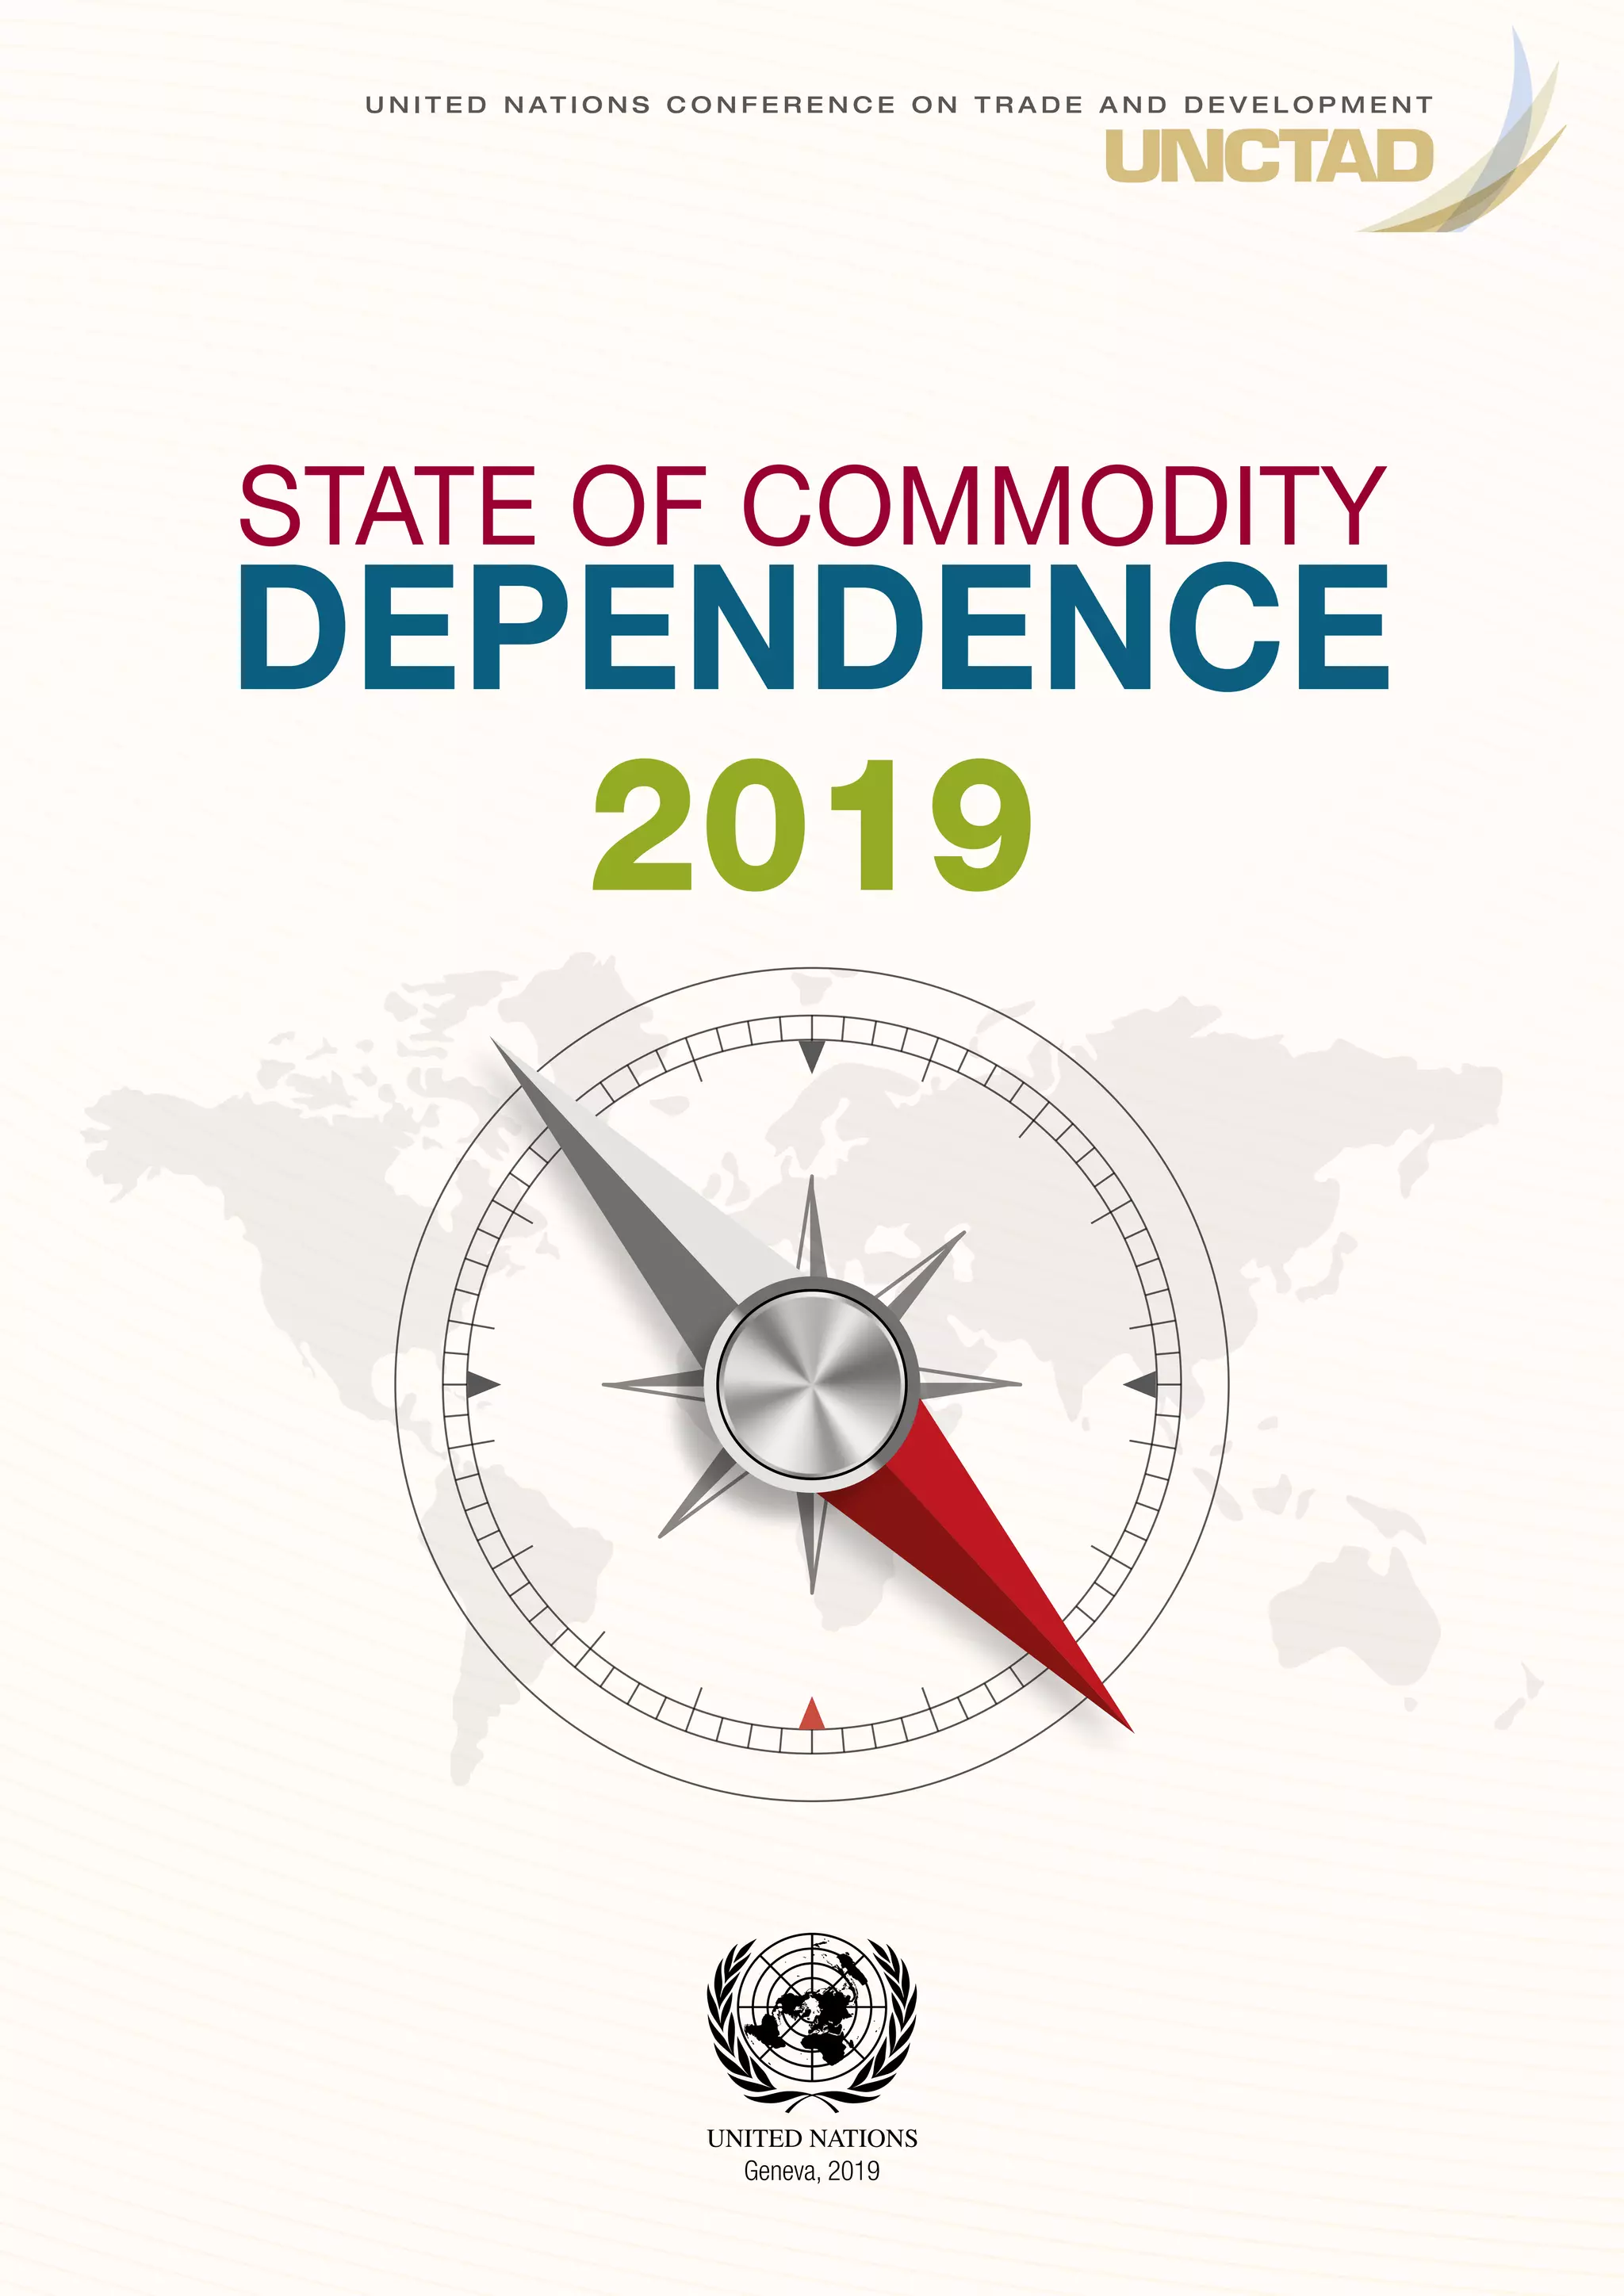
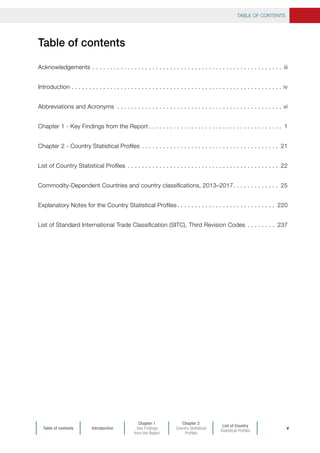
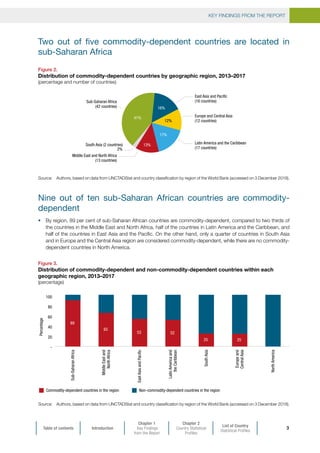
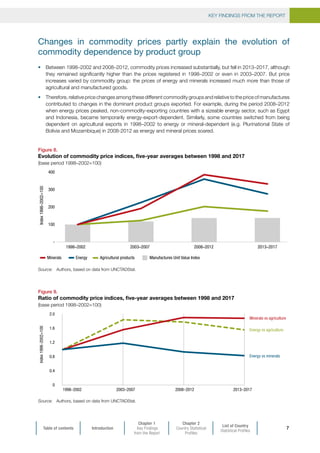
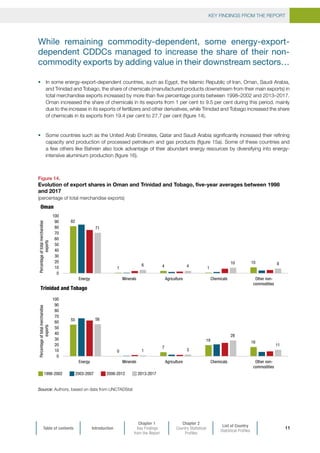
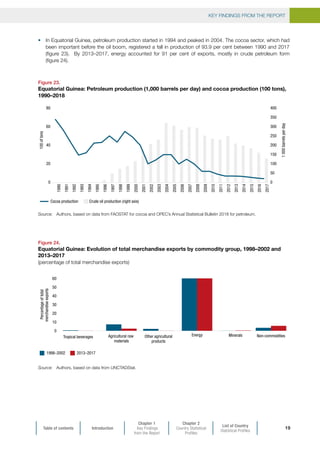
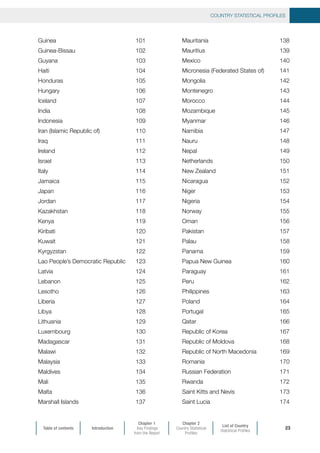
AFGHANISTAN*
1995 2013-2017 2017
Merchandise export value (millions of US dollars) 166 591 700
Unallocated exports (as a share of merchandise exports) 2.2 13.0 3.5
Merchandise export concentration by product line (Herfindahl-Hirschmann index) 0.3399 0.3146 0.3500
Commodity export value (millions of US dollars) 132 469 628
Commodity exports (as a share of total merchandise exports) 80 79 90
Commodity exports (as a share of GDP) 4.1 2.2 2.9
Total natural resources rents (as a share of GDP) .. 0.7 0.6
Exports by commodity group (as a share of merchandise exports) 80 79 90
Agricultural commodities 77 59 66
Fuels – 7 8
Ores, metals, precious stones and non-monetary gold 2 13 15
Three leading commodity exports (as a share of total merchandise exports) 19 43 50
[057] Fruits and nuts (excluding oil nuts), fresh or dried 17 27 33
[292] Crude vegetable materials, n.e.s. 2 9 9
[321] Coal, whether or not pulverized, not agglomerated – 7 8
Average price index of the leading commodity group exported 80.8 109.0 102.7
Five leading destination markets of commodity exports (as a share of total commodity exports) 91
Pakistan 41
India 31
European Union (28) 10
United Arab Emirates 8
Iran (Islamic Republic of) 2
Commodity imports (millions of US dollars) 124 3,027 3,225
Commodity imports (as a share of total merchandise imports) 32 40 44
Food imports (millions of US dollars and as a share of total merchandise imports) 64 (17) 1,919 (25) 2,052 (28)
Fuel imports (millions of US dollars and as a share of total merchandise imports) 27 (7) 921 (12) 929 (13)
Five-leading trading partners for commodity imports (as a share of total commodity imports) 70
Pakistan 29
Iran (Islamic Republic of) 16
Kazakhstan 12
Russian Federation 9
Turkmenistan 5
Percentage change of GDP measured in constant 2010 prices 49.9 19.6 2.5
GDP per capita measured in constant 2010 US dollars 410 633 624
Population (thousands) 8,926 18,676 20,165
Human Development Index (value and rank) .. 0.4926 (163) 0.4980 (165)
Total employment (as a share of the population) 47.4 49.1 49.4
Share of women in total employment 12.9 15.8 16.6
Proportion of population below international poverty line – SDG 1. Indicator 1.1.1 .. ..
Gini index, latest available year .. ..
Prevalence of undernourishment (per cent) – SDG 2. Indicator 2.1.1 46.1 30.3
Value added of agriculture/industry/services (as a share of GDP) 66/11/24 24/22/54 24/22/54
Employment in agriculture/industry/services (as a share of total employment) 79/4/17 62/7/32 62/7/31
Share of women in agriculture/industry/services 15/9/6 19/13/11 20/14/11
Institutional quality index, 2018 0.1271
Control of corruption –1.29 –1.44 –1.52
Rule of law –1.79 –1.52 –1.57
MERCHANDISE AND COMMODITY EXPORT DEPENDENCE
COMMODITY IMPORT DEPENDENCE
KEY SOCIOECONOMIC INDICATORS
OTHER STRUCTURAL INDICATORS](https://image.slidesharecdn.com/stateofcommoditydependance2019-190524115214/85/State-of-commodity-dependance-2019-37-320.jpg)
![Table of contents Introduction
Chapter 1
Key Findings
from the Report
Chapter 2
Country Statistical
Profiles
List of Country
Statistical Profiles
32
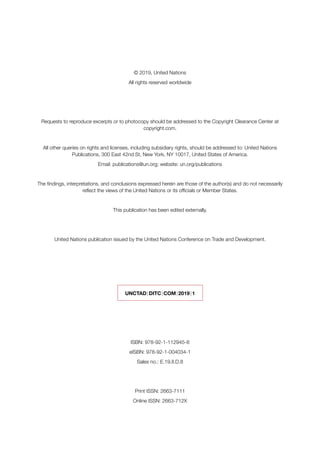
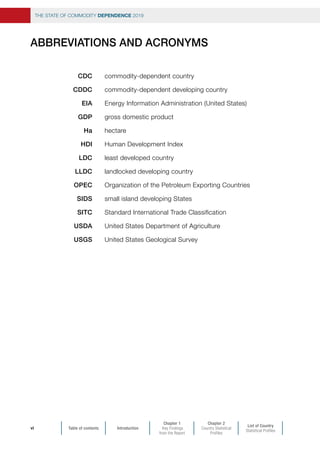
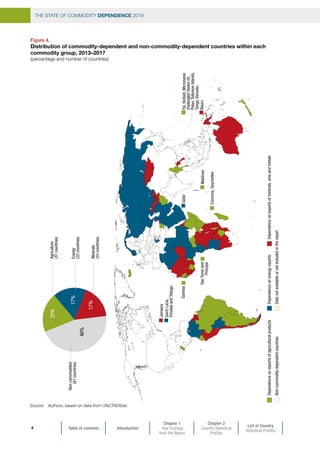
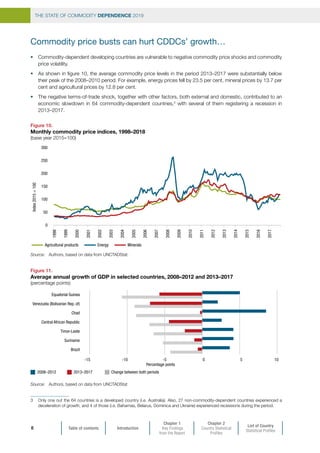
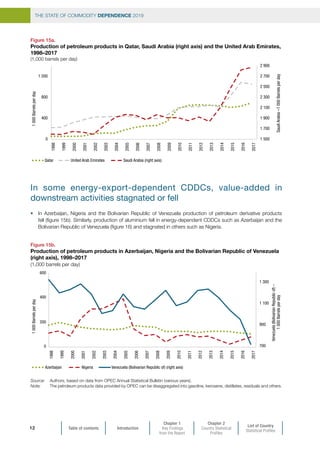
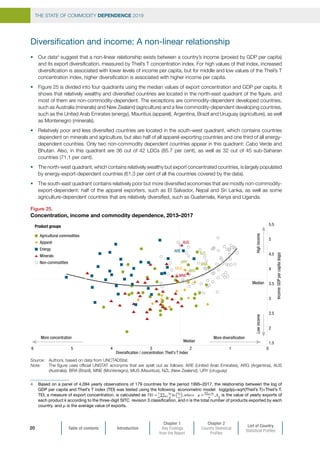
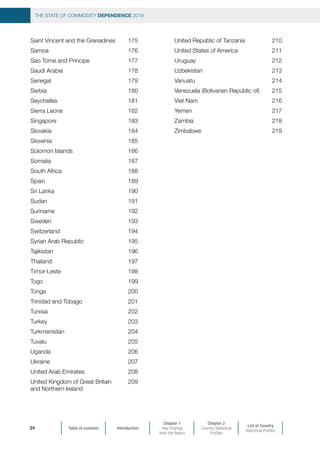
ALBANIA
1995 2013-2017 2017
Merchandise export value (millions of US dollars) 202 2,183 2,262
Unallocated exports (as a share of merchandise exports) 1.4 11.9 16.5
Merchandise export concentration by product line (Herfindahl-Hirschmann index) 0.1917 0.2601 0.2558
Commodity export value (millions of US dollars) 79 725 518
Commodity exports (as a share of total merchandise exports) 39 33 23
Commodity exports (as a share of GDP) 3.3 5.8 3.9
Total natural resources rents (as a share of GDP) 1.3 2.8 2.0
Exports by commodity group (as a share of merchandise exports) 39 33 23
Agricultural commodities 24 7 8
Fuels 3 17 7
Ores, metals, precious stones and non-monetary gold 12 9 9
Three leading commodity exports (as a share of total merchandise exports) 6 21 14
[333] Petroleum oils, oils from bitumin. materials, crude – 14 5
[287] Ores and concentrates of base metals, n.e.s. 4 5 6
[03] Fishery products 2 2 3
Average price index of the leading commodity group exported 36.5 132.1 103.8
Five leading destination markets of commodity exports (as a share of total commodity exports) 78
China 32
European Union (28) 19
United States of America 11
Serbia 9
India 6
Commodity imports (millions of US dollars) 450 1,300 1,334
Commodity imports (as a share of total merchandise imports) 63 26 23
Food imports (millions of US dollars and as a share of total merchandise imports) 374 (52) 537 (11) 456 (8)
Fuel imports (millions of US dollars and as a share of total merchandise imports) 30 (4) 554 (11) 752 (13)
Five-leading trading partners for commodity imports (as a share of total commodity imports) 79
European Union (28) 60
Serbia 8
Russian Federation 5
Turkey 4
Brazil 3
Percentage change of GDP measured in constant 2010 prices 13.3 8.6 3.8
GDP per capita measured in constant 2010 US dollars 1,746 4,499 4,775
Population (thousands) 2,092 2,389 2,420
Human Development Index (value and rank) 0.6320 (75) 0.7774 (67) 0.7850 (66)
Total employment (as a share of the population) 48.1 46.6 48.3
Share of women in total employment 40.5 42.3 42.3
Proportion of population below international poverty line – SDG 1. Indicator 1.1.1 (1996) 1.1 (2012) 1.1
Gini index, latest available year (1996) 27.0 (2012) 29.0
Prevalence of undernourishment (per cent) – SDG 2. Indicator 2.1.1 7.2 5.5
Value added of agriculture/industry/services (as a share of GDP) 54/26/19 23/25/53 23/24/54
Employment in agriculture/industry/services (as a share of total employment) 70/15/14 42/18/40 40/19/41
Share of women in agriculture/industry/services 46/27/30 50/30/40 49/31/40
Institutional quality index, 2018 0.5637
Control of corruption –0.89 –0.51 –0.42
Rule of law –0.68 –0.38 –0.40
OTHER STRUCTURAL INDICATORS
KEY SOCIOECONOMIC INDICATORS
MERCHANDISE AND COMMODITY EXPORT DEPENDENCE
COMMODITY IMPORT DEPENDENCE](https://image.slidesharecdn.com/stateofcommoditydependance2019-190524115214/85/State-of-commodity-dependance-2019-38-320.jpg)
![Table of contents Introduction
Chapter 1
Key Findings
from the Report
Chapter 2
Country Statistical
Profiles
List of Country
Statistical Profiles
33
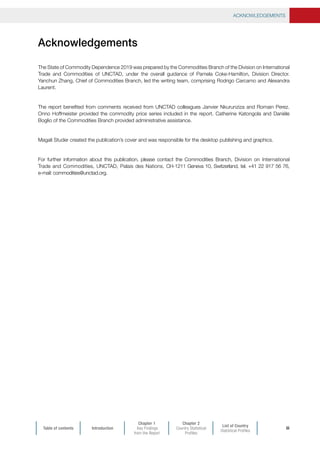
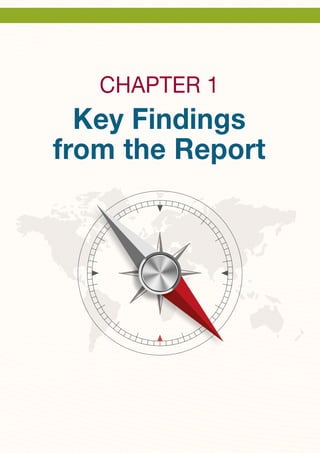
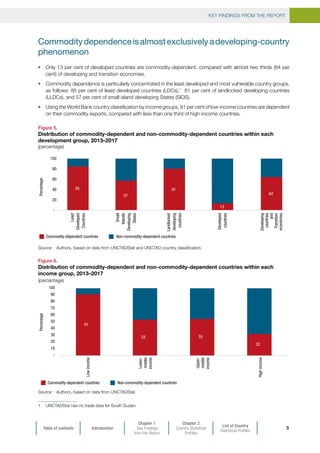
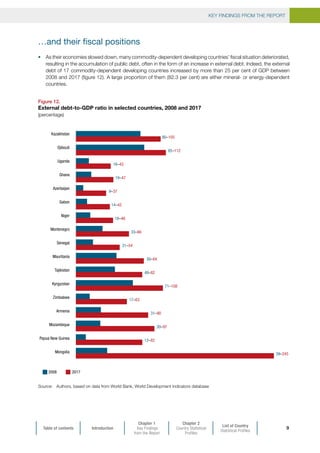
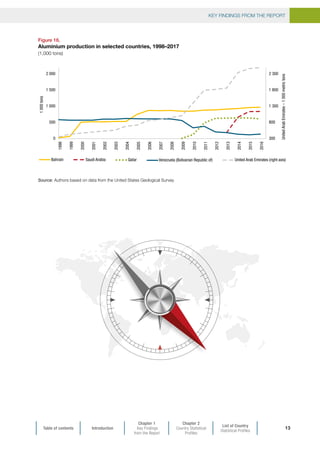
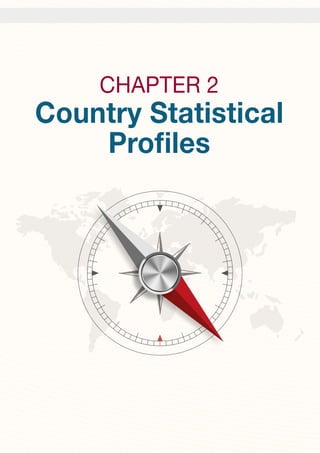
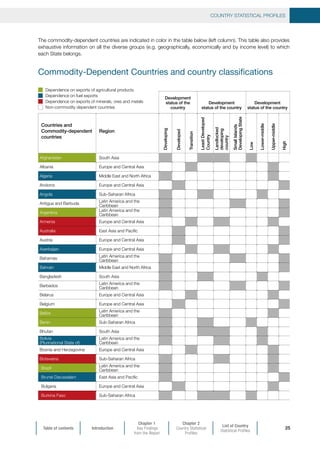
ALGERIA
1995 2013-2017 2017
Merchandise export value (millions of US dollars) 9,357 45,273 35,191
Unallocated exports (as a share of merchandise exports) – – –
Merchandise export concentration by product line (Herfindahl-Hirschmann index) 0.5229 0.4958 0.4795
Commodity export value (millions of US dollars) 9,073 44,308 34,251
Commodity exports (as a share of total merchandise exports) 97 98 97
Commodity exports (as a share of GDP) 21.6 23.9 19.3
Total natural resources rents (as a share of GDP) 9.5 16.6 13.6
Exports by commodity group (as a share of merchandise exports) 97 98 97
Agricultural commodities 1 1 1
Fuels 95 97 96
Ores, metals, precious stones and non-monetary gold 1 – –
Three leading commodity exports (as a share of total merchandise exports) 90 87 85
[333] Petroleum oils, oils from bitumin. materials, crude 46 39 36
[343] Natural gas, whether or not liquefied 26 31 31
[334] Petroleum oils or bituminous minerals 70 % oil 18 17 18
Average price index of the leading commodity group exported 36.5 132.1 103.8
Five leading destination markets of commodity exports (as a share of total commodity exports) 69
European Union (28) 30
United States of America 16
Brazil 9
Turkey 9
Canada 6
COMMODITY IMPORT DEPENDENCE
Commodity imports (millions of US dollars) 3,804 14,218 12,450
Commodity imports (as a share of total merchandise imports) 35 28 27
Food imports (millions of US dollars and as a share of total merchandise imports) 3,091 (29) 9,678 (19) 8,948 (19)
Fuel imports (millions of US dollars and as a share of total merchandise imports) 116 (1) 2,594 (5) 1,938 (4)
Five-leading trading partners for commodity imports (as a share of total commodity imports) 73
European Union (28) 47
Argentina 11
Brazil 8
Russian Federation 3
United States of America 3
KEY SOCIOECONOMIC INDICATORS
Percentage change of GDP measured in constant 2010 prices 3.8 13.7 1.6
GDP per capita measured in constant 2010 US dollars 3,225 4,738 4,821
Population (thousands) 17,430 28,431 29,218
Human Development Index (value and rank) 0.6000 (86) 0.7496 (81) 0.7540 (83)
Total employment (as a share of the population) 30.7 37.5 37.2
Share of women in total employment 12.4 17.0 16.6
Proportion of population below international poverty line – SDG 1. Indicator 1.1.1 (1995) 5.9 (2011) 0.5
Gini index, latest available year (1995) 35.3 (2011) 27.6
Prevalence of undernourishment (per cent) – SDG 2. Indicator 2.1.1 10.7 4.7
OTHER STRUCTURAL INDICATORS
Value added of agriculture/industry/services (as a share of GDP) 10/48/42 11/41/48 13/36/51
Employment in agriculture/industry/services (as a share of total employment) 22/26/51 13/46/41 13/47/40
Share of women in agriculture/industry/services 7/17/13 11/21/15 12/20/14
Institutional quality index, 2018 0.2215
Control of corruption –0.57 –0.61 –0.61
Rule of law –1.22 –0.81 –0.86
MERCHANDISE AND COMMODITY EXPORT DEPENDENCE](https://image.slidesharecdn.com/stateofcommoditydependance2019-190524115214/85/State-of-commodity-dependance-2019-39-320.jpg)
![Table of contents Introduction
Chapter 1
Key Findings
from the Report
Chapter 2
Country Statistical
Profiles
List of Country
Statistical Profiles
34
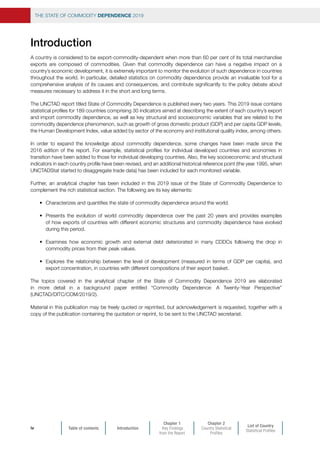
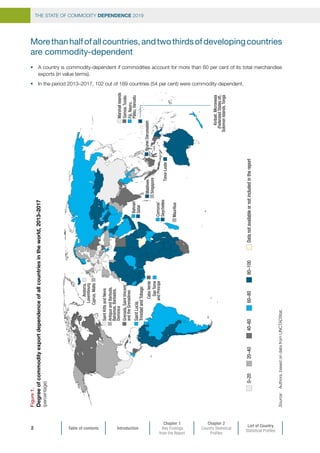
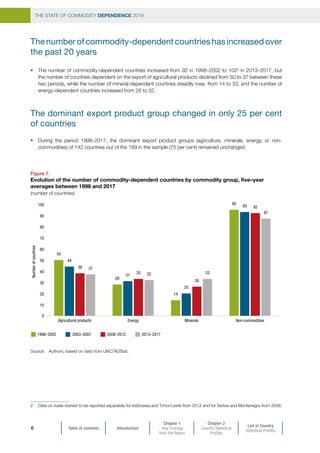
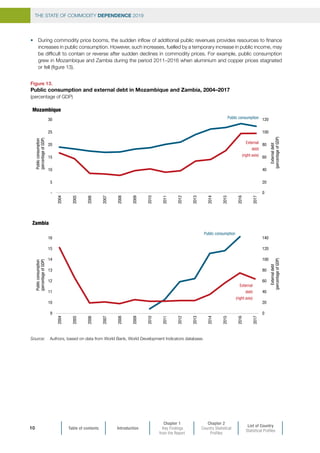
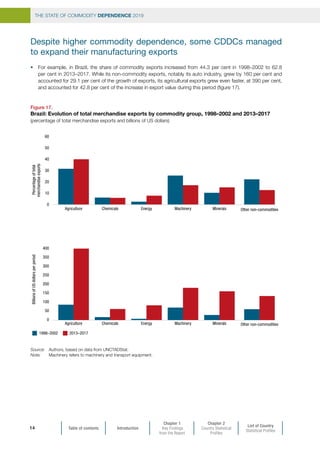
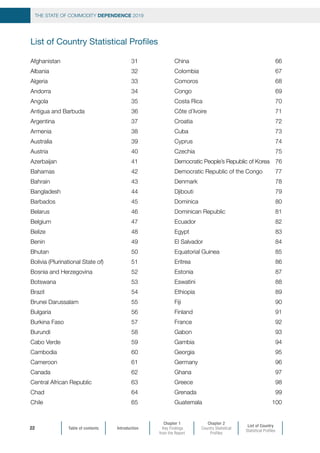
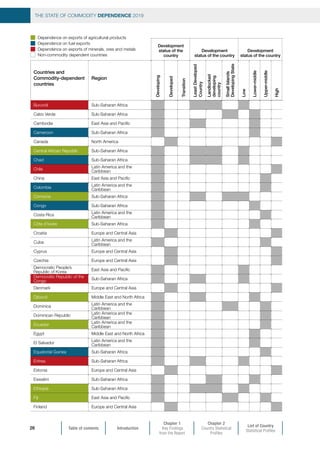
ANDORRA
1995 2013-2017 2017
Merchandise export value (millions of US dollars) 48 99 116
Unallocated exports (as a share of merchandise exports) 0.1 5.8 6.7
Merchandise export concentration by product line (Herfindahl-Hirschmann index) 0.2112 0.1970 0.2178
Commodity export value (millions of US dollars) 5 6 5
Commodity exports (as a share of total merchandise exports) 10 6 4
Commodity exports (as a share of GDP) 0.3 0.2 0.2
Total natural resources rents (as a share of GDP) – – –
Exports by commodity group (as a share of merchandise exports) 10 6 4
Agricultural commodities 8 2 1
Fuels – – –
Ores, metals, precious stones and non-monetary gold 2 4 3
Three leading commodity exports (as a share of total merchandise exports) 2 4 2
[282] Ferrous waste, scrape; remelting ingots, iron, steel 1 1 1
[971] Gold, non-monetary (excluding gold ores and concentrates) – 1 –
[24 + 25] Forestry products 1 1 1
Average price index of the leading commodity group exported 44.4 116.0 116.4
Five leading destination markets of commodity exports (as a share of total commodity exports) 100
Switzerland 75
European Union (28) 12
Turkey 12
Commodity imports (millions of US dollars) 356 519 520
Commodity imports (as a share of total merchandise imports) 35 36 35
Food imports (millions of US dollars and as a share of total merchandise imports) 175 (17) 221 (15) 235 (16)
Fuel imports (millions of US dollars and as a share of total merchandise imports) 44 (4) 145 (10) 128 (9)
Five-leading trading partners for commodity imports (as a share of total commodity imports) 99
European Union (28) 96
Mauritania 1
Viet Nam 1
Switzerland 1
Percentage change of GDP measured in constant 2010 prices 2.8 –0.9 0.5
GDP per capita measured in constant 2010 US dollars 33,684 41,479 43,069
Population (thousands) .. .. ..
Human Development Index (value and rank) .. 0.8542 (34) 0.8580 (33)
Total employment (as a share of the population) .. .. ..
Share of women in total employment .. .. ..
Proportion of population below international poverty line – SDG 1. Indicator 1.1.1 .. ..
Gini index, latest available year .. ..
Prevalence of undernourishment (per cent) – SDG 2. Indicator 2.1.1 .. ..
Value added of agriculture/industry/services (as a share of GDP) 1/19/81 1/11/88 1/11/88
Employment in agriculture/industry/services (as a share of total employment) .. .. ..
Share of women in agriculture/industry/services .. .. ..
Institutional quality index, 2018 ..
Control of corruption 1.32 1.24 1.24
Rule of law 1.16 1.56 1.60
KEY SOCIOECONOMIC INDICATORS
OTHER STRUCTURAL INDICATORS
MERCHANDISE AND COMMODITY EXPORT DEPENDENCE
COMMODITY IMPORT DEPENDENCE](https://image.slidesharecdn.com/stateofcommoditydependance2019-190524115214/85/State-of-commodity-dependance-2019-40-320.jpg)
![Table of contents Introduction
Chapter 1
Key Findings
from the Report
Chapter 2
Country Statistical
Profiles
List of Country
Statistical Profiles
35
ANGOLA*
1995 2013-2017 2017
Merchandise export value (millions of US dollars) 3,723 44,277 34,474
Unallocated exports (as a share of merchandise exports) 0.2 – –
Merchandise export concentration by product line (Herfindahl-Hirschmann index) 0.8916 0.9351 0.9334
Commodity export value (millions of US dollars) 3,705 44,277 34,474
Commodity exports (as a share of total merchandise exports) 100 100 100
Commodity exports (as a share of GDP) 55.8 34.6 25.6
Total natural resources rents (as a share of GDP) 51.1 21.7 13.2
Exports by commodity group (as a share of merchandise exports) 100 100 100
Agricultural commodities 1 – –
Fuels 94 98 97
Ores, metals, precious stones and non-monetary gold 5 2 2
Three leading commodity exports (as a share of total merchandise exports) 90 100 100
[333] Petroleum oils, oils from bitumin. materials, crude 90 96 96
[277] Natural abrasives, n.e.s. (incl. industri. diamonds) – 2 2
[335] Residual petroleum products, n.e.s., related mater. – 2 2
Average price index of the leading commodity group exported 36.5 132.1 103.8
Five leading destination markets of commodity exports (as a share of total commodity exports) 83
China 53
India 10
European Union (28) 8
United States of America 6
Taiwan, Province of China 5
Commodity imports (millions of US dollars) 378 5,110 3,929
Commodity imports (as a share of total merchandise imports) 26 25 27
Food imports (millions of US dollars and as a share of total merchandise imports) 273 (19) 3,224 (16) 2,855 (20)
Fuel imports (millions of US dollars and as a share of total merchandise imports) 15 (1) 984 (5) 462 (3)
Five-leading trading partners for commodity imports (as a share of total commodity imports) 63
European Union (28) 31
Brazil 12
Singapore 7
South Africa 7
Malaysia 6
Percentage change of GDP measured in constant 2010 prices 15.0 14.8 –2.5
GDP per capita measured in constant 2010 US dollars 1,893 3,659 3,375
Population (thousands) 7,437 14,756 15,843
Human Development Index (value and rank) .. 0.5696 (144) 0.5810 (144)
Total employment (as a share of the population) 59.2 71.9 71.3
Share of women in total employment 48.2 49.9 49.9
Proportion of population below international poverty line – SDG 1. Indicator 1.1.1 (2000) 32.3 (2008) 30.1
Gini index, latest available year (2000) 52.0 (2008) 42.7
Prevalence of undernourishment (per cent) – SDG 2. Indicator 2.1.1 71.5 23.9
Value added of agriculture/industry/services (as a share of GDP) 7/67/25 8/46/46 8/46/46
Employment in agriculture/industry/services (as a share of total employment) 42/9/49 49/9/42 51/9/41
Share of women in agriculture/industry/services 59/10/46 57/7/51 57/7/50
Institutional quality index, 2018 0.1166
Control of corruption –1.17 –1.40 –1.41
Rule of law –1.63 –1.13 –1.10
OTHER STRUCTURAL INDICATORS
KEY SOCIOECONOMIC INDICATORS
MERCHANDISE AND COMMODITY EXPORT DEPENDENCE
COMMODITY IMPORT DEPENDENCE](https://image.slidesharecdn.com/stateofcommoditydependance2019-190524115214/85/State-of-commodity-dependance-2019-41-320.jpg)
![Table of contents Introduction
Chapter 1
Key Findings
from the Report
Chapter 2
Country Statistical
Profiles
List of Country
Statistical Profiles
36
ANTIGUA AND BARBUDA
1995 2013-2017 2017
Merchandise export value (millions of US dollars) 53 78 80
Unallocated exports (as a share of merchandise exports) 1.9 2.9 3.0
Merchandise export concentration by product line (Herfindahl-Hirschmann index) 0.3090 0.5088 0.4172
Commodity export value (millions of US dollars) 40 18 13
Commodity exports (as a share of total merchandise exports) 75 23 16
Commodity exports (as a share of GDP) 6.9 1.3 0.8
Total natural resources rents (as a share of GDP) – – –
Exports by commodity group (as a share of merchandise exports) 75 23 15
Agricultural commodities 23 10 8
Fuels 47 13 7
Ores, metals, precious stones and non-monetary gold 4 1 –
Three leading commodity exports (as a share of total merchandise exports) 26 17 6
[334] Petroleum oils or bituminous minerals 70 % oil 17 12 4
[042] Rice 6 3 –
[081] Feeding stuff for animals (no unmilled cereals) 3 2 2
Average price index of the leading commodity group exported 36.5 132.1 103.8
Five leading destination markets of commodity exports (as a share of total commodity exports) 71
Suriname 40
Senegal 15
Cameroon 7
Dominican Republic 5
Angola 4
Commodity imports (millions of US dollars) 76 172 214
Commodity imports (as a share of total merchandise imports) 22 33 34
Food imports (millions of US dollars and as a share of total merchandise imports) 40 (12) 55 (10) 76 (12)
Fuel imports (millions of US dollars and as a share of total merchandise imports) 17 (5) 93 (18) 104 (17)
Five-leading trading partners for commodity imports (as a share of total commodity imports) 82
United States of America 48
Trinidad and Tobago 14
European Union (28) 10
China 8
Saint Vincent and the Grenadines 2
Percentage change of GDP measured in constant 2010 prices –4.4 9.0 2.2
GDP per capita measured in constant 2010 US dollars 10,400 12,727 13,416
Population (thousands) .. .. ..
Human Development Index (value and rank) .. 0.7742 (68) 0.7800 (68)
Total employment (as a share of the population) .. .. ..
Share of women in total employment .. .. ..
Proportion of population below international poverty line – SDG 1. Indicator 1.1.1 .. ..
Gini index, latest available year .. ..
Prevalence of undernourishment (per cent) – SDG 2. Indicator 2.1.1 .. ..
Value added of agriculture/industry/services (as a share of GDP) 2/14/84 2/18/80 2/20/78
Employment in agriculture/industry/services (as a share of total employment) .. .. ..
Share of women in agriculture/industry/services .. .. ..
Institutional quality index, 2018 0.5641
Control of corruption 0.87 0.71 0.24
Rule of law 1.05 0.44 0.44
OTHER STRUCTURAL INDICATORS
KEY SOCIOECONOMIC INDICATORS
MERCHANDISE AND COMMODITY EXPORT DEPENDENCE
COMMODITY IMPORT DEPENDENCE](https://image.slidesharecdn.com/stateofcommoditydependance2019-190524115214/85/State-of-commodity-dependance-2019-42-320.jpg)
![Table of contents Introduction
Chapter 1
Key Findings
from the Report
Chapter 2
Country Statistical
Profiles
List of Country
Statistical Profiles
37
ARGENTINA
1995 2013-2017 2017
Merchandise export value (millions of US dollars) 20,963 63,455 58,384
Unallocated exports (as a share of merchandise exports) – 2.1 1.5
Merchandise export concentration by product line (Herfindahl-Hirschmann index) 0.1244 0.1856 0.1794
Commodity export value (millions of US dollars) 13,859 43,687 41,328
Commodity exports (as a share of total merchandise exports) 66 69 71
Commodity exports (as a share of GDP) 5.0 7.3 6.6
Total natural resources rents (as a share of GDP) 1.1 2.1 1.3
Exports by commodity group (as a share of merchandise exports) 66 69 71
Agricultural commodities 54 59 61
Fuels 10 4 3
Ores, metals, precious stones and non-monetary gold 2 6 7
Three leading commodity exports (as a share of total merchandise exports) 19 31 31
[081] Feeding stuff for animals (no unmilled cereals) 6 18 17
[421] Fixed vegetable fats oils, crude, refined, fractio. 10 7 8
[044] Maize (not including sweet corn), unmilled 3 6 7
Average price index of the leading commodity group exported 80.8 109.0 102.7
Five leading destination markets of commodity exports (as a share of total commodity exports) 44
European Union (28) 15
China 11
Brazil 9
United States of America 6
Viet Nam 4
Commodity imports (millions of US dollars) 2,900 12,170 10,428
Commodity imports (as a share of total merchandise imports) 14 19 16
Food imports (millions of US dollars and as a share of total merchandise imports) 1,008 (5) 1,790 (3) 2,570 (4)
Fuel imports (millions of US dollars and as a share of total merchandise imports) 844 (4) 7,914 (12) 5,461 (8)
Five-leading trading partners for commodity imports (as a share of total commodity imports) 63
Brazil 15
United States of America 15
Bolivia (Plurinational State of) 15
European Union (28) 10
Trinidad and Tobago 8
Percentage change of GDP measured in constant 2010 prices –2.8 4.6 2.9
GDP per capita measured in constant 2010 US dollars 7,682 10,471 10,413
Population (thousands) 24,799 32,477 33,254
Human Development Index (value and rank) 0.7310 (39) 0.8218 (45) 0.8250 (45)
Total employment (as a share of the population) 49.1 55.4 54.8
Share of women in total employment 38.4 40.4 40.4
Proportion of population below international poverty line – SDG 1. Indicator 1.1.1 (1995) 4.1 (2016) 0.6
Gini index, latest available year (1995) 48.9 (2016) 42.4
Prevalence of undernourishment (per cent) – SDG 2. Indicator 2.1.1 3.5 3.8
Value added of agriculture/industry/services (as a share of GDP) 5/26/69 7/28/65 8/27/66
Employment in agriculture/industry/services (as a share of total employment) 1/27/72 1/24/76 1/23/76
Share of women in agriculture/industry/services 22/21/45 12/14/49 11/14/49
Institutional quality index, 2018 0.3914
Control of corruption –0.10 –0.41 –0.26
Rule of law 0.08 –0.60 –0.25
OTHER STRUCTURAL INDICATORS
KEY SOCIOECONOMIC INDICATORS
MERCHANDISE AND COMMODITY EXPORT DEPENDENCE
COMMODITY IMPORT DEPENDENCE](https://image.slidesharecdn.com/stateofcommoditydependance2019-190524115214/85/State-of-commodity-dependance-2019-43-320.jpg)
![Table of contents Introduction
Chapter 1
Key Findings
from the Report
Chapter 2
Country Statistical
Profiles
List of Country
Statistical Profiles
38
ARMENIA
1995 2013-2017 2017
Merchandise export value (millions of US dollars) 271 1,679 2,145
Unallocated exports (as a share of merchandise exports) 0.2 0.2 0.1
Merchandise export concentration by product line (Herfindahl-Hirschmann index) 0.1284 0.2553 0.3080
Commodity export value (millions of US dollars) 128 1,335 1,716
Commodity exports (as a share of total merchandise exports) 47 80 80
Commodity exports (as a share of GDP) 9.3 12.0 14.9
Total natural resources rents (as a share of GDP) 0.7 4.1 4.8
Exports by commodity group (as a share of merchandise exports) 47 80 80
Agricultural commodities 17 27 27
Fuels 5 3 2
Ores, metals, precious stones and non-monetary gold 24 50 51
Three leading commodity exports (as a share of total merchandise exports) 14 43 49
[283] Copper ores and concentrates; copper mattes, cemen 3 24 30
[112] Alcoholic beverages 11 10 10
[122] Tobacco, manufactured – 9 9
Average price index of the leading commodity group exported 58.3 123.5 127.5
Five leading destination markets of commodity exports (as a share of total commodity exports) 68
Russian Federation 25
China 14
Georgia 11
Iraq 9
European Union (28) 9
Commodity imports (millions of US dollars) 445 1,675 1,590
Commodity imports (as a share of total merchandise imports) 66 45 41
Food imports (millions of US dollars and as a share of total merchandise imports) 195 (29) 581 (15) 583 (15)
Fuel imports (millions of US dollars and as a share of total merchandise imports) 211 (31) 566 (15) 495 (13)
Five-leading trading partners for commodity imports (as a share of total commodity imports) 75
Russian Federation 43
European Union (28) 16
Iran (Islamic Republic of) 7
Ukraine 5
Switzerland 4
Percentage change of GDP measured in constant 2010 prices 6.9 16.4 7.5
GDP per capita measured in constant 2010 US dollars 1,094 4,183 4,497
Population (thousands) 2,276 2,337 2,344
Human Development Index (value and rank) 0.6050 (85) 0.7478 (82) 0.7550 (81)
Total employment (as a share of the population) 54.3 49.6 49.2
Share of women in total employment 43.5 46.3 46.5
Proportion of population below international poverty line – SDG 1. Indicator 1.1.1 (1996) 17.9 (2016) 1.9
Gini index, latest available year (1996) 44.4 (2016) 32.6
Prevalence of undernourishment (per cent) – SDG 2. Indicator 2.1.1 23.8 4.3
Value added of agriculture/industry/services (as a share of GDP) 40/28/31 19/28/53 17/27/56
Employment in agriculture/industry/services (as a share of total employment) 52/18/30 35/16/49 34/16/50
Share of women in agriculture/industry/services 46/30/47 54/21/49 53/22/50
Institutional quality index, 2018 0.5474
Control of corruption –0.47 –0.54 –0.56
Rule of law –0.47 –0.27 –0.16
MERCHANDISE AND COMMODITY EXPORT DEPENDENCE
COMMODITY IMPORT DEPENDENCE
KEY SOCIOECONOMIC INDICATORS
OTHER STRUCTURAL INDICATORS](https://image.slidesharecdn.com/stateofcommoditydependance2019-190524115214/85/State-of-commodity-dependance-2019-44-320.jpg)
![Table of contents Introduction
Chapter 1
Key Findings
from the Report
Chapter 2
Country Statistical
Profiles
List of Country
Statistical Profiles
39
AUSTRALIA
1995 2013-2017 2017
Merchandise export value (millions of US dollars) 53,001 220,000 230,000
Unallocated exports (as a share of merchandise exports) 2.6 3.6 3.6
Merchandise export concentration by product line (Herfindahl-Hirschmann index) 0.1205 0.2568 0.2640
Commodity export value (millions of US dollars) 37,600 185,234 195,190
Commodity exports (as a share of total merchandise exports) 71 84 85
Commodity exports (as a share of GDP) 9.6 13.3 13.7
Total natural resources rents (as a share of GDP) 2.0 6.4 5.5
Exports by commodity group (as a share of merchandise exports) 71 84 85
Agricultural commodities 28 17 17
Fuels 17 27 30
Ores, metals, precious stones and non-monetary gold 26 40 38
Three leading commodity exports (as a share of total merchandise exports) 16 46 48
[281] Iron ore and concentrates 4 23 21
[321] Coal, whether or not pulverized, not agglomerated 10 16 19
[343] Natural gas, whether or not liquefied 2 7 9
Average price index of the leading commodity group exported 58.3 123.5 127.5
Five leading destination markets of commodity exports (as a share of total commodity exports) 74
China 42
Japan 15
Republic of Korea 8
India 5
European Union (28) 5
Commodity imports (millions of US dollars) 8,094 51,393 48,546
Commodity imports (as a share of total merchandise imports) 14 24 21
Food imports (millions of US dollars and as a share of total merchandise imports) 2,473 (4) 11,287 (5) 12,235 (5)
Fuel imports (millions of US dollars and as a share of total merchandise imports) 2,883 (5) 27,960 (13) 23,615 (10)
Five-leading trading partners for commodity imports (as a share of total commodity imports) 46
Singapore 12
Malaysia 9
New Zealand 8
Republic of Korea 8
European Union (28) 8
Percentage change of GDP measured in constant 2010 prices 3.9 10.8 2.3
GDP per capita measured in constant 2010 US dollars 43,759 62,215 63,356
Population (thousands) 14,178 19,304 19,802
Human Development Index (value and rank) 0.8830 (1) 0.9354 (3) 0.9390 (3)
Total employment (as a share of the population) 58.3 61.1 61.2
Share of women in total employment 42.9 45.9 46.1
Proportion of population below international poverty line – SDG 1. Indicator 1.1.1 (1995) 1.0 (2010) 0.3
Gini index, latest available year (1995) 32.6 (2010) 34.7
Prevalence of undernourishment (per cent) – SDG 2. Indicator 2.1.1 2.5 2.5
Value added of agriculture/industry/services (as a share of GDP) 4/28/68 3/26/72 3/26/72
Employment in agriculture/industry/services (as a share of total employment) 5/23/72 3/20/78 3/19/78
Share of women in agriculture/industry/services 31/22/50 30/18/53 29/19/53
Institutional quality index, 2018 0.9265
Control of corruption 1.88 1.83 1.80
Rule of law 1.71 1.79 1.68
OTHER STRUCTURAL INDICATORS
MERCHANDISE AND COMMODITY EXPORT DEPENDENCE
COMMODITY IMPORT DEPENDENCE
KEY SOCIOECONOMIC INDICATORS](https://image.slidesharecdn.com/stateofcommoditydependance2019-190524115214/85/State-of-commodity-dependance-2019-45-320.jpg)
![Table of contents Introduction
Chapter 1
Key Findings
from the Report
Chapter 2
Country Statistical
Profiles
List of Country
Statistical Profiles
40
AUSTRIA
1995 2013-2017 2017
Merchandise export value (millions of US dollars) 57,583 157,200 160,000
Unallocated exports (as a share of merchandise exports) 7.6 2.7 –
Merchandise export concentration by product line (Herfindahl-Hirschmann index) 0.0613 0.0609 0.0601
Commodity export value (millions of US dollars) 6,219 23,493 24,281
Commodity exports (as a share of total merchandise exports) 11 15 15
Commodity exports (as a share of GDP) 2.6 5.7 5.8
Total natural resources rents (as a share of GDP) 0.1 0.2 0.1
Exports by commodity group (as a share of merchandise exports) 11 15 15
Agricultural commodities 7 9 9
Fuels 1 2 2
Ores, metals, precious stones and non-monetary gold 3 4 4
Three leading commodity exports (as a share of total merchandise exports) 4 4 4
[684] Aluminium 1 1 1
[24 + 25] Forestry products 3 1 1
[111] Non-alcoholic beverages, n.e.s. – 1 1
Average price index of the leading commodity group exported 58.3 123.5 127.5
Five leading destination markets of commodity exports (as a share of total commodity exports) 67
Switzerland 23
European Union (28) 21
United States of America 15
Russian Federation 4
Japan 4
Commodity imports (millions of US dollars) 11,710 39,676 38,727
Commodity imports (as a share of total merchandise imports) 18 24 23
Food imports (millions of US dollars and as a share of total merchandise imports) 3,508 (5) 11,820 (7) 12,812 (8)
Fuel imports (millions of US dollars and as a share of total merchandise imports) 2,937 (4) 13,811 (9) 10,618 (6)
Five-leading trading partners for commodity imports (as a share of total commodity imports) 86
European Union (28) 71
Switzerland 7
Kazakhstan 4
Russian Federation 3
Libya 1
Percentage change of GDP measured in constant 2010 prices 2.7 4.4 3.0
GDP per capita measured in constant 2010 US dollars 36,393 47,972 49,414
Population (thousands) 6,574 7,441 7,504
Human Development Index (value and rank) 0.8170 (17) 0.9030 (18) 0.9080 (18)
Total employment (as a share of the population) 56.5 56.9 57.0
Share of women in total employment 43.0 46.8 47.0
Proportion of population below international poverty line – SDG 1. Indicator 1.1.1 (2003) 0.2 (2015) 0.7
Gini index, latest available year (2003) 29.5 (2015) 30.5
Prevalence of undernourishment (per cent) – SDG 2. Indicator 2.1.1 2.5 2.5
Value added of agriculture/industry/services (as a share of GDP) 2/32/66 1/28/70 1/28/71
Employment in agriculture/industry/services (as a share of total employment) 7/32/61 5/26/70 4/26/70
Share of women in agriculture/industry/services 48/23/53 43/23/56 42/22/56
Institutional quality index, 2018 0.8858
Control of corruption 1.73 1.52 1.53
Rule of law 1.81 1.86 1.81
OTHER STRUCTURAL INDICATORS
MERCHANDISE AND COMMODITY EXPORT DEPENDENCE
COMMODITY IMPORT DEPENDENCE
KEY SOCIOECONOMIC INDICATORS](https://image.slidesharecdn.com/stateofcommoditydependance2019-190524115214/85/State-of-commodity-dependance-2019-46-320.jpg)
![Table of contents Introduction
Chapter 1
Key Findings
from the Report
Chapter 2
Country Statistical
Profiles
List of Country
Statistical Profiles
41
AZERBAIJAN
1995 2013-2017 2017
Merchandise export value (millions of US dollars) 636 20,527 13,798
Unallocated exports (as a share of merchandise exports) 0.1 0.7 0.3
Merchandise export concentration by product line (Herfindahl-Hirschmann index) 0.4164 0.8276 0.8091
Commodity export value (millions of US dollars) 464 19,847 13,346
Commodity exports (as a share of total merchandise exports) 73 97 97
Commodity exports (as a share of GDP) 15.1 35.4 33.2
Total natural resources rents (as a share of GDP) 17.4 20.6 20.5
Exports by commodity group (as a share of merchandise exports) 73 97 97
Agricultural commodities 23 4 5
Fuels 46 91 90
Ores, metals, precious stones and non-monetary gold 4 1 2
Three leading commodity exports (as a share of total merchandise exports) 44 91 89
[333] Petroleum oils, oils from bitumin. materials, crude – 85 82
[334] Petroleum oils or bituminous minerals 70 % oil 44 4 2
[343] Natural gas, whether or not liquefied – 2 5
Average price index of the leading commodity group exported 36.5 132.1 103.8
Five leading destination markets of commodity exports (as a share of total commodity exports) 53
European Union (28) 18
Indonesia 15
Thailand 8
India 6
Israel 6
Commodity imports (millions of US dollars) 304 2,334 2,302
Commodity imports (as a share of total merchandise imports) 46 25 26
Food imports (millions of US dollars and as a share of total merchandise imports) 220 (33) 1,197 (13) 1,433 (16)
Fuel imports (millions of US dollars and as a share of total merchandise imports) 43 (6) 248 (3) 379 (4)
Five-leading trading partners for commodity imports (as a share of total commodity imports) 75
Russian Federation 30
European Union (28) 23
Ukraine 9
Brazil 7
Turkey 6
Percentage change of GDP measured in constant 2010 prices –11.8 7.8 0.1
GDP per capita measured in constant 2010 US dollars 1,224 5,944 5,774
Population (thousands) 5,162 7,404 7,540
Human Development Index (value and rank) 0.6120 (80) 0.7564 (77) 0.7570 (78)
Total employment (as a share of the population) 58.3 62.2 62.8
Share of women in total employment 46.0 48.5 48.6
Proportion of population below international poverty line – SDG 1. Indicator 1.1.1 (1995) 7.3 (2005) –
Gini index, latest available year (1995) 34.7 (2005) 16.6
Prevalence of undernourishment (per cent) – SDG 2. Indicator 2.1.1 23.0 2.5
Value added of agriculture/industry/services (as a share of GDP) 27/33/40 6/55/39 6/51/43
Employment in agriculture/industry/services (as a share of total employment) 45/11/44 37/14/49 37/14/48
Share of women in agriculture/industry/services 46/27/50 56/20/51 56/21/51
Institutional quality index, 2018 0.3975
Control of corruption –1.45 –0.93 –0.88
Rule of law –1.20 –0.63 –0.56
MERCHANDISE AND COMMODITY EXPORT DEPENDENCE
COMMODITY IMPORT DEPENDENCE
OTHER STRUCTURAL INDICATORS
KEY SOCIOECONOMIC INDICATORS](https://image.slidesharecdn.com/stateofcommoditydependance2019-190524115214/85/State-of-commodity-dependance-2019-47-320.jpg)
![Table of contents Introduction
Chapter 1
Key Findings
from the Report
Chapter 2
Country Statistical
Profiles
List of Country
Statistical Profiles
42
BAHAMAS
1995 2013-2017 2017
Merchandise export value (millions of US dollars) 176 679 605
Unallocated exports (as a share of merchandise exports) 1.5 2.5 –
Merchandise export concentration by product line (Herfindahl-Hirschmann index) 0.3432 0.4964 0.4426
Commodity export value (millions of US dollars) 68 236 244
Commodity exports (as a share of total merchandise exports) 39 35 40
Commodity exports (as a share of GDP) 1.3 2.1 2.1
Total natural resources rents (as a share of GDP) 0.1 – –
Exports by commodity group (as a share of merchandise exports) 38 35 40
Agricultural commodities 21 4 5
Fuels 11 28 32
Ores, metals, precious stones and non-monetary gold 7 2 3
Three leading commodity exports (as a share of total merchandise exports) 10 28 31
[334] Petroleum oils or bituminous minerals 70 % oil 8 19 21
[333] Petroleum oils, oils from bitumin. materials, crude 3 6 7
[335] Residual petroleum products, n.e.s., related mater. – 3 3
Average price index of the leading commodity group exported 36.5 132.1 103.8
Five leading destination markets of commodity exports (as a share of total commodity exports) 64
United States of America 24
Dominican Republic 15
India 9
Ecuador 8
Mozambique 7
Commodity imports (millions of US dollars) 420 1,276 1,324
Commodity imports (as a share of total merchandise imports) 34 40 43
Food imports (millions of US dollars and as a share of total merchandise imports) 213 (17) 267 (8) 407 (13)
Fuel imports (millions of US dollars and as a share of total merchandise imports) 156 (13) 915 (29) 779 (25)
Five-leading trading partners for commodity imports (as a share of total commodity imports) 87
United States of America 64
Colombia 8
European Union (28) 6
Brazil 6
India 4
Percentage change of GDP measured in constant 2010 prices 4.4 –0.6 1.3
GDP per capita measured in constant 2010 US dollars 26,213 26,273 25,579
Population (thousands) 192 306 314
Human Development Index (value and rank) .. 0.8068 (49) 0.8070 (52)
Total employment (as a share of the population) 67.2 65.6 66.2
Share of women in total employment 45.7 47.1 47.1
Proportion of population below international poverty line – SDG 1. Indicator 1.1.1 .. ..
Gini index, latest available year .. ..
Prevalence of undernourishment (per cent) – SDG 2. Indicator 2.1.1 .. ..
Value added of agriculture/industry/services (as a share of GDP) 2/10/88 1/13/86 1/13/86
Employment in agriculture/industry/services (as a share of total employment) 5/14/81 4/13/84 4/12/84
Share of women in agriculture/industry/services 17/17/53 22/15/53 22/15/53
Institutional quality index, 2018 0.6526
Control of corruption 1.16 1.21 1.17
Rule of law 1.15 0.47 0.19
OTHER STRUCTURAL INDICATORS
MERCHANDISE AND COMMODITY EXPORT DEPENDENCE
COMMODITY IMPORT DEPENDENCE
KEY SOCIOECONOMIC INDICATORS](https://image.slidesharecdn.com/stateofcommoditydependance2019-190524115214/85/State-of-commodity-dependance-2019-48-320.jpg)
![Table of contents Introduction
Chapter 1
Key Findings
from the Report
Chapter 2
Country Statistical
Profiles
List of Country
Statistical Profiles
43
BAHRAIN
1995 2013-2017 2017
Merchandise export value (millions of US dollars) 4,113 17,395 17,234
Unallocated exports (as a share of merchandise exports) 0.8 0.6 0.3
Merchandise export concentration by product line (Herfindahl-Hirschmann index) 0.3994 0.3292 0.3264
Commodity export value (millions of US dollars) 2,756 12,014 12,141
Commodity exports (as a share of total merchandise exports) 67 69 70
Commodity exports (as a share of GDP) 40.6 36.5 34.5
Total natural resources rents (as a share of GDP) 4.0 6.6 4.4
Exports by commodity group (as a share of merchandise exports) 67 69 70
Agricultural commodities 4 4 4
Fuels 17 43 43
Ores, metals, precious stones and non-monetary gold 47 21 24
Three leading commodity exports (as a share of total merchandise exports) 54 57 57
[334] Petroleum oils or bituminous minerals 70 % oil 15 31 30
[684] Aluminium 40 17 18
[333] Petroleum oils, oils from bitumin. materials, crude – 10 10
Average price index of the leading commodity group exported 36.5 132.1 103.8
Five leading destination markets of commodity exports (as a share of total commodity exports) 48
United Arab Emirates 15
Saudi Arabia 10
European Union (28) 9
Japan 8
United States of America 6
Commodity imports (millions of US dollars) 1,837 5,215 4,255
Commodity imports (as a share of total merchandise imports) 50 45 41
Food imports (millions of US dollars and as a share of total merchandise imports) 391 (11) 1,074 (9) 1,033 (10)
Fuel imports (millions of US dollars and as a share of total merchandise imports) 1,206 (33) 3,036 (26) 2,024 (20)
Five-leading trading partners for commodity imports (as a share of total commodity imports) 81
Saudi Arabia 61
United Arab Emirates 6
Australia 5
European Union (28) 4
Brazil 4
Percentage change of GDP measured in constant 2010 prices 1.9 16.4 3.9
GDP per capita measured in constant 2010 US dollars 21,540 22,209 22,122
Population (thousands) 393 1,105 1,198
Human Development Index (value and rank) 0.7750 (28) 0.8282 (43) 0.8460 (41)
Total employment (as a share of the population) 64.6 70.9 71.4
Share of women in total employment 18.5 20.9 20.4
Proportion of population below international poverty line – SDG 1. Indicator 1.1.1 .. ..
Gini index, latest available year .. ..
Prevalence of undernourishment (per cent) – SDG 2. Indicator 2.1.1 .. ..
Value added of agriculture/industry/services (as a share of GDP) 1/36/63 –/44/56 –/40/60
Employment in agriculture/industry/services (as a share of total employment) 2/29/69 1/35/64 1/35/64
Share of women in agriculture/industry/services –/5/24 1/5/30 1/5/29
Institutional quality index, 2018 0.5046
Control of corruption 0.33 0.14 –0.14
Rule of law –0.01 0.41 0.45
OTHER STRUCTURAL INDICATORS
MERCHANDISE AND COMMODITY EXPORT DEPENDENCE
COMMODITY IMPORT DEPENDENCE
KEY SOCIOECONOMIC INDICATORS](https://image.slidesharecdn.com/stateofcommoditydependance2019-190524115214/85/State-of-commodity-dependance-2019-49-320.jpg)
![Table of contents Introduction
Chapter 1
Key Findings
from the Report
Chapter 2
Country Statistical
Profiles
List of Country
Statistical Profiles
44
BANGLADESH*
1995 2013-2017 2017
Merchandise export value (millions of US dollars) 3,407 32,057 35,137
Unallocated exports (as a share of merchandise exports) 3.4 0.8 0.9
Merchandise export concentration by product line (Herfindahl-Hirschmann index) 0.3354 0.4057 0.4054
Commodity export value (millions of US dollars) 413 1,641 1,738
Commodity exports (as a share of total merchandise exports) 12 4 5
Commodity exports (as a share of GDP) 1.1 0.8 0.7
Total natural resources rents (as a share of GDP) 0.5 1.0 0.8
Exports by commodity group (as a share of merchandise exports) 12 4 4
Agricultural commodities 12 4 4
Fuels – – –
Ores, metals, precious stones and non-monetary gold – – –
Three leading commodity exports (as a share of total merchandise exports) 8 2 2
[03] Fishery products 8 2 2
[054] Vegetables – – –
[121] Tobacco, unmanufactured; tobacco refuse – – –
Average price index of the leading commodity group exported 80.8 109.0 102.7
Five leading destination markets of commodity exports (as a share of total commodity exports) 67
European Union (28) 32
India 15
China 10
Saudi Arabia 6
United States of America 4
Commodity imports (millions of US dollars) 1,837 14,841 18,960
Commodity imports (as a share of total merchandise imports) 27 34 36
Food imports (millions of US dollars and as a share of total merchandise imports) 1,085 (16) 6,979 (16) 9,019 (17)
Fuel imports (millions of US dollars and as a share of total merchandise imports) 369 (6) 3,229 (7) 3,546 (7)
Five-leading trading partners for commodity imports (as a share of total commodity imports) 47
India 16
Singapore 9
Brazil 8
Indonesia 8
Malaysia 7
Percentage change of GDP measured in constant 2010 prices 4.9 28.1 7.2
GDP per capita measured in constant 2010 US dollars 428 972 1,085
Population (thousands) 71,312 113,755 117,953
Human Development Index (value and rank) 0.4250 (118) 0.5910 (137) 0.6080 (133)
Total employment (as a share of the population) 55.3 54.1 54.0
Share of women in total employment 21.0 27.7 28.3
Proportion of population below international poverty line – SDG 1. Indicator 1.1.1 (1995) 35.7 (2016) 14.8
Gini index, latest available year (1995) 32.9 (2016) 32.4
Prevalence of undernourishment (per cent) – SDG 2. Indicator 2.1.1 20.8 15.2
Value added of agriculture/industry/services (as a share of GDP) 26/25/49 16/28/56 15/29/56
Employment in agriculture/industry/services (as a share of total employment) 67/10/23 42/21/37 39/21/40
Share of women in agriculture/industry/services 27/15/6 39/24/16 44/22/17
Institutional quality index, 2018 0.2651
Control of corruption –0.97 –0.85 –0.83
Rule of law –0.93 –0.75 –0.67
MERCHANDISE AND COMMODITY EXPORT DEPENDENCE
COMMODITY IMPORT DEPENDENCE
KEY SOCIOECONOMIC INDICATORS
OTHER STRUCTURAL INDICATORS](https://image.slidesharecdn.com/stateofcommoditydependance2019-190524115214/85/State-of-commodity-dependance-2019-50-320.jpg)
![Table of contents Introduction
Chapter 1
Key Findings
from the Report
Chapter 2
Country Statistical
Profiles
List of Country
Statistical Profiles
45
BARBADOS
1995 2013-2017 2017
Merchandise export value (millions of US dollars) 238 487 485
Unallocated exports (as a share of merchandise exports) 1.3 1.8 1.7
Merchandise export concentration by product line (Herfindahl-Hirschmann index) 0.1719 0.1670 0.1504
Commodity export value (millions of US dollars) 108 190 194
Commodity exports (as a share of total merchandise exports) 45 39 40
Commodity exports (as a share of GDP) 4.7 4.2 4.0
Total natural resources rents (as a share of GDP) 0.2 0.3 0.2
Exports by commodity group (as a share of merchandise exports) 45 39 40
Agricultural commodities 29 24 25
Fuels 14 13 11
Ores, metals, precious stones and non-monetary gold 2 3 5
Three leading commodity exports (as a share of total merchandise exports) 18 24 20
[112] Alcoholic beverages 4 12 13
[334] Petroleum oils or bituminous minerals 70 % oil 14 6 4
[333] Petroleum oils, oils from bitumin. materials, crude – 5 3
Average price index of the leading commodity group exported 80.7 109.2 102.2
Five leading destination markets of commodity exports (as a share of total commodity exports) 66
Trinidad and Tobago 21
United States of America 21
European Union (28) 11
Jamaica 8
Bahamas 6
Commodity imports (millions of US dollars) 234 757 670
Commodity imports (as a share of total merchandise imports) 31 45 42
Food imports (millions of US dollars and as a share of total merchandise imports) 128 (17) 277 (17) 274 (17)
Fuel imports (millions of US dollars and as a share of total merchandise imports) 63 (8) 399 (24) 317 (20)
Five-leading trading partners for commodity imports (as a share of total commodity imports) 80
Trinidad and Tobago 37
United States of America 26
European Union (28) 7
Canada 6
Suriname 4
Percentage change of GDP measured in constant 2010 prices 2.0 2.0 1.0
GDP per capita measured in constant 2010 US dollars 12,943 15,748 16,008
Population (thousands) 204 229 231
Human Development Index (value and rank) 0.7310 (39) 0.7976 (55) 0.8000 (56)
Total employment (as a share of the population) 56.4 59.0 59.7
Share of women in total employment 46.1 49.6 49.3
Proportion of population below international poverty line – SDG 1. Indicator 1.1.1 .. ..
Gini index, latest available year .. ..
Prevalence of undernourishment (per cent) – SDG 2. Indicator 2.1.1 5.4 3.7
Value added of agriculture/industry/services (as a share of GDP) 4/17/80 2/15/83 2/15/83
Employment in agriculture/industry/services (as a share of total employment) 4/23/73 3/20/78 3/19/78
Share of women in agriculture/industry/services 40/27/52 29/25/57 32/24/57
Institutional quality index, 2018 0.5880
Control of corruption 1.54 1.39 1.42
Rule of law 1.05 0.94 0.66
OTHER STRUCTURAL INDICATORS
MERCHANDISE AND COMMODITY EXPORT DEPENDENCE
COMMODITY IMPORT DEPENDENCE
KEY SOCIOECONOMIC INDICATORS](https://image.slidesharecdn.com/stateofcommoditydependance2019-190524115214/85/State-of-commodity-dependance-2019-51-320.jpg)
![Table of contents Introduction
Chapter 1
Key Findings
from the Report
Chapter 2
Country Statistical
Profiles
List of Country
Statistical Profiles
46
BELARUS
1995 2013-2017 2017
Merchandise export value (millions of US dollars) 4,804 30,538 29,207
Unallocated exports (as a share of merchandise exports) 51.6 3.0 –
Merchandise export concentration by product line (Herfindahl-Hirschmann index) 0.4910 0.2230 0.2037
Commodity export value (millions of US dollars) 733 14,505 13,351
Commodity exports (as a share of total merchandise exports) 15 48 46
Commodity exports (as a share of GDP) 5.1 23.2 24.7
Total natural resources rents (as a share of GDP) 2.2 1.2 1.5
Exports by commodity group (as a share of merchandise exports) 15 48 46
Agricultural commodities 7 18 19
Fuels 5 29 25
Ores, metals, precious stones and non-monetary gold 4 1 1
Three leading commodity exports (as a share of total merchandise exports) 4 30 27
[334] Petroleum oils or bituminous minerals 70 % oil 4 24 21
[022] Milk, cream and milk products (excluding butter, cheese) – 3 3
[333] Petroleum oils, oils from bitumin. materials, crude – 3 2
Average price index of the leading commodity group exported 36.5 132.1 103.8
Five leading destination markets of commodity exports (as a share of total commodity exports) 98
European Union (28) 42
Russian Federation 35
Ukraine 18
Kazakhstan 1
Republic of Moldova 1
Commodity imports (millions of US dollars) 819 15,980 16,354
Commodity imports (as a share of total merchandise imports) 15 45 48
Food imports (millions of US dollars and as a share of total merchandise imports) 484 (9) 3,943 (11) 4,260 (12)
Fuel imports (millions of US dollars and as a share of total merchandise imports) 62 (1) 10,217 (29) 10,083 (29)
Five-leading trading partners for commodity imports (as a share of total commodity imports) 92
Russian Federation 76
European Union (28) 10
Ukraine 4
Turkey 1
Norway 1
Percentage change of GDP measured in constant 2010 prices –10.4 3.8 2.4
GDP per capita measured in constant 2010 US dollars 2,037 6,446 6,393
Population (thousands) 7,945 7,950 7,883
Human Development Index (value and rank) 0.6570 (66) 0.8058 (50) 0.8080 (51)
Total employment (as a share of the population) 58.7 63.8 63.7
Share of women in total employment 48.3 49.7 49.7
Proportion of population below international poverty line – SDG 1. Indicator 1.1.1 (1995) 0.7 (2016) –
Gini index, latest available year (1995) 28.8 (2016) 27.0
Prevalence of undernourishment (per cent) – SDG 2. Indicator 2.1.1 2.5 2.5
Value added of agriculture/industry/services (as a share of GDP) 17/37/46 8/39/54 8/36/56
Employment in agriculture/industry/services (as a share of total employment) 24/36/41 10/33/58 10/31/59
Share of women in agriculture/industry/services 38/39/62 34/32/62 34/31/62
Institutional quality index, 2018 0.4391
Control of corruption –0.39 –0.33 –0.26
Rule of law –0.80 –0.82 –0.82
MERCHANDISE AND COMMODITY EXPORT DEPENDENCE
COMMODITY IMPORT DEPENDENCE
KEY SOCIOECONOMIC INDICATORS
OTHER STRUCTURAL INDICATORS](https://image.slidesharecdn.com/stateofcommoditydependance2019-190524115214/85/State-of-commodity-dependance-2019-52-320.jpg)
![Table of contents Introduction
Chapter 1
Key Findings
from the Report
Chapter 2
Country Statistical
Profiles
List of Country
Statistical Profiles
47
BELGIUM
1995 2013-2017 2017
Merchandise export value (millions of US dollars) 178,000 442,000 430,000
Unallocated exports (as a share of merchandise exports) 27.8 2.5 2.5
Merchandise export concentration by product line (Herfindahl-Hirschmann index) 0.1168 0.0990 0.0940
Commodity export value (millions of US dollars) 33,453 123,251 112,998
Commodity exports (as a share of total merchandise exports) 19 28 26
Commodity exports (as a share of GDP) 11.6 25.0 22.9
Total natural resources rents (as a share of GDP) – – –
Exports by commodity group (as a share of merchandise exports) 19 28 26
Agricultural commodities 8 11 11
Fuels 2 10 8
Ores, metals, precious stones and non-monetary gold 9 7 7
Three leading commodity exports (as a share of total merchandise exports) 7 13 11
[334] Petroleum oils or bituminous minerals 70 % oil 1 7 6
[667] Pearls, precious semi-precious stones 6 4 4
[343] Natural gas, whether or not liquefied – 2 1
Average price index of the leading commodity group exported 36.5 132.1 103.8
Five leading destination markets of commodity exports (as a share of total commodity exports) 82
European Union (28) 68
India 7
United States of America 3
United Arab Emirates 2
China 2
Commodity imports (millions of US dollars) 39,104 136,849 122,023
Commodity imports (as a share of total merchandise imports) 24 33 30
Food imports (millions of US dollars and as a share of total merchandise imports) 10,458 (6) 34,052 (8) 34,597 (9)
Fuel imports (millions of US dollars and as a share of total merchandise imports) 8,687 (5) 59,583 (14) 48,282 (12)
Five-leading trading partners for commodity imports (as a share of total commodity imports) 78
European Union (28) 62
Russian Federation 7
Norway 4
United States of America 3
India 2
Percentage change of GDP measured in constant 2010 prices 2.4 4.5 1.7
GDP per capita measured in constant 2010 US dollars 35,057 45,055 45,875
Population (thousands) 8,364 9,370 9,476
Human Development Index (value and rank) 0.8520 (7) 0.9122 (16) 0.9160 (16)
Total employment (as a share of the population) 45.7 49.1 49.4
Share of women in total employment 40.1 46.1 46.0
Proportion of population below international poverty line – SDG 1. Indicator 1.1.1 (2003) 0.2 (2015) –
Gini index, latest available year (2003) 28.1 (2015) 27.7
Prevalence of undernourishment (per cent) – SDG 2. Indicator 2.1.1 2.5 2.5
Value added of agriculture/industry/services (as a share of GDP) 1/29/70 1/22/77 1/22/77
Employment in agriculture/industry/services (as a share of total employment) 3/28/70 1/21/77 1/21/77
Share of women in agriculture/industry/services 26/17/50 29/18/54 28/18/54
Institutional quality index, 2018 0.8510
Control of corruption 1.36 1.59 1.50
Rule of law 1.37 1.43 1.34
OTHER STRUCTURAL INDICATORS
MERCHANDISE AND COMMODITY EXPORT DEPENDENCE
COMMODITY IMPORT DEPENDENCE
KEY SOCIOECONOMIC INDICATORS](https://image.slidesharecdn.com/stateofcommoditydependance2019-190524115214/85/State-of-commodity-dependance-2019-53-320.jpg)
![Table of contents Introduction
Chapter 1
Key Findings
from the Report
Chapter 2
Country Statistical
Profiles
List of Country
Statistical Profiles
48
BELIZE
1995 2013-2017 2017
Merchandise export value (millions of US dollars) 162 527 458
Unallocated exports (as a share of merchandise exports) 2.5 6.4 6.9
Merchandise export concentration by product line (Herfindahl-Hirschmann index) 0.3178 0.2452 0.2564
Commodity export value (millions of US dollars) 134 406 366
Commodity exports (as a share of total merchandise exports) 83 77 80
Commodity exports (as a share of GDP) 22.9 23.6 20.4
Total natural resources rents (as a share of GDP) 0.6 2.3 1.3
Exports by commodity group (as a share of merchandise exports) 83 77 80
Agricultural commodities 80 67 72
Fuels 3 9 7
Ores, metals, precious stones and non-monetary gold – 1 1
Three leading commodity exports (as a share of total merchandise exports) 60 45 49
[061] Sugar, molasses and honey 26 17 22
[03] Fishery products 19 17 17
[057] Fruits and nuts (excluding oil nuts), fresh or dried 15 11 11
Average price index of the leading commodity group exported 80.8 109.0 102.7
Five leading destination markets of commodity exports (as a share of total commodity exports) 75
European Union (28) 34
United States of America 28
Côte d'Ivoire 5
Jamaica 4
Trinidad and Tobago 4
Commodity imports (millions of US dollars) 82 356 333
Commodity imports (as a share of total merchandise imports) 32 38 36
Food imports (millions of US dollars and as a share of total merchandise imports) 36 (14) 119 (13) 118 (13)
Fuel imports (millions of US dollars and as a share of total merchandise imports) 37 (14) 156 (17) 131 (14)
Five-leading trading partners for commodity imports (as a share of total commodity imports) 71
Curaçao 27
United States of America 20
Mexico 13
Guatemala 7
European Union (28) 5
Percentage change of GDP measured in constant 2010 prices 4.2 9.7 1.6
GDP per capita measured in constant 2010 US dollars 3,423 4,366 4,307
Population (thousands) 119 243 257
Human Development Index (value and rank) 0.6620 (63) 0.7074 (102) 0.7080 (104)
Total employment (as a share of the population) 51.3 60.3 60.7
Share of women in total employment 27.9 37.2 37.8
Proportion of population below international poverty line – SDG 1. Indicator 1.1.1 (1995) 12.3 (1999) 14.9
Gini index, latest available year (1995) 57.6 (1999) 53.3
Prevalence of undernourishment (per cent) – SDG 2. Indicator 2.1.1 5.8 6.5
Value added of agriculture/industry/services (as a share of GDP) 20/23/57 14/18/69 11/18/71
Employment in agriculture/industry/services (as a share of total employment) 27/18/55 16/16/68 15/15/70
Share of women in agriculture/industry/services 6/18/44 9/20/48 8/21/48
Institutional quality index, 2018 0.4545
Control of corruption –0.03 –0.21 –0.27
Rule of law 0.08 –0.75 –0.96
MERCHANDISE AND COMMODITY EXPORT DEPENDENCE
COMMODITY IMPORT DEPENDENCE
KEY SOCIOECONOMIC INDICATORS
OTHER STRUCTURAL INDICATORS](https://image.slidesharecdn.com/stateofcommoditydependance2019-190524115214/85/State-of-commodity-dependance-2019-54-320.jpg)
![Table of contents Introduction
Chapter 1
Key Findings
from the Report
Chapter 2
Country Statistical
Profiles
List of Country
Statistical Profiles
49
BENIN*
1995 2013-2017 2017
Merchandise export value (millions of US dollars) 420 2,012 2,056
Unallocated exports (as a share of merchandise exports) .. 0.4 0.4
Merchandise export concentration by product line (Herfindahl-Hirschmann index) 0.6696 0.3192 0.3150
Commodity export value (millions of US dollars) 402 1,715 1,780
Commodity exports (as a share of total merchandise exports) 96 85 87
Commodity exports (as a share of GDP) 17.1 18.8 18.6
Total natural resources rents (as a share of GDP) 9.0 5.5 6.8
Exports by commodity group (as a share of merchandise exports) 96 85 87
Agricultural commodities 89 51 56
Fuels 5 14 7
Ores, metals, precious stones and non-monetary gold 2 21 23
Three leading commodity exports (as a share of total merchandise exports) 71 50 49
[263] Cotton 70 19 22
[971] Gold, non-monetary (excluding gold ores and concentrates) – 17 20
[334] Petroleum oils or bituminous minerals 70 % oil 1 13 7
Average price index of the leading commodity group exported 99.7 110.0 105.1
Five leading destination markets of commodity exports (as a share of total commodity exports) 59
India 15
United Arab Emirates 15
Sierra Leone 11
China 9
Nigeria 9
Commodity imports (millions of US dollars) 291 1,301 1,448
Commodity imports (as a share of total merchandise imports) 40 43 45
Food imports (millions of US dollars and as a share of total merchandise imports) 178 (25) 998 (33) 1,088 (34)
Fuel imports (millions of US dollars and as a share of total merchandise imports) 68 (9) 196 (7) 240 (7)
Five-leading trading partners for commodity imports (as a share of total commodity imports) 67
European Union (28) 20
Thailand 17
India 15
Malaysia 10
China 5
Percentage change of GDP measured in constant 2010 prices 10.1 23.0 5.4
GDP per capita measured in constant 2010 US dollars 631 848 889
Population (thousands) 3,226 6,028 6,407
Human Development Index (value and rank) 0.3730 (131) 0.5080 (159) 0.5150 (160)
Total employment (as a share of the population) 71.8 69.0 69.1
Share of women in total employment 43.4 49.0 49.1
Proportion of population below international poverty line – SDG 1. Indicator 1.1.1 (2003) 48.8 (2015) 49.6
Gini index, latest available year (2003) 38.6 (2015) 47.8
Prevalence of undernourishment (per cent) – SDG 2. Indicator 2.1.1 22.7 10.4
Value added of agriculture/industry/services (as a share of GDP) 24/33/44 23/23/53 23/24/53
Employment in agriculture/industry/services (as a share of total employment) 52/8/40 42/18/40 43/18/38
Share of women in agriculture/industry/services 36/28/55 40/45/61 40/45/61
Institutional quality index, 2018 0.3709
Control of corruption –0.55 –0.61 –0.55
Rule of law 0.05 –0.57 –0.62
OTHER STRUCTURAL INDICATORS
MERCHANDISE AND COMMODITY EXPORT DEPENDENCE
COMMODITY IMPORT DEPENDENCE
KEY SOCIOECONOMIC INDICATORS](https://image.slidesharecdn.com/stateofcommoditydependance2019-190524115214/85/State-of-commodity-dependance-2019-55-320.jpg)
![Table of contents Introduction
Chapter 1
Key Findings
from the Report
Chapter 2
Country Statistical
Profiles
List of Country
Statistical Profiles
50
BHUTAN*
1995 2013-2017 2017
Merchandise export value (millions of US dollars) 103 551 568
Unallocated exports (as a share of merchandise exports) 0.4 0.3 0.1
Merchandise export concentration by product line (Herfindahl-Hirschmann index) 0.2905 0.3697 0.3748
Commodity export value (millions of US dollars) 32 192 224
Commodity exports (as a share of total merchandise exports) 30 35 39
Commodity exports (as a share of GDP) 10.9 9.1 8.7
Total natural resources rents (as a share of GDP) 5.9 3.8 4.5
Exports by commodity group (as a share of merchandise exports) 30 35 39
Agricultural commodities 28 8 9
Fuels – 14 17
Ores, metals, precious stones and non-monetary gold 2 13 13
Three leading commodity exports (as a share of total merchandise exports) 1 21 22
[351] Electric current – 13 16
[682] Copper – 4 4
[273] Stone, sand and gravel 1 3 3
Average price index of the leading commodity group exported 36.5 132.1 103.8
Five leading destination markets of commodity exports (as a share of total commodity exports) 99
India 77
Bangladesh 19
Nepal 3
Nigeria 1
Commodity imports (millions of US dollars) 23 376 402
Commodity imports (as a share of total merchandise imports) 20 38 39
Food imports (millions of US dollars and as a share of total merchandise imports) 13 (12) 119 (12) 126 (12)
Fuel imports (millions of US dollars and as a share of total merchandise imports) 2 (2) 175 (18) 190 (18)
Five-leading trading partners for commodity imports (as a share of total commodity imports) 97
India 93
Republic of Korea 2
Thailand 1
China 1
European Union (28) 1
Percentage change of GDP measured in constant 2010 prices 6.8 25.4 6.8
GDP per capita measured in constant 2010 US dollars 953 2,657 2,955
Population (thousands) 286 571 593
Human Development Index (value and rank) .. 0.6024 (132) 0.6120 (131)
Total employment (as a share of the population) 61.9 64.4 65.3
Share of women in total employment 38.4 39.6 39.8
Proportion of population below international poverty line – SDG 1. Indicator 1.1.1 (2003) 17.6 (2017) 1.5
Gini index, latest available year (2003) 40.9 (2017) 37.4
Prevalence of undernourishment (per cent) – SDG 2. Indicator 2.1.1 .. ..
Value added of agriculture/industry/services (as a share of GDP) 33/34/33 17/44/39 17/43/39
Employment in agriculture/industry/services (as a share of total employment) 83/2/15 27/10/33 57/10/33
Share of women in agriculture/industry/services 43/25/19 46/36/30 46/38/30
Institutional quality index, 2018 0.5663
Control of corruption 0.94 1.18 1.57
Rule of law –0.03 0.46 0.63
MERCHANDISE AND COMMODITY EXPORT DEPENDENCE
COMMODITY IMPORT DEPENDENCE
KEY SOCIOECONOMIC INDICATORS
OTHER STRUCTURAL INDICATORS](https://image.slidesharecdn.com/stateofcommoditydependance2019-190524115214/85/State-of-commodity-dependance-2019-56-320.jpg)
![Table of contents Introduction
Chapter 1
Key Findings
from the Report
Chapter 2
Country Statistical
Profiles
List of Country
Statistical Profiles
51
BOLIVIA (PLURINATIONAL STATE OF)
1995 2013-2017 2017
Merchandise export value (millions of US dollars) 1,181 9,745 7,852
Unallocated exports (as a share of merchandise exports) 0.3 0.5 0.7
Merchandise export concentration by product line (Herfindahl-Hirschmann index) 0.1991 0.4199 0.3701
Commodity export value (millions of US dollars) 996 9,299 7,443
Commodity exports (as a share of total merchandise exports) 84 95 95
Commodity exports (as a share of GDP) 14.8 27.8 20.2
Total natural resources rents (as a share of GDP) 2.6 8.5 6.0
Exports by commodity group (as a share of merchandise exports) 84 95 95
Agricultural commodities 33 18 16
Fuels 11 46 35
Ores, metals, precious stones and non-monetary gold 40 31 44
Three leading commodity exports (as a share of total merchandise exports) 29 64 65
[343] Natural gas, whether or not liquefied 7 43 33
[287] Ores and concentrates of base metals, n.e.s. 12 11 18
[971] Gold, non-monetary (excluding gold ores and concentrates) 11 9 14
Average price index of the leading commodity group exported 36.5 132.1 103.8
Five leading destination markets of commodity exports (as a share of total commodity exports) 71
Brazil 29
Argentina 18
United States of America 11
European Union (28) 7
Colombia 6
Commodity imports (millions of US dollars) 305 1,754 1,698
Commodity imports (as a share of total merchandise imports) 22 19 18
Food imports (millions of US dollars and as a share of total merchandise imports) 160 (11) 694 (7) 758 (8)
Fuel imports (millions of US dollars and as a share of total merchandise imports) 53 (4) 823 (9) 682 (7)
Five-leading trading partners for commodity imports (as a share of total commodity imports) 82
Argentina 30
Chile 15
Brazil 14
United States of America 12
Peru 10
Percentage change of GDP measured in constant 2010 prices 4.7 22.9 4.2
GDP per capita measured in constant 2010 US dollars 1,504 2,384 2,523
Population (thousands) 4,547 7,244 7,555
Human Development Index (value and rank) 0.5710 (95) 0.6812 (116) 0.6930 (116)
Total employment (as a share of the population) 67.0 66.6 65.3
Share of women in total employment 41.3 41.4 40.8
Proportion of population below international poverty line – SDG 1. Indicator 1.1.1 (1997) 19.3 (2016) 7.1
Gini index, latest available year (1997) 58.2 (2016) 44.6
Prevalence of undernourishment (per cent) – SDG 2. Indicator 2.1.1 33.4 19.8
Value added of agriculture/industry/services (as a share of GDP) 16/32/52 13/33/54 13/29/58
Employment in agriculture/industry/services (as a share of total employment) 39/20/40 28/22/50 27/22/51
Share of women in agriculture/industry/services 41/26/49 42/20/50 41/20/50
Institutional quality index, 2018 0.2525
Control of corruption –0.82 –0.66 –0.66
Rule of law –0.26 –1.13 –1.21
OTHER STRUCTURAL INDICATORS
MERCHANDISE AND COMMODITY EXPORT DEPENDENCE
COMMODITY IMPORT DEPENDENCE
KEY SOCIOECONOMIC INDICATORS](https://image.slidesharecdn.com/stateofcommoditydependance2019-190524115214/85/State-of-commodity-dependance-2019-57-320.jpg)
![Table of contents Introduction
Chapter 1
Key Findings
from the Report
Chapter 2
Country Statistical
Profiles
List of Country
Statistical Profiles
52
BOSNIA AND HERZEGOVINA
1995 2013-2017 2017
Merchandise export value (millions of US dollars) 152 5,674 6,367
Unallocated exports (as a share of merchandise exports) 0.8 1.0 0.9
Merchandise export concentration by product line (Herfindahl-Hirschmann index) 0.1558 0.1032 0.1004
Commodity export value (millions of US dollars) 72 1,860 2,001
Commodity exports (as a share of total merchandise exports) 47 33 31
Commodity exports (as a share of GDP) 3.5 10.6 11.1
Total natural resources rents (as a share of GDP) 1.1 1.4 1.1
Exports by commodity group (as a share of merchandise exports) 47 33 31
Agricultural commodities 37 15 14
Fuels 4 8 9
Ores, metals, precious stones and non-monetary gold 7 9 9
Three leading commodity exports (as a share of total merchandise exports) 22 14 14
[24 + 25] Forestry products 20 6 5
[684] Aluminium 2 5 4
[351] Electric current – 4 5
Average price index of the leading commodity group exported 99.7 110.0 105.1
Five leading destination markets of commodity exports (as a share of total commodity exports) 93
European Union (28) 63
Serbia 15
Turkey 8
Montenegro 4
Republic of North Macedonia 2
Commodity imports (millions of US dollars) 551 3,489 3,431
Commodity imports (as a share of total merchandise imports) 51 35 33
Food imports (millions of US dollars and as a share of total merchandise imports) 314 (29) 1,486 (15) 1,568 (15)
Fuel imports (millions of US dollars and as a share of total merchandise imports) 114 (11) 1,277 (13) 1,105 (11)
Five-leading trading partners for commodity imports (as a share of total commodity imports) 92
European Union (28) 57
Serbia 19
Russian Federation 12
United States of America 2
Brazil 1
Percentage change of GDP measured in constant 2010 prices 20.8 6.8 3.0
GDP per capita measured in constant 2010 US dollars 1,105 5,203 5,563
Population (thousands) 2,997 3,033 3,011
Human Development Index (value and rank) .. 0.7580 (76) 0.7680 (75)
Total employment (as a share of the population) 37.1 34.4 34.7
Share of women in total employment 38.3 37.3 36.5
Proportion of population below international poverty line – SDG 1. Indicator 1.1.1 (2001) 0.3 (2015) 0.2
Gini index, latest available year (2001) 30.0 (2015) 32.7
Prevalence of undernourishment (per cent) – SDG 2. Indicator 2.1.1 4.4 2.5
Value added of agriculture/industry/services (as a share of GDP) 22/32/46 7/26/66 8/27/65
Employment in agriculture/industry/services (as a share of total employment) 48/27/25 18/32/49 19/32/49
Share of women in agriculture/industry/services 45/24/42 37/23/47 35/22/47
Institutional quality index, 2018 0.4496
Control of corruption –0.27 –0.38 –0.52
Rule of law –0.24 –0.21 –0.21
MERCHANDISE AND COMMODITY EXPORT DEPENDENCE
COMMODITY IMPORT DEPENDENCE
KEY SOCIOECONOMIC INDICATORS
OTHER STRUCTURAL INDICATORS](https://image.slidesharecdn.com/stateofcommoditydependance2019-190524115214/85/State-of-commodity-dependance-2019-58-320.jpg)
![Table of contents Introduction
Chapter 1
Key Findings
from the Report
Chapter 2
Country Statistical
Profiles
List of Country
Statistical Profiles
53
BOTSWANA
1995 2013-2017 2017
Merchandise export value (millions of US dollars) 2,142 7,005 5,898
Unallocated exports (as a share of merchandise exports) 6.8 0.2 0.1
Merchandise export concentration by product line (Herfindahl-Hirschmann index) 0.7056 0.8428 0.8945
Commodity export value (millions of US dollars) 1,811 6,601 5,556
Commodity exports (as a share of total merchandise exports) 85 94 94
Commodity exports (as a share of GDP) 38.3 42.2 32.5
Total natural resources rents (as a share of GDP) 1.3 2.2 1.0
Exports by commodity group (as a share of merchandise exports) 84 94 94
Agricultural commodities 4 2 2
Fuels – – –
Ores, metals, precious stones and non-monetary gold 81 92 92
Three leading commodity exports (as a share of total merchandise exports) 77 91 91
[667] Pearls, precious semi-precious stones 72 85 90
[284] Nickel ores concentrates; nickel mattes, etc. 2 5 –
[011] Meat of bovine animals, fresh, chilled or frozen 3 2 1
Average price index of the leading commodity group exported 33.4 110.1 107.6
Five leading destination markets of commodity exports (as a share of total commodity exports) 73
European Union (28) 38
India 14
United Arab Emirates 9
South Africa 6
Namibia 6
Commodity imports (millions of US dollars) 459 3,961 2,896
Commodity imports (as a share of total merchandise imports) 24 58 55
Food imports (millions of US dollars and as a share of total merchandise imports) 227 (12) 602 (9) 551 (10)
Fuel imports (millions of US dollars and as a share of total merchandise imports) 107 (6) 962 (14) 698 (13)
Five-leading trading partners for commodity imports (as a share of total commodity imports) 96
South Africa 54
Namibia 20
Canada 11
European Union (28) 9
Israel 2
Percentage change of GDP measured in constant 2010 prices 7.0 21.1 2.4
GDP per capita measured in constant 2010 US dollars 4,238 7,460 7,524
Population (thousands) 924 1,507 1,572
Human Development Index (value and rank) 0.5770 (92) 0.7058 (104) 0.7170 (99)
Total employment (as a share of the population) 48.4 59.1 59.4
Share of women in total employment 39.6 44.4 44.5
Proportion of population below international poverty line – SDG 1. Indicator 1.1.1 (2002) 29.8 (2009) 18.2
Gini index, latest available year (2002) 64.7 (2009) 60.5
Prevalence of undernourishment (per cent) – SDG 2. Indicator 2.1.1 35.7 28.5
Value added of agriculture/industry/services (as a share of GDP) 5/46/49 2/35/63 2/35/63
Employment in agriculture/industry/services (as a share of total employment) 16/25/58 26/14/60 26/14/60
Share of women in agriculture/industry/services 26/30/47 36/15/55 36/16/55
Institutional quality index, 2018 0.6635
Control of corruption 0.82 0.87 0.80
Rule of law 0.58 0.57 0.51
OTHER STRUCTURAL INDICATORS
MERCHANDISE AND COMMODITY EXPORT DEPENDENCE
COMMODITY IMPORT DEPENDENCE
KEY SOCIOECONOMIC INDICATORS](https://image.slidesharecdn.com/stateofcommoditydependance2019-190524115214/85/State-of-commodity-dependance-2019-59-320.jpg)
![Table of contents Introduction
Chapter 1
Key Findings
from the Report
Chapter 2
Country Statistical
Profiles
List of Country
Statistical Profiles
54
BRAZIL
1995 2013-2017 2017
Merchandise export value (millions of US dollars) 46,505 212,200 218,000
Unallocated exports (as a share of merchandise exports) 1.3 1.6 1.2
Merchandise export concentration by product line (Herfindahl-Hirschmann index) 0.0865 0.1397 0.1457
Commodity export value (millions of US dollars) 21,346 133,386 137,674
Commodity exports (as a share of total merchandise exports) 46 63 63
Commodity exports (as a share of GDP) 2.7 6.3 6.7
Total natural resources rents (as a share of GDP) 1.2 3.6 3.1
Exports by commodity group (as a share of merchandise exports) 46 63 63
Agricultural commodities 34 40 40
Fuels 1 8 9
Ores, metals, precious stones and non-monetary gold 11 15 14
Three leading commodity exports (as a share of total merchandise exports) 7 27 28
[222] Oil seeds and oleaginous fruits (excluding flour) 2 11 12
[281] Iron ore and concentrates 5 10 9
[333] Petroleum oils, oils from bitumin. materials, crude – 6 8
Average price index of the leading commodity group exported 80.8 109.0 102.7
Five leading destination markets of commodity exports (as a share of total commodity exports) 61
China 29
European Union (28) 19
United States of America 7
Japan 4
India 2
Commodity imports (millions of US dollars) 15,547 48,546 38,573
Commodity imports (as a share of total merchandise imports) 29 26 26
Food imports (millions of US dollars and as a share of total merchandise imports) 5,399 (10) 9,756 (5) 9,261 (6)
Fuel imports (millions of US dollars and as a share of total merchandise imports) 6,491 (12) 30,492 (16) 21,551 (14)
Five-leading trading partners for commodity imports (as a share of total commodity imports) 51
United States of America 16
European Union (28) 11
Nigeria 11
Argentina 8
Chile 6
Percentage change of GDP measured in constant 2010 prices 4.2 3.3 1.0
GDP per capita measured in constant 2010 US dollars 8,632 11,355 10,846
Population (thousands) 108,740 159,471 163,774
Human Development Index (value and rank) 0.6480 (71) 0.7548 (78) 0.7590 (77)
Total employment (as a share of the population) 59.8 57.9 55.2
Share of women in total employment 36.9 41.9 41.9
Proportion of population below international poverty line – SDG 1. Indicator 1.1.1 (1995) 13.0 (2015) 3.4
Gini index, latest available year (1995) 59.6 (2015) 51.3
Prevalence of undernourishment (per cent) – SDG 2. Indicator 2.1.1 11.9 2.5
Value added of agriculture/industry/services (as a share of GDP) 6/26/69 5/24/71 5/25/70
Employment in agriculture/industry/services (as a share of total employment) 26/20/54 10/22/68 10/21/69
Share of women in agriculture/industry/services 31/17/47 20/22/52 20/22/51
Institutional quality index, 2018 0.4043
Control of corruption –0.02 –0.35 –0.53
Rule of law –0.22 –0.14 –0.28
MERCHANDISE AND COMMODITY EXPORT DEPENDENCE
COMMODITY IMPORT DEPENDENCE
KEY SOCIOECONOMIC INDICATORS
OTHER STRUCTURAL INDICATORS](https://image.slidesharecdn.com/stateofcommoditydependance2019-190524115214/85/State-of-commodity-dependance-2019-60-320.jpg)
![Table of contents Introduction
Chapter 1
Key Findings
from the Report
Chapter 2
Country Statistical
Profiles
List of Country
Statistical Profiles
55
BRUNEI DARUSSALAM
1995 2013-2017 2017
Merchandise export value (millions of US dollars) 2,379 7,751 5,571
Unallocated exports (as a share of merchandise exports) 0.5 0.2 0.3
Merchandise export concentration by product line (Herfindahl-Hirschmann index) 0.5975 0.6411 0.6276
Commodity export value (millions of US dollars) 2,170 7,341 5,142
Commodity exports (as a share of total merchandise exports) 91 95 92
Commodity exports (as a share of GDP) 41.4 50.8 40.4
Total natural resources rents (as a share of GDP) 15.8 13.5 9.2
Exports by commodity group (as a share of merchandise exports) 91 94 92
Agricultural commodities – – –
Fuels 91 94 92
Ores, metals, precious stones and non-monetary gold – – –
Three leading commodity exports (as a share of total merchandise exports) 88 94 92
[343] Natural gas, whether or not liquefied 47 52 50
[333] Petroleum oils, oils from bitumin. materials, crude 41 42 41
[667] Pearls, precious semi-precious stones – – –
Average price index of the leading commodity group exported 36.5 132.1 103.8
Five leading destination markets of commodity exports (as a share of total commodity exports) 78
Japan 39
Republic of Korea 15
India 9
Thailand 8
Australia 7
Commodity imports (millions of US dollars) 367 834 789
Commodity imports (as a share of total merchandise imports) 18 26 26
Food imports (millions of US dollars and as a share of total merchandise imports) 241 (12) 466 (14) 426 (14)
Fuel imports (millions of US dollars and as a share of total merchandise imports) 4 (–) 265 (8) 266 (9)
Five-leading trading partners for commodity imports (as a share of total commodity imports) 85
Malaysia 39
Singapore 32
Thailand 6
Australia 4
China 3
Percentage change of GDP measured in constant 2010 prices 4.5 –2.4 0.5
GDP per capita measured in constant 2010 US dollars 37,703 32,631 31,183
Population (thousands) 199 318 330
Human Development Index (value and rank) 0.8050 (20) 0.8526 (35) 0.8530 (37)
Total employment (as a share of the population) 62.8 63.1 62.4
Share of women in total employment 35.2 41.9 42.2
Proportion of population below international poverty line – SDG 1. Indicator 1.1.1 .. ..
Gini index, latest available year .. ..
Prevalence of undernourishment (per cent) – SDG 2. Indicator 2.1.1 3.1 2.6
Value added of agriculture/industry/services (as a share of GDP) 1/53/46 1/63/36 1/56/42
Employment in agriculture/industry/services (as a share of total employment) 2/25/74 1/19/81 1/18/82
Share of women in agriculture/industry/services –/16/42 33/25/46 34/24/46
Institutional quality index, 2018 ..
Control of corruption 0.48 0.61 0.71
Rule of law 0.82 0.54 0.65
OTHER STRUCTURAL INDICATORS
MERCHANDISE AND COMMODITY EXPORT DEPENDENCE
COMMODITY IMPORT DEPENDENCE
KEY SOCIOECONOMIC INDICATORS](https://image.slidesharecdn.com/stateofcommoditydependance2019-190524115214/85/State-of-commodity-dependance-2019-61-320.jpg)
![Table of contents Introduction
Chapter 1
Key Findings
from the Report
Chapter 2
Country Statistical
Profiles
List of Country
Statistical Profiles
56
BULGARIA
1995 2013-2017 2017
Merchandise export value (millions of US dollars) 5,353 28,189 30,182
Unallocated exports (as a share of merchandise exports) 2.6 4.0 5.4
Merchandise export concentration by product line (Herfindahl-Hirschmann index) 0.0876 0.1020 0.0934
Commodity export value (millions of US dollars) 1,996 12,043 11,578
Commodity exports (as a share of total merchandise exports) 37 43 38
Commodity exports (as a share of GDP) 13.8 22.1 20.3
Total natural resources rents (as a share of GDP) 1.7 1.5 1.3
Exports by commodity group (as a share of merchandise exports) 37 43 38
Agricultural commodities 21 17 16
Fuels 7 11 8
Ores, metals, precious stones and non-monetary gold 10 14 14
Three leading commodity exports (as a share of total merchandise exports) 12 20 17
[682] Copper 5 9 9
[334] Petroleum oils or bituminous minerals 70 % oil 6 8 6
[041] Wheat (including spelt) and meslin, unmilled – 3 3
Average price index of the leading commodity group exported 58.3 123.5 127.5
Five leading destination markets of commodity exports (as a share of total commodity exports) 78
European Union (28) 53
Turkey 14
China 5
Singapore 3
Egypt 2
Commodity imports (millions of US dollars) 2,736 11,881 11,905
Commodity imports (as a share of total merchandise imports) 48 37 35
Food imports (millions of US dollars and as a share of total merchandise imports) 368 (7) 2,631 (8) 2,900 (8)
Fuel imports (millions of US dollars and as a share of total merchandise imports) 1,906 (34) 5,563 (17) 4,827 (14)
Five-leading trading partners for commodity imports (as a share of total commodity imports) 86
European Union (28) 44
Russian Federation 33
Turkey 4
Serbia 2
Georgia 2
Percentage change of GDP measured in constant 2010 prices 2.9 7.6 3.7
GDP per capita measured in constant 2010 US dollars 4,217 7,671 8,313
Population (thousands) 6,879 6,174 6,076
Human Development Index (value and rank) 0.6960 (48) 0.8038 (52) 0.8130 (49)
Total employment (as a share of the population) 46.2 48.7 50.1
Share of women in total employment 47.6 46.9 46.5
Proportion of population below international poverty line – SDG 1. Indicator 1.1.1 (1995) 1.1 (2014) 1.5
Gini index, latest available year (1995) 32.8 (2014) 37.4
Prevalence of undernourishment (per cent) – SDG 2. Indicator 2.1.1 4.8 3.0
Value added of agriculture/industry/services (as a share of GDP) 13/26/61 5/28/67 5/28/67
Employment in agriculture/industry/services (as a share of total employment) 15/34/51 7/30/63 6/29/64
Share of women in agriculture/industry/services 39/41/55 30/36/54 29/34/54
Institutional quality index, 2018 0.6549
Control of corruption –0.36 –0.22 –0.16
Rule of law –0.34 –0.07 –0.04
MERCHANDISE AND COMMODITY EXPORT DEPENDENCE
COMMODITY IMPORT DEPENDENCE
KEY SOCIOECONOMIC INDICATORS
OTHER STRUCTURAL INDICATORS](https://image.slidesharecdn.com/stateofcommoditydependance2019-190524115214/85/State-of-commodity-dependance-2019-62-320.jpg)
![Table of contents Introduction
Chapter 1
Key Findings
from the Report
Chapter 2
Country Statistical
Profiles
List of Country
Statistical Profiles
57
BURKINA FASO*
1995 2013-2017 2017
Merchandise export value (millions of US dollars) 276 2,479 2,888
Unallocated exports (as a share of merchandise exports) 0.2 0.1 0.1
Merchandise export concentration by product line (Herfindahl-Hirschmann index) 0.5583 0.6106 0.6216
Commodity export value (millions of US dollars) 254 2,364 2,763
Commodity exports (as a share of total merchandise exports) 92 95 96
Commodity exports (as a share of GDP) 10.6 19.9 21.1
Total natural resources rents (as a share of GDP) 13.9 18.6 20.4
Exports by commodity group (as a share of merchandise exports) 92 95 96
Agricultural commodities 79 28 28
Fuels 1 4 2
Ores, metals, precious stones and non-monetary gold 11 64 65
Three leading commodity exports (as a share of total merchandise exports) 74 82 83
[971] Gold, non-monetary (excluding gold ores and concentrates) 11 61 62
[263] Cotton 57 17 16
[222] Oil seeds and oleaginous fruits (excluding flour) 5 5 5
Average price index of the leading commodity group exported 33.4 110.1 107.6
Five leading destination markets of commodity exports (as a share of total commodity exports) 77
Switzerland 56
India 7
European Union (28) 5
Singapore 5
China 4
Commodity imports (millions of US dollars) 159 1,456 1,549
Commodity imports (as a share of total merchandise imports) 33 40 41
Food imports (millions of US dollars and as a share of total merchandise imports) 80 (17) 456 (13) 495 (13)
Fuel imports (millions of US dollars and as a share of total merchandise imports) 55 (11) 853 (24) 894 (24)
Five-leading trading partners for commodity imports (as a share of total commodity imports) 70
Côte d'Ivoire 27
European Union (28) 21
Ghana 8
Niger 8
Togo 6
Percentage change of GDP measured in constant 2010 prices 5.7 24.2 7.4
GDP per capita measured in constant 2010 US dollars 365 655 693
Population (thousands) 5,336 9,866 10,522
Human Development Index (value and rank) .. 0.4122 (182) 0.4230 (180)
Total employment (as a share of the population) 78.8 62.6 62.3
Share of women in total employment 47.3 43.2 43.2
Proportion of population below international poverty line – SDG 1. Indicator 1.1.1 (1998) 81.6 (2014) 43.7
Gini index, latest available year (1998) 49.9 (2014) 35.3
Prevalence of undernourishment (per cent) – SDG 2. Indicator 2.1.1 25.4 21.3
Value added of agriculture/industry/services (as a share of GDP) 34/25/41 33/22/45 30/26/44
Employment in agriculture/industry/services (as a share of total employment) 89/3/8 31/30/39 28/32/40
Share of women in agriculture/industry/services 48/41/40 32/44/52 30/44/52
Institutional quality index, 2018 0.4032
Control of corruption 0.11 –0.31 –0.11
Rule of law –0.93 –0.49 –0.40
OTHER STRUCTURAL INDICATORS
MERCHANDISE AND COMMODITY EXPORT DEPENDENCE
COMMODITY IMPORT DEPENDENCE
KEY SOCIOECONOMIC INDICATORS](https://image.slidesharecdn.com/stateofcommoditydependance2019-190524115214/85/State-of-commodity-dependance-2019-63-320.jpg)
![Table of contents Introduction
Chapter 1
Key Findings
from the Report
Chapter 2
Country Statistical
Profiles
List of Country
Statistical Profiles
58
BURUNDI*
1995 2013-2017 2017
Merchandise export value (millions of US dollars) 106 126 172
Unallocated exports (as a share of merchandise exports) 0.1 0.3 0.2
Merchandise export concentration by product line (Herfindahl-Hirschmann index) 0.7222 0.4850 0.3952
Commodity export value (millions of US dollars) 101 113 156
Commodity exports (as a share of total merchandise exports) 95 89 91
Commodity exports (as a share of GDP) 10.1 4.0 5.0
Total natural resources rents (as a share of GDP) 24.0 16.0 17.5
Exports by commodity group (as a share of merchandise exports) 96 89 91
Agricultural commodities 92 40 48
Fuels – – –
Ores, metals, precious stones and non-monetary gold 4 49 42
Three leading commodity exports (as a share of total merchandise exports) 84 75 69
[971] Gold, non-monetary (excluding gold ores and concentrates) 2 44 33
[071] Coffee and coffee substitutes 74 20 23
[074] Tea and mate 8 10 13
Average price index of the leading commodity group exported 33.4 110.1 107.6
Five leading destination markets of commodity exports (as a share of total commodity exports) 82
United Arab Emirates 50
European Union (28) 14
Democratic Republic of the Congo 7
Pakistan 7
Switzerland 3
Commodity imports (millions of US dollars) 88 218 247
Commodity imports (as a share of total merchandise imports) 37 30 34
Food imports (millions of US dollars and as a share of total merchandise imports) 39 (16) 96 (13) 126 (17)
Fuel imports (millions of US dollars and as a share of total merchandise imports) 34 (15) 95 (13) 96 (13)
Five-leading trading partners for commodity imports (as a share of total commodity imports) 54
Saudi Arabia 16
United Republic of Tanzania 10
India 10
European Union (28) 10
Kenya 9
Percentage change of GDP measured in constant 2010 prices –7.0 13.5 –
GDP per capita measured in constant 2010 US dollars 262 236 225
Population (thousands) 3,014 5,645 5,976
Human Development Index (value and rank) 0.2960 (140) 0.4176 (179) 0.4170 (182)
Total employment (as a share of the population) 86.1 77.3 77.6
Share of women in total employment 53.2 52.6 52.6
Proportion of population below international poverty line – SDG 1. Indicator 1.1.1 (1998) 84.1 (2013) 71.7
Gini index, latest available year (1998) 42.4 (2013) 38.6
Prevalence of undernourishment (per cent) – SDG 2. Indicator 2.1.1 .. ..
Value added of agriculture/industry/services (as a share of GDP) 48/19/33 39/16/45 38/15/47
Employment in agriculture/industry/services (as a share of total employment) 92/2/6 91/2/6 91/2/6
Share of women in agriculture/industry/services 56/15/24 55/16/24 55/17/24
Institutional quality index, 2018 0.1224
Control of corruption –0.68 –1.29 –1.28
Rule of law –1.42 –1.21 –1.40
MERCHANDISE AND COMMODITY EXPORT DEPENDENCE
COMMODITY IMPORT DEPENDENCE
KEY SOCIOECONOMIC INDICATORS
OTHER STRUCTURAL INDICATORS](https://image.slidesharecdn.com/stateofcommoditydependance2019-190524115214/85/State-of-commodity-dependance-2019-64-320.jpg)
![Table of contents Introduction
Chapter 1
Key Findings
from the Report
Chapter 2
Country Statistical
Profiles
List of Country
Statistical Profiles
59
CABO VERDE
1995 2013-2017 2017
Merchandise export value (millions of US dollars) 9 65 50
Unallocated exports (as a share of merchandise exports) 1.9 0.2 0.2
Merchandise export concentration by product line (Herfindahl-Hirschmann index) 0.3690 0.3881 0.3899
Commodity export value (millions of US dollars) 3 29 34
Commodity exports (as a share of total merchandise exports) 33 44 68
Commodity exports (as a share of GDP) 0.5 1.7 1.9
Total natural resources rents (as a share of GDP) 0.7 0.7 0.8
Exports by commodity group (as a share of merchandise exports) 29 44 67
Agricultural commodities 15 38 64
Fuels 9 5 1
Ores, metals, precious stones and non-monetary gold 6 1 3
Three leading commodity exports (as a share of total merchandise exports) 22 42 63
[03] Fishery products 13 37 62
[334] Petroleum oils or bituminous minerals 70 % oil 9 5 –
[282] Ferrous waste, scrape; remelting ingots, iron, steel – 1 1
Average price index of the leading commodity group exported 80.8 109.0 102.7
Five leading destination markets of commodity exports (as a share of total commodity exports) 91
European Union (28) 84
India 2
Morocco 2
Turkey 2
El Salvador 2
Commodity imports (millions of US dollars) 122 331 343
Commodity imports (as a share of total merchandise imports) 48 46 43
Food imports (millions of US dollars and as a share of total merchandise imports) 67 (27) 187 (26) 219 (28)
Fuel imports (millions of US dollars and as a share of total merchandise imports) 37 (15) 104 (15) 87 (1)
Five-leading trading partners for commodity imports (as a share of total commodity imports) 87
European Union (28) 73
Brazil 8
Thailand 3
China 2
Argentina 1
Percentage change of GDP measured in constant 2010 prices 7.5 6.7 3.9
GDP per capita measured in constant 2010 US dollars 1,723 3,421 3,537
Population (thousands) 213 367 381
Human Development Index (value and rank) .. 0.6478 (123) 0.6540 (122)
Total employment (as a share of the population) 54.9 53.8 54.3
Share of women in total employment 36.8 40.5 41.1
Proportion of population below international poverty line – SDG 1. Indicator 1.1.1 (2001) 16.0 (2007) 8.1
Gini index, latest available year (2001) 52.5 (2007) 47.2
Prevalence of undernourishment (per cent) – SDG 2. Indicator 2.1.1 17.9 12.3
Value added of agriculture/industry/services (as a share of GDP) 16/30/54 9/20/70 9/20/71
Employment in agriculture/industry/services (as a share of total employment) 79/9/13 68/7/25 68/7/25
Share of women in agriculture/industry/services 40/20/27 45/21/33 46/21/33
Institutional quality index, 2018 0.5485
Control of corruption 1.14 0.89 0.84
Rule of law 1.04 0.50 0.41
OTHER STRUCTURAL INDICATORS
MERCHANDISE AND COMMODITY EXPORT DEPENDENCE
COMMODITY IMPORT DEPENDENCE
KEY SOCIOECONOMIC INDICATORS](https://image.slidesharecdn.com/stateofcommoditydependance2019-190524115214/85/State-of-commodity-dependance-2019-65-320.jpg)
![Table of contents Introduction
Chapter 1
Key Findings
from the Report
Chapter 2
Country Statistical
Profiles
List of Country
Statistical Profiles
60
CAMBODIA*
1995 2013-2017 2017
Merchandise export value (millions of US dollars) 855 8,627 11,011
Unallocated exports (as a share of merchandise exports) 0.5 0.1 0.2
Merchandise export concentration by product line (Herfindahl-Hirschmann index) 0.4010 0.3103 0.3009
Commodity export value (millions of US dollars) 661 1,135 1,284
Commodity exports (as a share of total merchandise exports) 77 13 12
Commodity exports (as a share of GDP) 20.0 6.1 5.8
Total natural resources rents (as a share of GDP) 8.3 2.0 1.9
Exports by commodity group (as a share of merchandise exports) 77 13 12
Agricultural commodities 77 10 9
Fuels – – –
Ores, metals, precious stones and non-monetary gold – 3 3
Three leading commodity exports (as a share of total merchandise exports) 1 7 6
[971] Gold, non-monetary (excluding gold ores and concentrates) – 2 2
[042] Rice 1 2 2
[054] Vegetables – 2 2
Average price index of the leading commodity group exported 33.4 110.1 107.6
Five leading destination markets of commodity exports (as a share of total commodity exports) 95
Viet Nam 34
Thailand 20
Singapore 15
European Union (28) 14
China 12
Commodity imports (millions of US dollars) 495 3,627 5,093
Commodity imports (as a share of total merchandise imports) 42 30 33
Food imports (millions of US dollars and as a share of total merchandise imports) 88 (7) 813 (7) 917 (6)
Fuel imports (millions of US dollars and as a share of total merchandise imports) 104 (9) 1,177 (10) 1,357 (9)
Five-leading trading partners for commodity imports (as a share of total commodity imports) 86
Thailand 39
Singapore 20
Viet Nam 16
Indonesia 7
European Union (28) 4
Percentage change of GDP measured in constant 2010 prices 5.9 31.6 7.0
GDP per capita measured in constant 2010 US dollars 346 1,027 1,136
Population (thousands) 5,702 10,608 10,999
Human Development Index (value and rank) 0.3870 (129) 0.5710 (143) 0.5820 (143)
Total employment (as a share of the population) 80.0 84.4 84.5
Share of women in total employment 50.8 50.0 49.9
Proportion of population below international poverty line – SDG 1. Indicator 1.1.1 .. ..
Gini index, latest available year .. ..
Prevalence of undernourishment (per cent) – SDG 2. Indicator 2.1.1 29.3 18.5
Value added of agriculture/industry/services (as a share of GDP) 51/13/36 30/28/42 26/31/42
Employment in agriculture/industry/services (as a share of total employment) 80/4/16 29/27/44 27/27/46
Share of women in agriculture/industry/services 53/40/44 49/49/51 49/48/52
Institutional quality index, 2018 0.2915
Control of corruption –1.02 –1.17 –1.29
Rule of law –1.19 –1.01 –1.06
MERCHANDISE AND COMMODITY EXPORT DEPENDENCE
COMMODITY IMPORT DEPENDENCE
KEY SOCIOECONOMIC INDICATORS
OTHER STRUCTURAL INDICATORS](https://image.slidesharecdn.com/stateofcommoditydependance2019-190524115214/85/State-of-commodity-dependance-2019-66-320.jpg)
![Table of contents Introduction
Chapter 1
Key Findings
from the Report
Chapter 2
Country Statistical
Profiles
List of Country
Statistical Profiles
61
CAMEROON
1995 2013-2017 2017
Merchandise export value (millions of US dollars) 1,539 4,054 3,233
Unallocated exports (as a share of merchandise exports) 0.1 0.2 0.2
Merchandise export concentration by product line (Herfindahl-Hirschmann index) 0.3178 0.3682 0.3468
Commodity export value (millions of US dollars) 1,436 3,739 2,976
Commodity exports (as a share of total merchandise exports) 93 92 92
Commodity exports (as a share of GDP) 14.9 11.4 8.7
Total natural resources rents (as a share of GDP) 10.0 7.2 6.3
Exports by commodity group (as a share of merchandise exports) 93 92 92
Agricultural commodities 58 41 46
Fuels 29 44 38
Ores, metals, precious stones and non-monetary gold 7 7 7
Three leading commodity exports (as a share of total merchandise exports) 59 63 63
[333] Petroleum oils, oils from bitumin. materials, crude 27 36 33
[24 + 25] Forestry products 23 14 16
[072] Cocoa 9 13 14
Average price index of the leading commodity group exported 36.5 132.1 103.8
Five leading destination markets of commodity exports (as a share of total commodity exports) 80
European Union (28) 52
China 11
India 9
United Arab Emirates 4
Chad 4
Commodity imports (millions of US dollars) 289 2,456 1,958
Commodity imports (as a share of total merchandise imports) 27 41 38
Food imports (millions of US dollars and as a share of total merchandise imports) 167 (15) 1,055 (17) 1,046 (20)
Fuel imports (millions of US dollars and as a share of total merchandise imports) 21 (2) 1,119 (18) 652 (13)
Five-leading trading partners for commodity imports (as a share of total commodity imports) 63
Nigeria 27
European Union (28) 21
Thailand 8
Togo 4
China 3
Percentage change of GDP measured in constant 2010 prices 3.5 21.6 3.7
GDP per capita measured in constant 2010 US dollars 1,065 1,458 1,511
Population (thousands) 7,257 13,016 13,777
Human Development Index (value and rank) 0.4220 (120) 0.5470 (148) 0.5560 (148)
Total employment (as a share of the population) 71.2 72.9 73.0
Share of women in total employment 47.4 46.4 46.5
Proportion of population below international poverty line – SDG 1. Indicator 1.1.1 (1996) 48.1 (2014) 23.8
Gini index, latest available year (1996) 44.5 (2014) 46.6
Prevalence of undernourishment (per cent) – SDG 2. Indicator 2.1.1 30.8 7.3
Value added of agriculture/industry/services (as a share of GDP) 18/29/54 16/28/56 17/27/57
Employment in agriculture/industry/services (as a share of total employment) 69/10/22 63/9/28 62/9/29
Share of women in agriculture/industry/services 50/38/44 49/35/45 49/35/45
Institutional quality index, 2018 0.1928
Control of corruption –1.33 –1.16 –1.18
Rule of law –1.44 –1.00 –1.02
MERCHANDISE AND COMMODITY EXPORT DEPENDENCE
COMMODITY IMPORT DEPENDENCE
KEY SOCIOECONOMIC INDICATORS
OTHER STRUCTURAL INDICATORS](https://image.slidesharecdn.com/stateofcommoditydependance2019-190524115214/85/State-of-commodity-dependance-2019-67-320.jpg)
![Table of contents Introduction
Chapter 1
Key Findings
from the Report
Chapter 2
Country Statistical
Profiles
List of Country
Statistical Profiles
62
CANADA
1995 2013-2017 2017
Merchandise export value (millions of US dollars) 191,000 430,200 421,000
Unallocated exports (as a share of merchandise exports) 4.2 4.2 4.6
Merchandise export concentration by product line (Herfindahl-Hirschmann index) 0.1318 0.1536 0.1427
Commodity export value (millions of US dollars) 64,532 205,394 195,714
Commodity exports (as a share of total merchandise exports) 34 48 46
Commodity exports (as a share of GDP) 10.7 12.3 11.9
Total natural resources rents (as a share of GDP) 2.6 1.7 1.0
Exports by commodity group (as a share of merchandise exports) 34 48 47
Agricultural commodities 17 15 16
Fuels 9 22 20
Ores, metals, precious stones and non-monetary gold 8 11 11
Three leading commodity exports (as a share of total merchandise exports) 13 21 20
[333] Petroleum oils, oils from bitumin. materials, crude 4 14 13
[24 + 25] Forestry products 9 4 4
[971] Gold, non-monetary (excluding gold ores and concentrates) 1 3 3
Average price index of the leading commodity group exported 36.5 132.1 103.8
Five leading destination markets of commodity exports (as a share of total commodity exports) 90
United States of America 69
European Union (28) 9
China 6
Japan 4
Republic of Korea 1
Commodity imports (millions of US dollars) 24,230 95,913 88,496
Commodity imports (as a share of total merchandise imports) 15 22 20
Food imports (millions of US dollars and as a share of total merchandise imports) 8,615 (5) 30,337 (7) 30,979 (7)
Fuel imports (millions of US dollars and as a share of total merchandise imports) 5,948 (4) 36,475 (8) 29,684 (7)
Five-leading trading partners for commodity imports (as a share of total commodity imports) 72
United States of America 55
European Union (28) 9
Mexico 3
Brazil 2
Peru 2
Percentage change of GDP measured in constant 2010 prices 2.7 8.9 3.0
GDP per capita measured in constant 2010 US dollars 37,600 50,131 51,262
Population (thousands) 23,351 30,182 30,755
Human Development Index (value and rank) 0.8610 (4) 0.9194 (12) 0.9260 (11)
Total employment (as a share of the population) 58.3 61.1 61.1
Share of women in total employment 45.1 47.5 47.4
Proportion of population below international poverty line – SDG 1. Indicator 1.1.1 (1997) 0.5 (2013) 0.5
Gini index, latest available year (1997) 31.6 (2013) 34.0
Prevalence of undernourishment (per cent) – SDG 2. Indicator 2.1.1 2.5 2.5
Value added of agriculture/industry/services (as a share of GDP) 3/31/66 2/29/70 2/29/70
Employment in agriculture/industry/services (as a share of total employment) 4/22/74 2/20/78 2/20/78
Share of women in agriculture/industry/services 26/23/53 28/21/55 28/21/54
Institutional quality index, 2018 0.9377
Control of corruption 2.03 1.90 1.92
Rule of law 1.65 1.83 1.80
OTHER STRUCTURAL INDICATORS
MERCHANDISE AND COMMODITY EXPORT DEPENDENCE
COMMODITY IMPORT DEPENDENCE
KEY SOCIOECONOMIC INDICATORS](https://image.slidesharecdn.com/stateofcommoditydependance2019-190524115214/85/State-of-commodity-dependance-2019-68-320.jpg)
![Table of contents Introduction
Chapter 1
Key Findings
from the Report
Chapter 2
Country Statistical
Profiles
List of Country
Statistical Profiles
63
CENTRAL AFRICAN REPUBLIC*
1995 2013-2017 2017
Merchandise export value (millions of US dollars) 171 106 124
Unallocated exports (as a share of merchandise exports) 7.2 0.4 0.1
Merchandise export concentration by product line (Herfindahl-Hirschmann index) 0.3756 0.4022 0.3727
Commodity export value (millions of US dollars) 140 86 92
Commodity exports (as a share of total merchandise exports) 82 82 74
Commodity exports (as a share of GDP) 12.0 4.9 4.6
Total natural resources rents (as a share of GDP) 12.4 13.7 13.5
Exports by commodity group (as a share of merchandise exports) 82 81 74
Agricultural commodities 80 71 64
Fuels – – –
Ores, metals, precious stones and non-monetary gold 1 10 10
Three leading commodity exports (as a share of total merchandise exports) 22 23 12
[263] Cotton 21 12 5
[667] Pearls, precious semi-precious stones 1 6 4
[057] Fruits and nuts (excluding oil nuts), fresh or dried – 5 4
Average price index of the leading commodity group exported 99.7 110.0 105.1
Five leading destination markets of commodity exports (as a share of total commodity exports) 76
China 27
European Union (28) 22
Indonesia 11
Viet Nam 8
Belarus 7
Commodity imports (millions of US dollars) 33 96 87
Commodity imports (as a share of total merchandise imports) 19 30 25
Food imports (millions of US dollars and as a share of total merchandise imports) 22 (12) 61 (19) 67 (19)
Fuel imports (millions of US dollars and as a share of total merchandise imports) 2 (1) 22 (7) 6 (2)
Five-leading trading partners for commodity imports (as a share of total commodity imports) 69
European Union (28) 34
Cameroon 14
Norway 9
Republic of Korea 8
Singapore 4
Percentage change of GDP measured in constant 2010 prices 5.2 –24.6 4.2
GDP per capita measured in constant 2010 US dollars 474 316 335
Population (thousands) 1,924 2,580 2,647
Human Development Index (value and rank) 0.3030 (139) 0.3558 (184) 0.3670 (184)
Total employment (as a share of the population) 67.4 67.2 67.2
Share of women in total employment 45.7 44.9 44.9
Proportion of population below international poverty line – SDG 1. Indicator 1.1.1 (2003) 64.8 (2008) 66.3
Gini index, latest available year (2003) 43.6 (2008) 56.2
Prevalence of undernourishment (per cent) – SDG 2. Indicator 2.1.1 42.5 61.8
Value added of agriculture/industry/services (as a share of GDP) 36/27/37 32/27/41 32/25/43
Employment in agriculture/industry/services (as a share of total employment) 85/8/7 86/8/6 86/8/6
Share of women in agriculture/industry/services 49/35/24 47/35/23 47/35/23
Institutional quality index, 2018 0.0974
Control of corruption –1.14 –1.20 –1.17
Rule of law –1.15 –1.74 –1.73
MERCHANDISE AND COMMODITY EXPORT DEPENDENCE
COMMODITY IMPORT DEPENDENCE
KEY SOCIOECONOMIC INDICATORS
OTHER STRUCTURAL INDICATORS](https://image.slidesharecdn.com/stateofcommoditydependance2019-190524115214/85/State-of-commodity-dependance-2019-69-320.jpg)
![Table of contents Introduction
Chapter 1
Key Findings
from the Report
Chapter 2
Country Statistical
Profiles
List of Country
Statistical Profiles
64
CHAD*
1995 2013-2017 2017
Merchandise export value (millions of US dollars) 243 2,845 1,344
Unallocated exports (as a share of merchandise exports) 2.2 0.1 0.2
Merchandise export concentration by product line (Herfindahl-Hirschmann index) 0.7131 0.8238 0.7696
Commodity export value (millions of US dollars) 223 2,816 1,328
Commodity exports (as a share of total merchandise exports) 92 99 99
Commodity exports (as a share of GDP) 13.6 22.4 11.7
Total natural resources rents (as a share of GDP) 14.2 18.3 15.7
Exports by commodity group (as a share of merchandise exports) 92 99 99
Agricultural commodities 92 6 11
Fuels – 87 78
Ores, metals, precious stones and non-monetary gold – 6 10
Three leading commodity exports (as a share of total merchandise exports) 70 95 93
[333] Petroleum oils, oils from bitumin. materials, crude – 85 78
[971] Gold, non-monetary (excluding gold ores and concentrates) – 6 10
[263] Cotton 70 3 6
Average price index of the leading commodity group exported 36.5 132.1 103.8
Five leading destination markets of commodity exports (as a share of total commodity exports) 87
United States of America 63
Japan 7
United Arab Emirates 6
India 6
European Union (28) 5
Commodity imports (millions of US dollars) 119 740 489
Commodity imports (as a share of total merchandise imports) 33 24 25
Food imports (millions of US dollars and as a share of total merchandise imports) 57 (16) 351 (11) 222 (11)
Fuel imports (millions of US dollars and as a share of total merchandise imports) 51 (14) 189 (6) 125 (6)
Five-leading trading partners for commodity imports (as a share of total commodity imports) 90
European Union (28) 42
Cameroon 28
Gabon 8
United States of America 6
Nigeria 6
Percentage change of GDP measured in constant 2010 prices 1.4 11.1 0.1
GDP per capita measured in constant 2010 US dollars 423 819 772
Population (thousands) 3,624 7,343 7,876
Human Development Index (value and rank) .. 0.4032 (183) 0.4040 (183)
Total employment (as a share of the population) 68.3 67.2 67.0
Share of women in total employment 45.0 45.2 45.2
Proportion of population below international poverty line – SDG 1. Indicator 1.1.1 (2003) 62.9 (2011) 38.4
Gini index, latest available year (2003) 39.8 (2011) 43.3
Prevalence of undernourishment (per cent) – SDG 2. Indicator 2.1.1 40.1 39.7
Value added of agriculture/industry/services (as a share of GDP) 28/15/57 29/32/39 28/33/40
Employment in agriculture/industry/services (as a share of total employment) 87/7/7 86/6/8 87/5/8
Share of women in agriculture/industry/services 48/33/24 48/29/26 48/28/26
Institutional quality index, 2018 0.0905
Control of corruption –1.38 –1.39 –1.43
Rule of law –1.26 –1.28 –1.30
OTHER STRUCTURAL INDICATORS
MERCHANDISE AND COMMODITY EXPORT DEPENDENCE
COMMODITY IMPORT DEPENDENCE
KEY SOCIOECONOMIC INDICATORS](https://image.slidesharecdn.com/stateofcommoditydependance2019-190524115214/85/State-of-commodity-dependance-2019-70-320.jpg)
![Table of contents Introduction
Chapter 1
Key Findings
from the Report
Chapter 2
Country Statistical
Profiles
List of Country
Statistical Profiles
65
CHILE
1995 2013-2017 2017
Merchandise export value (millions of US dollars) 15,901 68,770 69,229
Unallocated exports (as a share of merchandise exports) 1.3 – –
Merchandise export concentration by product line (Herfindahl-Hirschmann index) 0.3054 0.3267 0.3354
Commodity export value (millions of US dollars) 13,825 59,363 60,285
Commodity exports (as a share of total merchandise exports) 87 86 87
Commodity exports (as a share of GDP) 18.4 22.8 22.0
Total natural resources rents (as a share of GDP) 8.0 13.2 10.5
Exports by commodity group (as a share of merchandise exports) 87 86 87
Agricultural commodities 37 30 30
Fuels – 1 1
Ores, metals, precious stones and non-monetary gold 49 55 56
Three leading commodity exports (as a share of total merchandise exports) 48 57 58
[682] Copper 30 27 25
[283] Copper ores and concentrates; copper mattes, cemen 12 22 25
[057] Fruits and nuts (excluding oil nuts), fresh or dried 6 8 8
Average price index of the leading commodity group exported 58.3 123.5 127.5
Five leading destination markets of commodity exports (as a share of total commodity exports) 74
China 30
European Union (28) 14
United States of America 13
Japan 11
Republic of Korea 7
Commodity imports (millions of US dollars) 2,916 19,095 17,327
Commodity imports (as a share of total merchandise imports) 20 28 27
Food imports (millions of US dollars and as a share of total merchandise imports) 959 (6) 5,612 (8) 6,088 (9)
Fuel imports (millions of US dollars and as a share of total merchandise imports) 1,334 (9) 11,611 (17) 9,586 (15)
Five-leading trading partners for commodity imports (as a share of total commodity imports) 70
United States of America 30
Brazil 15
Argentina 10
Ecuador 9
European Union (28) 6
Percentage change of GDP measured in constant 2010 prices 10.6 14.3 1.6
GDP per capita measured in constant 2010 US dollars 8,322 14,863 15,137
Population (thousands) 10,163 14,057 14,387
Human Development Index (value and rank) 0.7270 (41) 0.8372 (41) 0.8430 (42)
Total employment (as a share of the population) 52.6 58.1 58.0
Share of women in total employment 31.7 40.7 41.0
Proportion of population below international poverty line – SDG 1. Indicator 1.1.1 (1996) 3.4 (2015) 1.3
Gini index, latest available year (1996) 54.9 (2015) 47.7
Prevalence of undernourishment (per cent) – SDG 2. Indicator 2.1.1 4.7 3.3
Value added of agriculture/industry/services (as a share of GDP) 6/40/54 4/33/63 4/31/64
Employment in agriculture/industry/services (as a share of total employment) 16/26/58 9/23/67 10/23/68
Share of women in agriculture/industry/services 11/18/44 20/19/51 21/20/51
Institutional quality index, 2018 0.8123
Control of corruption 1.45 1.30 1.04
Rule of law 1.11 1.26 1.01
MERCHANDISE AND COMMODITY EXPORT DEPENDENCE
COMMODITY IMPORT DEPENDENCE
KEY SOCIOECONOMIC INDICATORS
OTHER STRUCTURAL INDICATORS](https://image.slidesharecdn.com/stateofcommoditydependance2019-190524115214/85/State-of-commodity-dependance-2019-71-320.jpg)
![Table of contents Introduction
Chapter 1
Key Findings
from the Report
Chapter 2
Country Statistical
Profiles
List of Country
Statistical Profiles
66
CHINA
1995 2013-2017 2017
Merchandise export value (millions of US dollars) 148,780 2,237,155 2,263,371
Unallocated exports (as a share of merchandise exports) 0.3 0.1 0.2
Merchandise export concentration by product line (Herfindahl-Hirschmann index) 0.0700 0.1019 0.0964
Commodity export value (millions of US dollars) 23,917 136,099 143,182
Commodity exports (as a share of total merchandise exports) 16 6 6
Commodity exports (as a share of GDP) 3.2 1.2 1.2
Total natural resources rents (as a share of GDP) 2.9 2.3 1.1
Exports by commodity group (as a share of merchandise exports) 16 6 6
Agricultural commodities 10 3 3
Fuels 4 1 2
Ores, metals, precious stones and non-monetary gold 2 1 1
Three leading commodity exports (as a share of total merchandise exports) 1 4 4
[971] Gold, non-monetary (excluding gold ores and concentrates) – 2 2
[334] Petroleum oils or bituminous minerals 70 % oil 1 1 1
[667] Pearls, precious semi-precious stones – 1 1
Average price index of the leading commodity group exported 33.4 110.1 107.6
Five leading destination markets of commodity exports (as a share of total commodity exports) 51
China, Hong Kong SAR 15
Japan 11
European Union (28) 10
United States of America 9
Republic of Korea 7
Commodity imports (millions of US dollars) 27,334 660,243 685,561
Commodity imports (as a share of total merchandise imports) 21 37 37
Food imports (millions of US dollars and as a share of total merchandise imports) 8,843 (7) 98,331 (5) 106,431 (6)
Fuel imports (millions of US dollars and as a share of total merchandise imports) 5,127 (4) 251,330 (14) 249,617 (14)
Five-leading trading partners for commodity imports (as a share of total commodity imports) 37
Australia 12
Brazil 7
United States of America 7
Russian Federation 5
European Union (28) 5
Percentage change of GDP measured in constant 2010 prices 11.0 34.6 6.9
GDP per capita measured in constant 2010 US dollars 1,188 6,375 7,209
Population (thousands) 900,006 1,149,665 1,160,360
Human Development Index (value and rank) 0.5500 (100) 0.7420 (86) 0.7520 (84)
Total employment (as a share of the population) 75.1 66.5 65.7
Share of women in total employment 45.3 44.1 43.9
Proportion of population below international poverty line – SDG 1. Indicator 1.1.1 (1996) 42.0 (2014) 0.7
Gini index, latest available year (1996) .. (2014) ..
Prevalence of undernourishment (per cent) – SDG 2. Indicator 2.1.1 15.9 8.7
Value added of agriculture/industry/services (as a share of GDP) 20/47/33 9/42/49 9/40/51
Employment in agriculture/industry/services (as a share of total employment) 49/29/22 20/27/53 18/27/56
Share of women in agriculture/industry/services 47/51/33 51/37/45 51/36/45
Institutional quality index, 2018 0.4104
Control of corruption –0.27 –0.30 –0.27
Rule of law –0.55 –0.39 –0.26
OTHER STRUCTURAL INDICATORS
MERCHANDISE AND COMMODITY EXPORT DEPENDENCE
COMMODITY IMPORT DEPENDENCE
KEY SOCIOECONOMIC INDICATORS](https://image.slidesharecdn.com/stateofcommoditydependance2019-190524115214/85/State-of-commodity-dependance-2019-72-320.jpg)
![Table of contents Introduction
Chapter 1
Key Findings
from the Report
Chapter 2
Country Statistical
Profiles
List of Country
Statistical Profiles
67
COLOMBIA
1995 2013-2017 2017
Merchandise export value (millions of US dollars) 10,201 43,624 37,766
Unallocated exports (as a share of merchandise exports) – – –
Merchandise export concentration by product line (Herfindahl-Hirschmann index) 0.2430 0.3742 0.3193
Commodity export value (millions of US dollars) 7,163 35,164 30,171
Commodity exports (as a share of total merchandise exports) 70 81 80
Commodity exports (as a share of GDP) 6.5 10.7 9.7
Total natural resources rents (as a share of GDP) 2.4 5.1 3.5
Exports by commodity group (as a share of merchandise exports) 70 81 80
Agricultural commodities 36 16 19
Fuels 27 59 54
Ores, metals, precious stones and non-monetary gold 7 5 6
Three leading commodity exports (as a share of total merchandise exports) 44 58 54
[333] Petroleum oils, oils from bitumin. materials, crude 19 39 29
[321] Coal, whether or not pulverized, not agglomerated 6 13 18
[071] Coffee and coffee substitutes 19 6 7
Average price index of the leading commodity group exported 36.5 132.1 103.8
Five leading destination markets of commodity exports (as a share of total commodity exports) 73
United States of America 34
European Union (28) 20
China 9
Panama 7
India 4
Commodity imports (millions of US dollars) 2,391 12,464 10,767
Commodity imports (as a share of total merchandise imports) 17 23 23
Food imports (millions of US dollars and as a share of total merchandise imports) 1,239 (9) 5,436 (10) 5,322 (12)
Fuel imports (millions of US dollars and as a share of total merchandise imports) 387 (3) 5,324 (10) 3,716 (8)
Five-leading trading partners for commodity imports (as a share of total commodity imports) 74
United States of America 56
European Union (28) 5
Chile 4
Argentina 4
Mexico 4
Percentage change of GDP measured in constant 2010 prices 5.2 17.0 1.8
GDP per capita measured in constant 2010 US dollars 4,912 7,382 7,597
Population (thousands) 24,590 36,508 37,545
Human Development Index (value and rank) 0.6250 (78) 0.7418 (87) 0.7470 (88)
Total employment (as a share of the population) 51.3 64.3 64.1
Share of women in total employment 30.1 41.6 41.7
Proportion of population below international poverty line – SDG 1. Indicator 1.1.1 (1996) 16.5 (2016) 4.5
Gini index, latest available year (1996) 56.9 (2016) 50.8
Prevalence of undernourishment (per cent) – SDG 2. Indicator 2.1.1 9.7 6.5
Value added of agriculture/industry/services (as a share of GDP) 9/30/61 7/35/59 7/33/60
Employment in agriculture/industry/services (as a share of total employment) 25/20/55 16/20/64 16/19/65
Share of women in agriculture/industry/services 8/28/41 17/30/51 18/29/52
Institutional quality index, 2018 0.5103
Control of corruption –0.51 –0.35 –0.37
Rule of law –0.75 –0.32 –0.36
MERCHANDISE AND COMMODITY EXPORT DEPENDENCE
COMMODITY IMPORT DEPENDENCE
KEY SOCIOECONOMIC INDICATORS
OTHER STRUCTURAL INDICATORS](https://image.slidesharecdn.com/stateofcommoditydependance2019-190524115214/85/State-of-commodity-dependance-2019-73-320.jpg)
![Table of contents Introduction
Chapter 1
Key Findings
from the Report
Chapter 2
Country Statistical
Profiles
List of Country
Statistical Profiles
68
COMOROS*
1995 2013-2017 2017
Merchandise export value (millions of US dollars) 11 27 40
Unallocated exports (as a share of merchandise exports) 0.8 1.1 –
Merchandise export concentration by product line (Herfindahl-Hirschmann index) 0.6264 0.6580 0.6267
Commodity export value (millions of US dollars) 7 19 28
Commodity exports (as a share of total merchandise exports) 61 73 70
Commodity exports (as a share of GDP) 1.4 1.6 2.3
Total natural resources rents (as a share of GDP) 2.9 3.7 4.2
Exports by commodity group (as a share of merchandise exports) 61 73 70
Agricultural commodities 61 69 66
Fuels – – –
Ores, metals, precious stones and non-monetary gold – 3 4
Three leading commodity exports (as a share of total merchandise exports) 58 68 66
[075] Spices 58 66 63
[282] Ferrous waste, scrape; remelting ingots, iron, steel – 2 2
[056] Vegetables, roots, tubers, prepared, preserved, n.e.s. – 1 1
Average price index of the leading commodity group exported 80.8 109.0 102.7
Five leading destination markets of commodity exports (as a share of total commodity exports) 73
European Union (28) 38
Singapore 15
India 11
United Arab Emirates 6
Pakistan 5
Commodity imports (millions of US dollars) 21 97 92
Commodity imports (as a share of total merchandise imports) 33 39 37
Food imports (millions of US dollars and as a share of total merchandise imports) 14 (22) 77 (31) 72 (29)
Fuel imports (millions of US dollars and as a share of total merchandise imports) 3 (4) 8 (3) 8 (3)
Five-leading trading partners for commodity imports (as a share of total commodity imports) 65
European Union (28) 18
United Arab Emirates 15
Pakistan 14
United Republic of Tanzania 11
India 6
Percentage change of GDP measured in constant 2010 prices 3.6 16.9 2.8
GDP per capita measured in constant 2010 US dollars 1,596 1,696 1,687
Population (thousands) 259 465 490
Human Development Index (value and rank) .. 0.5014 (161) 0.5030 (162)
Total employment (as a share of the population) 40.9 41.0 41.2
Share of women in total employment 36.8 41.3 41.6
Proportion of population below international poverty line – SDG 1. Indicator 1.1.1 (2004) 13.5 (2013) 18.1
Gini index, latest available year (2004) 55.9 (2013) 45.3
Prevalence of undernourishment (per cent) – SDG 2. Indicator 2.1.1 .. ..
Value added of agriculture/industry/services (as a share of GDP) 32/12/56 43/11/46 42/12/46
Employment in agriculture/industry/services (as a share of total employment) 57/15/28 55/15/30 55/15/30
Share of women in agriculture/industry/services 43/31/28 46/36/35 47/36/35
Institutional quality index, 2018 0.2783
Control of corruption –1.00 –0.68 –0.68
Rule of law –0.88 –0.94 –1.05
OTHER STRUCTURAL INDICATORS
MERCHANDISE AND COMMODITY EXPORT DEPENDENCE
COMMODITY IMPORT DEPENDENCE
KEY SOCIOECONOMIC INDICATORS](https://image.slidesharecdn.com/stateofcommoditydependance2019-190524115214/85/State-of-commodity-dependance-2019-74-320.jpg)
![Table of contents Introduction
Chapter 1
Key Findings
from the Report
Chapter 2
Country Statistical
Profiles
List of Country
Statistical Profiles
69
CONGO
1995 2013-2017 2017
Merchandise export value (millions of US dollars) 1,090 6,362 5,428
Unallocated exports (as a share of merchandise exports) 0.3 0.2 0.1
Merchandise export concentration by product line (Herfindahl-Hirschmann index) 0.7498 0.5979 0.5371
Commodity export value (millions of US dollars) 1,037 5,351 4,061
Commodity exports (as a share of total merchandise exports) 95 84 75
Commodity exports (as a share of GDP) 49.0 50.5 47.2
Total natural resources rents (as a share of GDP) 41.0 33.0 24.9
Exports by commodity group (as a share of merchandise exports) 95 84 75
Agricultural commodities 14 4 5
Fuels 79 66 52
Ores, metals, precious stones and non-monetary gold 2 14 18
Three leading commodity exports (as a share of total merchandise exports) 88 77 70
[333] Petroleum oils, oils from bitumin. materials, crude 76 62 50
[682] Copper – 12 15
[24 + 25] Forestry products 12 4 5
Average price index of the leading commodity group exported 36.5 132.1 103.8
Five leading destination markets of commodity exports (as a share of total commodity exports) 88
China 50
European Union (28) 20
Australia 7
United Arab Emirates 6
United States of America 5
Commodity imports (millions of US dollars) 203 1,206 1,124
Commodity imports (as a share of total merchandise imports) 30 20 18
Food imports (millions of US dollars and as a share of total merchandise imports) 83 (12) 884 (15) 834 (13)
Fuel imports (millions of US dollars and as a share of total merchandise imports) 104 (16) 159 (3) 133 (2)
Five-leading trading partners for commodity imports (as a share of total commodity imports) 48
European Union (28) 28
Namibia 5
Norway 5
Australia 5
United Republic of Tanzania 5
Percentage change of GDP measured in constant 2010 prices 4.0 14.0 –3.4
GDP per capita measured in constant 2010 US dollars 2,466 2,878 2,691
Population (thousands) 1,615 2,883 3,037
Human Development Index (value and rank) 0.5070 (107) 0.6016 (133) 0.6060 (134)
Total employment (as a share of the population) 54.1 62.6 62.0
Share of women in total employment 48.1 48.2 48.2
Proportion of population below international poverty line – SDG 1. Indicator 1.1.1 (2005) 51.6 (2011) 37.0
Gini index, latest available year (2005) 47.3 (2011) 48.9
Prevalence of undernourishment (per cent) – SDG 2. Indicator 2.1.1 36.8 37.5
Value added of agriculture/industry/services (as a share of GDP) 11/47/42 7/63/30 9/52/39
Employment in agriculture/industry/services (as a share of total employment) 40/24/36 38/25/37 37/26/37
Share of women in agriculture/industry/services 49/50/46 50/48/47 50/49/46
Institutional quality index, 2018 0.1152
Control of corruption –0.86 –1.21 –1.33
Rule of law –1.04 –1.10 –1.10
MERCHANDISE AND COMMODITY EXPORT DEPENDENCE
COMMODITY IMPORT DEPENDENCE
KEY SOCIOECONOMIC INDICATORS
OTHER STRUCTURAL INDICATORS](https://image.slidesharecdn.com/stateofcommoditydependance2019-190524115214/85/State-of-commodity-dependance-2019-75-320.jpg)
![Table of contents Introduction
Chapter 1
Key Findings
from the Report
Chapter 2
Country Statistical
Profiles
List of Country
Statistical Profiles
70
COSTA RICA
1995 2013-2017 2017
Merchandise export value (millions of US dollars) 3,476 10,549 10,543
Unallocated exports (as a share of merchandise exports) 2.4 1.2 –
Merchandise export concentration by product line (Herfindahl-Hirschmann index) 0.2925 0.3259 0.2392
Commodity export value (millions of US dollars) 2,196 3,788 4,586
Commodity exports (as a share of total merchandise exports) 63 36 43
Commodity exports (as a share of GDP) 19.1 7.0 7.9
Total natural resources rents (as a share of GDP) 2.9 1.3 1.2
Exports by commodity group (as a share of merchandise exports) 63 36 43
Agricultural commodities 62 35 42
Fuels – – –
Ores, metals, precious stones and non-monetary gold 1 1 1
Three leading commodity exports (as a share of total merchandise exports) 43 23 27
[057] Fruits and nuts (excluding oil nuts), fresh or dried 30 17 20
[098] Edible products and preparations, n.e.s. 1 3 5
[071] Coffee and coffee substitutes 13 2 2
Average price index of the leading commodity group exported 80.8 109.0 102.7
Five leading destination markets of commodity exports (as a share of total commodity exports) 78
European Union (28) 34
United States of America 32
Nicaragua 4
Guatemala 4
Panama 3
Commodity imports (millions of US dollars) 793 3,975 3,659
Commodity imports (as a share of total merchandise imports) 19 24 24
Food imports (millions of US dollars and as a share of total merchandise imports) 354 (9) 1,607 (10) 1,598 (10)
Fuel imports (millions of US dollars and as a share of total merchandise imports) 283 (7) 1,745 (11) 1,426 (9)
Five-leading trading partners for commodity imports (as a share of total commodity imports) 79
United States of America 61
Chile 6
Mexico 4
European Union (28) 4
Nicaragua 3
Percentage change of GDP measured in constant 2010 prices 4.1 16.4 3.2
GDP per capita measured in constant 2010 US dollars 5,646 9,395 9,926
Population (thousands) 2,332 3,733 3,844
Human Development Index (value and rank) 0.6870 (52) 0.7858 (61) 0.7940 (61)
Total employment (as a share of the population) 56.3 55.7 54.7
Share of women in total employment 30.1 37.7 37.4
Proportion of population below international poverty line – SDG 1. Indicator 1.1.1 (1995) 6.9 (2016) 1.3
Gini index, latest available year (1995) 45.7 (2016) 48.7
Prevalence of undernourishment (per cent) – SDG 2. Indicator 2.1.1 5.1 4.4
Value added of agriculture/industry/services (as a share of GDP) 14/29/57 6/22/72 6/22/73
Employment in agriculture/industry/services (as a share of total employment) 22/24/54 12/18/70 12/19/69
Share of women in agriculture/industry/services 9/26/40 13/19/47 13/18/47
Institutional quality index, 2018 0.7646
Control of corruption 0.70 0.67 0.47
Rule of law 0.62 0.51 0.45
MERCHANDISE AND COMMODITY EXPORT DEPENDENCE
COMMODITY IMPORT DEPENDENCE
KEY SOCIOECONOMIC INDICATORS
OTHER STRUCTURAL INDICATORS](https://image.slidesharecdn.com/stateofcommoditydependance2019-190524115214/85/State-of-commodity-dependance-2019-76-320.jpg)
![Table of contents Introduction
Chapter 1
Key Findings
from the Report
Chapter 2
Country Statistical
Profiles
List of Country
Statistical Profiles
71
CÔTE D’IVOIRE
1995 2013-2017 2017
Merchandise export value (millions of US dollars) 3,737 11,960 11,877
Unallocated exports (as a share of merchandise exports) 0.5 – –
Merchandise export concentration by product line (Herfindahl-Hirschmann index) 0.3423 0.3618 0.3505
Commodity export value (millions of US dollars) 3,189 9,965 10,097
Commodity exports (as a share of total merchandise exports) 85 83 85
Commodity exports (as a share of GDP) 28.7 28.2 24.8
Total natural resources rents (as a share of GDP) 5.1 6.0 5.9
Exports by commodity group (as a share of merchandise exports) 85 83 85
Agricultural commodities 75 59 62
Fuels 10 19 17
Ores, metals, precious stones and non-monetary gold 1 6 6
Three leading commodity exports (as a share of total merchandise exports) 47 57 53
[072] Cocoa 34 35 35
[334] Petroleum oils or bituminous minerals 70 % oil 9 11 9
[057] Fruits and nuts (excluding oil nuts), fresh or dried 4 8 9
Average price index of the leading commodity group exported 87.2 98.3 93.7
Five leading destination markets of commodity exports (as a share of total commodity exports) 65
European Union (28) 43
United States of America 9
Nigeria 5
India 5
Switzerland 4
Commodity imports (millions of US dollars) 1,050 4,299 3,786
Commodity imports (as a share of total merchandise imports) 36 43 43
Food imports (millions of US dollars and as a share of total merchandise imports) 484 (16) 1,607 (16) 1,556 (18)
Fuel imports (millions of US dollars and as a share of total merchandise imports) 474 (16) 2,336 (23) 1,880 (21)
Five-leading trading partners for commodity imports (as a share of total commodity imports) 73
Nigeria 43
European Union (28) 20
Thailand 4
Colombia 3
Viet Nam 3
Percentage change of GDP measured in constant 2010 prices 7.1 33.4 7.6
GDP per capita measured in constant 2010 US dollars 1,295 1,474 1,641
Population (thousands) 8,147 13,237 13,986
Human Development Index (value and rank) 0.3870 (129) 0.4766 (168) 0.4920 (167)
Total employment (as a share of the population) 63.9 56.4 55.8
Share of women in total employment 33.5 40.2 40.8
Proportion of population below international poverty line – SDG 1. Indicator 1.1.1 (1995) 19.6 (2015) 28.2
Gini index, latest available year (1995) 40.6 (2015) 41.5
Prevalence of undernourishment (per cent) – SDG 2. Indicator 2.1.1 20.4 20.7
Value added of agriculture/industry/services (as a share of GDP) 27/22/51 22/31/47 21/33/46
Employment in agriculture/industry/services (as a share of total employment) 52/6/42 50/6/44 48/6/45
Share of women in agriculture/industry/services 31/15/40 34/24/49 34/24/50
Institutional quality index, 2018 0.3606
Control of corruption –0.26 –0.53 –0.52
Rule of law –0.79 –0.68 –0.63
OTHER STRUCTURAL INDICATORS
MERCHANDISE AND COMMODITY EXPORT DEPENDENCE
COMMODITY IMPORT DEPENDENCE
KEY SOCIOECONOMIC INDICATORS](https://image.slidesharecdn.com/stateofcommoditydependance2019-190524115214/85/State-of-commodity-dependance-2019-77-320.jpg)
![Table of contents Introduction
Chapter 1
Key Findings
from the Report
Chapter 2
Country Statistical
Profiles
List of Country
Statistical Profiles
72
CROATIA
1995 2013-2017 2017
Merchandise export value (millions of US dollars) 4,633 13,770 15,771
Unallocated exports (as a share of merchandise exports) – 0.4 0.2
Merchandise export concentration by product line (Herfindahl-Hirschmann index) 0.1019 0.0742 0.0728
Commodity export value (millions of US dollars) 1,209 4,675 5,138
Commodity exports (as a share of total merchandise exports) 26 34 33
Commodity exports (as a share of GDP) 5.4 8.6 9.4
Total natural resources rents (as a share of GDP) 0.7 0.9 0.7
Exports by commodity group (as a share of merchandise exports) 26 34 33
Agricultural commodities 15 18 18
Fuels 8 12 11
Ores, metals, precious stones and non-monetary gold 2 4 4
Three leading commodity exports (as a share of total merchandise exports) 11 15 14
[334] Petroleum oils or bituminous minerals 70 % oil 7 7 7
[24 + 25] Forestry products 4 5 4
[351] Electric current – 3 3
Average price index of the leading commodity group exported 36.5 132.1 103.8
Five leading destination markets of commodity exports (as a share of total commodity exports) 87
European Union (28) 59
Bosnia and Herzegovina 18
Serbia 6
Egypt 2
Montenegro 2
Commodity imports (millions of US dollars) 2,079 7,323 7,436
Commodity imports (as a share of total merchandise imports) 28 33 30
Food imports (millions of US dollars and as a share of total merchandise imports) 819 (11) 2,616 (12) 2,859 (12)
Fuel imports (millions of US dollars and as a share of total merchandise imports) 871 (12) 3,622 (16) 3,267 (13)
Five-leading trading partners for commodity imports (as a share of total commodity imports) 87
European Union (28) 65
Russian Federation 9
Bosnia and Herzegovina 5
Azerbaijan 4
Serbia 4
Percentage change of GDP measured in constant 2010 prices 6.8 0.8 2.9
GDP per capita measured in constant 2010 US dollars 8,570 14,113 14,981
Population (thousands) 3,765 3,606 3,574
Human Development Index (value and rank) 0.6960 (48) 0.8262 (44) 0.8310 (44)
Total employment (as a share of the population) 49.5 44.0 45.6
Share of women in total employment 43.1 46.1 46.1
Proportion of population below international poverty line – SDG 1. Indicator 1.1.1 (1998) – (2015) 0.8
Gini index, latest available year (1998) 28.8 (2015) 31.1
Prevalence of undernourishment (per cent) – SDG 2. Indicator 2.1.1 10.4 2.5
Value added of agriculture/industry/services (as a share of GDP) 7/32/61 4/26/69 4/26/70
Employment in agriculture/industry/services (as a share of total employment) 21/30/49 9/27/64 8/27/65
Share of women in agriculture/industry/services 46/32/49 37/26/56 34/25/56
Institutional quality index, 2018 0.6115
Control of corruption –0.58 0.20 0.19
Rule of law –0.63 0.31 0.33
MERCHANDISE AND COMMODITY EXPORT DEPENDENCE
COMMODITY IMPORT DEPENDENCE
KEY SOCIOECONOMIC INDICATORS
OTHER STRUCTURAL INDICATORS](https://image.slidesharecdn.com/stateofcommoditydependance2019-190524115214/85/State-of-commodity-dependance-2019-78-320.jpg)
![Table of contents Introduction
Chapter 1
Key Findings
from the Report
Chapter 2
Country Statistical
Profiles
List of Country
Statistical Profiles
73
CUBA
1995 2013-2017 2017
Merchandise export value (millions of US dollars) 1,625 3,489 2,453
Unallocated exports (as a share of merchandise exports) 0.2 8.2 10.1
Merchandise export concentration by product line (Herfindahl-Hirschmann index) 0.5585 0.2342 0.2601
Commodity export value (millions of US dollars) 1,504 1,984 1,559
Commodity exports (as a share of total merchandise exports) 93 57 64
Commodity exports (as a share of GDP) 4.9 2.3 1.6
Total natural resources rents (as a share of GDP) 0.7 1.6 ..
Exports by commodity group (as a share of merchandise exports) 92 57 64
Agricultural commodities 77 39 49
Fuels – 7 5
Ores, metals, precious stones and non-monetary gold 15 10 10
Three leading commodity exports (as a share of total merchandise exports) 73 36 43
[061] Sugar, molasses and honey 57 16 21
[122] Tobacco, manufactured 4 12 15
[284] Nickel ores concentrates; nickel mattes, etc. 12 7 7
Average price index of the leading commodity group exported 80.8 109.0 102.7
Five leading destination markets of commodity exports (as a share of total commodity exports) 78
European Union (28) 46
China 16
Russian Federation 10
Canada 4
China, Hong Kong SAR 2
Commodity imports (millions of US dollars) 1,275 4,094 3,657
Commodity imports (as a share of total merchandise imports) 45 34 34
Food imports (millions of US dollars and as a share of total merchandise imports) 545 (19) 2,559 (21) 2,356 (22)
Fuel imports (millions of US dollars and as a share of total merchandise imports) 599 (21) 1,244 (10) 1,017 (9)
Five-leading trading partners for commodity imports (as a share of total commodity imports) 68
Venezuela (Bolivarian Rep. of) 24
European Union (28) 15
United States of America 12
Brazil 9
Viet Nam 8
Percentage change of GDP measured in constant 2010 prices 2.5 9.3 1.6
GDP per capita measured in constant 2010 US dollars 2,844 6,324 6,479
Population (thousands) 8,446 9,585 9,643
Human Development Index (value and rank) 0.6540 (68) 0.7712 (70) 0.7770 (71)
Total employment (as a share of the population) 47.1 53.2 53.0
Share of women in total employment 31.3 38.3 38.3
Proportion of population below international poverty line – SDG 1. Indicator 1.1.1 .. ..
Gini index, latest available year .. ..
Prevalence of undernourishment (per cent) – SDG 2. Indicator 2.1.1 3.7 2.5
Value added of agriculture/industry/services (as a share of GDP) 6/26/68 4/23/73 4/23/73
Employment in agriculture/industry/services (as a share of total employment) 25/23/52 19/17/65 19/16/65
Share of women in agriculture/industry/services 16/22/43 16/25/48 16/24/48
Institutional quality index, 2018 0.1482
Control of corruption 0.29 0.14 0.27
Rule of law –1.14 –0.59 –0.43
OTHER STRUCTURAL INDICATORS
MERCHANDISE AND COMMODITY EXPORT DEPENDENCE
COMMODITY IMPORT DEPENDENCE
KEY SOCIOECONOMIC INDICATORS](https://image.slidesharecdn.com/stateofcommoditydependance2019-190524115214/85/State-of-commodity-dependance-2019-79-320.jpg)
![Table of contents Introduction
Chapter 1
Key Findings
from the Report
Chapter 2
Country Statistical
Profiles
List of Country
Statistical Profiles
74
CYPRUS
1995 2013-2017 2017
Merchandise export value (millions of US dollars) 1,231 2,256 3,368
Unallocated exports (as a share of merchandise exports) – 7.9 5.6
Merchandise export concentration by product line (Herfindahl-Hirschmann index) 0.2758 0.2237 0.2987
Commodity export value (millions of US dollars) 690 852 1,186
Commodity exports (as a share of total merchandise exports) 56 38 35
Commodity exports (as a share of GDP) 6.9 3.9 5.6
Total natural resources rents (as a share of GDP) – 0.1 –
Exports by commodity group (as a share of merchandise exports) 56 38 35
Agricultural commodities 51 19 15
Fuels 4 13 18
Ores, metals, precious stones and non-monetary gold 1 5 3
Three leading commodity exports (as a share of total merchandise exports) 13 22 25
[334] Petroleum oils or bituminous minerals 70 % oil 4 13 18
[024] Cheese and curd 1 6 6
[054] Vegetables 9 3 2
Average price index of the leading commodity group exported 36.5 132.1 103.8
Five leading destination markets of commodity exports (as a share of total commodity exports) 73
European Union (28) 47
Libya 12
Lebanon 5
Egypt 5
Israel 4
Commodity imports (millions of US dollars) 1,171 2,865 3,054
Commodity imports (as a share of total merchandise imports) 32 41 33
Food imports (millions of US dollars and as a share of total merchandise imports) 355 (10) 987 (14) 1,028 (11)
Fuel imports (millions of US dollars and as a share of total merchandise imports) 285 (8) 1,519 (22) 1,641 (18)
Five-leading trading partners for commodity imports (as a share of total commodity imports) 88
European Union (28) 67
Israel 16
Russian Federation 3
Cuba 2
Ukraine 1
Percentage change of GDP measured in constant 2010 prices 9.9 –4.3 3.9
GDP per capita measured in constant 2010 US dollars 24,030 27,959 29,410
Population (thousands) 647 964 981
Human Development Index (value and rank) 0.7860 (24) 0.8610 (30) 0.8690 (30)
Total employment (as a share of the population) 58.0 53.9 55.9
Share of women in total employment 38.7 46.3 46.4
Proportion of population below international poverty line – SDG 1. Indicator 1.1.1 (2004) – (2015) –
Gini index, latest available year (2004) 30.1 (2015) 34.0
Prevalence of undernourishment (per cent) – SDG 2. Indicator 2.1.1 3.5 4.6
Value added of agriculture/industry/services (as a share of GDP) 5/22/73 2/11/87 2/11/87
Employment in agriculture/industry/services (as a share of total employment) 5/26/69 4/17/79 4/17/79
Share of women in agriculture/industry/services 35/23/45 22/18/53 21/17/54
Institutional quality index, 2018 0.7647
Control of corruption 1.33 0.99 0.78
Rule of law 0.86 0.95 0.88
MERCHANDISE AND COMMODITY EXPORT DEPENDENCE
COMMODITY IMPORT DEPENDENCE
KEY SOCIOECONOMIC INDICATORS
OTHER STRUCTURAL INDICATORS](https://image.slidesharecdn.com/stateofcommoditydependance2019-190524115214/85/State-of-commodity-dependance-2019-80-320.jpg)
![Table of contents Introduction
Chapter 1
Key Findings
from the Report
Chapter 2
Country Statistical
Profiles
List of Country
Statistical Profiles
75
CZECHIA
1995 2013-2017 2017
Merchandise export value (millions of US dollars) 21,686 167,000 180,000
Unallocated exports (as a share of merchandise exports) 1.6 0.1 0.1
Merchandise export concentration by product line (Herfindahl-Hirschmann index) 0.0446 0.1178 0.1278
Commodity export value (millions of US dollars) 3,657 17,580 16,671
Commodity exports (as a share of total merchandise exports) 17 11 9
Commodity exports (as a share of GDP) 6.1 8.7 7.7
Total natural resources rents (as a share of GDP) 0.7 0.2 0.1
Exports by commodity group (as a share of merchandise exports) 17 11 9
Agricultural commodities 10 6 6
Fuels 4 2 2
Ores, metals, precious stones and non-monetary gold 3 2 2
Three leading commodity exports (as a share of total merchandise exports) 3 2 2
[24 + 25] Forestry products 3 1 1
[351] Electric current – 1 1
[334] Petroleum oils or bituminous minerals 70 % oil 1 1 1
Average price index of the leading commodity group exported 99.7 110.0 105.1
Five leading destination markets of commodity exports (as a share of total commodity exports) 91
European Union (28) 90
Japan 1
Commodity imports (millions of US dollars) 5,447 26,379 25,608
Commodity imports (as a share of total merchandise imports) 22 18 16
Food imports (millions of US dollars and as a share of total merchandise imports) 1,500 (6) 7,956 (5) 8,206 (5)
Fuel imports (millions of US dollars and as a share of total merchandise imports) 1,981 (8) 10,093 (7) 8,796 (5)
Five-leading trading partners for commodity imports (as a share of total commodity imports) 89
European Union (28) 64
Russian Federation 17
Azerbaijan 4
Ukraine 2
Kazakhstan 2
Percentage change of GDP measured in constant 2010 prices 6.2 8.0 4.6
GDP per capita measured in constant 2010 US dollars 13,384 21,147 22,789
Population (thousands) 8,427 9,007 8,986
Human Development Index (value and rank) 0.7530 (34) 0.8816 (25) 0.8880 (25)
Total employment (as a share of the population) 58.9 56.7 58.2
Share of women in total employment 43.9 43.7 44.1
Proportion of population below international poverty line – SDG 1. Indicator 1.1.1 (1996) 0.2 (2015) –
Gini index, latest available year (1996) 25.8 (2015) 25.9
Prevalence of undernourishment (per cent) – SDG 2. Indicator 2.1.1 2.5 2.5
Value added of agriculture/industry/services (as a share of GDP) 4/39/57 3/37/60 2/38/60
Employment in agriculture/industry/services (as a share of total employment) 7/42/51 3/38/59 3/38/59
Share of women in agriculture/industry/services 36/32/55 26/27/55 26/28/55
Institutional quality index, 2018 0.8195
Control of corruption 0.68 0.43 0.57
Rule of law 0.92 1.10 1.12
OTHER STRUCTURAL INDICATORS
MERCHANDISE AND COMMODITY EXPORT DEPENDENCE
COMMODITY IMPORT DEPENDENCE
KEY SOCIOECONOMIC INDICATORS](https://image.slidesharecdn.com/stateofcommoditydependance2019-190524115214/85/State-of-commodity-dependance-2019-81-320.jpg)
![Table of contents Introduction
Chapter 1
Key Findings
from the Report
Chapter 2
Country Statistical
Profiles
List of Country
Statistical Profiles
76
DEMOCRATIC PEOPLE’S REPUBLIC OF KOREA
1995 2013-2017 2017
Merchandise export value (millions of US dollars) 959 3,438 1,850
Unallocated exports (as a share of merchandise exports) 1.0 2.6 3.6
Merchandise export concentration by product line (Herfindahl-Hirschmann index) 0.1349 0.3383 0.2546
Commodity export value (millions of US dollars) 283 2,049 930
Commodity exports (as a share of total merchandise exports) 30 60 50
Commodity exports (as a share of GDP) 5.8 13.9 11.4
Total natural resources rents (as a share of GDP) .. .. ..
Exports by commodity group (as a share of merchandise exports) 30 60 50
Agricultural commodities 18 9 15
Fuels 2 37 23
Ores, metals, precious stones and non-monetary gold 9 13 13
Three leading commodity exports (as a share of total merchandise exports) 10 45 36
[321] Coal, whether or not pulverized, not agglomerated 2 35 22
[281] Iron ore and concentrates – 5 5
[03] Fishery products 8 5 9
Average price index of the leading commodity group exported 36.5 132.1 103.8
Five leading destination markets of commodity exports (as a share of total commodity exports) 98
China 93
India 1
European Union (28) 1
Taiwan, Province of China 1
Burkina Faso 1
Commodity imports (millions of US dollars) 584 1,300 936
Commodity imports (as a share of total merchandise imports) 42 28 24
Food imports (millions of US dollars and as a share of total merchandise imports) 189 (14) 579 (13) 572 (15)
Fuel imports (millions of US dollars and as a share of total merchandise imports) 255 (18) 404 (9) 169 (4)
Five-leading trading partners for commodity imports (as a share of total commodity imports) 90
China 73
Russian Federation 6
Thailand 6
India 4
Singapore 2
Percentage change of GDP measured in constant 2010 prices –4.4 3.9 1.3
GDP per capita measured in constant 2010 US dollars 594 581 593
Population (thousands) 15,970 19,905 20,235
Human Development Index (value and rank) .. .. ..
Total employment (as a share of the population) 76.8 76.8 76.6
Share of women in total employment 49.4 48.2 48.2
Proportion of population below international poverty line – SDG 1. Indicator 1.1.1 .. ..
Gini index, latest available year .. ..
Prevalence of undernourishment (per cent) – SDG 2. Indicator 2.1.1 37.5 43.4
Value added of agriculture/industry/services (as a share of GDP) 28/42/30 22/47/31 22/47/31
Employment in agriculture/industry/services (as a share of total employment) 67/18/15 67/17/16 67/18/15
Share of women in agriculture/industry/services 52/51/38 51/49/37 51/49/37
Institutional quality index, 2018 0.0164
Control of corruption –1.28 –1.35 –1.48
Rule of law –1.15 –1.61 –1.71
OTHER STRUCTURAL INDICATORS
MERCHANDISE AND COMMODITY EXPORT DEPENDENCE
COMMODITY IMPORT DEPENDENCE
KEY SOCIOECONOMIC INDICATORS](https://image.slidesharecdn.com/stateofcommoditydependance2019-190524115214/85/State-of-commodity-dependance-2019-82-320.jpg)
![Table of contents Introduction
Chapter 1
Key Findings
from the Report
Chapter 2
Country Statistical
Profiles
List of Country
Statistical Profiles
77
DEMOCRATIC REPUBLIC OF THE CONGO*
1995 2013-2017 2017
Merchandise export value (millions of US dollars) 1,563 6,740 7,765
Unallocated exports (as a share of merchandise exports) .. 1.2 1.1
Merchandise export concentration by product line (Herfindahl-Hirschmann index) 0.5248 0.4622 0.3728
Commodity export value (millions of US dollars) 1,542 6,251 6,712
Commodity exports (as a share of total merchandise exports) 99 93 86
Commodity exports (as a share of GDP) 17.2 16.9 17.6
Total natural resources rents (as a share of GDP) 37.3 33.9 32.7
Exports by commodity group (as a share of merchandise exports) 99 93 86
Agricultural commodities 13 3 2
Fuels 10 9 7
Ores, metals, precious stones and non-monetary gold 75 81 77
Three leading commodity exports (as a share of total merchandise exports) 16 68 65
[682] Copper 4 42 26
[689] Miscellaneous no-ferrous base metals for metallur. 12 14 25
[283] Copper ores and concentrates; copper mattes, cemen 0 12 14
Average price index of the leading commodity group exported 58.3 123.5 127.5
Five leading destination markets of commodity exports (as a share of total commodity exports) 84
China 41
Zambia 15
European Union (28) 15
Saudi Arabia 8
Republic of Korea 6
Commodity imports (millions of US dollars) 325 1,600 1,431
Commodity imports (as a share of total merchandise imports) 37 27 27
Food imports (millions of US dollars and as a share of total merchandise imports) 182 (21) 995 (17) 895 (17)
Fuel imports (millions of US dollars and as a share of total merchandise imports) 87 (10) 308 (5) 198 (4)
Five-leading trading partners for commodity imports (as a share of total commodity imports) 59
European Union (28) 21
Zambia 14
South Africa 12
United Republic of Tanzania 6
Uganda 6
Percentage change of GDP measured in constant 2010 prices 0.7 31.2 2.7
GDP per capita measured in constant 2010 US dollars 401 399 405
Population (thousands) 22,695 40,916 43,694
Human Development Index (value and rank) 0.3330 (137) 0.4430 (175) 0.4570 (173)
Total employment (as a share of the population) 69.5 69.8 69.7
Share of women in total employment 50.4 49.5 49.5
Proportion of population below international poverty line – SDG 1. Indicator 1.1.1 (2004) 94.1 (2012) 77.1
Gini index, latest available year (2004) 42.2 (2012) 42.1
Prevalence of undernourishment (per cent) – SDG 2. Indicator 2.1.1 .. ..
Value added of agriculture/industry/services (as a share of GDP) 57/17/26 20/45/35 21/43/36
Employment in agriculture/industry/services (as a share of total employment) 87/7/6 81/12/7 82/11/7
Share of women in agriculture/industry/services 53/40/26 53/42/26 53/41/27
Institutional quality index, 2018 0.1043
Control of corruption –1.65 –1.33 –1.42
Rule of law –1.88 –1.58 –1.69
OTHER STRUCTURAL INDICATORS
MERCHANDISE AND COMMODITY EXPORT DEPENDENCE
COMMODITY IMPORT DEPENDENCE
KEY SOCIOECONOMIC INDICATORS](https://image.slidesharecdn.com/stateofcommoditydependance2019-190524115214/85/State-of-commodity-dependance-2019-83-320.jpg)
![Table of contents Introduction
Chapter 1
Key Findings
from the Report
Chapter 2
Country Statistical
Profiles
List of Country
Statistical Profiles
78
DENMARK
1995 2013-2017 2017
Merchandise export value (millions of US dollars) 48,789 102,368 101,646
Unallocated exports (as a share of merchandise exports) 9.5 8.6 2.3
Merchandise export concentration by product line (Herfindahl-Hirschmann index) 0.0920 0.0943 0.0953
Commodity export value (millions of US dollars) 14,977 29,293 27,849
Commodity exports (as a share of total merchandise exports) 31 29 27
Commodity exports (as a share of GDP) 8.1 9.0 8.6
Total natural resources rents (as a share of GDP) 0.3 0.8 0.5
Exports by commodity group (as a share of merchandise exports) 31 29 27
Agricultural commodities 27 22 22
Fuels 3 6 4
Ores, metals, precious stones and non-monetary gold 1 1 2
Three leading commodity exports (as a share of total merchandise exports) 11 9 9
[012] Other meat and edible meat offal 5 3 3
[03] Fishery products 4 3 3
[334] Petroleum oils or bituminous minerals 70 % oil 1 3 2
Average price index of the leading commodity group exported 80.8 109.0 102.7
Five leading destination markets of commodity exports (as a share of total commodity exports) 85
European Union (28) 69
Norway 5
China 5
China, Hong Kong SAR 3
Japan 3
Commodity imports (millions of US dollars) 8,812 23,248 21,650
Commodity imports (as a share of total merchandise imports) 20 25 23
Food imports (millions of US dollars and as a share of total merchandise imports) 4,650 (11) 11,398 (12) 11,393 (12)
Fuel imports (millions of US dollars and as a share of total merchandise imports) 1,436 (3) 6,700 (7) 5,049 (5)
Five-leading trading partners for commodity imports (as a share of total commodity imports) 85
European Union (28) 61
Norway 15
Russian Federation 4
United States of America 2
Greenland 2
Percentage change of GDP measured in constant 2010 prices 3.0 5.4 2.2
GDP per capita measured in constant 2010 US dollars 49,129 60,094 61,945
Population (thousands) 4,324 4,729 4,788
Human Development Index (value and rank) 0.8310 (13) 0.9284 (5) 0.9290 (10)
Total employment (as a share of the population) 60.8 58.6 59.5
Share of women in total employment 44.4 47.2 47.3
Proportion of population below international poverty line – SDG 1. Indicator 1.1.1 (2003) 0.2 (2015) 0.2
Gini index, latest available year (2003) 25.6 (2015) 28.2
Prevalence of undernourishment (per cent) – SDG 2. Indicator 2.1.1 2.5 2.5
Value added of agriculture/industry/services (as a share of GDP) 3/26/71 1/23/76 1/23/76
Employment in agriculture/industry/services (as a share of total employment) 4/27/69 3/19/78 3/19/79
Share of women in agriculture/industry/services 25/24/53 19/23/54 20/24/54
Institutional quality index, 2018 0.9615
Control of corruption 2.23 2.26 2.19
Rule of law 1.82 1.96 1.86
OTHER STRUCTURAL INDICATORS
MERCHANDISE AND COMMODITY EXPORT DEPENDENCE
COMMODITY IMPORT DEPENDENCE
KEY SOCIOECONOMIC INDICATORS](https://image.slidesharecdn.com/stateofcommoditydependance2019-190524115214/85/State-of-commodity-dependance-2019-84-320.jpg)
![Table of contents Introduction
Chapter 1
Key Findings
from the Report
Chapter 2
Country Statistical
Profiles
List of Country
Statistical Profiles
79
DJIBOUTI*
1995 2013-2017 2017
Merchandise export value (millions of US dollars) 14 130 137
Unallocated exports (as a share of merchandise exports) 2.2 8.7 10.5
Merchandise export concentration by product line (Herfindahl-Hirschmann index) 0.1198 0.1923 0.1602
Commodity export value (millions of US dollars) 6 87 84
Commodity exports (as a share of total merchandise exports) 46 67 61
Commodity exports (as a share of GDP) 1.3 5.0 4.1
Total natural resources rents (as a share of GDP) 0.6 0.9 ..
Exports by commodity group (as a share of merchandise exports) 46 67 61
Agricultural commodities 23 42 43
Fuels 10 11 4
Ores, metals, precious stones and non-monetary gold 12 13 13
Three leading commodity exports (as a share of total merchandise exports) 8 28 21
[001] Live animals other than animals of division 03 6 11 11
[24 + 25] Forestry products 2 9 8
[335] Residual petroleum products, n.e.s., related mater. – 8 2
Average price index of the leading commodity group exported 80.8 109.0 102.7
Five leading destination markets of commodity exports (as a share of total commodity exports) 72
Ethiopia 20
United Arab Emirates 18
Saudi Arabia 16
Eritrea 11
Qatar 6
Commodity imports (millions of US dollars) 71 206 189
Commodity imports (as a share of total merchandise imports) 40 27 26
Food imports (millions of US dollars and as a share of total merchandise imports) 37 (21) 158 (21) 149 (20)
Fuel imports (millions of US dollars and as a share of total merchandise imports) 4 (2) 21 (3) 16 (2)
Five-leading trading partners for commodity imports (as a share of total commodity imports) 58
United Arab Emirates 14
Indonesia 13
European Union (28) 12
Saudi Arabia 10
Ethiopia 8
Percentage change of GDP measured in constant 2010 prices 5.6 24.1 6.8
GDP per capita measured in constant 2010 US dollars 1,061 1,499 1,643
Population (thousands) 358 630 659
Human Development Index (value and rank) 0.3550 (135) 0.4700 (169) 0.4760 (169)
Total employment (as a share of the population) 58.4 55.5 55.5
Share of women in total employment 36.4 41.2 41.5
Proportion of population below international poverty line – SDG 1. Indicator 1.1.1 (2002) 20.6 (2013) 22.5
Gini index, latest available year (2002) 40.0 (2013) 44.1
Prevalence of undernourishment (per cent) – SDG 2. Indicator 2.1.1 48.1 19.7
Value added of agriculture/industry/services (as a share of GDP) 3/15/81 3/21/75 3/22/75
Employment in agriculture/industry/services (as a share of total employment) 33/22/44 31/30/39 30/30/41
Share of women in agriculture/industry/services 33/52/31 38/52/36 37/52/37
Institutional quality index, 2018 0.1642
Control of corruption –0.72 –0.62 –0.64
Rule of law –0.97 –0.89 –0.91
OTHER STRUCTURAL INDICATORS
MERCHANDISE AND COMMODITY EXPORT DEPENDENCE
COMMODITY IMPORT DEPENDENCE
KEY SOCIOECONOMIC INDICATORS](https://image.slidesharecdn.com/stateofcommoditydependance2019-190524115214/85/State-of-commodity-dependance-2019-85-320.jpg)
![Table of contents Introduction
Chapter 1
Key Findings
from the Report
Chapter 2
Country Statistical
Profiles
List of Country
Statistical Profiles
80
DOMINICA
1995 2013-2017 2017
Merchandise export value (millions of US dollars) 45 32 22
Unallocated exports (as a share of merchandise exports) – – –
Merchandise export concentration by product line (Herfindahl-Hirschmann index) 0.5150 0.4086 0.4105
Commodity export value (millions of US dollars) 23 8 6
Commodity exports (as a share of total merchandise exports) 51 25 25
Commodity exports (as a share of GDP) 9.0 1.5 1.0
Total natural resources rents (as a share of GDP) – 0.1 0.1
Exports by commodity group (as a share of merchandise exports) 52 25 25
Agricultural commodities 51 18 18
Fuels – – –
Ores, metals, precious stones and non-monetary gold 1 7 7
Three leading commodity exports (as a share of total merchandise exports) 48 21 22
[057] Fruits and nuts (excluding oil nuts), fresh or dried 43 10 11
[273] Stone, sand and gravel 1 7 7
[054] Vegetables 4 4 4
Average price index of the leading commodity group exported 80.8 109.0 102.7
Five leading destination markets of commodity exports (as a share of total commodity exports) 87
European Union (28) 45
Antigua and Barbuda 20
Saint Kitts and Nevis 13
Guyana 5
Trinidad and Tobago 4
Commodity imports (millions of US dollars) 40 85 69
Commodity imports (as a share of total merchandise imports) 34 40 34
Food imports (millions of US dollars and as a share of total merchandise imports) 26 (22) 47 (22) 43 (22)
Fuel imports (millions of US dollars and as a share of total merchandise imports) 7 (6) 25 (12) 13 (6)
Five-leading trading partners for commodity imports (as a share of total commodity imports) 79
Trinidad and Tobago 32
United States of America 30
European Union (28) 9
Guyana 4
Canada 4
Percentage change of GDP measured in constant 2010 prices 2.0 1.1 –5.4
GDP per capita measured in constant 2010 US dollars 4,825 6,775 6,502
Population (thousands) .. .. ..
Human Development Index (value and rank) .. 0.7198 (98) 0.7150 (101)
Total employment (as a share of the population) .. .. ..
Share of women in total employment .. .. ..
Proportion of population below international poverty line – SDG 1. Indicator 1.1.1 .. ..
Gini index, latest available year .. ..
Prevalence of undernourishment (per cent) – SDG 2. Indicator 2.1.1 4.7 5.2
Value added of agriculture/industry/services (as a share of GDP) 14/16/70 16/14/70 18/14/68
Employment in agriculture/industry/services (as a share of total employment) .. .. ..
Share of women in agriculture/industry/services .. .. ..
Institutional quality index, 2018 0.6650
Control of corruption 0.87 0.64 0.65
Rule of law 0.84 0.61 0.65
MERCHANDISE AND COMMODITY EXPORT DEPENDENCE
COMMODITY IMPORT DEPENDENCE
KEY SOCIOECONOMIC INDICATORS
OTHER STRUCTURAL INDICATORS](https://image.slidesharecdn.com/stateofcommoditydependance2019-190524115214/85/State-of-commodity-dependance-2019-86-320.jpg)
![Table of contents Introduction
Chapter 1
Key Findings
from the Report
Chapter 2
Country Statistical
Profiles
List of Country
Statistical Profiles
81
DOMINICAN REPUBLIC
1995 2013-2017 2017
Merchandise export value (millions of US dollars) 3,780 9,796 10,121
Unallocated exports (as a share of merchandise exports) 2.2 2.0 2.5
Merchandise export concentration by product line (Herfindahl-Hirschmann index) 0.2074 0.1937 0.2002
Commodity export value (millions of US dollars) 703 4,268 4,319
Commodity exports (as a share of total merchandise exports) 19 44 43
Commodity exports (as a share of GDP) 4.5 6.2 5.8
Total natural resources rents (as a share of GDP) 1.0 1.7 1.8
Exports by commodity group (as a share of merchandise exports) 19 44 43
Agricultural commodities 16 23 23
Fuels – 1 1
Ores, metals, precious stones and non-monetary gold 2 19 18
Three leading commodity exports (as a share of total merchandise exports) 6 28 29
[971] Gold, non-monetary (excluding gold ores and concentrates) 1 16 16
[122] Tobacco, manufactured 2 7 8
[057] Fruits and nuts (excluding oil nuts), fresh or dried 3 5 4
Average price index of the leading commodity group exported 33.4 110.1 107.6
Five leading destination markets of commodity exports (as a share of total commodity exports) 84
United States of America 31
Canada 22
European Union (28) 17
India 9
Haiti 5
Commodity imports (millions of US dollars) 1,358 6,488 6,736
Commodity imports (as a share of total merchandise imports) 26 36 35
Food imports (millions of US dollars and as a share of total merchandise imports) 567 (11) 2,300 (13) 2,483 (13)
Fuel imports (millions of US dollars and as a share of total merchandise imports) 572 (11) 3,287 (18) 3,286 (17)
Five-leading trading partners for commodity imports (as a share of total commodity imports) 77
United States of America 49
Venezuela (Bolivarian Rep. of) 9
European Union (28) 8
Mexico 7
Trinidad and Tobago 5
Percentage change of GDP measured in constant 2010 prices 5.5 24.4 4.6
GDP per capita measured in constant 2010 US dollars 2,993 6,426 7,039
Population (thousands) 4,967 7,376 7,612
Human Development Index (value and rank) 0.6290 (77) 0.7258 (95) 0.7360 (92)
Total employment (as a share of the population) 59.7 62.4 63.1
Share of women in total employment 34.0 39.6 40.2
Proportion of population below international poverty line – SDG 1. Indicator 1.1.1 (1996) 4.9 (2016) 1.6
Gini index, latest available year (1996) 47.4 (2016) 45.3
Prevalence of undernourishment (per cent) – SDG 2. Indicator 2.1.1 28.1 10.4
Value added of agriculture/industry/services (as a share of GDP) 11/35/54 6/30/64 6/28/65
Employment in agriculture/industry/services (as a share of total employment) 21/26/54 13/17/69 12/17/70
Share of women in agriculture/industry/services 6/29/47 7/22/51 6/21/51
Institutional quality index, 2018 0.4699
Control of corruption –0.42 –0.80 –0.74
Rule of law –0.52 –0.45 –0.42
OTHER STRUCTURAL INDICATORS
MERCHANDISE AND COMMODITY EXPORT DEPENDENCE
COMMODITY IMPORT DEPENDENCE
KEY SOCIOECONOMIC INDICATORS](https://image.slidesharecdn.com/stateofcommoditydependance2019-190524115214/85/State-of-commodity-dependance-2019-87-320.jpg)
![Table of contents Introduction
Chapter 1
Key Findings
from the Report
Chapter 2
Country Statistical
Profiles
List of Country
Statistical Profiles
82
ECUADOR
1995 2013-2017 2017
Merchandise export value (millions of US dollars) 4,361 20,987 19,122
Unallocated exports (as a share of merchandise exports) – 0.1 0.1
Merchandise export concentration by product line (Herfindahl-Hirschmann index) 0.3720 0.4225 0.3676
Commodity export value (millions of US dollars) 4,028 19,637 17,936
Commodity exports (as a share of total merchandise exports) 92 94 94
Commodity exports (as a share of GDP) 16.5 19.7 17.6
Total natural resources rents (as a share of GDP) 6.3 7.9 4.4
Exports by commodity group (as a share of merchandise exports) 92 94 94
Agricultural commodities 55 46 55
Fuels 35 44 36
Ores, metals, precious stones and non-monetary gold 3 3 2
Three leading commodity exports (as a share of total merchandise exports) 72 74 72
[333] Petroleum oils, oils from bitumin. materials, crude 32 42 32
[03] Fishery products 20 18 23
[057] Fruits and nuts (excluding oil nuts), fresh or dried 19 13 16
Average price index of the leading commodity group exported 36.5 132.1 103.8
Five leading destination markets of commodity exports (as a share of total commodity exports) 74
United States of America 41
European Union (28) 15
Chile 8
Peru 6
Viet Nam 4
Commodity imports (millions of US dollars) 762 7,099 5,914
Commodity imports (as a share of total merchandise imports) 18 32 30
Food imports (millions of US dollars and as a share of total merchandise imports) 294 (7) 1,905 (9) 1,977 (10)
Fuel imports (millions of US dollars and as a share of total merchandise imports) 247 (6) 4,633 (21) 3,377 (17)
Five-leading trading partners for commodity imports (as a share of total commodity imports) 75
United States of America 45
Panama 12
European Union (28) 8
Peru 6
Chile 4
Percentage change of GDP measured in constant 2010 prices 2.3 14.5 3.0
GDP per capita measured in constant 2010 US dollars 3,848 5,308 5,251
Population (thousands) 7,266 11,457 11,897
Human Development Index (value and rank) 0.6620 (63) 0.7440 (85) 0.7520 (84)
Total employment (as a share of the population) 60.7 63.9 65.6
Share of women in total employment 36.5 39.4 40.5
Proportion of population below international poverty line – SDG 1. Indicator 1.1.1 (1998) 15.7 (2016) 3.6
Gini index, latest available year (1998) 49.7 (2016) 45.0
Prevalence of undernourishment (per cent) – SDG 2. Indicator 2.1.1 18.5 7.8
Value added of agriculture/industry/services (as a share of GDP) 23/28/49 10/37/53 10/37/53
Employment in agriculture/industry/services (as a share of total employment) 35/18/47 26/19/54 27/19/55
Share of women in agriculture/industry/services 29/26/46 33/23/48 34/24/49
Institutional quality index, 2018 0.2850
Control of corruption –0.68 –0.66 –0.60
Rule of law –0.45 –0.90 –0.70
OTHER STRUCTURAL INDICATORS
MERCHANDISE AND COMMODITY EXPORT DEPENDENCE
COMMODITY IMPORT DEPENDENCE
KEY SOCIOECONOMIC INDICATORS](https://image.slidesharecdn.com/stateofcommoditydependance2019-190524115214/85/State-of-commodity-dependance-2019-88-320.jpg)
![Table of contents Introduction
Chapter 1
Key Findings
from the Report
Chapter 2
Country Statistical
Profiles
List of Country
Statistical Profiles
83
EGYPT
1995 2013-2017 2017
Merchandise export value (millions of US dollars) 3,444 25,794 25,943
Unallocated exports (as a share of merchandise exports) 0.9 0.8 0.4
Merchandise export concentration by product line (Herfindahl-Hirschmann index) 0.3095 0.1537 0.1493
Commodity export value (millions of US dollars) 2,214 13,880 13,896
Commodity exports (as a share of total merchandise exports) 64 54 54
Commodity exports (as a share of GDP) 3.4 5.1 7.0
Total natural resources rents (as a share of GDP) 7.0 6.5 4.0
Exports by commodity group (as a share of merchandise exports) 64 54 54
Agricultural commodities 15 19 18
Fuels 45 25 22
Ores, metals, precious stones and non-monetary gold 5 10 13
Three leading commodity exports (as a share of total merchandise exports) 43 27 29
[333] Petroleum oils, oils from bitumin. materials, crude 31 15 13
[334] Petroleum oils or bituminous minerals 70 % oil 12 6 7
[971] Gold, non-monetary (excluding gold ores and concentrates) – 6 9
Average price index of the leading commodity group exported 36.5 132.1 103.8
Five leading destination markets of commodity exports (as a share of total commodity exports) 46
India 14
United Arab Emirates 12
Saudi Arabia 8
China 7
Canada 5
Commodity imports (millions of US dollars) 3,843 25,623 27,759
Commodity imports (as a share of total merchandise imports) 33 39 42
Food imports (millions of US dollars and as a share of total merchandise imports) 2,649 (23) 11,755 (18) 11,875 (18)
Fuel imports (millions of US dollars and as a share of total merchandise imports) 132 (1) 8,805 (14) 10,929 (16)
Five-leading trading partners for commodity imports (as a share of total commodity imports) 53
European Union (28) 26
Russian Federation 8
United States of America 7
Brazil 7
Kuwait 5
Percentage change of GDP measured in constant 2010 prices 4.6 13.8 5.1
GDP per capita measured in constant 2010 US dollars 1,615 2,641 2,784
Population (thousands) 38,495 62,651 64,901
Human Development Index (value and rank) 0.5760 (94) 0.6888 (113) 0.6960 (113)
Total employment (as a share of the population) 41.2 42.2 42.2
Share of women in total employment 19.2 19.8 19.8
Proportion of population below international poverty line – SDG 1. Indicator 1.1.1 (1995) 4.6 (2015) 1.3
Gini index, latest available year (1995) 30.1 (2015) 31.8
Prevalence of undernourishment (per cent) – SDG 2. Indicator 2.1.1 5.2 4.8
Value added of agriculture/industry/services (as a share of GDP) 17/33/51 11/37/52 12/33/55
Employment in agriculture/industry/services (as a share of total employment) 34/22/44 26/25/49 25/26/50
Share of women in agriculture/industry/services 24/8/21 30/4/22 30/5/23
Institutional quality index, 2018 0.2561
Control of corruption –0.47 –0.62 –0.54
Rule of law – –0.59 –0.53
OTHER STRUCTURAL INDICATORS
MERCHANDISE AND COMMODITY EXPORT DEPENDENCE
COMMODITY IMPORT DEPENDENCE
KEY SOCIOECONOMIC INDICATORS](https://image.slidesharecdn.com/stateofcommoditydependance2019-190524115214/85/State-of-commodity-dependance-2019-89-320.jpg)
![Table of contents Introduction
Chapter 1
Key Findings
from the Report
Chapter 2
Country Statistical
Profiles
List of Country
Statistical Profiles
84
EL SALVADOR
1995 2013-2017 2017
Merchandise export value (millions of US dollars) 1,652 5,502 5,760
Unallocated exports (as a share of merchandise exports) 0.6 0.9 0.9
Merchandise export concentration by product line (Herfindahl-Hirschmann index) 0.2910 0.2081 0.2057
Commodity export value (millions of US dollars) 785 1,352 1,406
Commodity exports (as a share of total merchandise exports) 48 25 24
Commodity exports (as a share of GDP) 8.3 5.2 5.0
Total natural resources rents (as a share of GDP) 0.7 0.9 0.9
Exports by commodity group (as a share of merchandise exports) 47 25 24
Agricultural commodities 45 21 21
Fuels – 2 2
Ores, metals, precious stones and non-monetary gold 2 2 1
Three leading commodity exports (as a share of total merchandise exports) 36 10 9
[061] Sugar, molasses and honey 3 4 5
[071] Coffee and coffee substitutes 31 3 2
[048] Cereal preparations, flour of fruits or vegetables 2 3 3
Average price index of the leading commodity group exported 80.8 109.0 102.7
Five leading destination markets of commodity exports (as a share of total commodity exports) 70
United States of America 21
Guatemala 20
European Union (28) 12
Honduras 11
Nicaragua 6
Commodity imports (millions of US dollars) 859 3,646 3,701
Commodity imports (as a share of total merchandise imports) 26 35 35
Food imports (millions of US dollars and as a share of total merchandise imports) 451 (14) 1,739 (17) 1,854 (18)
Fuel imports (millions of US dollars and as a share of total merchandise imports) 265 (8) 1,474 (14) 1,349 (13)
Five-leading trading partners for commodity imports (as a share of total commodity imports) 78
United States of America 46
Guatemala 15
Nicaragua 7
Honduras 5
Costa Rica 4
Percentage change of GDP measured in constant 2010 prices 6.4 7.9 2.3
GDP per capita measured in constant 2010 US dollars 2,725 3,742 3,870
Population (thousands) 3,490 4,524 4,632
Human Development Index (value and rank) 0.5770 (92) 0.6736 (117) 0.6740 (118)
Total employment (as a share of the population) 57.3 59.0 58.6
Share of women in total employment 37.4 42.2 42.0
Proportion of population below international poverty line – SDG 1. Indicator 1.1.1 (1995) 12.5 (2016) 2.2
Gini index, latest available year (1995) 49.9 (2016) 40.0
Prevalence of undernourishment (per cent) – SDG 2. Indicator 2.1.1 11.0 10.3
Value added of agriculture/industry/services (as a share of GDP) 14/29/57 11/26/64 11/25/64
Employment in agriculture/industry/services (as a share of total employment) 27/26/47 19/21/60 19/21/60
Share of women in agriculture/industry/services 11/37/53 9/36/55 9/34/55
Institutional quality index, 2018 0.4800
Control of corruption –0.87 –0.44 –0.51
Rule of law –0.87 –0.65 –0.86
MERCHANDISE AND COMMODITY EXPORT DEPENDENCE
COMMODITY IMPORT DEPENDENCE
KEY SOCIOECONOMIC INDICATORS
OTHER STRUCTURAL INDICATORS](https://image.slidesharecdn.com/stateofcommoditydependance2019-190524115214/85/State-of-commodity-dependance-2019-90-320.jpg)
![Table of contents Introduction
Chapter 1
Key Findings
from the Report
Chapter 2
Country Statistical
Profiles
List of Country
Statistical Profiles
85
EQUATORIAL GUINEA
1995 2013-2017 2017
Merchandise export value (millions of US dollars) 127 8,820 5,200
Unallocated exports (as a share of merchandise exports) 0.5 0.7 0.2
Merchandise export concentration by product line (Herfindahl-Hirschmann index) 0.4474 0.6721 0.6395
Commodity export value (millions of US dollars) 119 8,266 4,671
Commodity exports (as a share of total merchandise exports) 94 94 90
Commodity exports (as a share of GDP) 55.5 53.0 42.6
Total natural resources rents (as a share of GDP) 45.7 22.9 16.5
Exports by commodity group (as a share of merchandise exports) 94 93 90
Agricultural commodities 66 2 5
Fuels 28 91 83
Ores, metals, precious stones and non-monetary gold – – 1
Three leading commodity exports (as a share of total merchandise exports) 4 89 83
[333] Petroleum oils, oils from bitumin. materials, crude 4 67 64
[343] Natural gas, whether or not liquefied – 20 15
[342] Liquefied propane and butane – 3 4
Average price index of the leading commodity group exported 36.5 132.1 103.8
Five leading destination markets of commodity exports (as a share of total commodity exports) 77
European Union (28) 33
China 21
Japan 8
India 8
Brazil 7
Commodity imports (millions of US dollars) 39 1,033 1,016
Commodity imports (as a share of total merchandise imports) 32 23 33
Food imports (millions of US dollars and as a share of total merchandise imports) 18 (15) 476 (11) 600 (19)
Fuel imports (millions of US dollars and as a share of total merchandise imports) 4 (3) 216 (5) 87 (3)
Five-leading trading partners for commodity imports (as a share of total commodity imports) 77
European Union (28) 53
Côte d'Ivoire 10
Cameroon 6
Brazil 5
United States of America 3
Percentage change of GDP measured in constant 2010 prices 11.7 –7.7 –6.8
GDP per capita measured in constant 2010 US dollars 1,834 13,996 11,026
Population (thousands) 289 735 796
Human Development Index (value and rank) .. 0.5914 (135) 0.5910 (138)
Total employment (as a share of the population) 57.8 55.7 55.2
Share of women in total employment 39.5 39.6 39.2
Proportion of population below international poverty line – SDG 1. Indicator 1.1.1 .. ..
Gini index, latest available year .. ..
Prevalence of undernourishment (per cent) – SDG 2. Indicator 2.1.1 .. ..
Value added of agriculture/industry/services (as a share of GDP) 13/36/52 2/62/36 3/50/47
Employment in agriculture/industry/services (as a share of total employment) 80/12/8 57/7/36 60/6/34
Share of women in agriculture/industry/services 42/35/29 46/13/35 45/14/33
Institutional quality index, 2018 0.0548
Control of corruption –1.26 –1.75 –1.83
Rule of law –1.28 –1.45 –1.49
OTHER STRUCTURAL INDICATORS
MERCHANDISE AND COMMODITY EXPORT DEPENDENCE
COMMODITY IMPORT DEPENDENCE
KEY SOCIOECONOMIC INDICATORS](https://image.slidesharecdn.com/stateofcommoditydependance2019-190524115214/85/State-of-commodity-dependance-2019-91-320.jpg)
![Table of contents Introduction
Chapter 1
Key Findings
from the Report
Chapter 2
Country Statistical
Profiles
List of Country
Statistical Profiles
86
ERITREA*
1995 2013-2017 2017
Merchandise export value (millions of US dollars) 86 379 296
Unallocated exports (as a share of merchandise exports) 1.5 0.1 0.1
Merchandise export concentration by product line (Herfindahl-Hirschmann index) 0.3273 0.4093 0.4128
Commodity export value (millions of US dollars) 58 342 282
Commodity exports (as a share of total merchandise exports) 67 90 95
Commodity exports (as a share of GDP) 9.1 7.1 4.6
Total natural resources rents (as a share of GDP) 8.9 .. ..
Exports by commodity group (as a share of merchandise exports) 68 90 95
Agricultural commodities 68 32 31
Fuels – – –
Ores, metals, precious stones and non-monetary gold – 59 64
Three leading commodity exports (as a share of total merchandise exports) – 52 62
[283] Copper ores and concentrates; copper mattes, cemen – 33 5
[971] Gold, non-monetary (excluding gold ores and concentrates) – 13 20
[287] Ores and concentrates of base metals, n.e.s. – 7 36
Average price index of the leading commodity group exported 58.3 123.5 127.5
Five leading destination markets of commodity exports (as a share of total commodity exports) 84
China 39
India 22
United Arab Emirates 8
European Union (28) 7
Republic of Korea 7
Commodity imports (millions of US dollars) 82 415 484
Commodity imports (as a share of total merchandise imports) 19 39 43
Food imports (millions of US dollars and as a share of total merchandise imports) 48 (11) 338 (32) 412 (37)
Fuel imports (millions of US dollars and as a share of total merchandise imports) 22 (5) 40 (4) 31 (3)
Five-leading trading partners for commodity imports (as a share of total commodity imports) 52
European Union (28) 15
United Arab Emirates 14
Turkey 10
Egypt 7
Saudi Arabia 6
Percentage change of GDP measured in constant 2010 prices 20.9 20.7 3.2
GDP per capita measured in constant 2010 US dollars 597 571 589
Population (thousands) 1,618 2,810 2,951
Human Development Index (value and rank) .. 0.4324 (176) 0.4400 (176)
Total employment (as a share of the population) 76.9 76.1 76.2
Share of women in total employment 45.1 46.6 46.6
Proportion of population below international poverty line – SDG 1. Indicator 1.1.1 .. ..
Gini index, latest available year .. ..
Prevalence of undernourishment (per cent) – SDG 2. Indicator 2.1.1 .. ..
Value added of agriculture/industry/services (as a share of GDP) 21/17/62 17/24/59 17/24/59
Employment in agriculture/industry/services (as a share of total employment) 84/7/9 84/7/9 84/7/9
Share of women in agriculture/industry/services 48/34/24 50/33/26 50/32/26
Institutional quality index, 2018 0.0328
Control of corruption 0.51 –1.12 –1.20
Rule of law –0.66 –1.52 –1.56
MERCHANDISE AND COMMODITY EXPORT DEPENDENCE
COMMODITY IMPORT DEPENDENCE
KEY SOCIOECONOMIC INDICATORS
OTHER STRUCTURAL INDICATORS](https://image.slidesharecdn.com/stateofcommoditydependance2019-190524115214/85/State-of-commodity-dependance-2019-92-320.jpg)
![Table of contents Introduction
Chapter 1
Key Findings
from the Report
Chapter 2
Country Statistical
Profiles
List of Country
Statistical Profiles
87
ESTONIA
1995 2013-2017 2017
Merchandise export value (millions of US dollars) 1,840 15,797 15,353
Unallocated exports (as a share of merchandise exports) – 5.3 5.2
Merchandise export concentration by product line (Herfindahl-Hirschmann index) 0.0813 0.1074 0.0893
Commodity export value (millions of US dollars) 660 4,495 4,456
Commodity exports (as a share of total merchandise exports) 36 28 29
Commodity exports (as a share of GDP) 14.9 18.2 17.2
Total natural resources rents (as a share of GDP) 1.7 1.0 1.0
Exports by commodity group (as a share of merchandise exports) 36 28 29
Agricultural commodities 26 16 17
Fuels 7 10 10
Ores, metals, precious stones and non-monetary gold 3 2 3
Three leading commodity exports (as a share of total merchandise exports) 13 14 15
[334] Petroleum oils or bituminous minerals 70 % oil 3 7 7
[24 + 25] Forestry products 8 5 6
[351] Electric current 1 2 1
Average price index of the leading commodity group exported 36.5 132.1 103.8
Five leading destination markets of commodity exports (as a share of total commodity exports) 83
European Union (28) 60
Russian Federation 9
United States of America 9
Turkey 3
Norway 2
Commodity imports (millions of US dollars) 773 5,145 4,630
Commodity imports (as a share of total merchandise imports) 30 29 27
Food imports (millions of US dollars and as a share of total merchandise imports) 312 (12) 1,574 (9) 1,732 (10)
Fuel imports (millions of US dollars and as a share of total merchandise imports) 289 (11) 2,394 (13) 1,731 (10)
Five-leading trading partners for commodity imports (as a share of total commodity imports) 92
European Union (28) 59
Russian Federation 28
Côte d'Ivoire 2
Norway 1
Belarus 1
Percentage change of GDP measured in constant 2010 prices 4.3 13.2 4.9
GDP per capita measured in constant 2010 US dollars 7,323 17,855 19,082
Population (thousands) 1,138 1,104 1,095
Human Development Index (value and rank) 0.7270 (42) 0.8662 (28) 0.8710 (28)
Total employment (as a share of the population) 55.8 57.8 59.2
Share of women in total employment 48.2 48.8 48.8
Proportion of population below international poverty line – SDG 1. Indicator 1.1.1 (1995) 0.6 (2015) 0.5
Gini index, latest available year (1995) 30.1 (2015) 32.7
Prevalence of undernourishment (per cent) – SDG 2. Indicator 2.1.1 5.6 2.8
Value added of agriculture/industry/services (as a share of GDP) 6/32/62 3/28/69 3/27/71
Employment in agriculture/industry/services (as a share of total employment) 10/34/56 4/30/66 4/30/66
Share of women in agriculture/industry/services 37/37/57 27/28/60 25/29/59
Institutional quality index, 2018 0.9033
Control of corruption 0.45 1.26 1.24
Rule of law 0.57 1.28 1.28
OTHER STRUCTURAL INDICATORS
MERCHANDISE AND COMMODITY EXPORT DEPENDENCE
COMMODITY IMPORT DEPENDENCE
KEY SOCIOECONOMIC INDICATORS](https://image.slidesharecdn.com/stateofcommoditydependance2019-190524115214/85/State-of-commodity-dependance-2019-93-320.jpg)
![Table of contents Introduction
Chapter 1
Key Findings
from the Report
Chapter 2
Country Statistical
Profiles
List of Country
Statistical Profiles
88
ESWATINI
1995 2013-2017 2017
Merchandise export value (millions of US dollars) 866 1,877 2,016
Unallocated exports (as a share of merchandise exports) 0.2 9.5 13.7
Merchandise export concentration by product line (Herfindahl-Hirschmann index) 0.2517 0.2418 0.2484
Commodity export value (millions of US dollars) 399 684 688
Commodity exports (as a share of total merchandise exports) 46 36 34
Commodity exports (as a share of GDP) 21.0 15.6 14.7
Total natural resources rents (as a share of GDP) 4.3 2.7 3.1
Exports by commodity group (as a share of merchandise exports) 46 36 34
Agricultural commodities 44 32 30
Fuels – 2 2
Ores, metals, precious stones and non-monetary gold 1 3 2
Three leading commodity exports (as a share of total merchandise exports) 28 24 22
[24 + 25] Forestry products 8 12 12
[061] Sugar, molasses and honey 17 10 8
[057] Fruits and nuts (excluding oil nuts), fresh or dried 3 2 2
Average price index of the leading commodity group exported 99.7 110.0 105.1
Five leading destination markets of commodity exports (as a share of total commodity exports) 86
South Africa 56
European Union (28) 19
India 5
China 4
Mozambique 2
Commodity imports (millions of US dollars) 333 607 594
Commodity imports (as a share of total merchandise imports) 33 39 37
Food imports (millions of US dollars and as a share of total merchandise imports) 155 (15) 331 (21) 325 (20)
Fuel imports (millions of US dollars and as a share of total merchandise imports) 104 (10) 210 (13) 201 (12)
Five-leading trading partners for commodity imports (as a share of total commodity imports) 96
South Africa 87
Nigeria 5
United States of America 2
European Union (28) 2
Zambia 1
Percentage change of GDP measured in constant 2010 prices 4.8 15.9 0.2
GDP per capita measured in constant 2010 US dollars 2,914 4,052 4,009
Population (thousands) 507 822 859
Human Development Index (value and rank) 0.5200 (106) 0.5820 (140) 0.5880 (141)
Total employment (as a share of the population) 42.4 39.5 39.9
Share of women in total employment 36.7 40.8 41.1
Proportion of population below international poverty line – SDG 1. Indicator 1.1.1 (2000) 48.4 (2009) 42.0
Gini index, latest available year (2000) 53.1 (2009) 51.5
Prevalence of undernourishment (per cent) – SDG 2. Indicator 2.1.1 19.2 20.7
Value added of agriculture/industry/services (as a share of GDP) 8/41/51 10/37/53 10/37/53
Employment in agriculture/industry/services (as a share of total employment) 70/15/14 68/13/19 69/12/18
Share of women in agriculture/industry/services 42/24/26 46/23/32 47/23/32
Institutional quality index, 2018 0.3128
Control of corruption 0.04 –0.40 –0.30
Rule of law –0.47 –0.35 –0.29
MERCHANDISE AND COMMODITY EXPORT DEPENDENCE
COMMODITY IMPORT DEPENDENCE
KEY SOCIOECONOMIC INDICATORS
OTHER STRUCTURAL INDICATORS](https://image.slidesharecdn.com/stateofcommoditydependance2019-190524115214/85/State-of-commodity-dependance-2019-94-320.jpg)
![Table of contents Introduction
Chapter 1
Key Findings
from the Report
Chapter 2
Country Statistical
Profiles
List of Country
Statistical Profiles
89
ETHIOPIA*
1995 2013-2017 2017
Merchandise export value (millions of US dollars) 422 3,134 3,161
Unallocated exports (as a share of merchandise exports) 0.3 1.5 –
Merchandise export concentration by product line (Herfindahl-Hirschmann index) 0.5646 0.3023 0.2940
Commodity export value (millions of US dollars) 359 2,692 2,697
Commodity exports (as a share of total merchandise exports) 85 86 85
Commodity exports (as a share of GDP) 4.7 4.4 3.7
Total natural resources rents (as a share of GDP) 31.6 12.8 12.0
Exports by commodity group (as a share of merchandise exports) 85 86 85
Agricultural commodities 83 73 72
Fuels 2 5 4
Ores, metals, precious stones and non-monetary gold – 8 10
Three leading commodity exports (as a share of total merchandise exports) 66 52 51
[071] Coffee and coffee substitutes 58 23 23
[054] Vegetables 3 16 16
[222] Oil seeds and oleaginous fruits (excluding flour) 4 13 12
Average price index of the leading commodity group exported 87.2 98.3 93.7
Five leading destination markets of commodity exports (as a share of total commodity exports) 59
European Union (28) 21
China 10
Sudan 10
Somalia 9
Switzerland 9
Commodity imports (millions of US dollars) 268 3,592 3,695
Commodity imports (as a share of total merchandise imports) 23 23 23
Food imports (millions of US dollars and as a share of total merchandise imports) 162 (14) 1,288 (8) 1,423 (9)
Fuel imports (millions of US dollars and as a share of total merchandise imports) 71 (6) 1,927 (12) 1,854 (12)
Five-leading trading partners for commodity imports (as a share of total commodity imports) 65
Kuwait 25
Saudi Arabia 20
European Union (28) 9
India 7
United Arab Emirates 5
Percentage change of GDP measured in constant 2010 prices 6.1 46.6 8.3
GDP per capita measured in constant 2010 US dollars 160 432 483
Population (thousands) 30,604 58,316 62,393
Human Development Index (value and rank) .. 0.4508 (172) 0.4630 (170)
Total employment (as a share of the population) 75.4 78.5 78.2
Share of women in total employment 42.5 46.0 46.2
Proportion of population below international poverty line – SDG 1. Indicator 1.1.1 (1995) 67.1 (2015) 26.7
Gini index, latest available year (1995) 44.6 (2015) 39.1
Prevalence of undernourishment (per cent) – SDG 2. Indicator 2.1.1 52.0 21.4
Value added of agriculture/industry/services (as a share of GDP) 55/10/35 40/16/43 37/21/42
Employment in agriculture/industry/services (as a share of total employment) 89/2/8 70/8/21 68/9/22
Share of women in agriculture/industry/services 41/52/51 40/47/64 40/45/65
Institutional quality index, 2018 0.2081
Control of corruption –0.93 –0.47 –0.56
Rule of law –0.97 –0.51 –0.45
OTHER STRUCTURAL INDICATORS
MERCHANDISE AND COMMODITY EXPORT DEPENDENCE
COMMODITY IMPORT DEPENDENCE
KEY SOCIOECONOMIC INDICATORS](https://image.slidesharecdn.com/stateofcommoditydependance2019-190524115214/85/State-of-commodity-dependance-2019-95-320.jpg)
![Table of contents Introduction
Chapter 1
Key Findings
from the Report
Chapter 2
Country Statistical
Profiles
List of Country
Statistical Profiles
90
FIJI
1995 2013-2017 2017
Merchandise export value (millions of US dollars) 619 1,052 956
Unallocated exports (as a share of merchandise exports) 0.4 1.1 0.8
Merchandise export concentration by product line (Herfindahl-Hirschmann index) 0.3765 0.2117 0.2056
Commodity export value (millions of US dollars) 412 810 733
Commodity exports (as a share of total merchandise exports) 67 77 77
Commodity exports (as a share of GDP) 20.7 17.8 14.5
Total natural resources rents (as a share of GDP) 1.8 1.8 1.6
Exports by commodity group (as a share of merchandise exports) 67 77 77
Agricultural commodities 59 53 54
Fuels 1 16 14
Ores, metals, precious stones and non-monetary gold 8 8 8
Three leading commodity exports (as a share of total merchandise exports) 9 42 42
[334] Petroleum oils or bituminous minerals 70 % oil – 16 14
[03] Fishery products 9 14 15
[111] Non-alcoholic beverages, n.e.s. – 12 14
Average price index of the leading commodity group exported 36.5 132.1 103.8
Five leading destination markets of commodity exports (as a share of total commodity exports) 63
United States of America 26
European Union (28) 13
Australia 11
Japan 6
China 6
Commodity imports (millions of US dollars) 257 1,040 937
Commodity imports (as a share of total merchandise imports) 29 40 39
Food imports (millions of US dollars and as a share of total merchandise imports) 116 (13) 431 (17) 416 (17)
Fuel imports (millions of US dollars and as a share of total merchandise imports) 118 (13) 545 (21) 453 (19)
Five-leading trading partners for commodity imports (as a share of total commodity imports) 84
Singapore 44
Australia 14
New Zealand 12
China 9
Republic of Korea 5
Percentage change of GDP measured in constant 2010 prices 2.5 14.8 3.9
GDP per capita measured in constant 2010 US dollars 3,124 4,142 4,327
Population (thousands) 492 637 648
Human Development Index (value and rank) 0.6730 (57) 0.7348 (91) 0.7410 (90)
Total employment (as a share of the population) 56.3 54.6 54.5
Share of women in total employment 32.1 33.7 33.7
Proportion of population below international poverty line – SDG 1. Indicator 1.1.1 (2002) 4.9 (2013) 1.4
Gini index, latest available year (2002) 38.1 (2013) 36.7
Prevalence of undernourishment (per cent) – SDG 2. Indicator 2.1.1 4.8 4.4
Value added of agriculture/industry/services (as a share of GDP) 16/18/66 12/18/70 14/18/69
Employment in agriculture/industry/services (as a share of total employment) 51/13/37 40/13/47 39/13/47
Share of women in agriculture/industry/services 32/23/35 33/22/38 33/22/38
Institutional quality index, 2018 0.4900
Control of corruption 0.66 0.14 0.36
Rule of law 0.32 –0.45 –0.25
OTHER STRUCTURAL INDICATORS
MERCHANDISE AND COMMODITY EXPORT DEPENDENCE
COMMODITY IMPORT DEPENDENCE
KEY SOCIOECONOMIC INDICATORS](https://image.slidesharecdn.com/stateofcommoditydependance2019-190524115214/85/State-of-commodity-dependance-2019-96-320.jpg)
![Table of contents Introduction
Chapter 1
Key Findings
from the Report
Chapter 2
Country Statistical
Profiles
List of Country
Statistical Profiles
91
FINLAND
1995 2013-2017 2017
Merchandise export value (millions of US dollars) 40,409 66,615 67,281
Unallocated exports (as a share of merchandise exports) 0.9 6.4 9.0
Merchandise export concentration by product line (Herfindahl-Hirschmann index) 0.2031 0.1419 0.1381
Commodity export value (millions of US dollars) 6,374 16,530 16,059
Commodity exports (as a share of total merchandise exports) 16 25 24
Commodity exports (as a share of GDP) 4.7 6.5 6.4
Total natural resources rents (as a share of GDP) 0.5 0.6 0.6
Exports by commodity group (as a share of merchandise exports) 16 25 24
Agricultural commodities 11 10 10
Fuels 2 9 8
Ores, metals, precious stones and non-monetary gold 3 6 6
Three leading commodity exports (as a share of total merchandise exports) 10 17 16
[334] Petroleum oils or bituminous minerals 70 % oil 2 9 7
[24 + 25] Forestry products 7 6 7
[682] Copper 1 2 2
Average price index of the leading commodity group exported 36.5 132.1 103.8
Five leading destination markets of commodity exports (as a share of total commodity exports) 84
European Union (28) 64
China 9
United States of America 5
Russian Federation 4
Japan 2
Commodity imports (millions of US dollars) 7,111 22,359 19,395
Commodity imports (as a share of total merchandise imports) 24 32 28
Food imports (millions of US dollars and as a share of total merchandise imports) 1,567 (5) 4,962 (7) 5,013 (7)
Fuel imports (millions of US dollars and as a share of total merchandise imports) 2,592 (9) 11,278 (16) 8,903 (13)
Five-leading trading partners for commodity imports (as a share of total commodity imports) 87
European Union (28) 43
Russian Federation 35
Norway 5
Brazil 3
United States of America 2
Percentage change of GDP measured in constant 2010 prices 4.2 0.9 2.7
GDP per capita measured in constant 2010 US dollars 31,927 45,728 46,823
Population (thousands) 4,146 4,583 4,617
Human Development Index (value and rank) 0.8160 (18) 0.9158 (14) 0.9200 (14)
Total employment (as a share of the population) 49.7 53.6 53.2
Share of women in total employment 47.9 48.4 48.2
Proportion of population below international poverty line – SDG 1. Indicator 1.1.1 (2003) – (2015) –
Gini index, latest available year (2003) 27.7 (2015) 27.1
Prevalence of undernourishment (per cent), 2015 (SDG 2. Indicator 2.1.1) 2.5 2.5
Value added of agriculture/industry/services (as a share of GDP) 4/34/62 3/27/70 3/27/70
Employment in agriculture/industry/services (as a share of total employment) 8/28/65 4/22/74 4/22/74
Share of women in agriculture/industry/services 33/26/59 26/19/58 26/19/58
Institutional quality index, 2018 0.9499
Control of corruption 2.21 2.22 2.22
Rule of law 1.91 2.03 2.03
MERCHANDISE AND COMMODITY EXPORT DEPENDENCE
COMMODITY IMPORT DEPENDENCE
KEY SOCIOECONOMIC INDICATORS
OTHER STRUCTURAL INDICATORS](https://image.slidesharecdn.com/stateofcommoditydependance2019-190524115214/85/State-of-commodity-dependance-2019-97-320.jpg)
![Table of contents Introduction
Chapter 1
Key Findings
from the Report
Chapter 2
Country Statistical
Profiles
List of Country
Statistical Profiles
92
FRANCE
1995 2013-2017 2017
Merchandise export value (millions of US dollars) 278,000 528,200 523,000
Unallocated exports (as a share of merchandise exports) 2.5 2.4 2.3
Merchandise export concentration by product line (Herfindahl-Hirschmann index) 0.0585 0.0944 0.0924
Commodity export value (millions of US dollars) 58,016 102,046 97,791
Commodity exports (as a share of total merchandise exports) 21 19 19
Commodity exports (as a share of GDP) 3.6 3.9 3.8
Total natural resources rents (as a share of GDP) 0.1 – –
Exports by commodity group (as a share of merchandise exports) 21 19 19
Agricultural commodities 16 14 13
Fuels 2 3 3
Ores, metals, precious stones and non-monetary gold 3 2 3
Three leading commodity exports (as a share of total merchandise exports) 4 6 5
[112] Alcoholic beverages 3 3 3
[334] Petroleum oils or bituminous minerals 70 % oil 1 2 2
[041] Wheat (including spelt) and meslin, unmilled 1 1 1
Average price index of the leading commodity group exported 80.7 109.2 102.2
Five leading destination markets of commodity exports (as a share of total commodity exports) 80
European Union (28) 66
United States of America 6
Switzerland 4
China 3
Algeria 2
Commodity imports (millions of US dollars) 66,079 156,316 142,641
Commodity imports (as a share of total merchandise imports) 24 25 23
Food imports (millions of US dollars and as a share of total merchandise imports) 26,155 (9) 51,894 (8) 53,438 (9)
Fuel imports (millions of US dollars and as a share of total merchandise imports) 18,931 (7) 74,611 (12) 59,714 (10)
Five-leading trading partners for commodity imports (as a share of total commodity imports) 69
European Union (28) 52
Russian Federation 6
United States of America 4
Saudi Arabia 4
Kazakhstan 3
Percentage change of GDP measured in constant 2010 prices 2.1 4.2 2.2
GDP per capita measured in constant 2010 US dollars 33,962 41,874 42,813
Population (thousands) 48,059 54,207 54,770
Human Development Index (value and rank) 0.8250 (15) 0.8962 (22) 0.9010 (22)
Total employment (as a share of the population) 48.7 50.1 50.0
Share of women in total employment 43.4 47.0 47.1
Proportion of population below international poverty line – SDG 1. Indicator 1.1.1 (2003) – (2015) –
Gini index, latest available year (2003) 31.4 (2015) 32.7
Prevalence of undernourishment (per cent), 2015 (SDG 2. Indicator 2.1.1) 2.5 2.5
Value added of agriculture/industry/services (as a share of GDP) 3/24/73 2/20/79 2/20/79
Employment in agriculture/industry/services (as a share of total employment) 5/27/68 3/21/77 3/20/77
Share of women in agriculture/industry/services 33/24/52 27/22/55 26/21/55
Institutional quality index, 2018 0.7987
Control of corruption 1.25 1.32 1.26
Rule of law 1.48 1.43 1.44
KEY SOCIOECONOMIC INDICATORS
OTHER STRUCTURAL INDICATORS
MERCHANDISE AND COMMODITY EXPORT DEPENDENCE
COMMODITY IMPORT DEPENDENCE](https://image.slidesharecdn.com/stateofcommoditydependance2019-190524115214/85/State-of-commodity-dependance-2019-98-320.jpg)
![Table of contents Introduction
Chapter 1
Key Findings
from the Report
Chapter 2
Country Statistical
Profiles
List of Country
Statistical Profiles
93
GABON
1995 2013-2017 2017
Merchandise export value (millions of US dollars) 2,718 6,895 5,477
Unallocated exports (as a share of merchandise exports) – – –
Merchandise export concentration by product line (Herfindahl-Hirschmann index) 0.8069 0.6889 0.6539
Commodity export value (millions of US dollars) 2,665 6,342 5,006
Commodity exports (as a share of total merchandise exports) 98 92 91
Commodity exports (as a share of GDP) 48.3 41.2 33.3
Total natural resources rents (as a share of GDP) 33.2 21.9 13.5
Exports by commodity group (as a share of merchandise exports) 98 92 91
Agricultural commodities 13 11 13
Fuels 83 74 70
Ores, metals, precious stones and non-monetary gold 2 6 9
Three leading commodity exports (as a share of total merchandise exports) 96 86 85
[333] Petroleum oils, oils from bitumin. materials, crude 81 71 67
[24 + 25] Forestry products 13 9 10
[287] Ores and concentrates of base metals, n.e.s. 2 6 9
Average price index of the leading commodity group exported 36.5 132.1 103.8
Five leading destination markets of commodity exports (as a share of total commodity exports) 86
United States of America 38
European Union (28) 21
China 12
Republic of Korea 9
Japan 6
Commodity imports (millions of US dollars) 216 857 698
Commodity imports (as a share of total merchandise imports) 24 25 25
Food imports (millions of US dollars and as a share of total merchandise imports) 147 (17) 506 (15) 431 (15)
Fuel imports (millions of US dollars and as a share of total merchandise imports) 30 (3) 211 (6) 137 (5)
Five-leading trading partners for commodity imports (as a share of total commodity imports) 74
European Union (28) 51
Côte d'Ivoire 9
India 6
Brazil 4
Thailand 4
Percentage change of GDP measured in constant 2010 prices 5.0 20.9 0.9
GDP per capita measured in constant 2010 US dollars 10,743 8,611 8,614
Population (thousands) 633 1,233 1,298
Human Development Index (value and rank) 0.6320 (75) 0.6948 (110) 0.7020 (108)
Total employment (as a share of the population) 38.5 40.7 41.3
Share of women in total employment 40.2 35.6 35.8
Proportion of population below international poverty line – SDG 1. Indicator 1.1.1 (2005) 8.0 (2017) 3.4
Gini index, latest available year (2005) 42.2 (2017) 38.0
Prevalence of undernourishment (per cent) – SDG 2. Indicator 2.1.1 10.5 9.4
Value added of agriculture/industry/services (as a share of GDP) 7/55/38 4/51/45 4/51/45
Employment in agriculture/industry/services (as a share of total employment) 43/10/46 42/13/46 42/13/46
Share of women in agriculture/industry/services 58/8/30 52/9/28 53/10/28
Institutional quality index, 2018 0.2532
Control of corruption –1.10 –0.73 –0.81
Rule of law –0.65 –0.58 –0.68
OTHER STRUCTURAL INDICATORS
MERCHANDISE AND COMMODITY EXPORT DEPENDENCE
COMMODITY IMPORT DEPENDENCE
KEY SOCIOECONOMIC INDICATORS](https://image.slidesharecdn.com/stateofcommoditydependance2019-190524115214/85/State-of-commodity-dependance-2019-99-320.jpg)
![Table of contents Introduction
Chapter 1
Key Findings
from the Report
Chapter 2
Country Statistical
Profiles
List of Country
Statistical Profiles
94
GAMBIA*
1995 2013-2017 2017
Merchandise export value (millions of US dollars) 16 96 68
Unallocated exports (as a share of merchandise exports) 0.4 0.9 0.6
Merchandise export concentration by product line (Herfindahl-Hirschmann index) 0.3535 0.3690 0.4126
Commodity export value (millions of US dollars) 14 79 60
Commodity exports (as a share of total merchandise exports) 85 82 88
Commodity exports (as a share of GDP) 1.8 8.4 5.8
Total natural resources rents (as a share of GDP) 3.0 8.9 9.1
Exports by commodity group (as a share of merchandise exports) 85 82 88
Agricultural commodities 79 72 80
Fuels 1 2 3
Ores, metals, precious stones and non-monetary gold 5 7 6
Three leading commodity exports (as a share of total merchandise exports) 57 57 68
[24 + 25] Forestry products – 32 39
[057] Fruits and nuts (excluding oil nuts), fresh or dried 4 22 24
[03] Fishery products 53 4 5
Average price index of the leading commodity group exported 99.7 110.0 105.1
Five leading destination markets of commodity exports (as a share of total commodity exports) 89
China 40
India 20
European Union (28) 11
Guinea-Bissau 9
Viet Nam 9
Commodity imports (millions of US dollars) 77 188 216
Commodity imports (as a share of total merchandise imports) 42 47 46
Food imports (millions of US dollars and as a share of total merchandise imports) 52 (28) 143 (36) 165 (35)
Fuel imports (millions of US dollars and as a share of total merchandise imports) 16 (9) 32 (8) 36 (8)
Five-leading trading partners for commodity imports (as a share of total commodity imports) 62
Brazil 19
European Union (28) 17
Côte d'Ivoire 13
Malaysia 7
Indonesia 6
Percentage change of GDP measured in constant 2010 prices 0.9 12.0 3.0
GDP per capita measured in constant 2010 US dollars 491 536 533
Population (thousands) 570 1,075 1,148
Human Development Index (value and rank) 0.3530 (136) 0.4562 (171) 0.4600 (171)
Total employment (as a share of the population) 52.3 53.7 53.7
Share of women in total employment 37.9 42.6 42.7
Proportion of population below international poverty line – SDG 1. Indicator 1.1.1 (1998) 70.5 (2015) 10.1
Gini index, latest available year (1998) 48.5 (2015) 35.9
Prevalence of undernourishment (per cent) – SDG 2. Indicator 2.1.1 13.1 9.6
Value added of agriculture/industry/services (as a share of GDP) 22/15/68 21/15/64 21/14/66
Employment in agriculture/industry/services (as a share of total employment) 35/15/50 28/15/56 27/15/58
Share of women in agriculture/industry/services 49/9/39 53/11/46 53/11/46
Institutional quality index, 2018 0.2433
Control of corruption –0.37 –0.73 –0.66
Rule of law 0.02 –0.66 –0.45
OTHER STRUCTURAL INDICATORS
MERCHANDISE AND COMMODITY EXPORT DEPENDENCE
COMMODITY IMPORT DEPENDENCE
KEY SOCIOECONOMIC INDICATORS](https://image.slidesharecdn.com/stateofcommoditydependance2019-190524115214/85/State-of-commodity-dependance-2019-100-320.jpg)
![Table of contents Introduction
Chapter 1
Key Findings
from the Report
Chapter 2
Country Statistical
Profiles
List of Country
Statistical Profiles
95
GEORGIA
1995 2013-2017 2017
Merchandise export value (millions of US dollars) 158 2,564 2,728
Unallocated exports (as a share of merchandise exports) – 0.4 0.3
Merchandise export concentration by product line (Herfindahl-Hirschmann index) 0.1564 0.2106 0.2053
Commodity export value (millions of US dollars) 94 1,254 1,460
Commodity exports (as a share of total merchandise exports) 59 49 54
Commodity exports (as a share of GDP) 3.5 8.2 9.6
Total natural resources rents (as a share of GDP) 0.4 1.0 0.9
Exports by commodity group (as a share of merchandise exports) 59 49 54
Agricultural commodities 33 29 29
Fuels 19 4 4
Ores, metals, precious stones and non-monetary gold 8 16 20
Three leading commodity exports (as a share of total merchandise exports) 15 27 30
[283] Copper ores and concentrates; copper mattes, cemen 7 11 15
[112] Alcoholic beverages 3 9 11
[057] Fruits and nuts (excluding oil nuts), fresh or dried 5 7 4
Average price index of the leading commodity group exported 58.3 123.5 127.5
Five leading destination markets of commodity exports (as a share of total commodity exports) 71
European Union (28) 36
Russian Federation 13
China 10
Ukraine 6
Azerbaijan 6
Commodity imports (millions of US dollars) 311 2,796 2,848
Commodity imports (as a share of total merchandise imports) 76 35 36
Food imports (millions of US dollars and as a share of total merchandise imports) 121 (29) 969 (12) 953 (12)
Fuel imports (millions of US dollars and as a share of total merchandise imports) 160 (39) 1,265 (16) 1,223 (15)
Five-leading trading partners for commodity imports (as a share of total commodity imports) 74
European Union (28) 26
Russian Federation 16
Azerbaijan 14
Ukraine 11
Turkey 7
Percentage change of GDP measured in constant 2010 prices 2.6 19.2 5.0
GDP per capita measured in constant 2010 US dollars 949 3,732 4,073
Population (thousands) 3,791 3,223 3,162
Human Development Index (value and rank) .. 0.7698 (72) 0.7800 (68)
Total employment (as a share of the population) 59.4 59.0 59.8
Share of women in total employment 47.7 47.0 47.0
Proportion of population below international poverty line – SDG 1. Indicator 1.1.1 (1996) 6.0 (2016) 4.2
Gini index, latest available year (1996) 37.1 (2016) 36.5
Prevalence of undernourishment (per cent) – SDG 2. Indicator 2.1.1 13.5 7.4
Value added of agriculture/industry/services (as a share of GDP) 44/14/41 9/24/67 9/25/66
Employment in agriculture/industry/services (as a share of total employment) 56/10/34 42/12/46 41/12/47
Share of women in agriculture/industry/services 49/27/51 48/16/54 48/15/55
Institutional quality index, 2018 0.7219
Control of corruption –1.53 0.67 0.74
Rule of law –1.26 0.23 0.33
MERCHANDISE AND COMMODITY EXPORT DEPENDENCE
COMMODITY IMPORT DEPENDENCE
KEY SOCIOECONOMIC INDICATORS
OTHER STRUCTURAL INDICATORS](https://image.slidesharecdn.com/stateofcommoditydependance2019-190524115214/85/State-of-commodity-dependance-2019-101-320.jpg)
![Table of contents Introduction
Chapter 1
Key Findings
from the Report
Chapter 2
Country Statistical
Profiles
List of Country
Statistical Profiles
96
GERMANY
1995 2013-2017 2017
Merchandise export value (millions of US dollars) 524,000 1,414,000 1,450,000
Unallocated exports (as a share of merchandise exports) 6.6 4.9 4.8
Merchandise export concentration by product line (Herfindahl-Hirschmann index) 0.0820 0.1002 0.1004
Commodity export value (millions of US dollars) 52,176 160,869 157,614
Commodity exports (as a share of total merchandise exports) 10 11 11
Commodity exports (as a share of GDP) 2.0 4.4 4.3
Total natural resources rents (as a share of GDP) 0.1 0.1 0.1
Exports by commodity group (as a share of merchandise exports) 10 11 11
Agricultural commodities 6 6 6
Fuels 1 2 2
Ores, metals, precious stones and non-monetary gold 3 3 3
Three leading commodity exports (as a share of total merchandise exports) 2 2 2
[334] Petroleum oils or bituminous minerals 70 % oil 1 1 1
[684] Aluminium 1 1 1
[682] Copper 1 1 1
Average price index of the leading commodity group exported 36.5 132.1 103.8
Five leading destination markets of commodity exports (as a share of total commodity exports) 87
European Union (28) 73
Switzerland 7
United States of America 3
China 3
Saudi Arabia 1
Commodity imports (millions of US dollars) 106,801 275,374 255,571
Commodity imports (as a share of total merchandise imports) 23 24 22
Food imports (millions of US dollars and as a share of total merchandise imports) 40,981 (9) 80,743 (7) 82,539 (7)
Fuel imports (millions of US dollars and as a share of total merchandise imports) 28,754 (6) 116,413 (10) 94,002 (8)
Five-leading trading partners for commodity imports (as a share of total commodity imports) 75
European Union (28) 55
Russian Federation 11
United States of America 3
Norway 3
Switzerland 3
Percentage change of GDP measured in constant 2010 prices 1.7 7.0 2.5
GDP per capita measured in constant 2010 US dollars 34,970 45,506 47,205
Population (thousands) 68,013 70,964 71,378
Human Development Index (value and rank) 0.8340 (12) 0.9322 (4) 0.9360 (5)
Total employment (as a share of the population) 53.4 57.7 58.2
Share of women in total employment 42.1 46.5 46.7
Proportion of population below international poverty line – SDG 1. Indicator 1.1.1 (2000) – (2015) –
Gini index, latest available year (2000) 28.8 (2015) 31.7
Prevalence of undernourishment (per cent) – SDG 2. Indicator 2.1.1 2.5 2.5
Value added of agriculture/industry/services (as a share of GDP) 1/39/60 1/36/63 1/36/63
Employment in agriculture/industry/services (as a share of total employment) 3/36/61 1/28/71 1/27/71
Share of women in agriculture/industry/services 40/24/53 32/23/56 32/23/56
Institutional quality index, 2018 0.9115
Control of corruption 1.91 1.83 1.84
Rule of law 1.61 1.71 1.61
MERCHANDISE AND COMMODITY EXPORT DEPENDENCE
COMMODITY IMPORT DEPENDENCE
KEY SOCIOECONOMIC INDICATORS
OTHER STRUCTURAL INDICATORS](https://image.slidesharecdn.com/stateofcommoditydependance2019-190524115214/85/State-of-commodity-dependance-2019-102-320.jpg)
![Table of contents Introduction
Chapter 1
Key Findings
from the Report
Chapter 2
Country Statistical
Profiles
List of Country
Statistical Profiles
97
GHANA
1995 2013-2017 2017
Merchandise export value (millions of US dollars) 1,754 11,967 14,359
Unallocated exports (as a share of merchandise exports) 0.2 0.9 0.2
Merchandise export concentration by product line (Herfindahl-Hirschmann index) 0.3609 0.4301 0.4602
Commodity export value (millions of US dollars) 1,596 11,058 13,556
Commodity exports (as a share of total merchandise exports) 91 92 94
Commodity exports (as a share of GDP) 15.4 25.9 29.2
Total natural resources rents (as a share of GDP) 12.4 17.5 16.4
Exports by commodity group (as a share of merchandise exports) 91 92 94
Agricultural commodities 55 31 28
Fuels 4 22 24
Ores, metals, precious stones and non-monetary gold 31 40 43
Three leading commodity exports (as a share of total merchandise exports) 45 75 80
[971] Gold, non-monetary (excluding gold ores and concentrates) 11 36 40
[333] Petroleum oils, oils from bitumin. materials, crude – 20 23
[072] Cocoa 34 19 18
Average price index of the leading commodity group exported 33.4 110.1 107.6
Five leading destination markets of commodity exports (as a share of total commodity exports) 75
European Union (28) 25
India 14
Switzerland 14
United Arab Emirates 12
China 10
Commodity imports (millions of US dollars) 329 3,845 3,281
Commodity imports (as a share of total merchandise imports) 17 27 26
Food imports (millions of US dollars and as a share of total merchandise imports) 148 (8) 2,122 (15) 2,141 (17)
Fuel imports (millions of US dollars and as a share of total merchandise imports) 110 (6) 1,240 (9) 716 (6)
Five-leading trading partners for commodity imports (as a share of total commodity imports) 60
European Union (28) 30
Nigeria 15
China 6
Viet Nam 5
United States of America 5
Percentage change of GDP measured in constant 2010 prices 4.0 28.6 7.0
GDP per capita measured in constant 2010 US dollars 890 1,693 1,784
Population (thousands) 9,602 16,879 17,726
Human Development Index (value and rank) 0.4730 (111) 0.5836 (138) 0.5920 (137)
Total employment (as a share of the population) 70.2 75.1 75.1
Share of women in total employment 47.8 49.5 49.4
Proportion of population below international poverty line – SDG 1. Indicator 1.1.1 (1998) 35.7 (2012) 12.1
Gini index, latest available year (1998) 40.1 (2012) 42.4
Prevalence of undernourishment (per cent) – SDG 2. Indicator 2.1.1 15.6 6.1
Value added of agriculture/industry/services (as a share of GDP) 34/21/45 21/26/53 19/24/57
Employment in agriculture/industry/services (as a share of total employment) 54/16/30 43/14/43 41/14/45
Share of women in agriculture/industry/services 45/48/52 45/37/58 45/37/58
Institutional quality index, 2018 0.4644
Control of corruption –0.34 –0.17 –0.23
Rule of law –0.23 0.10 0.13
OTHER STRUCTURAL INDICATORS
MERCHANDISE AND COMMODITY EXPORT DEPENDENCE
COMMODITY IMPORT DEPENDENCE
KEY SOCIOECONOMIC INDICATORS](https://image.slidesharecdn.com/stateofcommoditydependance2019-190524115214/85/State-of-commodity-dependance-2019-103-320.jpg)
![Table of contents Introduction
Chapter 1
Key Findings
from the Report
Chapter 2
Country Statistical
Profiles
List of Country
Statistical Profiles
98
GREECE
1995 2013-2017 2017
Merchandise export value (millions of US dollars) 10,955 32,054 32,155
Unallocated exports (as a share of merchandise exports) 2.4 2.0 1.8
Merchandise export concentration by product line (Herfindahl-Hirschmann index) 0.1045 0.2880 0.2690
Commodity export value (millions of US dollars) 5,302 20,434 20,149
Commodity exports (as a share of total merchandise exports) 48 64 63
Commodity exports (as a share of GDP) 3.9 9.6 10.1
Total natural resources rents (as a share of GDP) 0.1 0.1 0.1
Exports by commodity group (as a share of merchandise exports) 48 64 63
Agricultural commodities 34 21 22
Fuels 7 34 32
Ores, metals, precious stones and non-monetary gold 8 8 9
Three leading commodity exports (as a share of total merchandise exports) 14 40 38
[334] Petroleum oils or bituminous minerals 70 % oil 6 32 30
[684] Aluminium 4 5 5
[057] Fruits and nuts (excluding oil nuts), fresh or dried 4 3 3
Average price index of the leading commodity group exported 36.5 132.1 103.8
Five leading destination markets of commodity exports (as a share of total commodity exports) 69
European Union (28) 45
Turkey 12
Lebanon 5
Egypt 4
Gibraltar 4
Commodity imports (millions of US dollars) 7,483 26,168 24,107
Commodity imports (as a share of total merchandise imports) 29 48 44
Food imports (millions of US dollars and as a share of total merchandise imports) 3,609 (14) 6,761 (12) 6,771 (12)
Fuel imports (millions of US dollars and as a share of total merchandise imports) 1,876 (7) 16,277 (30) 13,828 (25)
Five-leading trading partners for commodity imports (as a share of total commodity imports) 77
European Union (28) 31
Russian Federation 20
Iraq 15
Kazakhstan 7
Saudi Arabia 4
Percentage change of GDP measured in constant 2010 prices 2.1 –11.4 1.3
GDP per capita measured in constant 2010 US dollars 19,490 21,854 22,192
Population (thousands) 8,936 9,601 9,573
Human Development Index (value and rank) 0.7680 (30) 0.8648 (29) 0.8700 (29)
Total employment (as a share of the population) 47.0 39.9 41.5
Share of women in total employment 34.3 41.2 41.4
Proportion of population below international poverty line – SDG 1. Indicator 1.1.1 (2003) 0.5 (2015) 1.5
Gini index, latest available year (2003) 32.8 (2015) 36.0
Prevalence of undernourishment (per cent) – SDG 2. Indicator 2.1.1 2.5 2.5
Value added of agriculture/industry/services (as a share of GDP) 8/22/70 4/16/80 4/16/80
Employment in agriculture/industry/services (as a share of total employment) 20/23/56 13/15/72 12/15/73
Share of women in agriculture/industry/services 40/20/38 39/21/46 39/22/46
Institutional quality index, 2018 0.5257
Control of corruption 0.34 –0.09 –0.14
Rule of law 1.05 0.26 0.08
OTHER STRUCTURAL INDICATORS
KEY SOCIOECONOMIC INDICATORS
MERCHANDISE AND COMMODITY EXPORT DEPENDENCE
COMMODITY IMPORT DEPENDENCE](https://image.slidesharecdn.com/stateofcommoditydependance2019-190524115214/85/State-of-commodity-dependance-2019-104-320.jpg)
![Table of contents Introduction
Chapter 1
Key Findings
from the Report
Chapter 2
Country Statistical
Profiles
List of Country
Statistical Profiles
99
GRENADA
1995 2013-2017 2017
Merchandise export value (millions of US dollars) 22 32 25
Unallocated exports (as a share of merchandise exports) 2.1 – –
Merchandise export concentration by product line (Herfindahl-Hirschmann index) 0.2413 0.2352 0.2184
Commodity export value (millions of US dollars) 16 19 14
Commodity exports (as a share of total merchandise exports) 72 59 57
Commodity exports (as a share of GDP) 1.3 0.8 0.6
Total natural resources rents (as a share of GDP) – – –
Exports by commodity group (as a share of merchandise exports) 72 59 58
Agricultural commodities 71 59 57
Fuels 1 – –
Ores, metals, precious stones and non-monetary gold – – 1
Three leading commodity exports (as a share of total merchandise exports) 37 42 39
[075] Spices 19 19 16
[046] Meal and flour of wheat and flour of meslin 5 15 13
[03] Fishery products 13 8 9
Average price index of the leading commodity group exported 80.8 109.0 102.7
Five leading destination markets of commodity exports (as a share of total commodity exports) 76
Egypt 24
United States of America 19
Dominica 14
Saint Lucia 10
Saint Kitts and Nevis 9
Commodity imports (millions of US dollars) 49 143 158
Commodity imports (as a share of total merchandise imports) 38 39 38
Food imports (millions of US dollars and as a share of total merchandise imports) 33 (25) 72 (20) 82 (19)
Fuel imports (millions of US dollars and as a share of total merchandise imports) 10 (8) 50 (14) 53 (13)
Five-leading trading partners for commodity imports (as a share of total commodity imports) 78
Trinidad and Tobago 35
United States of America 23
Venezuela (Bolivarian Rep. of) 8
European Union (28) 6
Brazil 5
Percentage change of GDP measured in constant 2010 prices 2.1 13.0 2.8
GDP per capita measured in constant 2010 US dollars 4,691 8,191 8,705
Population (thousands) .. .. ..
Human Development Index (value and rank) .. 0.7648 (75) 0.7720 (73)
Total employment (as a share of the population) .. .. ..
Share of women in total employment .. .. ..
Proportion of population below international poverty line – SDG 1. Indicator 1.1.1 .. ..
Gini index, latest available year .. ..
Prevalence of undernourishment (per cent) – SDG 2. Indicator 2.1.1 .. ..
Value added of agriculture/industry/services (as a share of GDP) 10/19/72 7/15/78 7/15/78
Employment in agriculture/industry/services (as a share of total employment) .. .. ..
Share of women in agriculture/industry/services .. .. ..
Institutional quality index, 2018 ..
Control of corruption 0.87 0.45 0.48
Rule of law 0.43 0.22 0.44
OTHER STRUCTURAL INDICATORS
KEY SOCIOECONOMIC INDICATORS
MERCHANDISE AND COMMODITY EXPORT DEPENDENCE
COMMODITY IMPORT DEPENDENCE](https://image.slidesharecdn.com/stateofcommoditydependance2019-190524115214/85/State-of-commodity-dependance-2019-105-320.jpg)
![Table of contents Introduction
Chapter 1
Key Findings
from the Report
Chapter 2
Country Statistical
Profiles
List of Country
Statistical Profiles
100
GUATEMALA
1995 2013-2017 2017
Merchandise export value (millions of US dollars) 1,936 10,672 11,137
Unallocated exports (as a share of merchandise exports) 0.8 0.6 –
Merchandise export concentration by product line (Herfindahl-Hirschmann index) 0.2521 0.1400 0.1363
Commodity export value (millions of US dollars) 1,230 6,461 6,658
Commodity exports (as a share of total merchandise exports) 64 61 60
Commodity exports (as a share of GDP) 9.4 10.0 8.7
Total natural resources rents (as a share of GDP) 1.6 2.4 2.1
Exports by commodity group (as a share of merchandise exports) 63 61 60
Agricultural commodities 61 50 50
Fuels 2 4 3
Ores, metals, precious stones and non-monetary gold – 7 6
Three leading commodity exports (as a share of total merchandise exports) 44 27 26
[057] Fruits and nuts (excluding oil nuts), fresh or dried 8 12 12
[061] Sugar, molasses and honey 11 9 8
[071] Coffee and coffee substitutes 25 7 5
Average price index of the leading commodity group exported 80.8 109.0 102.7
Five leading destination markets of commodity exports (as a share of total commodity exports) 66
United States of America 37
European Union (28) 11
El Salvador 8
Honduras 5
Canada 5
Commodity imports (millions of US dollars) 889 5,828 5,952
Commodity imports (as a share of total merchandise imports) 27 33 32
Food imports (millions of US dollars and as a share of total merchandise imports) 371 (11) 2,334 (13) 2,493 (14)
Fuel imports (millions of US dollars and as a share of total merchandise imports) 410 (12) 2,901 (16) 2,786 (15)
Five-leading trading partners for commodity imports (as a share of total commodity imports) 79
United States of America 59
Mexico 7
El Salvador 5
Colombia 4
Costa Rica 4
Percentage change of GDP measured in constant 2010 prices 5.0 15.4 2.8
GDP per capita measured in constant 2010 US dollars 2,356 3,050 3,125
Population (thousands) 5,726 10,365 10,985
Human Development Index (value and rank) 0.5070 (107) 0.6406 (125) 0.6500 (124)
Total employment (as a share of the population) 60.5 60.0 60.3
Share of women in total employment 32.8 33.6 33.5
Proportion of population below international poverty line – SDG 1. Indicator 1.1.1 (1998) 13.4 (2014) 8.7
Gini index, latest available year (1998) .. (2014) 48.3
Prevalence of undernourishment (per cent) – SDG 2. Indicator 2.1.1 20.5 15.8
Value added of agriculture/industry/services (as a share of GDP) 25/21/54 11/28/62 11/27/63
Employment in agriculture/industry/services (as a share of total employment) 23/29/48 31/20/50 29/21/50
Share of women in agriculture/industry/services 8/31/46 11/29/49 11/30/49
Institutional quality index, 2018 0.4379
Control of corruption –0.86 –0.71 –0.74
Rule of law –1.13 –1.01 –1.06
MERCHANDISE AND COMMODITY EXPORT DEPENDENCE
COMMODITY IMPORT DEPENDENCE
KEY SOCIOECONOMIC INDICATORS
OTHER STRUCTURAL INDICATORS](https://image.slidesharecdn.com/stateofcommoditydependance2019-190524115214/85/State-of-commodity-dependance-2019-106-320.jpg)
![Table of contents Introduction
Chapter 1
Key Findings
from the Report
Chapter 2
Country Statistical
Profiles
List of Country
Statistical Profiles
101
GUINEA*
1995 2013-2017 2017
Merchandise export value (millions of US dollars) 702 2,503 4,594
Unallocated exports (as a share of merchandise exports) 0.1 0.2 –
Merchandise export concentration by product line (Herfindahl-Hirschmann index) 0.7007 0.4549 0.4415
Commodity export value (millions of US dollars) 637 2,248 3,951
Commodity exports (as a share of total merchandise exports) 91 90 86
Commodity exports (as a share of GDP) 12.1 25.5 40.7
Total natural resources rents (as a share of GDP) 15.1 18.3 21.8
Exports by commodity group (as a share of merchandise exports) 91 90 86
Agricultural commodities 16 9 9
Fuels 1 11 6
Ores, metals, precious stones and non-monetary gold 74 70 72
Three leading commodity exports (as a share of total merchandise exports) 74 73 66
[971] Gold, non-monetary (excluding gold ores and concentrates) 2 34 37
[285] Aluminium ores and concentrates (incl. alumina) 71 31 28
[333] Petroleum oils, oils from bitumin. materials, crude 1 8 1
Average price index of the leading commodity group exported 33.4 110.1 107.6
Five leading destination markets of commodity exports (as a share of total commodity exports) 73
European Union (28) 21
United Arab Emirates 17
China 16
India 12
Ghana 6
Commodity imports (millions of US dollars) 377 1,169 1,341
Commodity imports (as a share of total merchandise imports) 46 41 39
Food imports (millions of US dollars and as a share of total merchandise imports) 198 (24) 523 (18) 627 (18)
Fuel imports (millions of US dollars and as a share of total merchandise imports) 120 (15) 516 (18) 552 (16)
Five-leading trading partners for commodity imports (as a share of total commodity imports) 76
European Union (28) 53
India 11
United Arab Emirates 5
Morocco 4
Brazil 3
Percentage change of GDP measured in constant 2010 prices 4.7 20.9 6.6
GDP per capita measured in constant 2010 US dollars 524 724 772
Population (thousands) 4,393 6,945 7,343
Human Development Index (value and rank) 0.2950 (141) 0.4452 (174) 0.4590 (172)
Total employment (as a share of the population) 62.6 61.4 61.3
Share of women in total employment 49.1 49.5 49.6
Proportion of population below international poverty line – SDG 1. Indicator 1.1.1 (2002) 62.2 (2012) 35.2
Gini index, latest available year (2002) 43.0 (2012) 33.7
Prevalence of undernourishment (per cent) – SDG 2. Indicator 2.1.1 26.3 19.7
Value added of agriculture/industry/services (as a share of GDP) 26/27/47 20/32/48 20/37/43
Employment in agriculture/industry/services (as a share of total employment) 71/5/23 68/6/26 68/6/26
Share of women in agriculture/industry/services 52/16/49 52/16/50 52/16/50
Institutional quality index, 2018 0.1874
Control of corruption –0.94 –1.00 –1.01
Rule of law –1.45 –1.27 –1.23
MERCHANDISE AND COMMODITY EXPORT DEPENDENCE
COMMODITY IMPORT DEPENDENCE
KEY SOCIOECONOMIC INDICATORS
OTHER STRUCTURAL INDICATORS](https://image.slidesharecdn.com/stateofcommoditydependance2019-190524115214/85/State-of-commodity-dependance-2019-107-320.jpg)
![Table of contents Introduction
Chapter 1
Key Findings
from the Report
Chapter 2
Country Statistical
Profiles
List of Country
Statistical Profiles
102
GUINEA-BISSAU*
1995 2013-2017 2017
Merchandise export value (millions of US dollars) 24 238 341
Unallocated exports (as a share of merchandise exports) .. – –
Merchandise export concentration by product line (Herfindahl-Hirschmann index) 0.5000 0.8745 0.8752
Commodity export value (millions of US dollars) 23 234 335
Commodity exports (as a share of total merchandise exports) 98 98 98
Commodity exports (as a share of GDP) 2.9 21.2 25.7
Total natural resources rents (as a share of GDP) 26.1 18.3 19.3
Exports by commodity group (as a share of merchandise exports) 98 98 98
Agricultural commodities 90 94 94
Fuels 7 4 4
Ores, metals, precious stones and non-monetary gold – – –
Three leading commodity exports (as a share of total merchandise exports) 39 96 96
[057] Fruits and nuts (excluding oil nuts), fresh or dried 32 88 88
[333] Petroleum oils, oils from bitumin. materials, crude 7 4 4
[03] Fishery products – 4 4
Average price index of the leading commodity group exported 80.8 109.0 102.7
Five leading destination markets of commodity exports (as a share of total commodity exports) 99
India 83
Singapore 7
United States of America 4
Ghana 3
European Union (28) 1
Commodity imports (millions of US dollars) 36 126 196
Commodity imports (as a share of total merchandise imports) 27 58 59
Food imports (millions of US dollars and as a share of total merchandise imports) 18 (13) 65 (30) 108 (33)
Fuel imports (millions of US dollars and as a share of total merchandise imports) 10 (8) 29 (13) 33 (10)
Five-leading trading partners for commodity imports (as a share of total commodity imports) 85
European Union (28) 52
Senegal 16
Pakistan 7
Gambia 6
China 3
Percentage change of GDP measured in constant 2010 prices 4.0 12.6 5.9
GDP per capita measured in constant 2010 US dollars 566 561 587
Population (thousands) 617 1,032 1,089
Human Development Index (value and rank) .. 0.4484 (173) 0.4550 (174)
Total employment (as a share of the population) 68.4 67.1 67.2
Share of women in total employment 46.0 46.8 46.9
Proportion of population below international poverty line – SDG 1. Indicator 1.1.1 (2002) 53.9 (2010) 67.1
Gini index, latest available year (2002) 35.6 (2010) 50.7
Prevalence of undernourishment (per cent) – SDG 2. Indicator 2.1.1 25.7 26.0
Value added of agriculture/industry/services (as a share of GDP) 55/12/33 44/15/41 44/15/41
Employment in agriculture/industry/services (as a share of total employment) 85/7/8 84/7/9 83/7/10
Share of women in agriculture/industry/services 49/29/26 50/31/29 50/30/29
Institutional quality index, 2018 0.1858
Control of corruption –1.19 –1.49 –1.56
Rule of law –1.67 –1.42 –1.44
MERCHANDISE AND COMMODITY EXPORT DEPENDENCE
COMMODITY IMPORT DEPENDENCE
KEY SOCIOECONOMIC INDICATORS
OTHER STRUCTURAL INDICATORS](https://image.slidesharecdn.com/stateofcommoditydependance2019-190524115214/85/State-of-commodity-dependance-2019-108-320.jpg)
![Table of contents Introduction
Chapter 1
Key Findings
from the Report
Chapter 2
Country Statistical
Profiles
List of Country
Statistical Profiles
103
GUYANA
1995 2013-2017 2017
Merchandise export value (millions of US dollars) 455 1,318 1,436
Unallocated exports (as a share of merchandise exports) – 0.6 0.6
Merchandise export concentration by product line (Herfindahl-Hirschmann index) 0.3710 0.4489 0.4311
Commodity export value (millions of US dollars) 406 1,195 1,218
Commodity exports (as a share of total merchandise exports) 89 91 85
Commodity exports (as a share of GDP) 40.9 36.6 33.4
Total natural resources rents (as a share of GDP) 24.9 20.9 19.3
Exports by commodity group (as a share of merchandise exports) 89 91 85
Agricultural commodities 47 35 32
Fuels – – –
Ores, metals, precious stones and non-monetary gold 42 56 53
Three leading commodity exports (as a share of total merchandise exports) 56 67 62
[971] Gold, non-monetary (excluding gold ores and concentrates) 26 45 43
[042] Rice 15 13 10
[285] Aluminium ores and concentrates (incl. alumina) 15 9 9
Average price index of the leading commodity group exported 33.4 110.1 107.6
Five leading destination markets of commodity exports (as a share of total commodity exports) 80
Canada 28
United States of America 27
European Union (28) 18
Venezuela (Bolivarian Republic of) 4
Ukraine 3
Commodity imports (millions of US dollars) 109 647 640
Commodity imports (as a share of total merchandise imports) 21 39 36
Food imports (millions of US dollars and as a share of total merchandise imports) 68 (13) 202 (12) 223 (13)
Fuel imports (millions of US dollars and as a share of total merchandise imports) 30 (6) 391 (23) 361 (20)
Five-leading trading partners for commodity imports (as a share of total commodity imports) 80
Trinidad and Tobago 39
United States of America 14
Suriname 14
Venezuela (Bolivarian Rep. of) 9
European Union (28) 5
Percentage change of GDP measured in constant 2010 prices 5.0 17.9 2.9
GDP per capita measured in constant 2010 US dollars 2,024 3,662 3,847
Population (thousands) 487 539 552
Human Development Index (value and rank) 0.5780 (91) 0.6500 (122) 0.6540 (122)
Total employment (as a share of the population) 52.0 50.7 50.7
Share of women in total employment 32.0 33.6 33.9
Proportion of population below international poverty line – SDG 1. Indicator 1.1.1 (1998) 14.0 ..
Gini index, latest available year (1998) 44.6 ..
Prevalence of undernourishment (per cent) – SDG 2. Indicator 2.1.1 8.3 7.5
Value added of agriculture/industry/services (as a share of GDP) 37/33/30 17/35/47 15/40/45
Employment in agriculture/industry/services (as a share of total employment) 33/22/45 15/25/60 13/27/60
Share of women in agriculture/industry/services 20/30/42 10/14/48 9/13/48
Institutional quality index, 2018 0.4496
Control of corruption –0.14 –0.57 –0.51
Rule of law –0.20 –0.45 –0.29
OTHER STRUCTURAL INDICATORS
MERCHANDISE AND COMMODITY EXPORT DEPENDENCE
COMMODITY IMPORT DEPENDENCE
KEY SOCIOECONOMIC INDICATORS](https://image.slidesharecdn.com/stateofcommoditydependance2019-190524115214/85/State-of-commodity-dependance-2019-109-320.jpg)
![Table of contents Introduction
Chapter 1
Key Findings
from the Report
Chapter 2
Country Statistical
Profiles
List of Country
Statistical Profiles
104
HAITI*
1995 2013-2017 2017
Merchandise export value (millions of US dollars) 110 953 987
Unallocated exports (as a share of merchandise exports) 4.7 4.4 5.1
Merchandise export concentration by product line (Herfindahl-Hirschmann index) 0.2033 0.5073 0.5134
Commodity export value (millions of US dollars) 31 109 112
Commodity exports (as a share of total merchandise exports) 28 11 11
Commodity exports (as a share of GDP) 1.2 1.3 1.3
Total natural resources rents (as a share of GDP) 1.2 1.1 1.3
Exports by commodity group (as a share of merchandise exports) 28 11 11
Agricultural commodities 28 9 9
Fuels – – –
Ores, metals, precious stones and non-monetary gold – 2 2
Three leading commodity exports (as a share of total merchandise exports) 9 6 6
[057] Fruits and nuts (excluding oil nuts), fresh or dried 5 3 4
[03] Fishery products 1 2 2
[072] Cocoa 3 1 1
Average price index of the leading commodity group exported 80.8 109.0 102.7
Five leading destination markets of commodity exports (as a share of total commodity exports) 90
United States of America 58
European Union (28) 12
China 10
Canada 9
Thailand 2
Commodity imports (millions of US dollars) 293 1,847 1,764
Commodity imports (as a share of total merchandise imports) 45 52 50
Food imports (millions of US dollars and as a share of total merchandise imports) 243 (37) 1,541 (43) 1,484 (42)
Fuel imports (millions of US dollars and as a share of total merchandise imports) 25 (4) 184 (5) 157 (4)
Five-leading trading partners for commodity imports (as a share of total commodity imports) 85
United States of America 62
European Union (28) 9
Colombia 6
Malaysia 5
Peru 3
Percentage change of GDP measured in constant 2010 prices 9.9 10.2 1.2
GDP per capita measured in constant 2010 US dollars 750 736 738
Population (thousands) 4,489 7,094 7,360
Human Development Index (value and rank) 0.4180 (121) 0.4926 (163) 0.4980 (165)
Total employment (as a share of the population) 61.2 58.1 58.6
Share of women in total employment 45.0 46.9 47.0
Proportion of population below international poverty line – SDG 1. Indicator 1.1.1 (2001) 56.1 (2012) 52.8
Gini index, latest available year (2001) 59.5 (2012) 60.8
Prevalence of undernourishment (per cent) – SDG 2. Indicator 2.1.1 54.9 45.8
Value added of agriculture/industry/services (as a share of GDP) 24/31/44 17/38/45 17/38/45
Employment in agriculture/industry/services (as a share of total employment) 53/11/36 43/12/45 41/12/46
Share of women in agriculture/industry/services 31/38/67 31/26/67 31/26/67
Institutional quality index, 2018 0.2300
Control of corruption –1.17 –1.23 –1.24
Rule of law –1.39 –1.15 –1.09
OTHER STRUCTURAL INDICATORS
MERCHANDISE AND COMMODITY EXPORT DEPENDENCE
COMMODITY IMPORT DEPENDENCE
KEY SOCIOECONOMIC INDICATORS](https://image.slidesharecdn.com/stateofcommoditydependance2019-190524115214/85/State-of-commodity-dependance-2019-110-320.jpg)
![Table of contents Introduction
Chapter 1
Key Findings
from the Report
Chapter 2
Country Statistical
Profiles
List of Country
Statistical Profiles
105
HONDURAS
1995 2013-2017 2017
Merchandise export value (millions of US dollars) 1,769 8,158 8,675
Unallocated exports (as a share of merchandise exports) 1.1 1.7 2.0
Merchandise export concentration by product line (Herfindahl-Hirschmann index) 0.2817 0.2240 0.2301
Commodity export value (millions of US dollars) 1,001 4,117 4,556
Commodity exports (as a share of total merchandise exports) 57 50 53
Commodity exports (as a share of GDP) 21.2 19.9 19.9
Total natural resources rents (as a share of GDP) 3.4 2.3 2.3
Exports by commodity group (as a share of merchandise exports) 56 50 53
Agricultural commodities 56 44 48
Fuels – 2 1
Ores, metals, precious stones and non-monetary gold 1 5 4
Three leading commodity exports (as a share of total merchandise exports) 48 28 31
[071] Coffee and coffee substitutes 23 16 17
[057] Fruits and nuts (excluding oil nuts), fresh or dried 15 7 7
[03] Fishery products 10 6 7
Average price index of the leading commodity group exported 87.2 98.3 93.7
Five leading destination markets of commodity exports (as a share of total commodity exports) 81
United States of America 35
European Union (28) 33
El Salvador 5
Guatemala 5
Mexico 3
Commodity imports (millions of US dollars) 360 3,687 3,511
Commodity imports (as a share of total merchandise imports) 21 33 31
Food imports (millions of US dollars and as a share of total merchandise imports) 178 (10) 1,584 (14) 1,668 (15)
Fuel imports (millions of US dollars and as a share of total merchandise imports) 131 (8) 1,755 (16) 1,459 (13)
Five-leading trading partners for commodity imports (as a share of total commodity imports) 84
United States of America 62
Guatemala 9
El Salvador 5
Costa Rica 4
Mexico 3
Percentage change of GDP measured in constant 2010 prices 4.1 14.8 4.8
GDP per capita measured in constant 2010 US dollars 1,595 2,107 2,204
Population (thousands) 3,173 6,005 6,333
Human Development Index (value and rank) 0.5290 (103) 0.6086 (131) 0.6170 (130)
Total employment (as a share of the population) 64.2 63.6 65.0
Share of women in total employment 34.5 36.5 37.5
Proportion of population below international poverty line – SDG 1. Indicator 1.1.1 (1995) 27.7 (2016) 16.0
Gini index, latest available year (1995) 55.5 (2016) 50.1
Prevalence of undernourishment (per cent) – SDG 2. Indicator 2.1.1 19.6 15.3
Value added of agriculture/industry/services (as a share of GDP) 20/30/50 13/26/61 13/27/61
Employment in agriculture/industry/services (as a share of total employment) 37/24/38 30/21/49 28/21/50
Share of women in agriculture/industry/services 7/41/58 10/36/53 11/36/53
Institutional quality index, 2018 0.3558
Control of corruption –1.08 –0.73 –0.72
Rule of law –0.93 –1.04 –1.05
OTHER STRUCTURAL INDICATORS
MERCHANDISE AND COMMODITY EXPORT DEPENDENCE
COMMODITY IMPORT DEPENDENCE
KEY SOCIOECONOMIC INDICATORS](https://image.slidesharecdn.com/stateofcommoditydependance2019-190524115214/85/State-of-commodity-dependance-2019-111-320.jpg)
![Table of contents Introduction
Chapter 1
Key Findings
from the Report
Chapter 2
Country Statistical
Profiles
List of Country
Statistical Profiles
106
HUNGARY
1995 2013-2017 2017
Merchandise export value (millions of US dollars) 12,452 107,400 113,000
Unallocated exports (as a share of merchandise exports) – 2.2 0.8
Merchandise export concentration by product line (Herfindahl-Hirschmann index) 0.0576 0.1159 0.1135
Commodity export value (millions of US dollars) 3,970 14,125 14,609
Commodity exports (as a share of total merchandise exports) 32 13 13
Commodity exports (as a share of GDP) 8.6 10.6 10.5
Total natural resources rents (as a share of GDP) 0.6 0.4 0.3
Exports by commodity group (as a share of merchandise exports) 32 13 13
Agricultural commodities 24 9 9
Fuels 3 3 2
Ores, metals, precious stones and non-monetary gold 5 1 1
Three leading commodity exports (as a share of total merchandise exports) 7 3 3
[334] Petroleum oils or bituminous minerals 70 % oil 3 1 1
[012] Other meat and edible meat offal 4 1 1
[081] Feeding stuff for animals (no unmilled cereals) – 1 1
Average price index of the leading commodity group exported 36.5 132.1 103.8
Five leading destination markets of commodity exports (as a share of total commodity exports) 92
European Union (28) 81
Serbia 5
Ukraine 3
Russian Federation 2
Switzerland 1
Commodity imports (millions of US dollars) 3,771 18,156 18,307
Commodity imports (as a share of total merchandise imports) 25 19 18
Food imports (millions of US dollars and as a share of total merchandise imports) 783 (5) 4,788 (5) 5,510 (5)
Fuel imports (millions of US dollars and as a share of total merchandise imports) 1,801 (12) 9,232 (9) 8,086 (8)
Five-leading trading partners for commodity imports (as a share of total commodity imports) 95
European Union (28) 62
Russian Federation 26
Ukraine 3
Serbia 2
Iraq 2
Percentage change of GDP measured in constant 2010 prices 1.5 8.9 4.2
GDP per capita measured in constant 2010 US dollars 8,934 14,672 15,776
Population (thousands) 8,478 8,371 8,330
Human Development Index (value and rank) 0.7410 (37) 0.8350 (42) 0.8380 (43)
Total employment (as a share of the population) 44.4 50.7 53.3
Share of women in total employment 44.2 45.7 45.6
Proportion of population below international poverty line – SDG 1. Indicator 1.1.1 (1998) 0.04 (2015) 0.5
Gini index, latest available year (1998) 26.4 (2015) 30.4
Prevalence of undernourishment (per cent) – SDG 2. Indicator 2.1.1 2.5 2.5
Value added of agriculture/industry/services (as a share of GDP) 8/30/61 5/31/65 4/31/65
Employment in agriculture/industry/services (as a share of total employment) 8/33/59 5/30/65 5/30/65
Share of women in agriculture/industry/services 26/34/53 25/29/55 26/28/55
Institutional quality index, 2018 0.6460
Control of corruption 0.67 0.16 0.09
Rule of law 0.91 0.49 0.53
OTHER STRUCTURAL INDICATORS
MERCHANDISE AND COMMODITY EXPORT DEPENDENCE
COMMODITY IMPORT DEPENDENCE
KEY SOCIOECONOMIC INDICATORS](https://image.slidesharecdn.com/stateofcommoditydependance2019-190524115214/85/State-of-commodity-dependance-2019-112-320.jpg)
![Table of contents Introduction
Chapter 1
Key Findings
from the Report
Chapter 2
Country Statistical
Profiles
List of Country
Statistical Profiles
107
ICELAND
1995 2013-2017 2017
Merchandise export value (millions of US dollars) 1,803 4,821 4,883
Unallocated exports (as a share of merchandise exports) 0.3 0.7 0.8
Merchandise export concentration by product line (Herfindahl-Hirschmann index) 0.3974 0.4497 0.4644
Commodity export value (millions of US dollars) 1,589 4,171 4,207
Commodity exports (as a share of total merchandise exports) 88 87 86
Commodity exports (as a share of GDP) 22.1 22.2 17.6
Total natural resources rents (as a share of GDP) – – –
Exports by commodity group (as a share of merchandise exports) 88 87 86
Agricultural commodities 76 46 43
Fuels – 2 1
Ores, metals, precious stones and non-monetary gold 12 39 42
Three leading commodity exports (as a share of total merchandise exports) 83 80 80
[684] Aluminium 11 38 41
[03] Fishery products 67 38 36
[081] Feeding stuff for animals (no unmilled cereals) 5 4 4
Average price index of the leading commodity group exported 58.3 123.5 127.5
Five leading destination markets of commodity exports (as a share of total commodity exports) 90
European Union (28) 76
United States of America 5
Norway 4
Russian Federation 2
Nigeria 2
Commodity imports (millions of US dollars) 441 2,074 2,269
Commodity imports (as a share of total merchandise imports) 25 37 33
Food imports (millions of US dollars and as a share of total merchandise imports) 174 (10) 531 (9) 592 (8)
Fuel imports (millions of US dollars and as a share of total merchandise imports) 127 (7) 784 (14) 778 (11)
Five-leading trading partners for commodity imports (as a share of total commodity imports) 82
European Union (28) 36
Norway 19
Brazil 13
United States of America 11
Australia 4
Percentage change of GDP measured in constant 2010 prices 0.1 12.6 3.6
GDP per capita measured in constant 2010 US dollars 30,287 46,808 50,479
Population (thousands) 202 263 268
Human Development Index (value and rank) 0.8260 (14) 0.9280 (7) 0.9350 (6)
Total employment (as a share of the population) 72.8 73.7 75.0
Share of women in total employment 46.9 47.3 47.3
Proportion of population below international poverty line – SDG 1. Indicator 1.1.1 (2003) – (2014) –
Gini index, latest available year (2003) 26.8 (2014) 27.8
Prevalence of undernourishment (per cent) – SDG 2. Indicator 2.1.1 2.5 2.5
Value added of agriculture/industry/services (as a share of GDP) 11/28/61 6/23/71 6/22/72
Employment in agriculture/industry/services (as a share of total employment) 10/24/66 4/18/78 4/17/80
Share of women in agriculture/industry/services 21/28/58 24/19/55 26/18/54
Institutional quality index, 2018 0.8744
Control of corruption 1.73 1.89 1.84
Rule of law 1.60 1.63 1.61
OTHER STRUCTURAL INDICATORS
MERCHANDISE AND COMMODITY EXPORT DEPENDENCE
COMMODITY IMPORT DEPENDENCE
KEY SOCIOECONOMIC INDICATORS](https://image.slidesharecdn.com/stateofcommoditydependance2019-190524115214/85/State-of-commodity-dependance-2019-113-320.jpg)
![Table of contents Introduction
Chapter 1
Key Findings
from the Report
Chapter 2
Country Statistical
Profiles
List of Country
Statistical Profiles
108
INDIA
1995 2013-2017 2017
Merchandise export value (millions of US dollars) 31,699 294,600 294,000
Unallocated exports (as a share of merchandise exports) 1.6 0.6 0.2
Merchandise export concentration by product line (Herfindahl-Hirschmann index) 0.1378 0.1440 0.1221
Commodity export value (millions of US dollars) 12,735 123,277 114,096
Commodity exports (as a share of total merchandise exports) 40 42 39
Commodity exports (as a share of GDP) 3.6 5.7 4.5
Total natural resources rents (as a share of GDP) 2.6 2.5 1.9
Exports by commodity group (as a share of merchandise exports) 40 42 39
Agricultural commodities 20 13 13
Fuels 2 15 12
Ores, metals, precious stones and non-monetary gold 19 13 13
Three leading commodity exports (as a share of total merchandise exports) 21 26 23
[334] Petroleum oils or bituminous minerals 70 % oil 1 15 12
[667] Pearls, precious semi-precious stones 15 9 9
[042] Rice 4 2 2
Average price index of the leading commodity group exported 36.5 132.1 103.8
Five leading destination markets of commodity exports (as a share of total commodity exports) 48
United Arab Emirates 12
United States of America 12
European Union (28) 10
China, Hong Kong SAR 8
China 5
Commodity imports (millions of US dollars) 14,154 240,388 244,276
Commodity imports (as a share of total merchandise imports) 39 57 55
Food imports (millions of US dollars and as a share of total merchandise imports) 1,626 (4) 20,294 (5) 23,745 (5)
Fuel imports (millions of US dollars and as a share of total merchandise imports) 4,927 (13) 127,251 (30) 121,725 (27)
Five-leading trading partners for commodity imports (as a share of total commodity imports) 37
United Arab Emirates 9
Saudi Arabia 8
Switzerland 8
European Union (28) 6
Iraq 6
Percentage change of GDP measured in constant 2010 prices 7.6 31.1 6.2
GDP per capita measured in constant 2010 US dollars 621 1,748 1,948
Population (thousands) 608,671 933,893 967,119
Human Development Index (value and rank) 0.4600 (114) 0.6256 (127) 0.6400 (127)
Total employment (as a share of the population) 58.2 52.0 51.9
Share of women in total employment 28.3 24.3 24.4
Proportion of population below international poverty line – SDG 1. Indicator 1.1.1 (2004) 38.2 (2011) 21.2
Gini index, latest available year (2004) .. (2011) 35.2
Prevalence of undernourishment (per cent) – SDG 2. Indicator 2.1.1 18.2 14.8
Value added of agriculture/industry/services (as a share of GDP) 28/33/40 18/30/52 17/29/54
Employment in agriculture/industry/services (as a share of total employment) 61/16/23 45/24/32 43/24/33
Share of women in agriculture/industry/services 34/22/17 32/18/19 32/18/19
Institutional quality index, 2018 0.5202
Control of corruption –0.38 –0.36 –0.24
Rule of law 0.21 –0.04 –
OTHER STRUCTURAL INDICATORS
MERCHANDISE AND COMMODITY EXPORT DEPENDENCE
COMMODITY IMPORT DEPENDENCE
KEY SOCIOECONOMIC INDICATORS](https://image.slidesharecdn.com/stateofcommoditydependance2019-190524115214/85/State-of-commodity-dependance-2019-114-320.jpg)
![Table of contents Introduction
Chapter 1
Key Findings
from the Report
Chapter 2
Country Statistical
Profiles
List of Country
Statistical Profiles
109
INDONESIA
1995 2013-2017 2017
Merchandise export value (millions of US dollars) .. 164,400 169,000
Unallocated exports (as a share of merchandise exports) .. – –
Merchandise export concentration by product line (Herfindahl-Hirschmann index) .. 0.1432 0.1421
Commodity export value (millions of US dollars) .. 95,766 98,153
Commodity exports (as a share of total merchandise exports) .. 58 58
Commodity exports (as a share of GDP) .. 10.4 9.7
Total natural resources rents (as a share of GDP) 5.0 3.8 2.5
Exports by commodity group (as a share of merchandise exports) .. 58 58
Agricultural commodities .. 26 29
Fuels .. 25 22
Ores, metals, precious stones and non-monetary gold .. 7 7
Three leading commodity exports (as a share of total merchandise exports) .. 29 29
[422] Fixed vegetable fats oils, crude, refined, fract. .. 11 13
[321] Coal, whether or not pulverized, not agglomerated .. 11 11
[343] Natural gas, whether or not liquefied .. 7 5
Average price index of the leading commodity group exported .. 115.7 106.2
Five leading destination markets of commodity exports (as a share of total commodity exports) 56
China 15
Japan 14
India 11
Singapore 9
European Union (28) 7
Commodity imports (millions of US dollars) .. 55,131 54,701
Commodity imports (as a share of total merchandise imports) .. 34 35
Food imports (millions of US dollars and as a share of total merchandise imports) .. 14,723 (9) 16,551 (11)
Fuel imports (millions of US dollars and as a share of total merchandise imports) .. 29,412 (18) 25,106 (16)
Five-leading trading partners for commodity imports (as a share of total commodity imports) 49
Singapore 21
Malaysia 8
Australia 7
China 6
United States of America 6
Percentage change of GDP measured in constant 2010 prices .. 23.4 5.1
GDP per capita measured in constant 2010 US dollars .. 3,837 4,131
Population (thousands) 130,662 186,185 191,773
Human Development Index (value and rank) 0.5640 (96) 0.6870 (114) 0.6940 (114)
Total employment (as a share of the population) 63.2 63.8 63.5
Share of women in total employment 37.2 37.8 38.3
Proportion of population below international poverty line – SDG 1. Indicator 1.1.1 (1996) 47.4 (2017) 5.7
Gini index, latest available year (1996) .. (2017) ..
Prevalence of undernourishment (per cent) – SDG 2. Indicator 2.1.1 17.8 7.7
Value added of agriculture/industry/services (as a share of GDP) .. 14/42/44 14/41/45
Employment in agriculture/industry/services (as a share of total employment) 44/18/38 33/22/45 31/22/47
Share of women in agriculture/industry/services 37/32/40 36/28/44 36/28/45
Institutional quality index, 2018 0.5552
Control of corruption –0.86 –0.46 –0.25
Rule of law –0.49 –0.40 –0.35
MERCHANDISE AND COMMODITY EXPORT DEPENDENCE
COMMODITY IMPORT DEPENDENCE
KEY SOCIOECONOMIC INDICATORS
OTHER STRUCTURAL INDICATORS](https://image.slidesharecdn.com/stateofcommoditydependance2019-190524115214/85/State-of-commodity-dependance-2019-115-320.jpg)
![Table of contents Introduction
Chapter 1
Key Findings
from the Report
Chapter 2
Country Statistical
Profiles
List of Country
Statistical Profiles
110
IRAN (ISLAMIC REPUBLIC OF)
1995 2013-2017 2017
Merchandise export value (millions of US dollars) 18,360 78,801 89,996
Unallocated exports (as a share of merchandise exports) 0.4 8.8 8.6
Merchandise export concentration by product line (Herfindahl-Hirschmann index) 0.7222 0.5546 0.5369
Commodity export value (millions of US dollars) 15,886 58,781 65,780
Commodity exports (as a share of total merchandise exports) 87 75 73
Commodity exports (as a share of GDP) 13.9 13.0 14.3
Total natural resources rents (as a share of GDP) 18.0 19.5 16.0
Exports by commodity group (as a share of merchandise exports) 87 75 73
Agricultural commodities 8 5 5
Fuels 77 65 63
Ores, metals, precious stones and non-monetary gold 2 5 5
Three leading commodity exports (as a share of total merchandise exports) 77 63 60
[333] Petroleum oils, oils from bitumin. materials, crude 74 57 55
[334] Petroleum oils or bituminous minerals 70 % oil 3 3 2
[342] Liquefied propane and butane 1 3 3
Average price index of the leading commodity group exported 36.5 132.1 103.8
Five leading destination markets of commodity exports (as a share of total commodity exports) 77
China 34
India 14
Japan 11
Taiwan, Province of China 10
Republic of Korea 8
Commodity imports (millions of US dollars) 4,191 10,906 11,331
Commodity imports (as a share of total merchandise imports) 30 21 21
Food imports (millions of US dollars and as a share of total merchandise imports) 2,891 (21) 6,393 (13) 6,601 (12)
Fuel imports (millions of US dollars and as a share of total merchandise imports) 250 (2) 1,452 (3) 1,447 (3)
Five-leading trading partners for commodity imports (as a share of total commodity imports) 70
United Arab Emirates 37
India 9
Switzerland 9
European Union (28) 8
Turkey 6
Percentage change of GDP measured in constant 2010 prices 2.4 6.5 4.3
GDP per capita measured in constant 2010 US dollars 4,331 6,415 7,004
Population (thousands) 35,059 60,612 61,936
Human Development Index (value and rank) 0.6400 (74) 0.7910 (58) 0.7980 (58)
Total employment (as a share of the population) 39.4 38.1 38.6
Share of women in total employment 11.1 16.1 17.3
Proportion of population below international poverty line – SDG 1. Indicator 1.1.1 (1998) 2.6 (2014) 0.2
Gini index, latest available year (1998) 44.1 (2014) 38.8
Prevalence of undernourishment (per cent) – SDG 2. Indicator 2.1.1 4.9 4.9
Value added of agriculture/industry/services (as a share of GDP) 12/39/49 10/37/53 10/34/56
Employment in agriculture/industry/services (as a share of total employment) 25/29/46 18/33/49 17/32/50
Share of women in agriculture/industry/services 8/13/12 20/12/17 21/14/18
Institutional quality index, 2018 0.2214
Control of corruption –0.48 –0.69 –0.81
Rule of law –0.94 –0.87 –0.68
OTHER STRUCTURAL INDICATORS
MERCHANDISE AND COMMODITY EXPORT DEPENDENCE
COMMODITY IMPORT DEPENDENCE
KEY SOCIOECONOMIC INDICATORS](https://image.slidesharecdn.com/stateofcommoditydependance2019-190524115214/85/State-of-commodity-dependance-2019-116-320.jpg)
![Table of contents Introduction
Chapter 1
Key Findings
from the Report
Chapter 2
Country Statistical
Profiles
List of Country
Statistical Profiles
111
IRAQ
1995 2013-2017 2017
Merchandise export value (millions of US dollars) 496 66,755 58,174
Unallocated exports (as a share of merchandise exports) 0.3 0.1 –
Merchandise export concentration by product line (Herfindahl-Hirschmann index) 0.7218 0.9586 0.9412
Commodity export value (millions of US dollars) 459 66,539 57,997
Commodity exports (as a share of total merchandise exports) 93 100 100
Commodity exports (as a share of GDP) 13.2 36.1 30.9
Total natural resources rents (as a share of GDP) .. 40.6 42.4
Exports by commodity group (as a share of merchandise exports) 92 99 99
Agricultural commodities – – –
Fuels 92 97 96
Ores, metals, precious stones and non-monetary gold – 2 3
Three leading commodity exports (as a share of total merchandise exports) 90 99 99
[333] Petroleum oils, oils from bitumin. materials, crude 73 96 94
[971] Gold, non-monetary (excluding gold ores and concentrates) – 2 3
[334] Petroleum oils or bituminous minerals 70 % oil 18 1 2
Average price index of the leading commodity group exported 36.5 132.1 103.8
Five leading destination markets of commodity exports (as a share of total commodity exports) 86
China 22
India 20
European Union (28) 19
United States of America 14
Republic of Korea 10
Commodity imports (millions of US dollars) 436 15,818 14,633
Commodity imports (as a share of total merchandise imports) 66 29 29
Food imports (millions of US dollars and as a share of total merchandise imports) 428 (64) 10,958 (20) 10,860 (21)
Fuel imports (millions of US dollars and as a share of total merchandise imports) – 2,236 (4) 1,020 (2)
Five-leading trading partners for commodity imports (as a share of total commodity imports) 55
Turkey 30
European Union (28) 8
United Arab Emirates 7
Syrian Arab Republic 5
United States of America 5
Percentage change of GDP measured in constant 2010 prices –18.3 43.5 1.2
GDP per capita measured in constant 2010 US dollars 1,450 5,447 5,602
Population (thousands) 11,261 21,406 22,812
Human Development Index (value and rank) 0.5530 (99) 0.6714 (118) 0.6850 (117)
Total employment (as a share of the population) 38.1 42.6 42.7
Share of women in total employment 10.4 19.0 19.3
Proportion of population below international poverty line – SDG 1. Indicator 1.1.1 (2006) 2.1 (2012) 2.5
Gini index, latest available year (2006) 28.6 (2012) 29.5
Prevalence of undernourishment (per cent) – SDG 2. Indicator 2.1.1 28.3 27.7
Value added of agriculture/industry/services (as a share of GDP) 12/66/22 4/49/47 4/40/56
Employment in agriculture/industry/services (as a share of total employment) 28/18/54 20/20/61 19/20/62
Share of women in agriculture/industry/services 18/5/8 44/4/16 45/4/16
Institutional quality index, 2018 0.1276
Control of corruption –1.60 –1.35 –1.37
Rule of law –1.56 –1.49 –1.64
MERCHANDISE AND COMMODITY EXPORT DEPENDENCE
COMMODITY IMPORT DEPENDENCE
KEY SOCIOECONOMIC INDICATORS
OTHER STRUCTURAL INDICATORS](https://image.slidesharecdn.com/stateofcommoditydependance2019-190524115214/85/State-of-commodity-dependance-2019-117-320.jpg)
![Table of contents Introduction
Chapter 1
Key Findings
from the Report
Chapter 2
Country Statistical
Profiles
List of Country
Statistical Profiles
112
IRELAND
1995 2013-2017 2017
Merchandise export value (millions of US dollars) 43,789 127,200 138,000
Unallocated exports (as a share of merchandise exports) 6.9 1.0 0.8
Merchandise export concentration by product line (Herfindahl-Hirschmann index) 0.1689 0.2366 0.2331
Commodity export value (millions of US dollars) 9,706 16,527 17,630
Commodity exports (as a share of total merchandise exports) 22 13 13
Commodity exports (as a share of GDP) 14.0 5.8 5.3
Total natural resources rents (as a share of GDP) 0.1 0.1 0.1
Exports by commodity group (as a share of merchandise exports) 22 13 13
Agricultural commodities 21 11 11
Fuels – 1 1
Ores, metals, precious stones and non-monetary gold 1 1 1
Three leading commodity exports (as a share of total merchandise exports) 11 5 5
[098] Edible products and preparations, n.e.s. 6 2 2
[011] Meat of bovine animals, fresh, chilled or frozen 3 2 2
[112] Alcoholic beverages 1 1 1
Average price index of the leading commodity group exported 80.8 109.0 102.7
Five leading destination markets of commodity exports (as a share of total commodity exports) 86
European Union (28) 71
United States of America 7
China 4
Russian Federation 1
China, Hong Kong SAR 1
Commodity imports (millions of US dollars) 5,393 18,648 17,669
Commodity imports (as a share of total merchandise imports) 17 23 20
Food imports (millions of US dollars and as a share of total merchandise imports) 2,496 (8) 8,967 (11) 9,512 (11)
Fuel imports (millions of US dollars and as a share of total merchandise imports) 1,273 (4) 6,727 (8) 5,120 (6)
Five-leading trading partners for commodity imports (as a share of total commodity imports) 90
European Union (28) 79
Norway 6
United States of America 3
Argentina 1
Brazil 1
Percentage change of GDP measured in constant 2010 prices 9.6 32.0 7.8
GDP per capita measured in constant 2010 US dollars 28,623 63,237 75,244
Population (thousands) 2,766 3,692 3,731
Human Development Index (value and rank) 0.7950 (23) 0.9266 (8) 0.9380 (4)
Total employment (as a share of the population) 47.4 54.5 56.2
Share of women in total employment 37.7 45.5 45.4
Proportion of population below international poverty line – SDG 1. Indicator 1.1.1 (2003) 0.2 (2015) 0.2
Gini index, latest available year (2003) 32.9 (2015) 31.8
Prevalence of undernourishment (per cent) – SDG 2. Indicator 2.1.1 2.5 2.5
Value added of agriculture/industry/services (as a share of GDP) 6/32/62 1/34/65 1/39/60
Employment in agriculture/industry/services (as a share of total employment) 12/28/60 6/19/76 5/19/75
Share of women in agriculture/industry/services 11/23/50 11/21/54 11/20/54
Institutional quality index, 2018 0.9225
Control of corruption 1.71 1.58 1.55
Rule of law 1.50 1.65 1.43
OTHER STRUCTURAL INDICATORS
MERCHANDISE AND COMMODITY EXPORT DEPENDENCE
COMMODITY IMPORT DEPENDENCE
KEY SOCIOECONOMIC INDICATORS](https://image.slidesharecdn.com/stateofcommoditydependance2019-190524115214/85/State-of-commodity-dependance-2019-118-320.jpg)
![Table of contents Introduction
Chapter 1
Key Findings
from the Report
Chapter 2
Country Statistical
Profiles
List of Country
Statistical Profiles
113
ISRAEL
1995 2013-2017 2017
Merchandise export value (millions of US dollars) 19,047 64,301 61,126
Unallocated exports (as a share of merchandise exports) 2.4 3.3 12.0
Merchandise export concentration by product line (Herfindahl-Hirschmann index) 0.2732 0.2603 0.2104
Commodity export value (millions of US dollars) 7,374 20,806 14,942
Commodity exports (as a share of total merchandise exports) 39 32 24
Commodity exports (as a share of GDP) 7.3 6.6 4.3
Total natural resources rents (as a share of GDP) – 0.2 0.2
Exports by commodity group (as a share of merchandise exports) 39 32 24
Agricultural commodities 7 4 4
Fuels – 1 1
Ores, metals, precious stones and non-monetary gold 32 27 20
Three leading commodity exports (as a share of total merchandise exports) 32 28 21
[667] Pearls, precious semi-precious stones 30 26 18
[334] Petroleum oils or bituminous minerals 70 % oil – 1 1
[057] Fruits and nuts (excluding oil nuts), fresh or dried 2 1 1
Average price index of the leading commodity group exported 33.4 110.1 107.6
Five leading destination markets of commodity exports (as a share of total commodity exports) 89
United States of America 35
China, Hong Kong SAR 21
European Union (28) 21
Switzerland 6
India 6
Commodity imports (millions of US dollars) 6,448 21,354 19,280
Commodity imports (as a share of total merchandise imports) 23 31 28
Food imports (millions of US dollars and as a share of total merchandise imports) 2,004 (7) 5,404 (8) 5,477 (8)
Fuel imports (millions of US dollars and as a share of total merchandise imports) 454 (2) 3,667 (5) 2,805 (4)
Five-leading trading partners for commodity imports (as a share of total commodity imports) 68
European Union (28) 25
United States of America 21
India 9
Russian Federation 7
Switzerland 7
Percentage change of GDP measured in constant 2010 prices 8.7 15.2 3.3
GDP per capita measured in constant 2010 US dollars 24,773 34,639 35,874
Population (thousands) 3,787 5,823 6,003
Human Development Index (value and rank) 0.8230 (16) 0.9000 (19) 0.9030 (20)
Total employment (as a share of the population) 56.4 60.7 61.4
Share of women in total employment 41.7 47.0 47.1
Proportion of population below international poverty line – SDG 1. Indicator 1.1.1 (1997) 0.3 (2012) 0.5
Gini index, latest available year (1997) 38.1 (2012) 41.4
Prevalence of undernourishment (per cent) – SDG 2. Indicator 2.1.1 2.5 2.5
Value added of agriculture/industry/services (as a share of GDP) 2/26/72 1/21/77 1/21/78
Employment in agriculture/industry/services (as a share of total employment) 3/29/68 1/18/81 1/17/82
Share of women in agriculture/industry/services 17/21/51 26/22/53 28/21/53
Institutional quality index, 2018 0.7835
Control of corruption 1.35 0.95 0.83
Rule of law 1.28 1.07 1.02
MERCHANDISE AND COMMODITY EXPORT DEPENDENCE
COMMODITY IMPORT DEPENDENCE
KEY SOCIOECONOMIC INDICATORS
OTHER STRUCTURAL INDICATORS](https://image.slidesharecdn.com/stateofcommoditydependance2019-190524115214/85/State-of-commodity-dependance-2019-119-320.jpg)
![Table of contents Introduction
Chapter 1
Key Findings
from the Report
Chapter 2
Country Statistical
Profiles
List of Country
Statistical Profiles
114
ITALY
1995 2013-2017 2017
Merchandise export value (millions of US dollars) 230,000 494,000 503,000
Unallocated exports (as a share of merchandise exports) 0.9 2.0 1.4
Merchandise export concentration by product line (Herfindahl-Hirschmann index) 0.0550 0.0532 0.0536
Commodity export value (millions of US dollars) 22,901 77,086 77,825
Commodity exports (as a share of total merchandise exports) 10 16 15
Commodity exports (as a share of GDP) 2.0 3.9 4.0
Total natural resources rents (as a share of GDP) 0.1 0.1 0.1
Exports by commodity group (as a share of merchandise exports) 10 16 15
Agricultural commodities 7 9 9
Fuels 1 3 3
Ores, metals, precious stones and non-monetary gold 1 3 3
Three leading commodity exports (as a share of total merchandise exports) 3 6 5
[334] Petroleum oils or bituminous minerals 70 % oil 1 3 3
[112] Alcoholic beverages 1 2 2
[048] Cereal preparations, flour of fruits or vegetables 1 1 1
Average price index of the leading commodity group exported 36.5 132.1 103.8
Five leading destination markets of commodity exports (as a share of total commodity exports) 76
European Union (28) 57
Switzerland 7
United States of America 7
Turkey 2
Libya 2
Commodity imports (millions of US dollars) 61,524 147,055 136,527
Commodity imports (as a share of total merchandise imports) 31 33 30
Food imports (millions of US dollars and as a share of total merchandise imports) 21,050 (11) 43,014 (10) 43,244 (10)
Fuel imports (millions of US dollars and as a share of total merchandise imports) 14,671 (7) 64,059 (14) 54,083 (12)
Five-leading trading partners for commodity imports (as a share of total commodity imports) 64
European Union (28) 42
Russian Federation 11
Azerbaijan 4
Algeria 4
Libya 3
Percentage change of GDP measured in constant 2010 prices 2.9 –1.2 1.6
GDP per capita measured in constant 2010 US dollars 32,594 34,780 35,658
Population (thousands) 48,669 51,353 51,336
Human Development Index (value and rank) 0.8000 (21) 0.8768 (26) 0.8800 (26)
Total employment (as a share of the population) 41.8 42.7 43.2
Share of women in total employment 35.0 41.5 41.5
Proportion of population below international poverty line – SDG 1. Indicator 1.1.1 (2003) 0.7 (2015) 2.0
Gini index, latest available year (2003) 34.9 (2015) 35.4
Prevalence of undernourishment (per cent) – SDG 2. Indicator 2.1.1 2.5 2.5
Value added of agriculture/industry/services (as a share of GDP) 3/29/68 2/24/74 2/24/74
Employment in agriculture/industry/services (as a share of total employment) 7/34/60 4/27/70 4/26/70
Share of women in agriculture/industry/services 34/24/42 27/21/50 27/21/50
Institutional quality index, 2018 0.6872
Control of corruption 0.41 0.06 0.19
Rule of law 1.06 0.34 0.32
OTHER STRUCTURAL INDICATORS
MERCHANDISE AND COMMODITY EXPORT DEPENDENCE
COMMODITY IMPORT DEPENDENCE
KEY SOCIOECONOMIC INDICATORS](https://image.slidesharecdn.com/stateofcommoditydependance2019-190524115214/85/State-of-commodity-dependance-2019-120-320.jpg)
![Table of contents Introduction
Chapter 1
Key Findings
from the Report
Chapter 2
Country Statistical
Profiles
List of Country
Statistical Profiles
115
JAMAICA
1995 2013-2017 2017
Merchandise export value (millions of US dollars) 1,424 1,359 1,310
Unallocated exports (as a share of merchandise exports) – 2.1 0.3
Merchandise export concentration by product line (Herfindahl-Hirschmann index) 0.4755 0.4685 0.4643
Commodity export value (millions of US dollars) 1,023 1,204 1,202
Commodity exports (as a share of total merchandise exports) 72 89 92
Commodity exports (as a share of GDP) 15.6 8.5 8.4
Total natural resources rents (as a share of GDP) 2.6 1.2 1.3
Exports by commodity group (as a share of merchandise exports) 72 89 92
Agricultural commodities 22 22 26
Fuels 1 19 18
Ores, metals, precious stones and non-monetary gold 49 48 48
Three leading commodity exports (as a share of total merchandise exports) 52 70 71
[285] Aluminium ores and concentrates (incl. alumina) 49 46 46
[334] Petroleum oils or bituminous minerals 70 % oil 1 18 18
[112] Alcoholic beverages 2 5 7
Average price index of the leading commodity group exported 58.3 123.5 127.5
Five leading destination markets of commodity exports (as a share of total commodity exports) 85
United States of America 43
European Union (28) 18
Canada 15
Russian Federation 5
Iceland 5
Commodity imports (millions of US dollars) 817 2,582 2,485
Commodity imports (as a share of total merchandise imports) 29 47 43
Food imports (millions of US dollars and as a share of total merchandise imports) 361 (13) 888 (16) 891 (15)
Fuel imports (millions of US dollars and as a share of total merchandise imports) 351 (13) 1,542 (28) 1,423 (24)
Five-leading trading partners for commodity imports (as a share of total commodity imports) 78
United States of America 36
Trinidad and Tobago 17
Venezuela (Bolivarian Rep. of) 16
Mexico 4
Colombia 4
Percentage change of GDP measured in constant 2010 prices 1.0 2.2 0.5
GDP per capita measured in constant 2010 US dollars 4,952 4,759 4,809
Population (thousands) 1,688 2,194 2,233
Human Development Index (value and rank) 0.6570 (66) 0.7296 (93) 0.7320 (95)
Total employment (as a share of the population) 58.2 57.8 58.9
Share of women in total employment 42.8 41.0 41.4
Proportion of population below international poverty line – SDG 1. Indicator 1.1.1 (1996) 3.4 (2004) 1.7
Gini index, latest available year (1996) 40.4 (2004) 45.5
Prevalence of undernourishment (per cent) – SDG 2. Indicator 2.1.1 7.4 8.9
Value added of agriculture/industry/services (as a share of GDP) 9/29/61 7/21/72 8/22/70
Employment in agriculture/industry/services (as a share of total employment) 23/20/57 18/15/66 19/15/66
Share of women in agriculture/industry/services 21/26/57 18/15/53 18/15/54
Institutional quality index, 2018 0.6540
Control of corruption 0.19 –0.23 –0.17
Rule of law –0.34 –0.24 –0.16
OTHER STRUCTURAL INDICATORS
MERCHANDISE AND COMMODITY EXPORT DEPENDENCE
COMMODITY IMPORT DEPENDENCE
KEY SOCIOECONOMIC INDICATORS](https://image.slidesharecdn.com/stateofcommoditydependance2019-190524115214/85/State-of-commodity-dependance-2019-121-320.jpg)
![Table of contents Introduction
Chapter 1
Key Findings
from the Report
Chapter 2
Country Statistical
Profiles
List of Country
Statistical Profiles
116
JAPAN
1995 2013-2017 2017
Merchandise export value (millions of US dollars) 443,000 674,600 698,000
Unallocated exports (as a share of merchandise exports) 2.1 5.7 6.3
Merchandise export concentration by product line (Herfindahl-Hirschmann index) 0.1235 0.1338 0.1389
Commodity export value (millions of US dollars) 12,433 48,013 49,984
Commodity exports (as a share of total merchandise exports) 3 7 7
Commodity exports (as a share of GDP) 0.2 1.0 1.0
Total natural resources rents (as a share of GDP) – – –
Exports by commodity group (as a share of merchandise exports) 3 7 7
Agricultural commodities 1 2 2
Fuels 1 2 2
Ores, metals, precious stones and non-monetary gold 1 4 4
Three leading commodity exports (as a share of total merchandise exports) 1 4 4
[334] Petroleum oils or bituminous minerals 70 % oil – 2 1
[971] Gold, non-monetary (excluding gold ores and concentrates) – 1 1
[682] Copper 1 1 1
Average price index of the leading commodity group exported 36.5 132.1 103.8
Five leading destination markets of commodity exports (as a share of total commodity exports) 61
China 20
Republic of Korea 12
China, Hong Kong SAR 11
Singapore 9
Taiwan, Province of China 8
Commodity imports (millions of US dollars) 157,368 310,602 264,622
Commodity imports (as a share of total merchandise imports) 47 44 39
Food imports (millions of US dollars and as a share of total merchandise imports) 48,983 (15) 59,662 (8) 59,817 (9)
Fuel imports (millions of US dollars and as a share of total merchandise imports) 53,916 (16) 184,862 (26) 141,464 (21)
Five-leading trading partners for commodity imports (as a share of total commodity imports) 46
Australia 13
United Arab Emirates 9
Saudi Arabia 9
United States of America 7
Qatar 7
Percentage change of GDP measured in constant 2010 prices 2.7 5.0 1.7
GDP per capita measured in constant 2010 US dollars 40,070 46,856 48,189
Population (thousands) 105,845 111,298 111,056
Human Development Index (value and rank) 0.8400 (10) 0.9046 (17) 0.9090 (17)
Total employment (as a share of the population) 61.6 58.0 58.5
Share of women in total employment 40.2 42.9 43.3
Proportion of population below international poverty line – SDG 1. Indicator 1.1.1 (2008) 0.2 ..
Gini index, latest available year (2008) 32.1 ..
Prevalence of undernourishment (per cent) – SDG 2. Indicator 2.1.1 2.5 2.5
Value added of agriculture/industry/services (as a share of GDP) 2/35/64 1/28/71 1/28/71
Employment in agriculture/industry/services (as a share of total employment) 6/34/61 4/26/71 3/26/71
Share of women in agriculture/industry/services 46/30/45 38/24/50 37/25/50
Institutional quality index, 2018 0.8363
Control of corruption 1.19 1.59 1.52
Rule of law 1.35 1.51 1.57
OTHER STRUCTURAL INDICATORS
MERCHANDISE AND COMMODITY EXPORT DEPENDENCE
COMMODITY IMPORT DEPENDENCE
KEY SOCIOECONOMIC INDICATORS](https://image.slidesharecdn.com/stateofcommoditydependance2019-190524115214/85/State-of-commodity-dependance-2019-122-320.jpg)
![Table of contents Introduction
Chapter 1
Key Findings
from the Report
Chapter 2
Country Statistical
Profiles
List of Country
Statistical Profiles
117
JORDAN
1995 2013-2017 2017
Merchandise export value (millions of US dollars) 1,769 7,823 7,469
Unallocated exports (as a share of merchandise exports) 1.0 0.7 0.8
Merchandise export concentration by product line (Herfindahl-Hirschmann index) 0.2516 0.1625 0.1686
Commodity export value (millions of US dollars) 828 1,928 1,765
Commodity exports (as a share of total merchandise exports) 47 25 24
Commodity exports (as a share of GDP) 12.3 5.2 4.4
Total natural resources rents (as a share of GDP) 0.1 1.3 1.3
Exports by commodity group (as a share of merchandise exports) 47 24 24
Agricultural commodities 27 16 15
Fuels – – –
Ores, metals, precious stones and non-monetary gold 20 9 9
Three leading commodity exports (as a share of total merchandise exports) 24 13 13
[272] Crude fertilizers (excluding those of division 56) 18 6 6
[054] Vegetables 5 5 5
[001] Live animals other than animals of division 03 2 2 2
Average price index of the leading commodity group exported 44.4 116.0 116.4
Five leading destination markets of commodity exports (as a share of total commodity exports) 62
India 19
Saudi Arabia 16
Iraq 12
United Arab Emirates 8
Kuwait 7
Commodity imports (millions of US dollars) 1,440 9,377 8,274
Commodity imports (as a share of total merchandise imports) 39 45 41
Food imports (millions of US dollars and as a share of total merchandise imports) 747 (20) 3,699 (18) 3,610 (18)
Fuel imports (millions of US dollars and as a share of total merchandise imports) 477 (13) 4,276 (20) 3,407 (17)
Five-leading trading partners for commodity imports (as a share of total commodity imports) 61
Saudi Arabia 27
European Union (28) 18
United Arab Emirates 6
India 6
United States of America 4
Percentage change of GDP measured in constant 2010 prices 6.2 10.9 2.0
GDP per capita measured in constant 2010 US dollars 2,678 3,309 3,239
Population (thousands) 2,713 5,827 6,258
Human Development Index (value and rank) 0.6840 (54) 0.7320 (92) 0.7350 (93)
Total employment (as a share of the population) 36.3 33.8 33.3
Share of women in total employment 11.9 15.5 15.6
Proportion of population below international poverty line – SDG 1. Indicator 1.1.1 (1997) 1.4 (2010) 0.1
Gini index, latest available year (1997) 36.4 (2010) 33.7
Prevalence of undernourishment (per cent) – SDG 2. Indicator 2.1.1 12.6 13.5
Value added of agriculture/industry/services (as a share of GDP) 4/27/68 4/28/69 4/27/69
Employment in agriculture/industry/services (as a share of total employment) 5/23/72 4/27/69 4/27/69
Share of women in agriculture/industry/services 10/8/13 5/10/18 5/10/18
Institutional quality index, 2018 0.5430
Control of corruption –0.04 0.20 0.26
Rule of law 0.28 0.37 0.26
MERCHANDISE AND COMMODITY EXPORT DEPENDENCE
COMMODITY IMPORT DEPENDENCE
KEY SOCIOECONOMIC INDICATORS
OTHER STRUCTURAL INDICATORS](https://image.slidesharecdn.com/stateofcommoditydependance2019-190524115214/85/State-of-commodity-dependance-2019-123-320.jpg)
![Table of contents Introduction
Chapter 1
Key Findings
from the Report
Chapter 2
Country Statistical
Profiles
List of Country
Statistical Profiles
118
KAZAKHSTAN
1995 2013-2017 2017
Merchandise export value (millions of US dollars) 5,227 59,046 48,342
Unallocated exports (as a share of merchandise exports) – – –
Merchandise export concentration by product line (Herfindahl-Hirschmann index) 0.2036 0.5825 0.5291
Commodity export value (millions of US dollars) 3,233 51,617 40,977
Commodity exports (as a share of total merchandise exports) 62 87 85
Commodity exports (as a share of GDP) 15.7 27.5 25.2
Total natural resources rents (as a share of GDP) 8.4 15.2 15.0
Exports by commodity group (as a share of merchandise exports) 62 87 85
Agricultural commodities 13 4 5
Fuels 25 71 63
Ores, metals, precious stones and non-monetary gold 24 12 16
Three leading commodity exports (as a share of total merchandise exports) 29 69 62
[333] Petroleum oils, oils from bitumin. materials, crude 15 62 55
[682] Copper 12 4 5
[334] Petroleum oils or bituminous minerals 70 % oil 2 3 2
Average price index of the leading commodity group exported 36.5 132.1 103.8
Five leading destination markets of commodity exports (as a share of total commodity exports) 87
European Union (28) 59
China 12
Switzerland 7
Russian Federation 6
Turkey 3
Commodity imports (millions of US dollars) 1,509 6,832 5,718
Commodity imports (as a share of total merchandise imports) 40 19 19
Food imports (millions of US dollars and as a share of total merchandise imports) 292 (8) 2,980 (9) 2,670 (9)
Fuel imports (millions of US dollars and as a share of total merchandise imports) 891 (23) 2,480 (7) 1,570 (5)
Five-leading trading partners for commodity imports (as a share of total commodity imports) 80
Russian Federation 57
European Union (28) 8
Uzbekistan 8
China 4
Ukraine 3
Percentage change of GDP measured in constant 2010 prices –8.2 18.5 4.0
GDP per capita measured in constant 2010 US dollars 3,687 10,633 10,881
Population (thousands) 11,268 12,982 13,120
Human Development Index (value and rank) 0.6640 (61) 0.7950 (56) 0.8000 (56)
Total employment (as a share of the population) 63.7 67.3 67.5
Share of women in total employment 47.1 48.2 48.1
Proportion of population below international poverty line – SDG 1. Indicator 1.1.1 (1996) 6.3 (2015) –
Gini index, latest available year (1996) 35.4 (2015) 26.9
Prevalence of undernourishment (per cent) – SDG 2. Indicator 2.1.1 5.9 2.5
Value added of agriculture/industry/services (as a share of GDP) 13/30/57 5/35/60 5/34/61
Employment in agriculture/industry/services (as a share of total employment) 40/16/45 20/21/60 18/21/61
Share of women in agriculture/industry/services 44/29/56 46/28/56 46/27/56
Institutional quality index, 2018 0.4006
Control of corruption –1.13 –0.85 –0.82
Rule of law –1.19 –0.52 –0.41
OTHER STRUCTURAL INDICATORS
MERCHANDISE AND COMMODITY EXPORT DEPENDENCE
COMMODITY IMPORT DEPENDENCE
KEY SOCIOECONOMIC INDICATORS](https://image.slidesharecdn.com/stateofcommoditydependance2019-190524115214/85/State-of-commodity-dependance-2019-124-320.jpg)
![Table of contents Introduction
Chapter 1
Key Findings
from the Report
Chapter 2
Country Statistical
Profiles
List of Country
Statistical Profiles
119
KENYA
1995 2013-2017 2017
Merchandise export value (millions of US dollars) 1,826 5,743 5,747
Unallocated exports (as a share of merchandise exports) 0.7 1.7 0.8
Merchandise export concentration by product line (Herfindahl-Hirschmann index) 0.2285 0.2246 0.2444
Commodity export value (millions of US dollars) 1,305 3,872 4,148
Commodity exports (as a share of total merchandise exports) 71 67 72
Commodity exports (as a share of GDP) 9.7 5.9 5.2
Total natural resources rents (as a share of GDP) 7.3 2.9 2.9
Exports by commodity group (as a share of merchandise exports) 71 67 72
Agricultural commodities 64 57 61
Fuels 5 5 5
Ores, metals, precious stones and non-monetary gold 3 5 6
Three leading commodity exports (as a share of total merchandise exports) 31 39 42
[074] Tea and mate 19 22 24
[292] Crude vegetable materials, n.e.s. 7 12 13
[334] Petroleum oils or bituminous minerals 70 % oil 5 5 5
Average price index of the leading commodity group exported 87.2 98.3 93.7
Five leading destination markets of commodity exports (as a share of total commodity exports) 57
European Union (28) 32
Pakistan 9
United Arab Emirates 7
Egypt 5
Uganda 5
Commodity imports (millions of US dollars) 769 5,281 6,126
Commodity imports (as a share of total merchandise imports) 27 32 37
Food imports (millions of US dollars and as a share of total merchandise imports) 308 (11) 1,946 (12) 2,811 (17)
Fuel imports (millions of US dollars and as a share of total merchandise imports) 331 (12) 2,752 (17) 2,806 (17)
Five-leading trading partners for commodity imports (as a share of total commodity imports) 60
India 24
United Arab Emirates 12
Saudi Arabia 9
European Union (28) 8
Indonesia 7
Percentage change of GDP measured in constant 2010 prices 4.4 24.5 4.8
GDP per capita measured in constant 2010 US dollars 861 1,108 1,168
Population (thousands) 14,580 27,729 29,588
Human Development Index (value and rank) 0.4560 (115) 0.5782 (141) 0.5900 (139)
Total employment (as a share of the population) 65.2 58.0 57.9
Share of women in total employment 47.3 46.2 46.4
Proportion of population below international poverty line – SDG 1. Indicator 1.1.1 (1997) 32.0 (2015) 36.8
Gini index, latest available year (1997) 45.0 (2015) 40.8
Prevalence of undernourishment (per cent) – SDG 2. Indicator 2.1.1 31.3 24.2
Value added of agriculture/industry/services (as a share of GDP) 28/21/51 31/19/50 35/18/47
Employment in agriculture/industry/services (as a share of total employment) 46/13/41 38/15/48 38/14/48
Share of women in agriculture/industry/services 57/29/42 57/25/44 58/24/44
Institutional quality index, 2018 0.3733
Control of corruption –1.16 –0.96 –0.96
Rule of law –1.02 –0.49 –0.41
OTHER STRUCTURAL INDICATORS
MERCHANDISE AND COMMODITY EXPORT DEPENDENCE
COMMODITY IMPORT DEPENDENCE
KEY SOCIOECONOMIC INDICATORS](https://image.slidesharecdn.com/stateofcommoditydependance2019-190524115214/85/State-of-commodity-dependance-2019-125-320.jpg)
![Table of contents Introduction
Chapter 1
Key Findings
from the Report
Chapter 2
Country Statistical
Profiles
List of Country
Statistical Profiles
120
KIRIBATI*
1995 2013-2017 2017
Merchandise export value (millions of US dollars) 7 10 14
Unallocated exports (as a share of merchandise exports) 7.4 1.2 1.8
Merchandise export concentration by product line (Herfindahl-Hirschmann index) 0.4569 0.8844 0.9011
Commodity export value (millions of US dollars) 6 10 13
Commodity exports (as a share of total merchandise exports) 87 95 95
Commodity exports (as a share of GDP) 11.2 5.4 6.8
Total natural resources rents (as a share of GDP) 0.1 0.1 0.1
Exports by commodity group (as a share of merchandise exports) 87 95 95
Agricultural commodities 87 94 94
Fuels – 1 1
Ores, metals, precious stones and non-monetary gold 1 – –
Three leading commodity exports (as a share of total merchandise exports) 39 94 94
[03] Fishery products 39 88 89
[422] Fixed vegetable fats oils, crude, refined, fract. – 5 4
[334] Petroleum oils or bituminous minerals 70 % oil – 1 1
Average price index of the leading commodity group exported 80.8 109.0 102.7
Five leading destination markets of commodity exports (as a share of total commodity exports) 85
Thailand 66
Japan 6
Ecuador 5
Viet Nam 4
Bangladesh 3
Commodity imports (millions of US dollars) 15 46 44
Commodity imports (as a share of total merchandise imports) 45 40 38
Food imports (millions of US dollars and as a share of total merchandise imports) 9 (26) 22 (19) 21 (18)
Fuel imports (millions of US dollars and as a share of total merchandise imports) 3 (10) 15 (13) 13 (11)
Five-leading trading partners for commodity imports (as a share of total commodity imports) 76
Fiji 29
Australia 22
Singapore 12
China 9
New Zealand 5
Percentage change of GDP measured in constant 2010 prices –0.6 14.9 3.1
GDP per capita measured in constant 2010 US dollars 1,580 1,624 1,696
Population (thousands) .. .. ..
Human Development Index (value and rank) .. 0.6136 (130) 0.6120 (131)
Total employment (as a share of the population) .. .. ..
Share of women in total employment .. .. ..
Proportion of population below international poverty line – SDG 1. Indicator 1.1.1 (2006) 12.9 ..
Gini index, latest available year (2006) 37.0 ..
Prevalence of undernourishment (per cent) – SDG 2. Indicator 2.1.1 4.4 3.1
Value added of agriculture/industry/services (as a share of GDP) 27/9/64 23/14/62 23/14/62
Employment in agriculture/industry/services (as a share of total employment) .. .. ..
Share of women in agriculture/industry/services .. .. ..
Institutional quality index, 2018 0.4379
Control of corruption .. 0.21 0.39
Rule of law 0.81 0.13 0.53
MERCHANDISE AND COMMODITY EXPORT DEPENDENCE
COMMODITY IMPORT DEPENDENCE
KEY SOCIOECONOMIC INDICATORS
OTHER STRUCTURAL INDICATORS](https://image.slidesharecdn.com/stateofcommoditydependance2019-190524115214/85/State-of-commodity-dependance-2019-126-320.jpg)
![Table of contents Introduction
Chapter 1
Key Findings
from the Report
Chapter 2
Country Statistical
Profiles
List of Country
Statistical Profiles
121
KUWAIT
1995 2013-2017 2017
Merchandise export value (millions of US dollars) 12,944 74,349 54,807
Unallocated exports (as a share of merchandise exports) 0.8 0.6 1.6
Merchandise export concentration by product line (Herfindahl-Hirschmann index) 0.6088 0.6470 0.6252
Commodity export value (millions of US dollars) 11,701 65,717 45,098
Commodity exports (as a share of total merchandise exports) 90 88 82
Commodity exports (as a share of GDP) 44.1 48.4 38.1
Total natural resources rents (as a share of GDP) 32.0 48.2 44.7
Exports by commodity group (as a share of merchandise exports) 90 88 82
Agricultural commodities 1 2 3
Fuels 88 86 79
Ores, metals, precious stones and non-monetary gold 1 1 1
Three leading commodity exports (as a share of total merchandise exports) 87 86 79
[333] Petroleum oils, oils from bitumin. materials, crude 58 66 64
[334] Petroleum oils or bituminous minerals 70 % oil 24 16 10
[342] Liquefied propane and butane 4 4 4
Average price index of the leading commodity group exported 36.5 132.1 103.8
Five leading destination markets of commodity exports (as a share of total commodity exports) 66
Republic of Korea 18
India 13
Japan 13
China 11
United States of America 10
Commodity imports (millions of US dollars) 1,495 6,571 6,676
Commodity imports (as a share of total merchandise imports) 19 21 20
Food imports (millions of US dollars and as a share of total merchandise imports) 1,116 (14) 4,513 (14) 4,729 (14)
Fuel imports (millions of US dollars and as a share of total merchandise imports) 41 (1) 188 (1) 171 (1)
Five-leading trading partners for commodity imports (as a share of total commodity imports) 57
United Arab Emirates 17
European Union (28) 16
India 9
Saudi Arabia 8
United States of America 6
Percentage change of GDP measured in constant 2010 prices 1.4 10.0 –3.2
GDP per capita measured in constant 2010 US dollars 40,705 35,695 33,490
Population (thousands) 1,116 3,075 3,264
Human Development Index (value and rank) 0.7470 (36) 0.8006 (54) 0.8030 (54)
Total employment (as a share of the population) 66.7 68.2 67.6
Share of women in total employment 25.0 27.7 27.5
Proportion of population below international poverty line – SDG 1. Indicator 1.1.1 .. ..
Gini index, latest available year .. ..
Prevalence of undernourishment (per cent) – SDG 2. Indicator 2.1.1 2.5 2.5
Value added of agriculture/industry/services (as a share of GDP) –/53/47 –/59/41 –/59/41
Employment in agriculture/industry/services (as a share of total employment) 2/23/75 3/27/70 4/27/70
Share of women in agriculture/industry/services –/3/33 1/5/38 1/5/38
Institutional quality index, 2018 0.4756
Control of corruption 0.48 –0.25 –0.33
Rule of law 0.60 0.10 0.10
OTHER STRUCTURAL INDICATORS
MERCHANDISE AND COMMODITY EXPORT DEPENDENCE
COMMODITY IMPORT DEPENDENCE
KEY SOCIOECONOMIC INDICATORS](https://image.slidesharecdn.com/stateofcommoditydependance2019-190524115214/85/State-of-commodity-dependance-2019-127-320.jpg)
![Table of contents Introduction
Chapter 1
Key Findings
from the Report
Chapter 2
Country Statistical
Profiles
List of Country
Statistical Profiles
122
KYRGYZSTAN
1995 2013-2017 2017
Merchandise export value (millions of US dollars) 412 1,721 1,784
Unallocated exports (as a share of merchandise exports) 0.9 2.9 0.1
Merchandise export concentration by product line (Herfindahl-Hirschmann index) 0.1399 0.3723 0.3832
Commodity export value (millions of US dollars) 263 1,199 1,340
Commodity exports (as a share of total merchandise exports) 64 70 75
Commodity exports (as a share of GDP) 17.6 17.0 18.7
Total natural resources rents (as a share of GDP) 0.5 8.0 8.4
Exports by commodity group (as a share of merchandise exports) 64 70 75
Agricultural commodities 37 14 13
Fuels 13 7 8
Ores, metals, precious stones and non-monetary gold 14 49 55
Three leading commodity exports (as a share of total merchandise exports) 3 49 49
[971] Gold, non-monetary (excluding gold ores and concentrates) – 40 41
[334] Petroleum oils or bituminous minerals 70 % oil – 5 4
[054] Vegetables 3 5 4
Average price index of the leading commodity group exported 33.4 110.1 107.6
Five leading destination markets of commodity exports (as a share of total commodity exports) 79
Switzerland 37
Kazakhstan 13
United Arab Emirates 12
European Union (28) 9
Turkey 8
Commodity imports (millions of US dollars) 311 1,668 1,355
Commodity imports (as a share of total merchandise imports) 59 35 30
Food imports (millions of US dollars and as a share of total merchandise imports) 83 (16) 573 (12) 522 (12)
Fuel imports (millions of US dollars and as a share of total merchandise imports) 188 (36) 847 (18) 636 (14)
Five-leading trading partners for commodity imports (as a share of total commodity imports) 90
Russian Federation 56
Kazakhstan 25
China 3
Ukraine 3
European Union (28) 3
Percentage change of GDP measured in constant 2010 prices –5.4 19.7 4.6
GDP per capita measured in constant 2010 US dollars 534 1,035 1,089
Population (thousands) 2,851 4,038 4,120
Human Development Index (value and rank) 0.5630 (97) 0.6656 (119) 0.6720 (119)
Total employment (as a share of the population) 60.8 57.3 57.2
Share of women in total employment 44.2 39.8 39.3
Proportion of population below international poverty line – SDG 1. Indicator 1.1.1 (1998) 30.6 (2016) 1.4
Gini index, latest available year (1998) 46.4 (2016) 26.8
Prevalence of undernourishment (per cent) – SDG 2. Indicator 2.1.1 16.3 6.5
Value added of agriculture/industry/services (as a share of GDP) 43/22/35 16/28/57 14/28/57
Employment in agriculture/industry/services (as a share of total employment) 54/11/35 29/21/50 27/22/51
Share of women in agriculture/industry/services 44/26/50 42/21/46 41/20/47
Institutional quality index, 2018 0.3726
Control of corruption –0.99 –1.11 –1.05
Rule of law –0.73 –0.99 –0.93
MERCHANDISE AND COMMODITY EXPORT DEPENDENCE
COMMODITY IMPORT DEPENDENCE
KEY SOCIOECONOMIC INDICATORS
OTHER STRUCTURAL INDICATORS](https://image.slidesharecdn.com/stateofcommoditydependance2019-190524115214/85/State-of-commodity-dependance-2019-128-320.jpg)
![Table of contents Introduction
Chapter 1
Key Findings
from the Report
Chapter 2
Country Statistical
Profiles
List of Country
Statistical Profiles
123
LAO PEOPLE’S DEMOCRATIC REPUBLIC*
1995 2013-2017 2017
Merchandise export value (millions of US dollars) 311 3,088 4,495
Unallocated exports (as a share of merchandise exports) 0.3 3.5 3.6
Merchandise export concentration by product line (Herfindahl-Hirschmann index) 0.2655 0.2432 0.2312
Commodity export value (millions of US dollars) 146 2,375 3,367
Commodity exports (as a share of total merchandise exports) 47 77 75
Commodity exports (as a share of GDP) 7.9 16.5 20.1
Total natural resources rents (as a share of GDP) 9.1 11.8 9.5
Exports by commodity group (as a share of merchandise exports) 47 77 75
Agricultural commodities 40 31 25
Fuels – 15 17
Ores, metals, precious stones and non-monetary gold 6 31 33
Three leading commodity exports (as a share of total merchandise exports) 33 46 41
[24 + 25] Forestry products 30 17 11
[351] Electric current – 15 17
[682] Copper 2 14 13
Average price index of the leading commodity group exported 99.7 110.0 105.1
Five leading destination markets of commodity exports (as a share of total commodity exports) 95
Thailand 39
China 35
Viet Nam 15
India 4
European Union (28) 2
Commodity imports (millions of US dollars) 172 1,378 1,669
Commodity imports (as a share of total merchandise imports) 29 30 30
Food imports (millions of US dollars and as a share of total merchandise imports) 57 (10) 470 (10) 593 (11)
Fuel imports (millions of US dollars and as a share of total merchandise imports) 50 (8) 671 (15) 771 (14)
Five-leading trading partners for commodity imports (as a share of total commodity imports) 97
Thailand 84
Viet Nam 8
China 3
European Union (28) 2
Singapore 1
Percentage change of GDP measured in constant 2010 prices 7.5 34.1 6.7
GDP per capita measured in constant 2010 US dollars 555 1,595 1,770
Population (thousands) 2,694 4,422 4,603
Human Development Index (value and rank) 0.4280 (116) 0.5914 (135) 0.6010 (136)
Total employment (as a share of the population) 78.9 77.6 77.8
Share of women in total employment 50.2 49.9 49.8
Proportion of population below international poverty line – SDG 1. Indicator 1.1.1 (1997) 52.4 (2012) 22.7
Gini index, latest available year (1997) 34.9 (2012) 36.4
Prevalence of undernourishment (per cent) – SDG 2. Indicator 2.1.1 37.7 16.6
Value added of agriculture/industry/services (as a share of GDP) 43/16/41 20/32/48 19/33/48
Employment in agriculture/industry/services (as a share of total employment) 85/4/11 63/9/27 61/10/29
Share of women in agriculture/industry/services 53/39/36 51/37/51 51/36/51
Institutional quality index, 2018 0.2508
Control of corruption –0.72 –0.92 –0.94
Rule of law –1.05 –0.81 –0.88
OTHER STRUCTURAL INDICATORS
MERCHANDISE AND COMMODITY EXPORT DEPENDENCE
COMMODITY IMPORT DEPENDENCE
KEY SOCIOECONOMIC INDICATORS](https://image.slidesharecdn.com/stateofcommoditydependance2019-190524115214/85/State-of-commodity-dependance-2019-129-320.jpg)
![Table of contents Introduction
Chapter 1
Key Findings
from the Report
Chapter 2
Country Statistical
Profiles
List of Country
Statistical Profiles
124
LATVIA
1995 2013-2017 2017
Merchandise export value (millions of US dollars) 1,305 12,557 12,895
Unallocated exports (as a share of merchandise exports) 1.7 5.0 3.8
Merchandise export concentration by product line (Herfindahl-Hirschmann index) 0.1372 0.0892 0.0851
Commodity export value (millions of US dollars) 525 4,783 4,706
Commodity exports (as a share of total merchandise exports) 40 38 36
Commodity exports (as a share of GDP) 9.7 16.3 15.5
Total natural resources rents (as a share of GDP) 2.4 1.0 1.0
Exports by commodity group (as a share of merchandise exports) 40 38 36
Agricultural commodities 37 29 30
Fuels 2 6 4
Ores, metals, precious stones and non-monetary gold 1 3 2
Three leading commodity exports (as a share of total merchandise exports) 23 18 17
[24 + 25] Forestry products 22 10 10
[112] Alcoholic beverages 1 4 5
[334] Petroleum oils or bituminous minerals 70 % oil 1 4 2
Average price index of the leading commodity group exported 99.7 110.0 105.1
Five leading destination markets of commodity exports (as a share of total commodity exports) 86
European Union (28) 68
Russian Federation 11
Turkey 3
China 2
Saudi Arabia 1
Commodity imports (millions of US dollars) 626 4,670 4,520
Commodity imports (as a share of total merchandise imports) 34 30 28
Food imports (millions of US dollars and as a share of total merchandise imports) 153 (8) 1,777 (12) 1,848 (12)
Fuel imports (millions of US dollars and as a share of total merchandise imports) 385 (21) 1,828 (12) 1,416 (9)
Five-leading trading partners for commodity imports (as a share of total commodity imports) 96
European Union (28) 74
Russian Federation 15
Belarus 5
Norway 1
Ukraine 1
Percentage change of GDP measured in constant 2010 prices –0.8 11.6 4.6
GDP per capita measured in constant 2010 US dollars 5,094 14,236 15,485
Population (thousands) 1,988 1,693 1,649
Human Development Index (value and rank) 0.6730 (57) 0.8406 (40) 0.8470 (39)
Total employment (as a share of the population) 48.1 54.0 55.4
Share of women in total employment 48.1 50.5 50.7
Proportion of population below international poverty line – SDG 1. Indicator 1.1.1 (1995) – (2015) 0.7
Gini index, latest available year (1995) 31.0 (2015) 34.2
Prevalence of undernourishment (per cent) – SDG 2. Indicator 2.1.1 5.3 2.5
Value added of agriculture/industry/services (as a share of GDP) 9/30/61 4/22/74 4/22/75
Employment in agriculture/industry/services (as a share of total employment) 18/28/54 8/24/68 8/24/68
Share of women in agriculture/industry/services 39/36/57 32/28/61 33/28/61
Institutional quality index, 2018 0.7971
Control of corruption –0.20 0.44 0.54
Rule of law 0.13 0.87 0.93
OTHER STRUCTURAL INDICATORS
MERCHANDISE AND COMMODITY EXPORT DEPENDENCE
COMMODITY IMPORT DEPENDENCE
KEY SOCIOECONOMIC INDICATORS](https://image.slidesharecdn.com/stateofcommoditydependance2019-190524115214/85/State-of-commodity-dependance-2019-130-320.jpg)
![Table of contents Introduction
Chapter 1
Key Findings
from the Report
Chapter 2
Country Statistical
Profiles
List of Country
Statistical Profiles
125
LEBANON
1995 2013-2017 2017
Merchandise export value (millions of US dollars) 656 4,331 4,026
Unallocated exports (as a share of merchandise exports) – 0.3 –
Merchandise export concentration by product line (Herfindahl-Hirschmann index) 0.0984 0.1214 0.1429
Commodity export value (millions of US dollars) 208 2,136 2,205
Commodity exports (as a share of total merchandise exports) 32 49 55
Commodity exports (as a share of GDP) 1.8 4.3 4.2
Total natural resources rents (as a share of GDP) – – –
Exports by commodity group (as a share of merchandise exports) 32 49 55
Agricultural commodities 21 23 22
Fuels – 3 1
Ores, metals, precious stones and non-monetary gold 11 24 32
Three leading commodity exports (as a share of total merchandise exports) 8 19 26
[971] Gold, non-monetary (excluding gold ores and concentrates) 2 9 11
[288] Non-ferrous base metal waste and scrap, n.e.s. 2 6 11
[057] Fruits and nuts (excluding oil nuts), fresh or dried 5 4 4
Average price index of the leading commodity group exported 33.4 110.1 107.6
Five leading destination markets of commodity exports (as a share of total commodity exports) 49
South Africa 12
European Union (28) 11
Syrian Arab Republic 10
United Arab Emirates 10
China 6
Commodity imports (millions of US dollars) 2,551 8,582 8,481
Commodity imports (as a share of total merchandise imports) 35 44 44
Food imports (millions of US dollars and as a share of total merchandise imports) 1,182 (16) 2,906 (15) 2,979 (15)
Fuel imports (millions of US dollars and as a share of total merchandise imports) 546 (8) 3,951 (20) 3,806 (20)
Five-leading trading partners for commodity imports (as a share of total commodity imports) 67
European Union (28) 46
Russian Federation 8
United States of America 6
Egypt 4
Switzerland 4
Percentage change of GDP measured in constant 2010 prices 6.5 8.7 1.8
GDP per capita measured in constant 2010 US dollars 6,768 7,315 7,112
Population (thousands) 2,079 4,398 4,678
Human Development Index (value and rank) .. 0.7528 (79) 0.7570 (78)
Total employment (as a share of the population) 39.9 43.8 44.1
Share of women in total employment 22.4 23.2 23.5
Proportion of population below international poverty line – SDG 1. Indicator 1.1.1 (2011) – ..
Gini index, latest available year (2011) 31.8 ..
Prevalence of undernourishment (per cent) – SDG 2. Indicator 2.1.1 2.5 10.9
Value added of agriculture/industry/services (as a share of GDP) 6/32/62 4/16/80 3/11/86
Employment in agriculture/industry/services (as a share of total employment) 3/23/74 3/21/76 3/20/76
Share of women in agriculture/industry/services –/12/27 –/10/28 –/9/28
Institutional quality index, 2018 0.3018
Control of corruption –0.66 –0.96 –1.00
Rule of law –0.28 –0.80 –0.82
MERCHANDISE AND COMMODITY EXPORT DEPENDENCE
COMMODITY IMPORT DEPENDENCE
KEY SOCIOECONOMIC INDICATORS
OTHER STRUCTURAL INDICATORS](https://image.slidesharecdn.com/stateofcommoditydependance2019-190524115214/85/State-of-commodity-dependance-2019-131-320.jpg)
![Table of contents Introduction
Chapter 1
Key Findings
from the Report
Chapter 2
Country Statistical
Profiles
List of Country
Statistical Profiles
126
LESOTHO*
1995 2013-2017 2017
Merchandise export value (millions of US dollars) 160 887 1,033
Unallocated exports (as a share of merchandise exports) 0.1 – –
Merchandise export concentration by product line (Herfindahl-Hirschmann index) 0.3614 0.2774 0.2776
Commodity export value (millions of US dollars) 13 295 339
Commodity exports (as a share of total merchandise exports) 8 33 33
Commodity exports (as a share of GDP) 1.4 11.9 12.5
Total natural resources rents (as a share of GDP) 4.1 5.5 6.8
Exports by commodity group (as a share of merchandise exports) 8 33 33
Agricultural commodities 5 11 11
Fuels – – –
Ores, metals, precious stones and non-monetary gold 4 22 22
Three leading commodity exports (as a share of total merchandise exports) 6 28 28
[667] Pearls, precious semi-precious stones 4 22 22
[111] Non-alcoholic beverages, n.e.s. 2 4 4
[268] Wool and other animal hair (incl. wool tops) 1 2 2
Average price index of the leading commodity group exported 33.4 110.1 107.6
Five leading destination markets of commodity exports (as a share of total commodity exports) 99
European Union (28) 57
South Africa 33
United States of America 6
Botswana 2
Eswatini 1
Commodity imports (millions of US dollars) 364 800 800
Commodity imports (as a share of total merchandise imports) 33 39 38
Food imports (millions of US dollars and as a share of total merchandise imports) 175 (16) 395 (19) 406 (19)
Fuel imports (millions of US dollars and as a share of total merchandise imports) 127 (11) 283 (14) 264 (13)
Five-leading trading partners for commodity imports (as a share of total commodity imports) 98
South Africa 97
United States of America 1
Percentage change of GDP measured in constant 2010 prices 4.6 16.9 2.9
GDP per capita measured in constant 2010 US dollars 760 1,360 1,414
Population (thousands) 1,017 1,398 1,443
Human Development Index (value and rank) 0.4920 (109) 0.5122 (158) 0.5200 (156)
Total employment (as a share of the population) 43.7 48.8 48.4
Share of women in total employment 44.4 45.1 44.8
Proportion of population below international poverty line – SDG 1. Indicator 1.1.1 (2002) 61.3 (2010) 59.6
Gini index, latest available year (2002) 51.6 (2010) 54.2
Prevalence of undernourishment (per cent) – SDG 2. Indicator 2.1.1 13.6 12.8
Value added of agriculture/industry/services (as a share of GDP) 9/32/58 6/32/62 6/32/62
Employment in agriculture/industry/services (as a share of total employment) 58/16/26 11/40/49 10/40/49
Share of women in agriculture/industry/services 36/39/66 20/30/63 19/30/63
Institutional quality index, 2018 0.3980
Control of corruption 0.09 0.10 –0.03
Rule of law 0.10 –0.21 –0.27
OTHER STRUCTURAL INDICATORS
MERCHANDISE AND COMMODITY EXPORT DEPENDENCE
COMMODITY IMPORT DEPENDENCE
KEY SOCIOECONOMIC INDICATORS](https://image.slidesharecdn.com/stateofcommoditydependance2019-190524115214/85/State-of-commodity-dependance-2019-132-320.jpg)
![Table of contents Introduction
Chapter 1
Key Findings
from the Report
Chapter 2
Country Statistical
Profiles
List of Country
Statistical Profiles
127
LIBERIA*
1995 2013-2017 2017
Merchandise export value (millions of US dollars) 820 391 389
Unallocated exports (as a share of merchandise exports) – 0.9 2.5
Merchandise export concentration by product line (Herfindahl-Hirschmann index) 0.8013 0.4187 0.4645
Commodity export value (millions of US dollars) 699 248 192
Commodity exports (as a share of total merchandise exports) 85 63 50
Commodity exports (as a share of GDP) 10.2 7.0
Total natural resources rents (as a share of GDP) 80.6 50.1 49.9
Exports by commodity group (as a share of merchandise exports) 85 63 50
Agricultural commodities 2 21 18
Fuels 2 4 6
Ores, metals, precious stones and non-monetary gold 81 39 25
Three leading commodity exports (as a share of total merchandise exports) 2 49 34
[281] Iron ore and concentrates – 23 7
[971] Gold, non-monetary (excluding gold ores and concentrates) – 14 16
[231] Natural rubber similar gums, in primary forms 2 12 11
Average price index of the leading commodity group exported 58.3 123.5 127.5
Five leading destination markets of commodity exports (as a share of total commodity exports) 82
European Union (28) 32
China 20
United Arab Emirates 14
United States of America 10
Switzerland 8
Commodity imports (millions of US dollars) 11 130 119
Commodity imports (as a share of total merchandise imports) 2 9 11
Food imports (millions of US dollars and as a share of total merchandise imports) 7 (1) 40 (3) 39 (3)
Fuel imports (millions of US dollars and as a share of total merchandise imports) 3 (1) 83 (6) 76 (7)
Five-leading trading partners for commodity imports (as a share of total commodity imports) 77
China 43
European Union (28) 14
India 11
United States of America 5
Trinidad and Tobago 5
Percentage change of GDP measured in constant 2010 prices –4.3 26.9 2.5
GDP per capita measured in constant 2010 US dollars 84 398 403
Population (thousands) 1,160 2,596 2,753
Human Development Index (value and rank) .. 0.4318 (177) 0.4350 (178)
Total employment (as a share of the population) 54.0 54.5 54.3
Share of women in total employment 46.6 48.4 48.5
Proportion of population below international poverty line – SDG 1. Indicator 1.1.1 (2007) 68.6 (2014) 38.6
Gini index, latest available year (2007) 36.5 (2014) 33.2
Prevalence of undernourishment (per cent) – SDG 2. Indicator 2.1.1 38.4 38.8
Value added of agriculture/industry/services (as a share of GDP) 81/5/14 71/11/18 73/9/18
Employment in agriculture/industry/services (as a share of total employment) 69/8/23 44/12/44 43/12/45
Share of women in agriculture/industry/services 49/27/47 48/24/55 48/24/56
Institutional quality index, 2018 0.2555
Control of corruption –1.50 –0.71 –0.69
Rule of law –1.93 –0.89 –0.97
MERCHANDISE AND COMMODITY EXPORT DEPENDENCE
COMMODITY IMPORT DEPENDENCE
KEY SOCIOECONOMIC INDICATORS
OTHER STRUCTURAL INDICATORS](https://image.slidesharecdn.com/stateofcommoditydependance2019-190524115214/85/State-of-commodity-dependance-2019-133-320.jpg)
![Table of contents Introduction
Chapter 1
Key Findings
from the Report
Chapter 2
Country Statistical
Profiles
List of Country
Statistical Profiles
128
LIBYA
1995 2013-2017 2017
Merchandise export value (millions of US dollars) 9,364 18,139 9,000
Unallocated exports (as a share of merchandise exports) 0.1 0.5 0.1
Merchandise export concentration by product line (Herfindahl-Hirschmann index) 0.7633 0.6847 0.7399
Commodity export value (millions of US dollars) 8,653 17,435 8,573
Commodity exports (as a share of total merchandise exports) 92 96 95
Commodity exports (as a share of GDP) 30.6 36.5 13.9
Total natural resources rents (as a share of GDP) 23.6 .. ..
Exports by commodity group (as a share of merchandise exports) 92 96 95
Agricultural commodities – – –
Fuels 92 92 88
Ores, metals, precious stones and non-monetary gold – 4 7
Three leading commodity exports (as a share of total merchandise exports) 90 87 84
[333] Petroleum oils, oils from bitumin. materials, crude 77 73 75
[334] Petroleum oils or bituminous minerals 70 % oil 13 7 5
[343] Natural gas, whether or not liquefied 1 6 4
Average price index of the leading commodity group exported 36.5 132.1 103.8
Five leading destination markets of commodity exports (as a share of total commodity exports) 90
European Union (28) 74
China 5
United States of America 4
United Arab Emirates 3
Switzerland 3
Commodity imports (millions of US dollars) 1,442 5,039 4,296
Commodity imports (as a share of total merchandise imports) 29 31 37
Food imports (millions of US dollars and as a share of total merchandise imports) 1,046 (21) 2,894 (18) 2,421 (21)
Fuel imports (millions of US dollars and as a share of total merchandise imports) 220 (4) 1,553 (10) 1,457 (12)
Five-leading trading partners for commodity imports (as a share of total commodity imports) 72
European Union (28) 54
Egypt 5
Brazil 5
Tunisia 4
Ukraine 4
Percentage change of GDP measured in constant 2010 prices –2.2 –51.1 46.2
GDP per capita measured in constant 2010 US dollars 8,904 4,591 5,627
Population (thousands) 3,087 4,480 4,580
Human Development Index (value and rank) 0.7040 (45) 0.6990 (108) 0.7060 (106)
Total employment (as a share of the population) 40.1 42.9 43.2
Share of women in total employment 18.9 22.0 21.7
Proportion of population below international poverty line – SDG 1. Indicator 1.1.1 .. ..
Gini index, latest available year .. ..
Prevalence of undernourishment (per cent) – SDG 2. Indicator 2.1.1 .. ..
Value added of agriculture/industry/services (as a share of GDP) 7/40/53 1/67/32 1/67/32
Employment in agriculture/industry/services (as a share of total employment) 9/25/66 15/27/58 12/27/61
Share of women in agriculture/industry/services 15/14/21 19/24/22 16/23/22
Institutional quality index, 2018 0.0627
Control of corruption –0.87 –1.58 –1.59
Rule of law –1.18 –1.62 –1.78
OTHER STRUCTURAL INDICATORS
MERCHANDISE AND COMMODITY EXPORT DEPENDENCE
COMMODITY IMPORT DEPENDENCE
KEY SOCIOECONOMIC INDICATORS](https://image.slidesharecdn.com/stateofcommoditydependance2019-190524115214/85/State-of-commodity-dependance-2019-134-320.jpg)
![Table of contents Introduction
Chapter 1
Key Findings
from the Report
Chapter 2
Country Statistical
Profiles
List of Country
Statistical Profiles
129
LITHUANIA
1995 2013-2017 2017
Merchandise export value (millions of US dollars) 2,706 28,955 29,350
Unallocated exports (as a share of merchandise exports) – 1.8 0.4
Merchandise export concentration by product line (Herfindahl-Hirschmann index) 0.0877 0.1377 0.1152
Commodity export value (millions of US dollars) 1,143 11,447 10,808
Commodity exports (as a share of total merchandise exports) 42 40 37
Commodity exports (as a share of GDP) 17.1 25.3 22.9
Total natural resources rents (as a share of GDP) 1.5 0.4 0.4
Exports by commodity group (as a share of merchandise exports) 42 40 37
Agricultural commodities 26 21 20
Fuels 11 17 15
Ores, metals, precious stones and non-monetary gold 5 1 2
Three leading commodity exports (as a share of total merchandise exports) 10 20 18
[334] Petroleum oils or bituminous minerals 70 % oil 9 16 13
[041] Wheat (including spelt) and meslin, unmilled – 2 2
[03] Fishery products 1 2 2
Average price index of the leading commodity group exported 36.5 132.1 103.8
Five leading destination markets of commodity exports (as a share of total commodity exports) 85
European Union (28) 60
Russian Federation 9
United States of America 7
Ukraine 6
Belarus 3
Commodity imports (millions of US dollars) 1,472 12,306 11,078
Commodity imports (as a share of total merchandise imports) 40 39 36
Food imports (millions of US dollars and as a share of total merchandise imports) 416 (11) 3,386 (11) 3,269 (11)
Fuel imports (millions of US dollars and as a share of total merchandise imports) 708 (19) 7,025 (22) 5,839 (19)
Five-leading trading partners for commodity imports (as a share of total commodity imports) 93
Russian Federation 44
European Union (28) 39
Kazakhstan 4
Belarus 4
Norway 2
Percentage change of GDP measured in constant 2010 prices 3.3 14.2 3.8
GDP per capita measured in constant 2010 US dollars 5,327 15,262 16,429
Population (thousands) 2,837 2,508 2,462
Human Development Index (value and rank) 0.7030 (46) 0.8504 (37) 0.8580 (33)
Total employment (as a share of the population) 50.9 54.0 56.3
Share of women in total employment 48.0 51.1 51.4
Proportion of population below international poverty line – SDG 1. Indicator 1.1.1 (1996) – (2015) 0.7
Gini index, latest available year (1996) 32.3 (2015) 37.4
Prevalence of undernourishment (per cent) – SDG 2. Indicator 2.1.1 2.5 2.5
Value added of agriculture/industry/services (as a share of GDP) 11/32/57 4/30/67 3/29/68
Employment in agriculture/industry/services (as a share of total employment) 22/29/48 8/25/66 8/25/67
Share of women in agriculture/industry/services 42/38/57 37/33/60 35/32/61
Institutional quality index, 2018 0.8414
Control of corruption 0.42 0.57 0.55
Rule of law 0.45 0.96 0.99
MERCHANDISE AND COMMODITY EXPORT DEPENDENCE
COMMODITY IMPORT DEPENDENCE
KEY SOCIOECONOMIC INDICATORS
OTHER STRUCTURAL INDICATORS](https://image.slidesharecdn.com/stateofcommoditydependance2019-190524115214/85/State-of-commodity-dependance-2019-135-320.jpg)
![Table of contents Introduction
Chapter 1
Key Findings
from the Report
Chapter 2
Country Statistical
Profiles
List of Country
Statistical Profiles
130
LUXEMBOURG
1995 2013-2017 2017
Merchandise export value (millions of US dollars) 7,244 17,256 15,750
Unallocated exports (as a share of merchandise exports) 27.3 2.7 2.8
Merchandise export concentration by product line (Herfindahl-Hirschmann index) 0.1085 0.1057 0.1010
Commodity export value (millions of US dollars) 909 3,140 2,834
Commodity exports (as a share of total merchandise exports) 13 18 18
Commodity exports (as a share of GDP) 4.2 5.1 4.6
Total natural resources rents (as a share of GDP) – 0.1 0.1
Exports by commodity group (as a share of merchandise exports) 13 18 18
Agricultural commodities 6 10 10
Fuels 1 1 1
Ores, metals, precious stones and non-monetary gold 6 7 8
Three leading commodity exports (as a share of total merchandise exports) 3 6 6
[684] Aluminium 2 3 3
[971] Gold, non-monetary (excluding gold ores and concentrates) 1 2 2
[024] Cheese and curd – 1 1
Average price index of the leading commodity group exported 58.3 123.5 127.5
Five leading destination markets of commodity exports (as a share of total commodity exports) 95
European Union (28) 85
Switzerland 6
China 2
United States of America 1
Israel 1
Commodity imports (millions of US dollars) 1,494 6,660 5,938
Commodity imports (as a share of total merchandise imports) 17 29 28
Food imports (millions of US dollars and as a share of total merchandise imports) 454 (5) 1,873 (8) 1,763 (8)
Fuel imports (millions of US dollars and as a share of total merchandise imports) 65 (1) 2,178 (10) 1,687 (8)
Five-leading trading partners for commodity imports (as a share of total commodity imports) 97
European Union (28) 92
United States of America 2
Switzerland 1
Mexico 1
Indonesia 1
Percentage change of GDP measured in constant 2010 prices 5.9 13.3 2.3
GDP per capita measured in constant 2010 US dollars 74,864 107,883 110,824
Population (thousands) 333 472 488
Human Development Index (value and rank) 0.8080 (19) 0.8988 (20) 0.9040 (19)
Total employment (as a share of the population) 48.9 55.0 54.7
Share of women in total employment 35.6 44.6 44.9
Proportion of population below international poverty line – SDG 1. Indicator 1.1.1 (2003) – (2015) 0.2
Gini index, latest available year (2003) –30.2 (2015) 33.8
Prevalence of undernourishment (per cent) – SDG 2. Indicator 2.1.1 2.5 2.5
Value added of agriculture/industry/services (as a share of GDP) 1/21/78 –/13/87 –/13/87
Employment in agriculture/industry/services (as a share of total employment) 4/25/71 1/12/87 1/12/87
Share of women in agriculture/industry/services 33/12/44 27/17/49 27/17/49
Institutional quality index, 2018 0.8922
Control of corruption 1.95 2.08 1.99
Rule of law 1.71 1.82 1.74
OTHER STRUCTURAL INDICATORS
MERCHANDISE AND COMMODITY EXPORT DEPENDENCE
COMMODITY IMPORT DEPENDENCE
KEY SOCIOECONOMIC INDICATORS](https://image.slidesharecdn.com/stateofcommoditydependance2019-190524115214/85/State-of-commodity-dependance-2019-136-320.jpg)
![Table of contents Introduction
Chapter 1
Key Findings
from the Report
Chapter 2
Country Statistical
Profiles
List of Country
Statistical Profiles
131
MADAGASCAR*
1995 2013-2017 2017
Merchandise export value (millions of US dollars) 507 2,287 2,847
Unallocated exports (as a share of merchandise exports) 1.9 0.7 0.2
Merchandise export concentration by product line (Herfindahl-Hirschmann index) 0.2266 0.2870 0.3497
Commodity export value (millions of US dollars) 391 1,621 2,141
Commodity exports (as a share of total merchandise exports) 77 71 75
Commodity exports (as a share of GDP) 10.5 13.4 16.6
Total natural resources rents (as a share of GDP) 9.4 10.9 11.8
Exports by commodity group (as a share of merchandise exports) 77 71 75
Agricultural commodities 69 38 48
Fuels 3 1 1
Ores, metals, precious stones and non-monetary gold 5 32 26
Three leading commodity exports (as a share of total merchandise exports) 31 47 54
[075] Spices 14 21 34
[683] Nickel – 19 13
[03] Fishery products 18 7 6
Average price index of the leading commodity group exported 80.8 109.0 102.7
Five leading destination markets of commodity exports (as a share of total commodity exports) 72
European Union (28) 38
United States of America 14
China 8
Japan 7
Republic of Korea 5
Commodity imports (millions of US dollars) 189 1,239 1,416
Commodity imports (as a share of total merchandise imports) 30 38 39
Food imports (millions of US dollars and as a share of total merchandise imports) 84 (13) 529 (16) 736 (20)
Fuel imports (millions of US dollars and as a share of total merchandise imports) 89 (14) 523 (16) 502 (14)
Five-leading trading partners for commodity imports (as a share of total commodity imports) 52
United Arab Emirates 21
India 8
European Union (28) 8
Saudi Arabia 7
Bahrain 7
Percentage change of GDP measured in constant 2010 prices 1.7 10.5 4.3
GDP per capita measured in constant 2010 US dollars 503 484 495
Population (thousands) 7,390 14,149 15,095
Human Development Index (value and rank) .. 0.5142 (156) 0.5190 (158)
Total employment (as a share of the population) 81.5 85.6 84.9
Share of women in total employment 48.9 48.9 48.8
Proportion of population below international poverty line – SDG 1. Indicator 1.1.1 (1997) 65.4 (2012) 77.6
Gini index, latest available year (1997) 39.5 (2012) 42.7
Prevalence of undernourishment (per cent) – SDG 2. Indicator 2.1.1 34.4 43.1
Value added of agriculture/industry/services (as a share of GDP) 38/11/51 34/12/55 35/8/57
Employment in agriculture/industry/services (as a share of total employment) 78/5/17 74/9/18 74/9/16
Share of women in agriculture/industry/services 50/41/47 47/51/55 47/51/55
Institutional quality index, 2018 0.2615
Control of corruption –0.37 –0.88 –1.05
Rule of law –0.40 –0.80 –0.86
MERCHANDISE AND COMMODITY EXPORT DEPENDENCE
COMMODITY IMPORT DEPENDENCE
OTHER STRUCTURAL INDICATORS
KEY SOCIOECONOMIC INDICATORS](https://image.slidesharecdn.com/stateofcommoditydependance2019-190524115214/85/State-of-commodity-dependance-2019-137-320.jpg)
![Table of contents Introduction
Chapter 1
Key Findings
from the Report
Chapter 2
Country Statistical
Profiles
List of Country
Statistical Profiles
132
MALAWI*
1995 2013-2017 2017
Merchandise export value (millions of US dollars) 433 1,125 970
Unallocated exports (as a share of merchandise exports) 0.3 1.4 –
Merchandise export concentration by product line (Herfindahl-Hirschmann index) 0.6559 0.4633 0.4477
Commodity export value (millions of US dollars) 386 925 770
Commodity exports (as a share of total merchandise exports) 89 82 79
Commodity exports (as a share of GDP) 15.6 16.0 12.8
Total natural resources rents (as a share of GDP) 18.3 9.6 11.1
Exports by commodity group (as a share of merchandise exports) 89 82 79
Agricultural commodities 89 80 79
Fuels – – –
Ores, metals, precious stones and non-monetary gold – 2 1
Three leading commodity exports (as a share of total merchandise exports) 78 62 61
[121] Tobacco, unmanufactured; tobacco refuse 67 48 46
[061] Sugar, molasses and honey 4 7 7
[074] Tea and mate 6 7 8
Average price index of the leading commodity group exported 80.8 109.0 102.7
Five leading destination markets of commodity exports (as a share of total commodity exports) 62
European Union (28) 38
South Africa 7
Zimbabwe 6
United States of America 6
China 5
Commodity imports (millions of US dollars) 139 597 494
Commodity imports (as a share of total merchandise imports) 28 24 20
Food imports (millions of US dollars and as a share of total merchandise imports) 88 (18) 218 (9) 202 (8)
Fuel imports (millions of US dollars and as a share of total merchandise imports) 33 (7) 224 (9) 147 (6)
Five-leading trading partners for commodity imports (as a share of total commodity imports) 70
Mozambique 19
South Africa 18
Zambia 16
United Arab Emirates 11
European Union (28) 5
Percentage change of GDP measured in constant 2010 prices 9.0 17.8 3.8
GDP per capita measured in constant 2010 US dollars 369 478 485
Population (thousands) 5,345 9,738 10,430
Human Development Index (value and rank) 0.3980 (127) 0.4700 (169) 0.4770 (168)
Total employment (as a share of the population) 71.1 72.6 72.4
Share of women in total employment 49.0 47.5 47.5
Proportion of population below international poverty line – SDG 1. Indicator 1.1.1 (1997) 62.8 (2010) 71.4
Gini index, latest available year (1997) 65.8 (2010) 45.5
Prevalence of undernourishment (per cent) – SDG 2. Indicator 2.1.1 27.1 26.3
Value added of agriculture/industry/services (as a share of GDP) 32/22/46 27/16/57 25/16/59
Employment in agriculture/industry/services (as a share of total employment) 84/10/6 85/8/7 85/8/7
Share of women in agriculture/industry/services 52/43/24 50/38/25 50/38/25
Institutional quality index, 2018 0.3220
Control of corruption –0.32 –0.71 –0.65
Rule of law –0.38 –0.30 –0.37
COMMODITY IMPORT DEPENDENCE
MERCHANDISE AND COMMODITY EXPORT DEPENDENCE
OTHER STRUCTURAL INDICATORS
KEY SOCIOECONOMIC INDICATORS](https://image.slidesharecdn.com/stateofcommoditydependance2019-190524115214/85/State-of-commodity-dependance-2019-138-320.jpg)
![Table of contents Introduction
Chapter 1
Key Findings
from the Report
Chapter 2
Country Statistical
Profiles
List of Country
Statistical Profiles
133
MALAYSIA
1995 2013-2017 2017
Merchandise export value (millions of US dollars) 73,778 213,400 216,000
Unallocated exports (as a share of merchandise exports) 1.3 0.3 0.8
Merchandise export concentration by product line (Herfindahl-Hirschmann index) 0.1792 0.1771 0.1920
Commodity export value (millions of US dollars) 17,866 75,158 71,292
Commodity exports (as a share of total merchandise exports) 24 35 33
Commodity exports (as a share of GDP) 20.1 24.0 22.7
Total natural resources rents (as a share of GDP) 12.8 6.0 4.3
Exports by commodity group (as a share of merchandise exports) 24 35 33
Agricultural commodities 16 13 13
Fuels 7 18 15
Ores, metals, precious stones and non-monetary gold 2 4 5
Three leading commodity exports (as a share of total merchandise exports) 8 19 15
[334] Petroleum oils or bituminous minerals 70 % oil 1 7 6
[343] Natural gas, whether or not liquefied 2 6 4
[422] Fixed vegetable fats oils, crude, refined, fract. 5 5 5
Average price index of the leading commodity group exported 36.5 132.1 103.8
Five leading destination markets of commodity exports (as a share of total commodity exports) 54
Japan 15
Singapore 13
China 13
India 7
Australia 6
Commodity imports (millions of US dollars) 10,916 59,222 57,191
Commodity imports (as a share of total merchandise imports) 14 31 30
Food imports (millions of US dollars and as a share of total merchandise imports) 3,460 (4) 14,401 (8) 14,604 (8)
Fuel imports (millions of US dollars and as a share of total merchandise imports) 1,736 (2) 26,466 (14) 24,740 (13)
Five-leading trading partners for commodity imports (as a share of total commodity imports) 46
Singapore 17
Indonesia 9
China 7
Australia 7
United Arab Emirates 6
Percentage change of GDP measured in constant 2010 prices 9.8 23.0 5.9
GDP per capita measured in constant 2010 US dollars 6,275 10,734 11,521
Population (thousands) 13,203 23,002 23,935
Human Development Index (value and rank) 0.6830 (55) 0.7942 (57) 0.8020 (55)
Total employment (as a share of the population) 59.9 62.2 62.3
Share of women in total employment 35.6 37.5 37.9
Proportion of population below international poverty line – SDG 1. Indicator 1.1.1 (1995) 1.8 (2015) –
Gini index, latest available year (1995) 48.5 (2015) 41.0
Prevalence of undernourishment (per cent) – SDG 2. Indicator 2.1.1 2.8 2.9
Value added of agriculture/industry/services (as a share of GDP) 13/40/47 9/40/51 9/40/51
Employment in agriculture/industry/services (as a share of total employment) 20/32/48 12/28/60 11/27/62
Share of women in agriculture/industry/services 30/34/39 24/27/45 22/27/45
Institutional quality index, 2018 0.6488
Control of corruption 0.38 0.22 0.03
Rule of law 0.52 0.49 0.41
COMMODITY IMPORT DEPENDENCE
MERCHANDISE AND COMMODITY EXPORT DEPENDENCE
KEY SOCIOECONOMIC INDICATORS
OTHER STRUCTURAL INDICATORS](https://image.slidesharecdn.com/stateofcommoditydependance2019-190524115214/85/State-of-commodity-dependance-2019-139-320.jpg)
![Table of contents Introduction
Chapter 1
Key Findings
from the Report
Chapter 2
Country Statistical
Profiles
List of Country
Statistical Profiles
134
MALDIVES
1995 2013-2017 2017
Merchandise export value (millions of US dollars) 85 289 318
Unallocated exports (as a share of merchandise exports) 1.1 1.0 –
Merchandise export concentration by product line (Herfindahl-Hirschmann index) 0.3452 0.7116 0.6676
Commodity export value (millions of US dollars) 59 272 299
Commodity exports (as a share of total merchandise exports) 69 94 94
Commodity exports (as a share of GDP) 10.4 6.9 6.6
Total natural resources rents (as a share of GDP) – – –
Exports by commodity group (as a share of merchandise exports) 69 94 94
Agricultural commodities 69 86 78
Fuels – 7 15
Ores, metals, precious stones and non-monetary gold – 1 1
Three leading commodity exports (as a share of total merchandise exports) 66 96 92
[03] Fishery products 66 79 77
[344] Petroleum gases, other gaseous hydrocarbons, n.e.s. – 16 15
[411] Animals oils and fats – 1 –
Average price index of the leading commodity group exported 80.8 109.0 102.7
Five leading destination markets of commodity exports (as a share of total commodity exports) 88
European Union (28) 38
Thailand 25
Sri Lanka 12
United States of America 10
Japan 4
Commodity imports (millions of US dollars) 105 938 1,017
Commodity imports (as a share of total merchandise imports) 39 46 43
Food imports (millions of US dollars and as a share of total merchandise imports) 53 (20) 385 (19) 462 (20)
Fuel imports (millions of US dollars and as a share of total merchandise imports) 30 (11) 393 (19) 353 (15)
Five-leading trading partners for commodity imports (as a share of total commodity imports) 74
United Arab Emirates 35
India 13
Singapore 13
Malaysia 7
European Union (28) 7
Percentage change of GDP measured in constant 2010 prices 7.1 24.6 4.8
GDP per capita measured in constant 2010 US dollars 4,601 8,214 8,648
Population (thousands) 136 319 334
Human Development Index (value and rank) 0.5390 (102) 0.7080 (100) 0.7170 (99)
Total employment (as a share of the population) 50.7 62.8 62.6
Share of women in total employment 27.5 28.1 26.8
Proportion of population below international poverty line – SDG 1. Indicator 1.1.1 (2002) 10.0 (2009) 7.3
Gini index, latest available year (2002) 41.3 (2009) 38.4
Prevalence of undernourishment (per cent) – SDG 2. Indicator 2.1.1 14.0 11.0
Value added of agriculture/industry/services (as a share of GDP) 7/10/83 6/10/84 7/11/82
Employment in agriculture/industry/services (as a share of total employment) 23/25/52 8/24/68 7/25/68
Share of women in agriculture/industry/services 12/47/25 10/28/30 9/26/29
Institutional quality index, 2018 0.2745
Control of corruption –0.32 –0.61 –0.79
Rule of law 0.02 –0.58 –0.62
COMMODITY IMPORT DEPENDENCE
MERCHANDISE AND COMMODITY EXPORT DEPENDENCE
KEY SOCIOECONOMIC INDICATORS
OTHER STRUCTURAL INDICATORS](https://image.slidesharecdn.com/stateofcommoditydependance2019-190524115214/85/State-of-commodity-dependance-2019-140-320.jpg)
![Table of contents Introduction
Chapter 1
Key Findings
from the Report
Chapter 2
Country Statistical
Profiles
List of Country
Statistical Profiles
135
MALI*
1995 2013-2017 2017
Merchandise export value (millions of US dollars) 443 2,743 3,009
Unallocated exports (as a share of merchandise exports) 0.5 0.1 0.2
Merchandise export concentration by product line (Herfindahl-Hirschmann index) 0.7158 0.6702 0.6184
Commodity export value (millions of US dollars) 407 2,494 2,688
Commodity exports (as a share of total merchandise exports) 92 91 89
Commodity exports (as a share of GDP) 14.4 17.8 17.6
Total natural resources rents (as a share of GDP) 6.4 12.3 12.6
Exports by commodity group (as a share of merchandise exports) 92 91 89
Agricultural commodities 83 22 27
Fuels 1 1 1
Ores, metals, precious stones and non-monetary gold 8 68 62
Three leading commodity exports (as a share of total merchandise exports) 87 84 82
[971] Gold, non-monetary (excluding gold ores and concentrates) 8 68 62
[263] Cotton 73 12 16
[001] Live animals other than animals of division 03 6 4 3
Average price index of the leading commodity group exported 33.4 110.1 107.6
Five leading destination markets of commodity exports (as a share of total commodity exports) 80
United Arab Emirates 41
Switzerland 18
South Africa 13
Côte d'Ivoire 4
Bangladesh 4
Commodity imports (millions of US dollars) 289 1,379 1,558
Commodity imports (as a share of total merchandise imports) 37 36 35
Food imports (millions of US dollars and as a share of total merchandise imports) 147 (19) 516 (13) 594 (13)
Fuel imports (millions of US dollars and as a share of total merchandise imports) 121 (16) 743 (19) 811 (18)
Five-leading trading partners for commodity imports (as a share of total commodity imports) 79
Senegal 32
Côte d'Ivoire 22
European Union (28) 12
Benin 7
Ghana 5
Percentage change of GDP measured in constant 2010 prices 37.2 36.4 5.3
GDP per capita measured in constant 2010 US dollars 288 907 973
Population (thousands) 5,125 9,118 9,696
Human Development Index (value and rank) 0.2620 (143) 0.4176 (179) 0.4270 (179)
Total employment (as a share of the population) 48.9 65.8 65.9
Share of women in total employment 36.0 42.5 42.7
Proportion of population below international poverty line – SDG 1. Indicator 1.1.1 (2001) 58.5 (2009) 49.7
Gini index, latest available year (2001) 39.9 (2009) 33.0
Prevalence of undernourishment (per cent) – SDG 2. Indicator 2.1.1 14.6 6.0
Value added of agriculture/industry/services (as a share of GDP) 39/18/43 39/20/41 40/19/41
Employment in agriculture/industry/services (as a share of total employment) 50/15/35 63/8/29 58/8/34
Share of women in agriculture/industry/services 27/35/49 42/32/47 42/29/47
Institutional quality index, 2018 0.3177
Control of corruption –0.78 –0.70 –0.63
Rule of law –0.30 –0.74 –0.78
COMMODITY IMPORT DEPENDENCE
MERCHANDISE AND COMMODITY EXPORT DEPENDENCE
OTHER STRUCTURAL INDICATORS
KEY SOCIOECONOMIC INDICATORS](https://image.slidesharecdn.com/stateofcommoditydependance2019-190524115214/85/State-of-commodity-dependance-2019-141-320.jpg)
![Table of contents Introduction
Chapter 1
Key Findings
from the Report
Chapter 2
Country Statistical
Profiles
List of Country
Statistical Profiles
136
MALTA
1995 2013-2017 2017
Merchandise export value (millions of US dollars) 1,913 2,966 2,516
Unallocated exports (as a share of merchandise exports) 1.1 1.3 –
Merchandise export concentration by product line (Herfindahl-Hirschmann index) 0.4591 0.3469 0.2427
Commodity export value (millions of US dollars) 156 1,097 608
Commodity exports (as a share of total merchandise exports) 8 37 24
Commodity exports (as a share of GDP) 4.2 10.0 5.0
Total natural resources rents (as a share of GDP) – – –
Exports by commodity group (as a share of merchandise exports) 8 37 24
Agricultural commodities 2 6 10
Fuels 5 30 13
Ores, metals, precious stones and non-monetary gold 1 1 1
Three leading commodity exports (as a share of total merchandise exports) 6 33 18
[334] Petroleum oils or bituminous minerals 70 % oil 5 28 11
[03] Fishery products – 3 5
[098] Edible products and preparations, n.e.s. 1 2 2
Average price index of the leading commodity group exported 36.5 132.1 103.8
Five leading destination markets of commodity exports (as a share of total commodity exports) 74
European Union (28) 24
Egypt 24
Republic of Korea 10
Japan 10
Tunisia 5
Commodity imports (millions of US dollars) 621 2,503 2,199
Commodity imports (as a share of total merchandise imports) 21 40 38
Food imports (millions of US dollars and as a share of total merchandise imports) 212 (7) 387 (6) 567 (10)
Fuel imports (millions of US dollars and as a share of total merchandise imports) 313 (11) 1,953 (31) 1,444 (25)
Five-leading trading partners for commodity imports (as a share of total commodity imports) 84
European Union (28) 44
Russian Federation 25
United States of America 7
Turkey 6
Egypt 2
Percentage change of GDP measured in constant 2010 prices 6.3 22.8 6.6
GDP per capita measured in constant 2010 US dollars 14,624 25,652 28,763
Population (thousands) 297 365 369
Human Development Index (value and rank) 0.7590 (33) 0.8684 (27) 0.8780 (27)
Total employment (as a share of the population) 46.8 51.2 52.3
Share of women in total employment 28.8 38.3 38.9
Proportion of population below international poverty line – SDG 1. Indicator 1.1.1 (2006) 0.5 (2015) –
Gini index, latest available year (2006) 28.0 (2015) 29.4
Prevalence of undernourishment (per cent) – SDG 2. Indicator 2.1.1 2.5 2.5
Value added of agriculture/industry/services (as a share of GDP) 3/28/69 1/15/84 1/14/85
Employment in agriculture/industry/services (as a share of total employment) 3/34/63 1/20/78 1/19/79
Share of women in agriculture/industry/services –/23/33 10/18/44 7/18/44
Institutional quality index, 2018 0.7764
Control of corruption 0.48 0.84 0.74
Rule of law 1.05 1.16 1.14
KEY SOCIOECONOMIC INDICATORS
OTHER STRUCTURAL INDICATORS
COMMODITY IMPORT DEPENDENCE
MERCHANDISE AND COMMODITY EXPORT DEPENDENCE](https://image.slidesharecdn.com/stateofcommoditydependance2019-190524115214/85/State-of-commodity-dependance-2019-142-320.jpg)
![Table of contents Introduction
Chapter 1
Key Findings
from the Report
Chapter 2
Country Statistical
Profiles
List of Country
Statistical Profiles
137
MARSHALL ISLANDS
1995 2013-2017 2017
Merchandise export value (millions of US dollars) 23 53 45
Unallocated exports (as a share of merchandise exports) 23.3 3.7 7.2
Merchandise export concentration by product line (Herfindahl-Hirschmann index) 0.5004 0.6932 0.5919
Commodity export value (millions of US dollars) 14 11 6
Commodity exports (as a share of total merchandise exports) 59 20 13
Commodity exports (as a share of GDP) 11.3 5.8 3.1
Total natural resources rents (as a share of GDP) – – –
Exports by commodity group (as a share of merchandise exports) 59 20 13
Agricultural commodities 59 16 8
Fuels – 4 4
Ores, metals, precious stones and non-monetary gold – – –
Three leading commodity exports (as a share of total merchandise exports) 50 21 12
[03] Fishery products 50 16 8
[334] Petroleum oils or bituminous minerals 70 % oil – 3 2
[321] Coal, whether or not pulverized, not agglomerated – 2 2
Average price index of the leading commodity group exported 80.8 109.0 102.7
Five leading destination markets of commodity exports (as a share of total commodity exports) 75
China 28
Thailand 25
Japan 10
United States of America 9
Republic of Korea 4
Commodity imports (millions of US dollars) 3 3 4
Commodity imports (as a share of total merchandise imports) 3 2 3
Food imports (millions of US dollars and as a share of total merchandise imports) 1.3 (1.7) 0.2 (0.2) 0.2 (0.2)
Fuel imports (millions of US dollars and as a share of total merchandise imports) 0.49 (1) 3 (2) 3 (2)
Five-leading trading partners for commodity imports (as a share of total commodity imports) 88
China 60
United States of America 8
European Union (28) 7
Turkey 7
South Africa 6
Percentage change of GDP measured in constant 2010 prices 8.2 7.1 1.0
GDP per capita measured in constant 2010 US dollars 3,136 3,389 3,468
Population (thousands) .. .. ..
Human Development Index (value and rank) .. 0.7080 (100) 0.7080 (104)
Total employment (as a share of the population) .. .. ..
Share of women in total employment .. .. ..
Proportion of population below international poverty line – SDG 1. Indicator 1.1.1 .. ..
Gini index, latest available year .. ..
Prevalence of undernourishment (per cent) – SDG 2. Indicator 2.1.1 .. ..
Value added of agriculture/industry/services (as a share of GDP) 10/14/76 17/11/72 17/11/72
Employment in agriculture/industry/services (as a share of total employment) .. .. ..
Share of women in agriculture/industry/services .. .. ..
Institutional quality index, 2018 0.4995
Control of corruption .. –0.06 –
Rule of law –0.20 –0.05 0.14
COMMODITY IMPORT DEPENDENCE
MERCHANDISE AND COMMODITY EXPORT DEPENDENCE
OTHER STRUCTURAL INDICATORS
KEY SOCIOECONOMIC INDICATORS](https://image.slidesharecdn.com/stateofcommoditydependance2019-190524115214/85/State-of-commodity-dependance-2019-143-320.jpg)
![Table of contents Introduction
Chapter 1
Key Findings
from the Report
Chapter 2
Country Statistical
Profiles
List of Country
Statistical Profiles
138
MAURITANIA*
1995 2013-2017 2017
Merchandise export value (millions of US dollars) 509 1,837 1,722
Unallocated exports (as a share of merchandise exports) 0.2 0.8 0.1
Merchandise export concentration by product line (Herfindahl-Hirschmann index) 0.5257 0.3988 0.3668
Commodity export value (millions of US dollars) 502 1,794 1,689
Commodity exports (as a share of total merchandise exports) 99 98 98
Commodity exports (as a share of GDP) 29.9 35.2 33.5
Total natural resources rents (as a share of GDP) 7.3 30.3 26.2
Exports by commodity group (as a share of merchandise exports) 98 98 98
Agricultural commodities 60 34 44
Fuels – 6 4
Ores, metals, precious stones and non-monetary gold 38 58 50
Three leading commodity exports (as a share of total merchandise exports) 97 75 77
[281] Iron ore and concentrates 37 35 28
[03] Fishery products 59 29 36
[971] Gold, non-monetary (excluding gold ores and concentrates) 1 12 13
Average price index of the leading commodity group exported 44.4 116.0 116.4
Five leading destination markets of commodity exports (as a share of total commodity exports) 82
China 39
European Union (28) 22
Switzerland 12
Japan 5
Nigeria 3
Commodity imports (millions of US dollars) 182 921 721
Commodity imports (as a share of total merchandise imports) 40 40 34
Food imports (millions of US dollars and as a share of total merchandise imports) 100 (22) 480 (21) 441 (21)
Fuel imports (millions of US dollars and as a share of total merchandise imports) 58 (13) 397 (17) 237 (11)
Five-leading trading partners for commodity imports (as a share of total commodity imports) 71
European Union (28) 33
United Arab Emirates 24
Brazil 7
China 4
Morocco 4
Percentage change of GDP measured in constant 2010 prices –2.4 20.2 3.8
GDP per capita measured in constant 2010 US dollars 1,002 1,316 1,325
Population (thousands) 1,296 2,498 2,655
Human Development Index (value and rank) 0.4180 (121) 0.5144 (155) 0.5200 (156)
Total employment (as a share of the population) 46.2 44.5 44.6
Share of women in total employment 28.2 30.3 30.3
Proportion of population below international poverty line – SDG 1. Indicator 1.1.1 (1995) 20.6 (2014) 6.0
Gini index, latest available year (1995) 37.8 (2014) 32.6
Prevalence of undernourishment (per cent) – SDG 2. Indicator 2.1.1 11.6 11.3
Value added of agriculture/industry/services (as a share of GDP) 44/25/32 23/36/40 23/36/40
Employment in agriculture/industry/services (as a share of total employment) 80/6/13 76/8/16 76/7/17
Share of women in agriculture/industry/services 31/13/18 33/15/22 34/15/22
Institutional quality index, 2018 0.2191
Control of corruption –0.56 –0.83 –0.75
Rule of law –0.50 –0.81 –0.60
OTHER STRUCTURAL INDICATORS
MERCHANDISE AND COMMODITY EXPORT DEPENDENCE
KEY SOCIOECONOMIC INDICATORS
COMMODITY IMPORT DEPENDENCE](https://image.slidesharecdn.com/stateofcommoditydependance2019-190524115214/85/State-of-commodity-dependance-2019-144-320.jpg)
![Table of contents Introduction
Chapter 1
Key Findings
from the Report
Chapter 2
Country Statistical
Profiles
List of Country
Statistical Profiles
139
MAURITIUS
1995 2013-2017 2017
Merchandise export value (millions of US dollars) 1,538 2,548 2,103
Unallocated exports (as a share of merchandise exports) – 7.5 –
Merchandise export concentration by product line (Herfindahl-Hirschmann index) 0.3580 0.2178 0.2097
Commodity export value (millions of US dollars) 486 980 980
Commodity exports (as a share of total merchandise exports) 32 38 47
Commodity exports (as a share of GDP) 11.4 7.9 7.5
Total natural resources rents (as a share of GDP) – – –
Exports by commodity group (as a share of merchandise exports) 32 38 47
Agricultural commodities 30 33 40
Fuels – 1 2
Ores, metals, precious stones and non-monetary gold 2 5 5
Three leading commodity exports (as a share of total merchandise exports) 28 30 35
[03] Fishery products 2 17 20
[061] Sugar, molasses and honey 24 10 12
[667] Pearls, precious semi-precious stones 2 4 3
Average price index of the leading commodity group exported 80.8 109.0 102.7
Five leading destination markets of commodity exports (as a share of total commodity exports) 84
European Union (28) 65
Viet Nam 7
United States of America 6
Madagascar 4
Taiwan, Province of China 3
Commodity imports (millions of US dollars) 594 2,323 2,438
Commodity imports (as a share of total merchandise imports) 30 46 46
Food imports (millions of US dollars and as a share of total merchandise imports) 320 (16) 1,041 (21) 1,148 (22)
Fuel imports (millions of US dollars and as a share of total merchandise imports) 138 (7) 888 (17) 888 (17)
Five-leading trading partners for commodity imports (as a share of total commodity imports) 67
India 32
European Union (28) 18
South Africa 9
Australia 5
United Arab Emirates 3
Percentage change of GDP measured in constant 2010 prices 4.4 15.4 3.5
GDP per capita measured in constant 2010 US dollars 4,546 9,506 10,147
Population (thousands) 818 1,016 1,033
Human Development Index (value and rank) 0.6480 (71) 0.7828 (62) 0.7900 (63)
Total employment (as a share of the population) 54.2 54.5 54.5
Share of women in total employment 31.6 37.3 37.7
Proportion of population below international poverty line – SDG 1. Indicator 1.1.1 (2006) 0.4 (2012) 0.5
Gini index, latest available year (2006) 35.7 (2012) 35.8
Prevalence of undernourishment (per cent) – SDG 2. Indicator 2.1.1 6.6 5.8
Value added of agriculture/industry/services (as a share of GDP) 10/31/59 4/22/74 4/21/76
Employment in agriculture/industry/services (as a share of total employment) 14/40/46 8/26/67 7/26/67
Share of women in agriculture/industry/services 28/33/31 30/25/43 32/24/44
Institutional quality index, 2018 0.7950
Control of corruption 0.03 0.27 0.20
Rule of law 0.90 0.83 0.68
MERCHANDISE AND COMMODITY EXPORT DEPENDENCE
COMMODITY IMPORT DEPENDENCE
OTHER STRUCTURAL INDICATORS
KEY SOCIOECONOMIC INDICATORS](https://image.slidesharecdn.com/stateofcommoditydependance2019-190524115214/85/State-of-commodity-dependance-2019-145-320.jpg)
![Table of contents Introduction
Chapter 1
Key Findings
from the Report
Chapter 2
Country Statistical
Profiles
List of Country
Statistical Profiles
140
MEXICO
1995 2013-2017 2017
Merchandise export value (millions of US dollars) 79,541 388,200 409,451
Unallocated exports (as a share of merchandise exports) 0.1 1.2 1.3
Merchandise export concentration by product line (Herfindahl-Hirschmann index) 0.1225 0.1298 0.1319
Commodity export value (millions of US dollars) 17,798 74,727 71,604
Commodity exports (as a share of total merchandise exports) 22 19 17
Commodity exports (as a share of GDP) 4.9 6.2 6.2
Total natural resources rents (as a share of GDP) 3.1 3.9 2.6
Exports by commodity group (as a share of merchandise exports) 22 19 17
Agricultural commodities 9 7 8
Fuels 10 8 6
Ores, metals, precious stones and non-monetary gold 3 4 4
Three leading commodity exports (as a share of total merchandise exports) 12 10 8
[333] Petroleum oils, oils from bitumin. materials, crude 9 7 5
[054] Vegetables 2 2 2
[971] Gold, non-monetary (excluding gold ores and concentrates) 0 1 1
Average price index of the leading commodity group exported 36.5 132.1 103.8
Five leading destination markets of commodity exports (as a share of total commodity exports) 87
United States of America 67
European Union (28) 11
China 4
India 3
Republic of Korea 2
Commodity imports (millions of US dollars) 9,446 68,778 75,044
Commodity imports (as a share of total merchandise imports) 13 17 18
Food imports (millions of US dollars and as a share of total merchandise imports) 4,440 (6) 23,485 (6) 23,789 (6)
Fuel imports (millions of US dollars and as a share of total merchandise imports) 1,502 (2) 30,636 (8) 35,530 (8)
Five-leading trading partners for commodity imports (as a share of total commodity imports) 89
United States of America 75
European Union (28) 7
Canada 4
China 2
Chile 1
Percentage change of GDP measured in constant 2010 prices –6.3 12.1 2.3
GDP per capita measured in constant 2010 US dollars 7,522 9,700 9,972
Population (thousands) 59,990 91,264 94,719
Human Development Index (value and rank) 0.6690 (60) 0.7660 (73) 0.7740 (72)
Total employment (as a share of the population) 55.7 58.8 59.2
Share of women in total employment 31.5 36.3 36.4
Proportion of population below international poverty line – SDG 1. Indicator 1.1.1 (1996) 11.2 (2016) 2.5
Gini index, latest available year (1996) 48.2 (2016) 43.4
Prevalence of undernourishment (per cent) – SDG 2. Indicator 2.1.1 4.4 3.8
Value added of agriculture/industry/services (as a share of GDP) 5/34/61 3/32/64 4/31/65
Employment in agriculture/industry/services (as a share of total employment) 24/22/54 13/25/62 13/26/61
Share of women in agriculture/industry/services 13/22/43 10/24/47 10/24/47
Institutional quality index, 2018 0.4878
Control of corruption –0.51 –0.74 –0.93
Rule of law –0.73 –0.51 –0.57
OTHER STRUCTURAL INDICATORS
KEY SOCIOECONOMIC INDICATORS
COMMODITY IMPORT DEPENDENCE
MERCHANDISE AND COMMODITY EXPORT DEPENDENCE](https://image.slidesharecdn.com/stateofcommoditydependance2019-190524115214/85/State-of-commodity-dependance-2019-146-320.jpg)
![Table of contents Introduction
Chapter 1
Key Findings
from the Report
Chapter 2
Country Statistical
Profiles
List of Country
Statistical Profiles
141
MICRONESIA (FEDERATED STATES OF)
1995 2013-2017 2017
Merchandise export value (millions of US dollars) 21 60 120
Unallocated exports (as a share of merchandise exports) 4.6 0.7 0.5
Merchandise export concentration by product line (Herfindahl-Hirschmann index) 0.8309 0.7451 0.7481
Commodity export value (millions of US dollars) 18 56 111
Commodity exports (as a share of total merchandise exports) 87 93 92
Commodity exports (as a share of GDP) 8.0 17.4 33.5
Total natural resources rents (as a share of GDP) – – –
Exports by commodity group (as a share of merchandise exports) 87 93 92
Agricultural commodities 87 93 92
Fuels – – –
Ores, metals, precious stones and non-monetary gold – – –
Three leading commodity exports (as a share of total merchandise exports) - 14 13
[057] Fruits and nuts (excluding oil nuts), fresh or dried – 11 10
[054] Vegetables – 1 1
[098] Edible products and preparations, n.e.s. – 1 1
Average price index of the leading commodity group exported 80.8 109.0 102.7
Five leading destination markets of commodity exports (as a share of total commodity exports) 98
Thailand 76
Guam 16
United States of America 3
European Union (28) 1
Marshall Islands 1
Commodity imports (millions of US dollars) 37 101 111
Commodity imports (as a share of total merchandise imports) 41 58 57
Food imports (millions of US dollars and as a share of total merchandise imports) 28 (32) 44 (25) 47 (24)
Fuel imports (millions of US dollars and as a share of total merchandise imports) 1 (1) 48 (27) 53 (27)
Five-leading trading partners for commodity imports (as a share of total commodity imports) 85
United States of America 31
Guam 31
Republic of Korea 14
Singapore 5
Australia 4
Percentage change of GDP measured in constant 2010 prices 4.2 –1.3 1.0
GDP per capita measured in constant 2010 US dollars 2,720 2,800 2,835
Population (thousands) .. .. ..
Human Development Index (value and rank) .. 0.6236 (128) 0.6270 (128)
Total employment (as a share of the population) .. .. ..
Share of women in total employment .. .. ..
Proportion of population below international poverty line – SDG 1. Indicator 1.1.1 (2005) 8.5 (2013) 16.0
Gini index, latest available year (2005) 42.4 (2013) 40.1
Prevalence of undernourishment (per cent) – SDG 2. Indicator 2.1.1 .. ..
Value added of agriculture/industry/services (as a share of GDP) 25/7/68 27/7/66 27/7/66
Employment in agriculture/industry/services (as a share of total employment) .. .. ..
Share of women in agriculture/industry/services .. .. ..
Institutional quality index, 2018 0.4757
Control of corruption .. 0.53 0.75
Rule of law 0.81 –0.11 0.01
MERCHANDISE AND COMMODITY EXPORT DEPENDENCE
COMMODITY IMPORT DEPENDENCE
OTHER STRUCTURAL INDICATORS
KEY SOCIOECONOMIC INDICATORS](https://image.slidesharecdn.com/stateofcommoditydependance2019-190524115214/85/State-of-commodity-dependance-2019-147-320.jpg)
![Table of contents Introduction
Chapter 1
Key Findings
from the Report
Chapter 2
Country Statistical
Profiles
List of Country
Statistical Profiles
142
MONGOLIA
1995 2013-2017 2017
Merchandise export value (millions of US dollars) 473 5,166 6,201
Unallocated exports (as a share of merchandise exports) – 0.1 –
Merchandise export concentration by product line (Herfindahl-Hirschmann index) 0.4831 0.4381 0.4550
Commodity export value (millions of US dollars) 425 5,030 6,068
Commodity exports (as a share of total merchandise exports) 90 97 98
Commodity exports (as a share of GDP) 25.3 42.8 54.6
Total natural resources rents (as a share of GDP) 15.2 22.6 23.2
Exports by commodity group (as a share of merchandise exports) 90 97 98
Agricultural commodities 30 6 6
Fuels – 28 27
Ores, metals, precious stones and non-monetary gold 60 63 64
Three leading commodity exports (as a share of total merchandise exports) 48 68 72
[283] Copper ores and concentrates; copper mattes, cemen 48 39 42
[321] Coal, whether or not pulverized, not agglomerated – 19 20
[971] Gold, non-monetary (excluding gold ores and concentrates) – 10 10
Average price index of the leading commodity group exported 44.4 116.0 116.4
Five leading destination markets of commodity exports (as a share of total commodity exports) 98
China 85
European Union (28) 7
Switzerland 4
Russian Federation 1
Commodity imports (millions of US dollars) 145 1,644 1,535
Commodity imports (as a share of total merchandise imports) 35 36 36
Food imports (millions of US dollars and as a share of total merchandise imports) 52 (13) 407 (9) 418 (10)
Fuel imports (millions of US dollars and as a share of total merchandise imports) 80 (19) 1,104 (24) 979 (23)
Five-leading trading partners for commodity imports (as a share of total commodity imports) 88
Russian Federation 61
China 15
Republic of Korea 5
European Union (28) 5
Kazakhstan 2
Percentage change of GDP measured in constant 2010 prices 6.3 36.3 5.1
GDP per capita measured in constant 2010 US dollars 1,453 3,887 4,029
Population (thousands) 1,410 2,117 2,163
Human Development Index (value and rank) 0.5550 (98) 0.7368 (90) 0.7410 (90)
Total employment (as a share of the population) 56.3 56.5 55.2
Share of women in total employment 45.7 45.7 45.9
Proportion of population below international poverty line – SDG 1. Indicator 1.1.1 (1995) 13.9 (2016) 0.5
Gini index, latest available year (1995) 33.2 (2016) 32.4
Prevalence of undernourishment (per cent) – SDG 2. Indicator 2.1.1 35.1 18.7
Value added of agriculture/industry/services (as a share of GDP) 28/34/38 14/35/51 13/35/51
Employment in agriculture/industry/services (as a share of total employment) 55/14/32 29/20/51 30/19/51
Share of women in agriculture/industry/services 45/43/49 43/30/54 42/30/54
Institutional quality index, 2018 0.5227
Control of corruption 0.11 –0.48 –0.45
Rule of law 0.20 –0.32 –0.30
OTHER STRUCTURAL INDICATORS
KEY SOCIOECONOMIC INDICATORS
COMMODITY IMPORT DEPENDENCE
MERCHANDISE AND COMMODITY EXPORT DEPENDENCE](https://image.slidesharecdn.com/stateofcommoditydependance2019-190524115214/85/State-of-commodity-dependance-2019-148-320.jpg)
![Table of contents Introduction
Chapter 1
Key Findings
from the Report
Chapter 2
Country Statistical
Profiles
List of Country
Statistical Profiles
143
MONTENEGRO
1995 2013-2017 2017
Merchandise export value (millions of US dollars) .. 413 421
Unallocated exports (as a share of merchandise exports) .. – –
Merchandise export concentration by product line (Herfindahl-Hirschmann index) .. 0.2356 0.2073
Commodity export value (millions of US dollars) .. 319 300
Commodity exports (as a share of total merchandise exports) .. 77 71
Commodity exports (as a share of GDP) .. 7.2 6.3
Total natural resources rents (as a share of GDP) .. 0.8 0.8
Exports by commodity group (as a share of merchandise exports) .. 77 71
Agricultural commodities .. 26 21
Fuels .. 18 12
Ores, metals, precious stones and non-monetary gold .. 33 38
Three leading commodity exports (as a share of total merchandise exports) .. 42 34
[684] Aluminium .. 21 19
[351] Electric current .. 13 6
[24 + 25] Forestry products .. 8 8
Average price index of the leading commodity group exported .. 116.0 116.4
Five leading destination markets of commodity exports (as a share of total commodity exports) 85
European Union (28) 38
Serbia 28
Bosnia and Herzegovina 10
Turkey 5
Albania 5
Commodity imports (millions of US dollars) .. 916 947
Commodity imports (as a share of total merchandise imports) .. 39 36
Food imports (millions of US dollars and as a share of total merchandise imports) .. 490 (21) 501 (19)
Fuel imports (millions of US dollars and as a share of total merchandise imports) .. 275 (12) 290 (11)
Five-leading trading partners for commodity imports (as a share of total commodity imports) 93
European Union (28) 47
Serbia 34
Bosnia and Herzegovina 8
Republic of North Macedonia 2
Albania 2
Percentage change of GDP measured in constant 2010 prices .. 8.7 4.0
GDP per capita measured in constant 2010 US dollars .. 7,234 7,708
Population (thousands) 475 512 515
Human Development Index (value and rank) .. 0.8082 (48) 0.8140 (48)
Total employment (as a share of the population) 36.6 40.2 40.6
Share of women in total employment 39.1 44.6 44.0
Proportion of population below international poverty line – SDG 1. Indicator 1.1.1 (2005) 0.2 (2014) –
Gini index, latest available year (2005) 30.2 (2014) 31.9
Prevalence of undernourishment (per cent) – SDG 2. Indicator 2.1.1 – 2.5
Value added of agriculture/industry/services (as a share of GDP) .. 10/18/72 9/19/72
Employment in agriculture/industry/services (as a share of total employment) 14/26/60 7/18/75 8/18/74
Share of women in agriculture/industry/services 29/29/46 42/19/51 48/19/50
Institutional quality index, 2018 0.5727
Control of corruption .. –0.13 –0.09
Rule of law .. 0.04 0.01
COMMODITY IMPORT DEPENDENCE
MERCHANDISE AND COMMODITY EXPORT DEPENDENCE
OTHER STRUCTURAL INDICATORS
KEY SOCIOECONOMIC INDICATORS](https://image.slidesharecdn.com/stateofcommoditydependance2019-190524115214/85/State-of-commodity-dependance-2019-149-320.jpg)
![Table of contents Introduction
Chapter 1
Key Findings
from the Report
Chapter 2
Country Statistical
Profiles
List of Country
Statistical Profiles
144
MOROCCO
1995 2013-2017 2017
Merchandise export value (millions of US dollars) 6,881 23,206 25,354
Unallocated exports (as a share of merchandise exports) 0.4 0.8 –
Merchandise export concentration by product line (Herfindahl-Hirschmann index) 0.1658 0.1643 0.1671
Commodity export value (millions of US dollars) 2,874 7,467 7,811
Commodity exports (as a share of total merchandise exports) 42 32 31
Commodity exports (as a share of GDP) 7.4 7.0 7.1
Total natural resources rents (as a share of GDP) 0.3 2.5 2.5
Exports by commodity group (as a share of merchandise exports) 42 32 31
Agricultural commodities 30 21 22
Fuels 2 3 2
Ores, metals, precious stones and non-monetary gold 10 8 7
Three leading commodity exports (as a share of total merchandise exports) 23 16 15
[03] Fishery products 14 7 8
[054] Vegetables 4 5 5
[272] Crude fertilizers (excluding those of division 56) 5 4 3
Average price index of the leading commodity group exported 80.8 109.0 102.7
Five leading destination markets of commodity exports (as a share of total commodity exports) 68
European Union (28) 53
United States of America 5
Russian Federation 4
Turkey 3
Brazil 3
Commodity imports (millions of US dollars) 3,726 15,876 14,653
Commodity imports (as a share of total merchandise imports) 37 37 33
Food imports (millions of US dollars and as a share of total merchandise imports) 1,585 (16) 4,834 (11) 5,201 (12)
Fuel imports (millions of US dollars and as a share of total merchandise imports) 1,173 (12) 8,413 (20) 6,513 (14)
Five-leading trading partners for commodity imports (as a share of total commodity imports) 71
European Union (28) 38
United States of America 11
Russian Federation 8
Saudi Arabia 7
Algeria 6
Percentage change of GDP measured in constant 2010 prices –6.6 18.0 4.0
GDP per capita measured in constant 2010 US dollars 1,685 3,319 3,491
Population (thousands) 17,027 25,168 25,949
Human Development Index (value and rank) 0.4890 (110) 0.6558 (120) 0.6670 (120)
Total employment (as a share of the population) 39.6 44.5 44.4
Share of women in total employment 23.9 25.9 25.8
Proportion of population below international poverty line – SDG 1. Indicator 1.1.1 (1998) 7.5 (2013) 1.0
Gini index, latest available year (1998) 39.5 (2013) 39.6
Prevalence of undernourishment (per cent) – SDG 2. Indicator 2.1.1 6.8 3.9
Value added of agriculture/industry/services (as a share of GDP) 15/30/55 14/29/57 14/30/57
Employment in agriculture/industry/services (as a share of total employment) 42/23/35 38/19/43 37/20/43
Share of women in agriculture/industry/services 25/28/20 39/17/18 39/17/18
Institutional quality index, 2018 0.4404
Control of corruption –0.11 –0.22 –0.13
Rule of law 0.22 –0.15 –0.17
OTHER STRUCTURAL INDICATORS
KEY SOCIOECONOMIC INDICATORS
COMMODITY IMPORT DEPENDENCE
MERCHANDISE AND COMMODITY EXPORT DEPENDENCE](https://image.slidesharecdn.com/stateofcommoditydependance2019-190524115214/85/State-of-commodity-dependance-2019-150-320.jpg)
![Table of contents Introduction
Chapter 1
Key Findings
from the Report
Chapter 2
Country Statistical
Profiles
List of Country
Statistical Profiles
145
MOZAMBIQUE*
1995 2013-2017 2017
Merchandise export value (millions of US dollars) 174 4,003 4,719
Unallocated exports (as a share of merchandise exports) 1.1 0.3 0.1
Merchandise export concentration by product line (Herfindahl-Hirschmann index) 0.3352 0.2875 0.2948
Commodity export value (millions of US dollars) 144 3,725 4,492
Commodity exports (as a share of total merchandise exports) 83 93 95
Commodity exports (as a share of GDP) 5.6 26.1 35.5
Total natural resources rents (as a share of GDP) 22.4 12.6 17.2
Exports by commodity group (as a share of merchandise exports) 83 93 95
Agricultural commodities 72 21 18
Fuels 4 35 46
Ores, metals, precious stones and non-monetary gold 6 37 31
Three leading commodity exports (as a share of total merchandise exports) 2 43 55
[684] Aluminium – 26 22
[321] Coal, whether or not pulverized, not agglomerated – 10 17
[325] Coke semi-cokes of coal, lign., peat; retort carbon 2 7 16
Average price index of the leading commodity group exported 44.4 116.0 116.4
Five leading destination markets of commodity exports (as a share of total commodity exports) 79
European Union (28) 37
South Africa 18
India 12
China 11
Malawi 2
Commodity imports (millions of US dollars) 269 3,396 2,966
Commodity imports (as a share of total merchandise imports) 37 45 52
Food imports (millions of US dollars and as a share of total merchandise imports) 180 (25) 951 (13) 816 (14)
Fuel imports (millions of US dollars and as a share of total merchandise imports) 52 (7) 1,830 (24) 1,202 (21)
Five-leading trading partners for commodity imports (as a share of total commodity imports) 65
South Africa 25
India 16
European Union (28) 9
United Arab Emirates 8
Bahrain 6
Percentage change of GDP measured in constant 2010 prices 2.2 28.8 3.3
GDP per capita measured in constant 2010 US dollars 171 502 517
Population (thousands) 8,699 15,367 16,380
Human Development Index (value and rank) 0.2290 (145) 0.4308 (178) 0.4370 (177)
Total employment (as a share of the population) 65.3 59.4 59.0
Share of women in total employment 54.4 53.6 53.5
Proportion of population below international poverty line – SDG 1. Indicator 1.1.1 (1996) 81.6 (2014) 62.9
Gini index, latest available year (1996) 53.6 (2014) 54.0
Prevalence of undernourishment (per cent) – SDG 2. Indicator 2.1.1 40.3 30.5
Value added of agriculture/industry/services (as a share of GDP) 33/14/52 25/20/55 24/21/55
Employment in agriculture/industry/services (as a share of total employment) 85/3/12 74/4/22 73/4/22
Share of women in agriculture/industry/services 59/6/31 62/5/36 62/5/35
Institutional quality index, 2018 0.2051
Control of corruption –0.42 –0.75 –0.86
Rule of law –0.81 –0.91 –1.01
COMMODITY IMPORT DEPENDENCE
OTHER STRUCTURAL INDICATORS
KEY SOCIOECONOMIC INDICATORS
MERCHANDISE AND COMMODITY EXPORT DEPENDENCE](https://image.slidesharecdn.com/stateofcommoditydependance2019-190524115214/85/State-of-commodity-dependance-2019-151-320.jpg)
![Table of contents Introduction
Chapter 1
Key Findings
from the Report
Chapter 2
Country Statistical
Profiles
List of Country
Statistical Profiles
146
MYANMAR*
1995 2013-2017 2017
Merchandise export value (millions of US dollars) 860 12,127 13,879
Unallocated exports (as a share of merchandise exports) 0.3 4.1 1.0
Merchandise export concentration by product line (Herfindahl-Hirschmann index) 0.3001 0.3237 0.2419
Commodity export value (millions of US dollars) 756 9,250 9,371
Commodity exports (as a share of total merchandise exports) 88 76 68
Commodity exports (as a share of GDP) 9.7 14.3 13.9
Total natural resources rents (as a share of GDP) .. 5.3 4.9
Exports by commodity group (as a share of merchandise exports) 88 76 68
Agricultural commodities 80 35 34
Fuels – 34 27
Ores, metals, precious stones and non-monetary gold 7 8 7
Three leading commodity exports (as a share of total merchandise exports) 19 47 33
[343] Natural gas, whether or not liquefied – 32 24
[054] Vegetables 14 9 7
[667] Pearls, precious semi-precious stones 5 6 3
Average price index of the leading commodity group exported 36.5 132.1 103.8
Five leading destination markets of commodity exports (as a share of total commodity exports) 91
China 43
Thailand 34
India 9
China, Hong Kong SAR 3
Singapore 3
Commodity imports (millions of US dollars) 379 4,592 6,559
Commodity imports (as a share of total merchandise imports) 28 29 34
Food imports (millions of US dollars and as a share of total merchandise imports) 179 (13) 1,916 (12) 2,657 (14)
Fuel imports (millions of US dollars and as a share of total merchandise imports) 54 (4) 2,381 (15) 3,540 (18)
Five-leading trading partners for commodity imports (as a share of total commodity imports) 81
Singapore 44
Thailand 11
Malaysia 11
Indonesia 9
India 6
Percentage change of GDP measured in constant 2010 prices 6.9 32.9 6.8
GDP per capita measured in constant 2010 US dollars 207 1,118 1,244
Population (thousands) 28,133 37,818 39,051
Human Development Index (value and rank) 0.3980 (127) 0.5686 (145) 0.5780 (145)
Total employment (as a share of the population) 72.0 65.2 64.6
Share of women in total employment 42.8 40.8 40.7
Proportion of population below international poverty line – SDG 1. Indicator 1.1.1 .. (2015) 6.4
Gini index, latest available year .. (2015) 38.1
Prevalence of undernourishment (per cent) – SDG 2. Indicator 2.1.1 48.3 10.5
Value added of agriculture/industry/services (as a share of GDP) 60/10/30 27/34/39 25/35/40
Employment in agriculture/industry/services (as a share of total employment) 78/11/12 53/16/31 50/17/33
Share of women in agriculture/industry/services 42/48/42 40/35/46 39/35/46
Institutional quality index, 2018 0.1532
Control of corruption –1.50 –0.78 –0.56
Rule of law –1.58 –1.10 –0.95
OTHER STRUCTURAL INDICATORS
MERCHANDISE AND COMMODITY EXPORT DEPENDENCE
COMMODITY IMPORT DEPENDENCE
KEY SOCIOECONOMIC INDICATORS](https://image.slidesharecdn.com/stateofcommoditydependance2019-190524115214/85/State-of-commodity-dependance-2019-152-320.jpg)
![Table of contents Introduction
Chapter 1
Key Findings
from the Report
Chapter 2
Country Statistical
Profiles
List of Country
Statistical Profiles
147
NAMIBIA
1995 2013-2017 2017
Merchandise export value (millions of US dollars) 1,409 4,277 3,994
Unallocated exports (as a share of merchandise exports) 4.2 0.3 0.2
Merchandise export concentration by product line (Herfindahl-Hirschmann index) 0.3354 0.2611 0.2569
Commodity export value (millions of US dollars) 1,131 3,436 3,309
Commodity exports (as a share of total merchandise exports) 80 80 83
Commodity exports (as a share of GDP) 28.7 28.3 26.0
Total natural resources rents (as a share of GDP) 1.5 3.1 4.2
Exports by commodity group (as a share of merchandise exports) 80 80 83
Agricultural commodities 40 27 27
Fuels 2 2 1
Ores, metals, precious stones and non-monetary gold 38 52 55
Three leading commodity exports (as a share of total merchandise exports) 54 46 46
[667] Pearls, precious semi-precious stones 26 22 21
[03] Fishery products 27 16 15
[682] Copper 2 8 10
Average price index of the leading commodity group exported 33.4 110.1 107.6
Five leading destination markets of commodity exports (as a share of total commodity exports) 76
European Union (28) 26
Botswana 20
South Africa 17
Switzerland 9
China 4
Commodity imports (millions of US dollars) 382 2,664 2,709
Commodity imports (as a share of total merchandise imports) 24 36 40
Food imports (millions of US dollars and as a share of total merchandise imports) 211 (13) 712 (10) 736 (11)
Fuel imports (millions of US dollars and as a share of total merchandise imports) 89 (5) 731 (10) 731 (11)
Five-leading trading partners for commodity imports (as a share of total commodity imports) 79
South Africa 45
Botswana 14
European Union (28) 11
Zambia 5
Peru 3
Percentage change of GDP measured in constant 2010 prices 3.9 21.0 –0.8
GDP per capita measured in constant 2010 US dollars 3,660 5,922 5,869
Population (thousands) 959 1,527 1,604
Human Development Index (value and rank) 0.5880 (89) 0.6396 (126) 0.6470 (126)
Total employment (as a share of the population) 45.3 48.3 47.3
Share of women in total employment 44.0 48.4 48.5
Proportion of population below international poverty line – SDG 1. Indicator 1.1.1 (2003) 31.5 (2015) 13.4
Gini index, latest available year (2003) 63.3 (2015) 59.1
Prevalence of undernourishment (per cent) – SDG 2. Indicator 2.1.1 26.2 25.4
Value added of agriculture/industry/services (as a share of GDP) 11/24/65 7/31/62 7/31/62
Employment in agriculture/industry/services (as a share of total employment) 42/15/43 25/17/58 20/20/60
Share of women in agriculture/industry/services 46/25/49 47/18/58 44/18/60
Institutional quality index, 2018 0.5535
Control of corruption 0.81 0.32 0.32
Rule of law 0.25 0.24 0.24
OTHER STRUCTURAL INDICATORS
MERCHANDISE AND COMMODITY EXPORT DEPENDENCE
COMMODITY IMPORT DEPENDENCE
KEY SOCIOECONOMIC INDICATORS](https://image.slidesharecdn.com/stateofcommoditydependance2019-190524115214/85/State-of-commodity-dependance-2019-153-320.jpg)
![Table of contents Introduction
Chapter 1
Key Findings
from the Report
Chapter 2
Country Statistical
Profiles
List of Country
Statistical Profiles
148
NAURU
1995 2013-2017 2017
Merchandise export value (millions of US dollars) 28 25 23
Unallocated exports (as a share of merchandise exports) 0.4 0.5 0.9
Merchandise export concentration by product line (Herfindahl-Hirschmann index) 0.7016 0.6225 0.5123
Commodity export value (millions of US dollars) 20 18 11
Commodity exports (as a share of total merchandise exports) 72 72 50
Commodity exports (as a share of GDP) 58.0 17.2 9.9
Total natural resources rents (as a share of GDP) .. – –
Exports by commodity group (as a share of merchandise exports) 72 72 50
Agricultural commodities 2 3 1
Fuels – – –
Ores, metals, precious stones and non-monetary gold 70 69 48
Three leading commodity exports (as a share of total merchandise exports) 69 73 49
[272] Crude fertilizers (excluding those of division 56) 69 64 48
[684] Aluminium – 5 0
[025] Birds' eggs, and eggs' yolks; egg albumin – 4 1
Average price index of the leading commodity group exported 58.3 123.5 127.5
Five leading destination markets of commodity exports (as a share of total commodity exports) 90
Australia 25
Republic of Korea 23
New Zealand 19
Japan 15
Nigeria 9
Commodity imports (millions of US dollars) 11 31 14
Commodity imports (as a share of total merchandise imports) 38 35 33
Food imports (millions of US dollars and as a share of total merchandise imports) 5 (17) 13 (14) 10 (24)
Fuel imports (millions of US dollars and as a share of total merchandise imports) 3 (11) 16 (17) 2 (4)
Five-leading trading partners for commodity imports (as a share of total commodity imports) 95
Australia 41
Fiji 41
Taiwan, Province of China 10
Russian Federation 2
Singapore 1
Percentage change of GDP measured in constant 2010 prices –7.9 106.3 4.0
GDP per capita measured in constant 2010 US dollars 9,282 14,260 16,339
Population (thousands) .. .. ..
Human Development Index (value and rank) .. .. ..
Total employment (as a share of the population) .. .. ..
Share of women in total employment .. .. ..
Proportion of population below international poverty line – SDG 1. Indicator 1.1.1 .. ..
Gini index, latest available year .. ..
Prevalence of undernourishment (per cent) – SDG 2. Indicator 2.1.1 .. ..
Value added of agriculture/industry/services (as a share of GDP) 6/28/66 3/58/38 3/58/38
Employment in agriculture/industry/services (as a share of total employment) .. .. ..
Share of women in agriculture/industry/services .. .. ..
Institutional quality index, 2018 ..
Control of corruption .. –0.51 –0.47
Rule of law 0.81 –0.60 –0.73
OTHER STRUCTURAL INDICATORS
MERCHANDISE AND COMMODITY EXPORT DEPENDENCE
COMMODITY IMPORT DEPENDENCE
KEY SOCIOECONOMIC INDICATORS](https://image.slidesharecdn.com/stateofcommoditydependance2019-190524115214/85/State-of-commodity-dependance-2019-154-320.jpg)
![Table of contents Introduction
Chapter 1
Key Findings
from the Report
Chapter 2
Country Statistical
Profiles
List of Country
Statistical Profiles
149
NEPAL*
1995 2013-2017 2017
Merchandise export value (millions of US dollars) 359 779 741
Unallocated exports (as a share of merchandise exports) 7.7 1.1 –
Merchandise export concentration by product line (Herfindahl-Hirschmann index) 0.3912 0.1384 0.1457
Commodity export value (millions of US dollars) 33 236 235
Commodity exports (as a share of total merchandise exports) 9 30 32
Commodity exports (as a share of GDP) 0.7 1.1 0.9
Total natural resources rents (as a share of GDP) 1.4 1.1 1.3
Exports by commodity group (as a share of merchandise exports) 9 30 32
Agricultural commodities 9 28 30
Fuels – – –
Ores, metals, precious stones and non-monetary gold – 3 2
Three leading commodity exports (as a share of total merchandise exports) 1 14 17
[059] Fruit and vegetable juices, unfermented, no spirit – 5 6
[075] Spices 1 5 7
[074] Tea and mate – 3 4
Average price index of the leading commodity group exported 80.8 109.0 102.7
Five leading destination markets of commodity exports (as a share of total commodity exports) 91
India 77
Bangladesh 5
Afghanistan 3
China 3
United States of America 3
Commodity imports (millions of US dollars) 568 3,341 4,090
Commodity imports (as a share of total merchandise imports) 44 42 41
Food imports (millions of US dollars and as a share of total merchandise imports) 118 (9) 1,368 (17) 1,695 (17)
Fuel imports (millions of US dollars and as a share of total merchandise imports) 123 (10) 1,236 (16) 1,530 (15)
Five-leading trading partners for commodity imports (as a share of total commodity imports) 84
India 66
United Arab Emirates 8
Argentina 3
Indonesia 3
China 2
Percentage change of GDP measured in constant 2010 prices 3.5 18.1 8.0
GDP per capita measured in constant 2010 US dollars 406 698 745
Population (thousands) 12,501 19,324 20,252
Human Development Index (value and rank) 0.4100 (125) 0.5646 (146) 0.5740 (146)
Total employment (as a share of the population) 82.3 81.6 81.9
Share of women in total employment 47.8 51.9 52.0
Proportion of population below international poverty line – SDG 1. Indicator 1.1.1 (1995) 61.9 (2010) 15.0
Gini index, latest available year (1995) 35.2 (2010) 32.8
Prevalence of undernourishment (per cent) – SDG 2. Indicator 2.1.1 22.0 9.5
Value added of agriculture/industry/services (as a share of GDP) 39/18/43 32/15/53 32/14/54
Employment in agriculture/industry/services (as a share of total employment) 81/5/14 73/8/20 72/8/20
Share of women in agriculture/industry/services 52/26/29 60/41/27 60/42/28
Institutional quality index, 2018 0.3500
Control of corruption –0.64 –0.68 –0.75
Rule of law –0.01 –0.70 –0.68
MERCHANDISE AND COMMODITY EXPORT DEPENDENCE
COMMODITY IMPORT DEPENDENCE
KEY SOCIOECONOMIC INDICATORS
OTHER STRUCTURAL INDICATORS](https://image.slidesharecdn.com/stateofcommoditydependance2019-190524115214/85/State-of-commodity-dependance-2019-155-320.jpg)
![Table of contents Introduction
Chapter 1
Key Findings
from the Report
Chapter 2
Country Statistical
Profiles
List of Country
Statistical Profiles
150
NETHERLANDS
1995 2013-2017 2017
Merchandise export value (millions of US dollars) 203,000 627,400 652,000
Unallocated exports (as a share of merchandise exports) 2.7 2.4 1.5
Merchandise export concentration by product line (Herfindahl-Hirschmann index) 0.0529 0.0880 0.0744
Commodity export value (millions of US dollars) 71,973 234,705 226,343
Commodity exports (as a share of total merchandise exports) 35 37 35
Commodity exports (as a share of GDP) 16.1 28.6 27.4
Total natural resources rents (as a share of GDP) 0.4 0.7 0.4
Exports by commodity group (as a share of merchandise exports) 35 37 35
Agricultural commodities 25 19 20
Fuels 7 16 12
Ores, metals, precious stones and non-monetary gold 3 3 3
Three leading commodity exports (as a share of total merchandise exports) 9 15 12
[334] Petroleum oils or bituminous minerals 70 % oil 5 10 8
[333] Petroleum oils, oils from bitumin. materials, crude 1 3 2
[292] Crude vegetable materials, n.e.s. 3 2 2
Average price index of the leading commodity group exported 36.5 132.1 103.8
Five leading destination markets of commodity exports (as a share of total commodity exports) 85
European Union (28) 77
United States of America 3
China 2
Singapore 1
Nigeria 1
Commodity imports (millions of US dollars) 51,136 204,534 193,350
Commodity imports (as a share of total merchandise imports) 28 37 34
Food imports (millions of US dollars and as a share of total merchandise imports) 23,474 (13) 59,805 (11) 66,146 (12)
Fuel imports (millions of US dollars and as a share of total merchandise imports) 13,237 (7) 111,289 (20) 93,098 (16)
Five-leading trading partners for commodity imports (as a share of total commodity imports) 72
European Union (28) 41
Russian Federation 17
Norway 6
United States of America 5
Brazil 3
Percentage change of GDP measured in constant 2010 prices 3.1 4.3 3.2
GDP per capita measured in constant 2010 US dollars 38,417 51,605 53,922
Population (thousands) 12,626 14,101 14,240
Human Development Index (value and rank) 0.8610 (4) 0.9264 (9) 0.9310 (9)
Total employment (as a share of the population) 54.3 59.8 60.4
Share of women in total employment 40.5 45.8 45.9
Proportion of population below international poverty line – SDG 1. Indicator 1.1.1 (2004) 0.2 (2015) –
Gini index, latest available year (2004) 29.8 (2015) 28.2
Prevalence of undernourishment (per cent) – SDG 2. Indicator 2.1.1 2.5 2.5
Value added of agriculture/industry/services (as a share of GDP) 3/27/70 2/21/78 2/20/78
Employment in agriculture/industry/services (as a share of total employment) 4/23/73 2/16/81 2/17/81
Share of women in agriculture/industry/services 24/17/49 28/17/52 28/17/52
Institutional quality index, 2018 0.9416
Control of corruption 2.08 1.94 1.87
Rule of law 1.70 1.90 1.83
OTHER STRUCTURAL INDICATORS
MERCHANDISE AND COMMODITY EXPORT DEPENDENCE
COMMODITY IMPORT DEPENDENCE
KEY SOCIOECONOMIC INDICATORS](https://image.slidesharecdn.com/stateofcommoditydependance2019-190524115214/85/State-of-commodity-dependance-2019-156-320.jpg)
![Table of contents Introduction
Chapter 1
Key Findings
from the Report
Chapter 2
Country Statistical
Profiles
List of Country
Statistical Profiles
151
NEW ZEALAND
1995 2013-2017 2017
Merchandise export value (millions of US dollars) 13,745 37,471 38,050
Unallocated exports (as a share of merchandise exports) 1.2 3.4 3.3
Merchandise export concentration by product line (Herfindahl-Hirschmann index) 0.1166 0.1816 0.1777
Commodity export value (millions of US dollars) 9,383 28,559 29,579
Commodity exports (as a share of total merchandise exports) 68 76 78
Commodity exports (as a share of GDP) 14.9 14.9 14.5
Total natural resources rents (as a share of GDP) 1.3 1.2 0.9
Exports by commodity group (as a share of merchandise exports) 68 76 78
Agricultural commodities 60 70 72
Fuels 2 2 2
Ores, metals, precious stones and non-monetary gold 6 4 4
Three leading commodity exports (as a share of total merchandise exports) 22 33 32
[022] Milk, cream and milk products (excluding butter, cheese) 7 18 16
[24 + 25] Forestry products 8 8 9
[012] Other meat and edible meat offal 7 7 7
Average price index of the leading commodity group exported 80.8 109.0 102.7
Five leading destination markets of commodity exports (as a share of total commodity exports) 62
China 24
Australia 14
European Union (28) 9
United States of America 9
Japan 6
Commodity imports (millions of US dollars) 2,461 10,207 9,544
Commodity imports (as a share of total merchandise imports) 18 26 24
Food imports (millions of US dollars and as a share of total merchandise imports) 904 (6) 3,837 (10) 4,040 (10)
Fuel imports (millions of US dollars and as a share of total merchandise imports) 744 (5) 4,709 (12) 3,774 (9)
Five-leading trading partners for commodity imports (as a share of total commodity imports) 51
Australia 18
Singapore 9
Malaysia 8
European Union (28) 8
United Arab Emirates 7
Percentage change of GDP measured in constant 2010 prices 4.6 11.1 3.0
GDP per capita measured in constant 2010 US dollars 26,281 36,304 37,831
Population (thousands) 2,830 3,692 3,776
Human Development Index (value and rank) 0.8510 (8) 0.9126 (15) 0.9170 (15)
Total employment (as a share of the population) 60.1 64.9 65.8
Share of women in total employment 44.1 47.0 47.2
Proportion of population below international poverty line – SDG 1. Indicator 1.1.1 .. ..
Gini index, latest available year .. ..
Prevalence of undernourishment (per cent) – SDG 2. Indicator 2.1.1 2.5 2.5
Value added of agriculture/industry/services (as a share of GDP) 7/28/65 6/23/71 6/23/71
Employment in agriculture/industry/services (as a share of total employment) 10/25/65 6/21/73 7/20/73
Share of women in agriculture/industry/services 30/25/54 31/21/56 32/21/56
Institutional quality index, 2018 0.9675
Control of corruption 2.11 2.28 2.24
Rule of law 1.86 1.95 1.92
MERCHANDISE AND COMMODITY EXPORT DEPENDENCE
COMMODITY IMPORT DEPENDENCE
KEY SOCIOECONOMIC INDICATORS
OTHER STRUCTURAL INDICATORS](https://image.slidesharecdn.com/stateofcommoditydependance2019-190524115214/85/State-of-commodity-dependance-2019-157-320.jpg)
![Table of contents Introduction
Chapter 1
Key Findings
from the Report
Chapter 2
Country Statistical
Profiles
List of Country
Statistical Profiles
152
NICARAGUA
1995 2013-2017 2017
Merchandise export value (millions of US dollars) 509 4,751 4,926
Unallocated exports (as a share of merchandise exports) 0.3 0.5 0.2
Merchandise export concentration by product line (Herfindahl-Hirschmann index) 0.2670 0.2225 0.2260
Commodity export value (millions of US dollars) 397 2,555 2,807
Commodity exports (as a share of total merchandise exports) 78 54 57
Commodity exports (as a share of GDP) 9.6 20.4 20.5
Total natural resources rents (as a share of GDP) 2.0 4.1 4.0
Exports by commodity group (as a share of merchandise exports) 78 53 57
Agricultural commodities 75 45 49
Fuels 1 – –
Ores, metals, precious stones and non-monetary gold 3 8 7
Three leading commodity exports (as a share of total merchandise exports) 37 25 27
[011] Meat of bovine animals, fresh, chilled or frozen 10 9 11
[071] Coffee and coffee substitutes 24 9 10
[971] Gold, non-monetary (excluding gold ores and concentrates) 2 7 7
Average price index of the leading commodity group exported 80.8 109.0 102.7
Five leading destination markets of commodity exports (as a share of total commodity exports) 74
United States of America 38
European Union (28) 12
Venezuela (Bolivarian Rep. of) 10
El Salvador 9
Canada 6
Commodity imports (millions of US dollars) 323 2,226 2,065
Commodity imports (as a share of total merchandise imports) 32 31 27
Food imports (millions of US dollars and as a share of total merchandise imports) 186 (18) 964 (13) 991 (13)
Fuel imports (millions of US dollars and as a share of total merchandise imports) 113 (11) 1,000 (14) 765 (10)
Five-leading trading partners for commodity imports (as a share of total commodity imports) 70
United States of America 21
Curaçao 18
Venezuela (Bolivarian Rep. of) 12
Costa Rica 11
Mexico 8
Percentage change of GDP measured in constant 2010 prices 5.9 22.4 4.9
GDP per capita measured in constant 2010 US dollars 1,113 1,882 2,020
Population (thousands) 2,622 4,256 4,412
Human Development Index (value and rank) 0.5240 (105) 0.6510 (121) 0.6580 (121)
Total employment (as a share of the population) 49.0 63.1 63.7
Share of women in total employment 28.2 38.2 38.6
Proportion of population below international poverty line – SDG 1. Indicator 1.1.1 (1998) 24.2 (2014) 3.2
Gini index, latest available year (1998) 54.4 (2014) 46.2
Prevalence of undernourishment (per cent) – SDG 2. Indicator 2.1.1 32.6 16.2
Value added of agriculture/industry/services (as a share of GDP) 22/22/56 18/27/54 17/27/56
Employment in agriculture/industry/services (as a share of total employment) 33/18/49 31/18/52 29/18/53
Share of women in agriculture/industry/services 9/28/42 11/30/57 11/29/57
Institutional quality index, 2018 0.3651
Control of corruption –0.56 –0.85 –0.87
Rule of law –0.52 –0.68 –0.64
OTHER STRUCTURAL INDICATORS
MERCHANDISE AND COMMODITY EXPORT DEPENDENCE
COMMODITY IMPORT DEPENDENCE
KEY SOCIOECONOMIC INDICATORS](https://image.slidesharecdn.com/stateofcommoditydependance2019-190524115214/85/State-of-commodity-dependance-2019-158-320.jpg)
![Table of contents Introduction
Chapter 1
Key Findings
from the Report
Chapter 2
Country Statistical
Profiles
List of Country
Statistical Profiles
153
NIGER*
1995 2013-2017 2017
Merchandise export value (millions of US dollars) 273 1,211 1,012
Unallocated exports (as a share of merchandise exports) 0.2 5.5 –
Merchandise export concentration by product line (Herfindahl-Hirschmann index) 0.4039 0.3597 0.3502
Commodity export value (millions of US dollars) 130 759 667
Commodity exports (as a share of total merchandise exports) 48 63 66
Commodity exports (as a share of GDP) 7.3 9.8 8.1
Total natural resources rents (as a share of GDP) 11.9 14.0 14.1
Exports by commodity group (as a share of merchandise exports) 48 63 66
Agricultural commodities 20 17 20
Fuels 7 17 14
Ores, metals, precious stones and non-monetary gold 20 28 31
Three leading commodity exports (as a share of total merchandise exports) 20 44 45
[286] Ores and concentrates of uranium or thorium 20 20 19
[334] Petroleum oils or bituminous minerals 70 % oil – 16 14
[971] Gold, non-monetary (excluding gold ores and concentrates) – 8 12
Average price index of the leading commodity group exported 58.3 123.5 127.5
Five leading destination markets of commodity exports (as a share of total commodity exports) 66
European Union (28) 27
Nigeria 10
United Arab Emirates 10
Burkina Faso 10
United States of America 9
Commodity imports (millions of US dollars) 142 679 657
Commodity imports (as a share of total merchandise imports) 41 34 32
Food imports (millions of US dollars and as a share of total merchandise imports) 85 (25) 419 (21) 443 (22)
Fuel imports (millions of US dollars and as a share of total merchandise imports) 29 (8) 159 (8) 119 (6)
Five-leading trading partners for commodity imports (as a share of total commodity imports) 56
European Union (28) 19
Nigeria 17
Thailand 9
Ghana 6
India 6
Percentage change of GDP measured in constant 2010 prices 3.3 27.4 5.2
GDP per capita measured in constant 2010 US dollars 321 387 396
Population (thousands) 4,920 9,919 10,696
Human Development Index (value and rank) 0.2290 (145) 0.3474 (185) 0.3540 (185)
Total employment (as a share of the population) 74.4 78.7 78.6
Share of women in total employment 44.4 43.5 43.5
Proportion of population below international poverty line – SDG 1. Indicator 1.1.1 (2005) 74.9 (2014) 44.5
Gini index, latest available year (2005) 44.4 (2014) 34.3
Prevalence of undernourishment (per cent) – SDG 2. Indicator 2.1.1 21.6 14.4
Value added of agriculture/industry/services (as a share of GDP) 36/14/50 39/20/40 41/18/41
Employment in agriculture/industry/services (as a share of total employment) 76/7/17 76/8/16 76/8/17
Share of women in agriculture/industry/services 43/64/43 41/66/43 41/66/44
Institutional quality index, 2018 0.2683
Control of corruption –0.87 –0.64 –0.65
Rule of law –0.66 –0.65 –0.68
MERCHANDISE AND COMMODITY EXPORT DEPENDENCE
COMMODITY IMPORT DEPENDENCE
KEY SOCIOECONOMIC INDICATORS
OTHER STRUCTURAL INDICATORS](https://image.slidesharecdn.com/stateofcommoditydependance2019-190524115214/85/State-of-commodity-dependance-2019-159-320.jpg)
![Table of contents Introduction
Chapter 1
Key Findings
from the Report
Chapter 2
Country Statistical
Profiles
List of Country
Statistical Profiles
154
NIGERIA
1995 2013-2017 2017
Merchandise export value (millions of US dollars) 12,342 66,913 44,466
Unallocated exports (as a share of merchandise exports) 0.2 – 0.1
Merchandise export concentration by product line (Herfindahl-Hirschmann index) 0.8536 0.7702 0.7637
Commodity export value (millions of US dollars) 12,009 65,612 43,560
Commodity exports (as a share of total merchandise exports) 97 98 98
Commodity exports (as a share of GDP) 24.5 13.9 11.6
Total natural resources rents (as a share of GDP) 35.5 8.1 5.4
Exports by commodity group (as a share of merchandise exports) 97 98 98
Agricultural commodities 5 4 5
Fuels 92 93 92
Ores, metals, precious stones and non-monetary gold – 1 2
Three leading commodity exports (as a share of total merchandise exports) 92 92 89
[333] Petroleum oils, oils from bitumin. materials, crude 86 78 77
[343] Natural gas, whether or not liquefied 0 10 11
[334] Petroleum oils or bituminous minerals 70 % oil 5 3 1
Average price index of the leading commodity group exported 36.5 132.1 103.8
Five leading destination markets of commodity exports (as a share of total commodity exports) 74
European Union (28) 33
India 21
Brazil 8
United States of America 8
South Africa 5
Commodity imports (millions of US dollars) 1,514 16,318 16,457
Commodity imports (as a share of total merchandise imports) 18 34 37
Food imports (millions of US dollars and as a share of total merchandise imports) 886 (11) 6,295 (13) 5,777 (13)
Fuel imports (millions of US dollars and as a share of total merchandise imports) 423 (5) 8,184 (17) 8,934 (20)
Five-leading trading partners for commodity imports (as a share of total commodity imports) 74
European Union (28) 48
United States of America 14
China 6
Brazil 4
Norway 3
Percentage change of GDP measured in constant 2010 prices 2.1 17.2 0.8
GDP per capita measured in constant 2010 US dollars 1,289 2,494 2,412
Population (thousands) 60,228 101,303 106,912
Human Development Index (value and rank) .. 0.5264 (153) 0.5320 (154)
Total employment (as a share of the population) 53.2 52.2 51.3
Share of women in total employment 42.5 45.6 45.8
Proportion of population below international poverty line – SDG 1. Indicator 1.1.1 (1996) 63.5 (2009) 53.5
Gini index, latest available year (1996) 51.9 (2009) 43.0
Prevalence of undernourishment (per cent) – SDG 2. Indicator 2.1.1 9.3 11.5
Value added of agriculture/industry/services (as a share of GDP) 27/25/48 21/22/57 21/18/60
Employment in agriculture/industry/services (as a share of total employment) 59/9/32 37/12/51 36/12/52
Share of women in agriculture/industry/services 39/46/48 33/47/54 33/48/54
Institutional quality index, 2018 0.2773
Control of corruption –1.19 –1.14 –1.07
Rule of law –1.29 –1.00 –0.87
OTHER STRUCTURAL INDICATORS
MERCHANDISE AND COMMODITY EXPORT DEPENDENCE
COMMODITY IMPORT DEPENDENCE
KEY SOCIOECONOMIC INDICATORS](https://image.slidesharecdn.com/stateofcommoditydependance2019-190524115214/85/State-of-commodity-dependance-2019-160-320.jpg)
![Table of contents Introduction
Chapter 1
Key Findings
from the Report
Chapter 2
Country Statistical
Profiles
List of Country
Statistical Profiles
155
NORWAY
1995 2013-2017 2017
Merchandise export value (millions of US dollars) 41,740 119,326 102,000
Unallocated exports (as a share of merchandise exports) 7.2 3.7 4.1
Merchandise export concentration by product line (Herfindahl-Hirschmann index) 0.3513 0.3496 0.3287
Commodity export value (millions of US dollars) 27,526 92,100 78,042
Commodity exports (as a share of total merchandise exports) 66 77 77
Commodity exports (as a share of GDP) 18.1 21.2 19.7
Total natural resources rents (as a share of GDP) 5.1 7.1 5.8
Exports by commodity group (as a share of merchandise exports) 66 77 77
Agricultural commodities 10 10 13
Fuels 47 61 57
Ores, metals, precious stones and non-monetary gold 9 6 7
Three leading commodity exports (as a share of total merchandise exports) 49 62 60
[333] Petroleum oils, oils from bitumin. materials, crude 37 28 25
[343] Natural gas, whether or not liquefied 5 25 24
[03] Fishery products 7 9 11
Average price index of the leading commodity group exported 36.5 132.1 103.8
Five leading destination markets of commodity exports (as a share of total commodity exports) 94
European Union (28) 88
United States of America 3
Japan 1
China 1
Canada 1
Commodity imports (millions of US dollars) 6,268 17,476 17,248
Commodity imports (as a share of total merchandise imports) 19 21 20
Food imports (millions of US dollars and as a share of total merchandise imports) 2,016 (6) 6,718 (8) 6,605 (8)
Fuel imports (millions of US dollars and as a share of total merchandise imports) 947 (3) 4,173 (5) 3,829 (4)
Five-leading trading partners for commodity imports (as a share of total commodity imports) 83
European Union (28) 58
Canada 8
Brazil 7
Russian Federation 6
United States of America 4
Percentage change of GDP measured in constant 2010 prices 4.2 6.7 1.8
GDP per capita measured in constant 2010 US dollars 70,332 89,685 90,715
Population (thousands) 3,517 4,261 4,362
Human Development Index (value and rank) 0.8830 (1) 0.9488 (1) 0.9530 (1)
Total employment (as a share of the population) 59.2 62.1 61.6
Share of women in total employment 46.2 47.4 47.3
Proportion of population below international poverty line – SDG 1. Indicator 1.1.1 (2003) 0.2 (2015) 0.2
Gini index, latest available year (2003) 27.6 (2015) 27.5
Prevalence of undernourishment (per cent) – SDG 2. Indicator 2.1.1 2.5 2.5
Value added of agriculture/industry/services (as a share of GDP) 3/33/64 2/38/61 3/35/63
Employment in agriculture/industry/services (as a share of total employment) 5/23/71 2/20/78 2/19/78
Share of women in agriculture/industry/services 28/20/56 22/17/56 22/17/56
Institutional quality index, 2018 0.9502
Control of corruption 2.14 2.24 2.24
Rule of law 1.92 2.02 2.02
MERCHANDISE AND COMMODITY EXPORT DEPENDENCE
COMMODITY IMPORT DEPENDENCE
KEY SOCIOECONOMIC INDICATORS
OTHER STRUCTURAL INDICATORS](https://image.slidesharecdn.com/stateofcommoditydependance2019-190524115214/85/State-of-commodity-dependance-2019-161-320.jpg)
![Table of contents Introduction
Chapter 1
Key Findings
from the Report
Chapter 2
Country Statistical
Profiles
List of Country
Statistical Profiles
156
OMAN
1995 2013-2017 2017
Merchandise export value (millions of US dollars) 5,917 39,100 32,904
Unallocated exports (as a share of merchandise exports) 0.5 1.8 0.2
Merchandise export concentration by product line (Herfindahl-Hirschmann index) 0.7483 0.5065 0.3945
Commodity export value (millions of US dollars) 5,163 31,490 24,093
Commodity exports (as a share of total merchandise exports) 87 81 73
Commodity exports (as a share of GDP) 37.8 43.2 33.9
Total natural resources rents (as a share of GDP) 27.0 33.2 26.8
Exports by commodity group (as a share of merchandise exports) 87 81 73
Agricultural commodities 4 4 6
Fuels 81 70 59
Ores, metals, precious stones and non-monetary gold 2 6 8
Three leading commodity exports (as a share of total merchandise exports) 81 70 58
[333] Petroleum oils, oils from bitumin. materials, crude 76 53 41
[343] Natural gas, whether or not liquefied – 10 8
[334] Petroleum oils or bituminous minerals 70 % oil 5 7 10
Average price index of the leading commodity group exported 36.5 132.1 103.8
Five leading destination markets of commodity exports (as a share of total commodity exports) 76
China 49
Republic of Korea 10
Japan 8
Taiwan, Province of China 6
United Arab Emirates 4
Commodity imports (millions of US dollars) 1,054 9,047 8,088
Commodity imports (as a share of total merchandise imports) 25 32 31
Food imports (millions of US dollars and as a share of total merchandise imports) 556 (13) 3,205 (11) 3,235 (12)
Fuel imports (millions of US dollars and as a share of total merchandise imports) 57 (1) 3,162 (11) 1,991 (8)
Five-leading trading partners for commodity imports (as a share of total commodity imports) 67
United Arab Emirates 30
India 15
European Union (28) 9
Brazil 8
Saudi Arabia 6
Percentage change of GDP measured in constant 2010 prices 4.8 17.2 1.0
GDP per capita measured in constant 2010 US dollars 16,317 16,966 16,096
Population (thousands) 1,332 3,255 3,627
Human Development Index (value and rank) .. 0.8184 (46) 0.8210 (46)
Total employment (as a share of the population) 58.3 66.7 67.9
Share of women in total employment 11.8 12.4 11.6
Proportion of population below international poverty line – SDG 1. Indicator 1.1.1 .. ..
Gini index, latest available year .. ..
Prevalence of undernourishment (per cent) – SDG 2. Indicator 2.1.1 11.9 5.4
Value added of agriculture/industry/services (as a share of GDP) 3/50/47 1/58/40 1/58/40
Employment in agriculture/industry/services (as a share of total employment) 8/8/84 6/38/55 7/38/55
Share of women in agriculture/industry/services 8/12/12 1/2/21 1/2/20
Institutional quality index, 2018 0.4719
Control of corruption 0.41 0.27 0.25
Rule of law 0.55 0.44 0.43
OTHER STRUCTURAL INDICATORS
MERCHANDISE AND COMMODITY EXPORT DEPENDENCE
COMMODITY IMPORT DEPENDENCE
KEY SOCIOECONOMIC INDICATORS](https://image.slidesharecdn.com/stateofcommoditydependance2019-190524115214/85/State-of-commodity-dependance-2019-162-320.jpg)
![Table of contents Introduction
Chapter 1
Key Findings
from the Report
Chapter 2
Country Statistical
Profiles
List of Country
Statistical Profiles
157
PAKISTAN
1995 2013-2017 2017
Merchandise export value (millions of US dollars) 8,158 22,869 21,878
Unallocated exports (as a share of merchandise exports) 0.2 – –
Merchandise export concentration by product line (Herfindahl-Hirschmann index) 0.2345 0.2019 0.2103
Commodity export value (millions of US dollars) 1,367 5,508 4,927
Commodity exports (as a share of total merchandise exports) 17 24 23
Commodity exports (as a share of GDP) 1.8 2.1 1.6
Total natural resources rents (as a share of GDP) 0.9 1.7 1.2
Exports by commodity group (as a share of merchandise exports) 17 24 23
Agricultural commodities 16 21 19
Fuels 1 2 1
Ores, metals, precious stones and non-monetary gold – 2 2
Three leading commodity exports (as a share of total merchandise exports) 9 12 11
[042] Rice 6 8 8
[057] Fruits and nuts (excluding oil nuts), fresh or dried – 2 2
[061] Sugar, molasses and honey 3 2 2
Average price index of the leading commodity group exported 80.8 109.0 102.7
Five leading destination markets of commodity exports (as a share of total commodity exports) 51
Afghanistan 20
United Arab Emirates 10
China 9
European Union (28) 8
Saudi Arabia 5
Commodity imports (millions of US dollars) 5,050 22,007 25,021
Commodity imports (as a share of total merchandise imports) 43 46 44
Food imports (millions of US dollars and as a share of total merchandise imports) 2,040 (17) 5,567 (12) 6,738 (12)
Fuel imports (millions of US dollars and as a share of total merchandise imports) 1,890 (16) 12,668 (26) 13,712 (24)
Five-leading trading partners for commodity imports (as a share of total commodity imports) 60
United Arab Emirates 28
Saudi Arabia 9
Kuwait 9
Indonesia 8
European Union (28) 6
Percentage change of GDP measured in constant 2010 prices 5.0 18.2 5.3
GDP per capita measured in constant 2010 US dollars 802 1,129 1,200
Population (thousands) 70,384 122,978 128,498
Human Development Index (value and rank) 0.4280 (116) 0.5518 (147) 0.5620 (147)
Total employment (as a share of the population) 46.7 51.6 52.2
Share of women in total employment 11.0 21.5 21.7
Proportion of population below international poverty line – SDG 1. Indicator 1.1.1 (1996) 15.9 (2015) 4.0
Gini index, latest available year (1996) 28.7 (2015) 33.5
Prevalence of undernourishment (per cent) – SDG 2. Indicator 2.1.1 23.4 20.5
Value added of agriculture/industry/services (as a share of GDP) 28/18/54 25/20/55 25/19/56
Employment in agriculture/industry/services (as a share of total employment) 47/19/35 42/23/35 42/24/34
Share of women in agriculture/industry/services 16/6/7 37/12/8 38/13/8
Institutional quality index, 2018 0.2568
Control of corruption –1.22 –0.85 –0.78
Rule of law –0.63 –0.78 –0.72
OTHER STRUCTURAL INDICATORS
MERCHANDISE AND COMMODITY EXPORT DEPENDENCE
COMMODITY IMPORT DEPENDENCE
KEY SOCIOECONOMIC INDICATORS](https://image.slidesharecdn.com/stateofcommoditydependance2019-190524115214/85/State-of-commodity-dependance-2019-163-320.jpg)
![Table of contents Introduction
Chapter 1
Key Findings
from the Report
Chapter 2
Country Statistical
Profiles
List of Country
Statistical Profiles
158
PALAU
1995 2013-2017 2017
Merchandise export value (millions of US dollars) 14 8 6
Unallocated exports (as a share of merchandise exports) 0.4 2.3 3.6
Merchandise export concentration by product line (Herfindahl-Hirschmann index) 0.6588 0.6410 0.6642
Commodity export value (millions of US dollars) 11 5 5
Commodity exports (as a share of total merchandise exports) 77 67 73
Commodity exports (as a share of GDP) 9.7 1.8 1.4
Total natural resources rents (as a share of GDP) – – –
Exports by commodity group (as a share of merchandise exports) 76 67 73
Agricultural commodities 76 65 71
Fuels – – –
Ores, metals, precious stones and non-monetary gold – 3 2
Three leading commodity exports (as a share of total merchandise exports) 69 64 69
[03] Fishery products 69 62 69
[971] Gold, non-monetary (excluding gold ores and concentrates) – 1 –
[24 + 25] Forestry products – 1 –
Average price index of the leading commodity group exported 80.8 109.0 102.7
Five leading destination markets of commodity exports (as a share of total commodity exports) 99
Japan 90
United States of America 5
Taiwan, Province of China 2
Micronesia (Federated States of) 1
European Union (28) 1
Commodity imports (millions of US dollars) 18 66 59
Commodity imports (as a share of total merchandise imports) 34 42 38
Food imports (millions of US dollars and as a share of total merchandise imports) 11 (21) 28 (17) 25 (16)
Fuel imports (millions of US dollars and as a share of total merchandise imports) 2 (4) 29 (18) 24 (15)
Five-leading trading partners for commodity imports (as a share of total commodity imports) 80
United States of America 30
Singapore 22
Guam 10
Republic of Korea 10
Japan 8
Percentage change of GDP measured in constant 2010 prices 10.0 16.5 2.0
GDP per capita measured in constant 2010 US dollars 10,217 10,380 11,012
Population (thousands) .. .. ..
Human Development Index (value and rank) .. 0.7910 (58) 0.7980 (58)
Total employment (as a share of the population) .. .. ..
Share of women in total employment .. .. ..
Proportion of population below international poverty line – SDG 1. Indicator 1.1.1 .. ..
Gini index, latest available year .. ..
Prevalence of undernourishment (per cent) – SDG 2. Indicator 2.1.1 .. ..
Value added of agriculture/industry/services (as a share of GDP) 8/11/81 4/8/88 3/8/88
Employment in agriculture/industry/services (as a share of total employment) .. .. ..
Share of women in agriculture/industry/services .. .. ..
Institutional quality index, 2018 0.5728
Control of corruption .. –0.51 –0.47
Rule of law 0.81 0.41 0.28
OTHER STRUCTURAL INDICATORS
MERCHANDISE AND COMMODITY EXPORT DEPENDENCE
COMMODITY IMPORT DEPENDENCE
KEY SOCIOECONOMIC INDICATORS](https://image.slidesharecdn.com/stateofcommoditydependance2019-190524115214/85/State-of-commodity-dependance-2019-164-320.jpg)
![Table of contents Introduction
Chapter 1
Key Findings
from the Report
Chapter 2
Country Statistical
Profiles
List of Country
Statistical Profiles
159
PANAMA
1995 2013-2017 2017
Merchandise export value (millions of US dollars) 577 12,337 11,450
Unallocated exports (as a share of merchandise exports) 0.8 1.8 2.2
Merchandise export concentration by product line (Herfindahl-Hirschmann index) 0.3135 0.1358 0.1414
Commodity export value (millions of US dollars) 222 3,063 2,953
Commodity exports (as a share of total merchandise exports) 38 25 26
Commodity exports (as a share of GDP) 2.5 5.9 5.0
Total natural resources rents (as a share of GDP) 0.2 0.2 0.2
Exports by commodity group (as a share of merchandise exports) 38 25 26
Agricultural commodities 33 11 11
Fuels 3 12 12
Ores, metals, precious stones and non-monetary gold 2 2 2
Three leading commodity exports (as a share of total merchandise exports) 20 10 11
[334] Petroleum oils or bituminous minerals 70 % oil 2 4 4
[335] Residual petroleum products, n.e.s., related mater. – 4 5
[057] Fruits and nuts (excluding oil nuts), fresh or dried 18 3 3
Average price index of the leading commodity group exported 36.5 132.1 103.8
Five leading destination markets of commodity exports (as a share of total commodity exports) 59
Ecuador 28
European Union (28) 14
China 7
United States of America 5
Switzerland 4
Commodity imports (millions of US dollars) 207 5,759 5,737
Commodity imports (as a share of total merchandise imports) 8 25 26
Food imports (millions of US dollars and as a share of total merchandise imports) 65 (3) 655 (3) 707 (3)
Fuel imports (millions of US dollars and as a share of total merchandise imports) 106 (4) 4,602 (20) 4,448 (20)
Five-leading trading partners for commodity imports (as a share of total commodity imports) 81
United States of America 40
Colombia 17
China 12
Angola 7
Ecuador 6
Percentage change of GDP measured in constant 2010 prices 1.8 30.5 5.4
GDP per capita measured in constant 2010 US dollars 4,799 10,611 11,392
Population (thousands) 1,818 2,862 2,976
Human Development Index (value and rank) 0.6880 (51) 0.7824 (63) 0.7890 (64)
Total employment (as a share of the population) 53.6 63.6 63.9
Share of women in total employment 31.8 38.5 39.1
Proportion of population below international poverty line – SDG 1. Indicator 1.1.1 (1995) 16.3 (2016) 2.2
Gini index, latest available year (1995) 57.8 (2016) 50.4
Prevalence of undernourishment (per cent) – SDG 2. Indicator 2.1.1 27.7 9.2
Value added of agriculture/industry/services (as a share of GDP) 7/20/73 3/27/70 3/28/70
Employment in agriculture/industry/services (as a share of total employment) 21/18/61 16/19/65 15/18/67
Share of women in agriculture/industry/services 5/19/44 21/20/48 22/21/48
Institutional quality index, 2018 0.6318
Control of corruption –0.20 –0.42 –0.54
Rule of law –0.17 –0.06 0.04
MERCHANDISE AND COMMODITY EXPORT DEPENDENCE
COMMODITY IMPORT DEPENDENCE
KEY SOCIOECONOMIC INDICATORS
OTHER STRUCTURAL INDICATORS](https://image.slidesharecdn.com/stateofcommoditydependance2019-190524115214/85/State-of-commodity-dependance-2019-165-320.jpg)
![Table of contents Introduction
Chapter 1
Key Findings
from the Report
Chapter 2
Country Statistical
Profiles
List of Country
Statistical Profiles
160
PAPUA NEW GUINEA
1995 2013-2017 2017
Merchandise export value (millions of US dollars) 2,654 7,917 8,240
Unallocated exports (as a share of merchandise exports) 0.1 0.2 –
Merchandise export concentration by product line (Herfindahl-Hirschmann index) 0.3671 0.2895 0.2812
Commodity export value (millions of US dollars) 2,632 7,604 7,946
Commodity exports (as a share of total merchandise exports) 99 96 96
Commodity exports (as a share of GDP) 36.2 36.2 38.4
Total natural resources rents (as a share of GDP) 32.5 17.0 16.3
Exports by commodity group (as a share of merchandise exports) 99 96 96
Agricultural commodities 39 26 26
Fuels 24 31 32
Ores, metals, precious stones and non-monetary gold 36 40 38
Three leading commodity exports (as a share of total merchandise exports) 35 46 47
[971] Gold, non-monetary (excluding gold ores and concentrates) 11 19 18
[343] Natural gas, whether or not liquefied – 17 19
[333] Petroleum oils, oils from bitumin. materials, crude 23 11 9
Average price index of the leading commodity group exported 33.4 110.1 107.6
Five leading destination markets of commodity exports (as a share of total commodity exports) 81
Australia 33
Japan 18
China 14
European Union (28) 12
Singapore 4
Commodity imports (millions of US dollars) 384 1,145 1,005
Commodity imports (as a share of total merchandise imports) 26 31 28
Food imports (millions of US dollars and as a share of total merchandise imports) 194 (13) 420 (11) 407 (11)
Fuel imports (millions of US dollars and as a share of total merchandise imports) 156 (11) 650 (18) 519 (14)
Five-leading trading partners for commodity imports (as a share of total commodity imports) 84
Australia 41
Singapore 24
Malaysia 9
Taiwan, Province of China 5
China 5
Percentage change of GDP measured in constant 2010 prices –3.3 21.6 2.1
GDP per capita measured in constant 2010 US dollars 1,924 2,233 2,300
Population (thousands) 2,905 5,021 5,286
Human Development Index (value and rank) 0.4250 (118) 0.5398 (151) 0.5440 (150)
Total employment (as a share of the population) 68.9 68.3 68.0
Share of women in total employment 49.3 49.4 49.4
Proportion of population below international poverty line – SDG 1. Indicator 1.1.1 (1996) 53.2 (2009) 38.0
Gini index, latest available year (1996) 55.4 (2009) 41.9
Prevalence of undernourishment (per cent) – SDG 2. Indicator 2.1.1 .. ..
Value added of agriculture/industry/services (as a share of GDP) 22/23/55 20/28/52 20/28/52
Employment in agriculture/industry/services (as a share of total employment) 70/4/26 21/7/71 21/8/72
Share of women in agriculture/industry/services 47/15/59 37/17/56 37/16/56
Institutional quality index, 2018 0.3917
Control of corruption –0.43 –0.93 –0.90
Rule of law –0.62 –0.84 –0.82
OTHER STRUCTURAL INDICATORS
MERCHANDISE AND COMMODITY EXPORT DEPENDENCE
COMMODITY IMPORT DEPENDENCE
KEY SOCIOECONOMIC INDICATORS](https://image.slidesharecdn.com/stateofcommoditydependance2019-190524115214/85/State-of-commodity-dependance-2019-166-320.jpg)
![Table of contents Introduction
Chapter 1
Key Findings
from the Report
Chapter 2
Country Statistical
Profiles
List of Country
Statistical Profiles
161
PARAGUAY
1995 2013-2017 2017
Merchandise export value (millions of US dollars) 2,019 8,920 8,680
Unallocated exports (as a share of merchandise exports) 0.5 0.1 –
Merchandise export concentration by product line (Herfindahl-Hirschmann index) 0.3245 0.3367 0.3480
Commodity export value (millions of US dollars) 1,681 8,086 7,781
Commodity exports (as a share of total merchandise exports) 83 91 90
Commodity exports (as a share of GDP) 20.8 28.2 26.6
Total natural resources rents (as a share of GDP) 2.6 2.1 2.3
Exports by commodity group (as a share of merchandise exports) 83 91 90
Agricultural commodities 80 70 68
Fuels 3 19 21
Ores, metals, precious stones and non-monetary gold – 1 1
Three leading commodity exports (as a share of total merchandise exports) 30 59 62
[222] Oil seeds and oleaginous fruits (excluding flour) 23 26 28
[351] Electric current 3 19 20
[011] Meat of bovine animals, fresh, chilled or frozen 4 13 14
Average price index of the leading commodity group exported 76.6 115.7 106.2
Five leading destination markets of commodity exports (as a share of total commodity exports) 69
Brazil 24
European Union (28) 17
Russian Federation 12
Argentina 9
Chile 8
Commodity imports (millions of US dollars) 815 2,657 2,606
Commodity imports (as a share of total merchandise imports) 26 24 22
Food imports (millions of US dollars and as a share of total merchandise imports) 225 (7) 575 (5) 613 (5)
Fuel imports (millions of US dollars and as a share of total merchandise imports) 205 (7) 1,514 (13) 1,383 (12)
Five-leading trading partners for commodity imports (as a share of total commodity imports) 82
Brazil 25
European Union (28) 19
Argentina 19
United States of America 16
Chile 3
Percentage change of GDP measured in constant 2010 prices 5.4 23.9 3.9
GDP per capita measured in constant 2010 US dollars 2,559 3,838 4,028
Population (thousands) 2,845 4,636 4,809
Human Development Index (value and rank) 0.6060 (84) 0.6998 (106) 0.7020 (108)
Total employment (as a share of the population) 67.1 66.9 67.2
Share of women in total employment 37.9 39.4 39.3
Proportion of population below international poverty line – SDG 1. Indicator 1.1.1 (1995) 12.4 (2016) 1.7
Gini index, latest available year (1995) 58.2 (2016) 47.9
Prevalence of undernourishment (per cent) – SDG 2. Indicator 2.1.1 12.9 11.2
Value added of agriculture/industry/services (as a share of GDP) 23/26/51 20/30/50 19/32/49
Employment in agriculture/industry/services (as a share of total employment) 29/19/52 21/19/60 21/19/59
Share of women in agriculture/industry/services 19/23/53 28/18/51 27/17/51
Institutional quality index, 2018 0.3823
Control of corruption –1.17 –0.88 –0.72
Rule of law –0.66 –0.71 –0.65
MERCHANDISE AND COMMODITY EXPORT DEPENDENCE
COMMODITY IMPORT DEPENDENCE
KEY SOCIOECONOMIC INDICATORS
OTHER STRUCTURAL INDICATORS](https://image.slidesharecdn.com/stateofcommoditydependance2019-190524115214/85/State-of-commodity-dependance-2019-167-320.jpg)
![Table of contents Introduction
Chapter 1
Key Findings
from the Report
Chapter 2
Country Statistical
Profiles
List of Country
Statistical Profiles
162
PERU
1995 2013-2017 2017
Merchandise export value (millions of US dollars) 5,440 39,086 44,238
Unallocated exports (as a share of merchandise exports) – – –
Merchandise export concentration by product line (Herfindahl-Hirschmann index) 0.2427 0.2613 0.2990
Commodity export value (millions of US dollars) 4,702 34,693 40,104
Commodity exports (as a share of total merchandise exports) 86 89 91
Commodity exports (as a share of GDP) 8.8 17.4 18.9
Total natural resources rents (as a share of GDP) 1.9 8.1 7.7
Exports by commodity group (as a share of merchandise exports) 86 89 91
Agricultural commodities 31 21 20
Fuels 5 9 8
Ores, metals, precious stones and non-monetary gold 50 59 62
Three leading commodity exports (as a share of total merchandise exports) 22 46 51
[283] Copper ores and concentrates; copper mattes, cemen 3 21 27
[971] Gold, non-monetary (excluding gold ores and concentrates) 9 17 16
[287] Ores and concentrates of base metals, n.e.s. 10 7 8
Average price index of the leading commodity group exported 44.4 116.0 116.4
Five leading destination markets of commodity exports (as a share of total commodity exports) 71
China 24
European Union (28) 17
United States of America 16
Switzerland 8
Canada 6
Commodity imports (millions of US dollars) 1,897 10,595 11,476
Commodity imports (as a share of total merchandise imports) 25 27 29
Food imports (millions of US dollars and as a share of total merchandise imports) 991 (13) 4,252 (11) 4,670 (12)
Fuel imports (millions of US dollars and as a share of total merchandise imports) 664 (9) 5,268 (13) 5,660 (14)
Five-leading trading partners for commodity imports (as a share of total commodity imports) 64
United States of America 37
Ecuador 12
Argentina 7
Chile 5
Colombia 4
Percentage change of GDP measured in constant 2010 prices 7.4 19.3 2.5
GDP per capita measured in constant 2010 US dollars 3,141 5,956 6,166
Population (thousands) 15,304 22,617 23,357
Human Development Index (value and rank) 0.6430 (73) 0.7450 (84) 0.7500 (87)
Total employment (as a share of the population) 60.6 74.3 73.9
Share of women in total employment 39.5 45.4 45.4
Proportion of population below international poverty line – SDG 1. Indicator 1.1.1 (1997) 17.9 (2016) 3.5
Gini index, latest available year (1997) 53.7 (2016) 43.8
Prevalence of undernourishment (per cent) – SDG 2. Indicator 2.1.1 21.8 8.8
Value added of agriculture/industry/services (as a share of GDP) 9/32/59 8/34/58 8/33/60
Employment in agriculture/industry/services (as a share of total employment) 36/15/49 28/16/55 28/16/56
Share of women in agriculture/industry/services 37/24/46 43/25/52 42/26/53
Institutional quality index, 2018 0.5759
Control of corruption –0.40 –0.48 –0.50
Rule of law –0.70 –0.51 –0.50
OTHER STRUCTURAL INDICATORS
MERCHANDISE AND COMMODITY EXPORT DEPENDENCE
COMMODITY IMPORT DEPENDENCE
KEY SOCIOECONOMIC INDICATORS](https://image.slidesharecdn.com/stateofcommoditydependance2019-190524115214/85/State-of-commodity-dependance-2019-168-320.jpg)
![Table of contents Introduction
Chapter 1
Key Findings
from the Report
Chapter 2
Country Statistical
Profiles
List of Country
Statistical Profiles
163
PHILIPPINES
1995 2013-2017 2017
Merchandise export value (millions of US dollars) 17,447 60,436 68,713
Unallocated exports (as a share of merchandise exports) 38.2 – –
Merchandise export concentration by product line (Herfindahl-Hirschmann index) 0.3610 0.2527 0.2418
Commodity export value (millions of US dollars) 3,667 11,398 13,186
Commodity exports (as a share of total merchandise exports) 21 19 19
Commodity exports (as a share of GDP) 4.5 3.9 4.2
Total natural resources rents (as a share of GDP) 1.1 2.0 1.3
Exports by commodity group (as a share of merchandise exports) 21 19 19
Agricultural commodities 14 10 10
Fuels 2 2 2
Ores, metals, precious stones and non-monetary gold 5 7 7
Three leading commodity exports (as a share of total merchandise exports) 7 6 7
[057] Fruits and nuts (excluding oil nuts), fresh or dried 2 2 3
[422] Fixed vegetable fats oils, crude, refined, fract. 5 2 2
[284] Nickel ores concentrates; nickel mattes, etc. – 2 2
Average price index of the leading commodity group exported 80.8 109.0 102.7
Five leading destination markets of commodity exports (as a share of total commodity exports) 69
Japan 18
China 17
United States of America 13
European Union (28) 10
Republic of Korea 10
Commodity imports (millions of US dollars) 6,540 22,550 26,882
Commodity imports (as a share of total merchandise imports) 23 29 26
Food imports (millions of US dollars and as a share of total merchandise imports) 2,209 (8) 8,511 (11) 10,744 (11)
Fuel imports (millions of US dollars and as a share of total merchandise imports) 2,623 (9) 11,033 (14) 11,402 (11)
Five-leading trading partners for commodity imports (as a share of total commodity imports) 45
United States of America 10
China 9
Saudi Arabia 9
Republic of Korea 9
Indonesia 8
Percentage change of GDP measured in constant 2010 prices 4.7 27.9 6.7
GDP per capita measured in constant 2010 US dollars 1,507 2,634 2,893
Population (thousands) 42,067 68,914 71,643
Human Development Index (value and rank) 0.5980 (87) 0.6924 (111) 0.6990 (111)
Total employment (as a share of the population) 60.2 60.5 60.9
Share of women in total employment 37.5 39.6 39.8
Proportion of population below international poverty line – SDG 1. Indicator 1.1.1 (1997) 17.7 (2015) 8.3
Gini index, latest available year (1997) 46.0 (2015) 40.1
Prevalence of undernourishment (per cent) – SDG 2. Indicator 2.1.1 20.4 13.7
Value added of agriculture/industry/services (as a share of GDP) 19/35/46 11/31/58 10/31/59
Employment in agriculture/industry/services (as a share of total employment) 44/16/40 29/17/55 26/18/56
Share of women in agriculture/industry/services 27/32/52 26/24/52 25/22/52
Institutional quality index, 2018 0.5329
Control of corruption –0.36 –0.45 –0.48
Rule of law 0.07 –0.37 –0.41
MERCHANDISE AND COMMODITY EXPORT DEPENDENCE
COMMODITY IMPORT DEPENDENCE
KEY SOCIOECONOMIC INDICATORS
OTHER STRUCTURAL INDICATORS](https://image.slidesharecdn.com/stateofcommoditydependance2019-190524115214/85/State-of-commodity-dependance-2019-169-320.jpg)
![Table of contents Introduction
Chapter 1
Key Findings
from the Report
Chapter 2
Country Statistical
Profiles
List of Country
Statistical Profiles
164
POLAND
1995 2013-2017 2017
Merchandise export value (millions of US dollars) 22,862 205,800 221,000
Unallocated exports (as a share of merchandise exports) 0.2 0.1 0.1
Merchandise export concentration by product line (Herfindahl-Hirschmann index) 0.0803 0.0651 0.0642
Commodity export value (millions of US dollars) 6,561 43,921 44,423
Commodity exports (as a share of total merchandise exports) 29 21 20
Commodity exports (as a share of GDP) 4.6 8.6 8.5
Total natural resources rents (as a share of GDP) 1.2 0.9 0.8
Exports by commodity group (as a share of merchandise exports) 29 21 20
Agricultural commodities 13 14 14
Fuels 8 3 3
Ores, metals, precious stones and non-monetary gold 7 4 3
Three leading commodity exports (as a share of total merchandise exports) 6 5 4
[334] Petroleum oils or bituminous minerals 70 % oil 1 2 1
[682] Copper 4 2 1
[012] Other meat and edible meat offal 1 1 2
Average price index of the leading commodity group exported 36.5 132.1 103.8
Five leading destination markets of commodity exports (as a share of total commodity exports) 88
European Union (28) 80
Ukraine 2
Russian Federation 2
China 2
United States of America 2
Commodity imports (millions of US dollars) 7,317 46,046 46,663
Commodity imports (as a share of total merchandise imports) 25 23 21
Food imports (millions of US dollars and as a share of total merchandise imports) 2,558 (9) 16,172 (8) 17,492 (8)
Fuel imports (millions of US dollars and as a share of total merchandise imports) 2,651 (9) 17,897 (9) 16,130 (7)
Five-leading trading partners for commodity imports (as a share of total commodity imports) 83
European Union (28) 46
Russian Federation 29
Norway 3
Ukraine 2
Kazakhstan 2
Percentage change of GDP measured in constant 2010 prices 7.0 12.3 4.6
GDP per capita measured in constant 2010 US dollars 6,564 14,541 15,678
Population (thousands) 29,591 32,564 32,515
Human Development Index (value and rank) 0.7400 (38) 0.8544 (32) 0.8650 (31)
Total employment (as a share of the population) 50.7 52.4 53.8
Share of women in total employment 44.8 44.9 45.0
Proportion of population below international poverty line – SDG 1. Indicator 1.1.1 (1996) 2.6 (2016) –
Gini index, latest available year (1996) 32.7 (2016) 30.8
Prevalence of undernourishment (per cent) – SDG 2. Indicator 2.1.1 2.5 2.5
Value added of agriculture/industry/services (as a share of GDP) 6/37/57 3/33/64 3/34/64
Employment in agriculture/industry/services (as a share of total employment) 23/32/45 11/31/58 11/31/58
Share of women in agriculture/industry/services 44/29/56 40/24/57 40/24/57
Institutional quality index, 2018 0.7486
Control of corruption 0.71 0.67 0.73
Rule of law 0.77 0.71 0.47
OTHER STRUCTURAL INDICATORS
MERCHANDISE AND COMMODITY EXPORT DEPENDENCE
COMMODITY IMPORT DEPENDENCE
KEY SOCIOECONOMIC INDICATORS](https://image.slidesharecdn.com/stateofcommoditydependance2019-190524115214/85/State-of-commodity-dependance-2019-170-320.jpg)
![Table of contents Introduction
Chapter 1
Key Findings
from the Report
Chapter 2
Country Statistical
Profiles
List of Country
Statistical Profiles
165
PORTUGAL
1995 2013-2017 2017
Merchandise export value (millions of US dollars) 23,370 59,947 62,170
Unallocated exports (as a share of merchandise exports) 0.3 0.2 0.3
Merchandise export concentration by product line (Herfindahl-Hirschmann index) 0.1045 0.0778 0.0740
Commodity export value (millions of US dollars) 4,004 15,145 15,039
Commodity exports (as a share of total merchandise exports) 17 25 24
Commodity exports (as a share of GDP) 3.4 7.0 6.9
Total natural resources rents (as a share of GDP) 0.2 0.3 0.3
Exports by commodity group (as a share of merchandise exports) 17 25 24
Agricultural commodities 12 15 14
Fuels 3 8 7
Ores, metals, precious stones and non-monetary gold 2 3 3
Three leading commodity exports (as a share of total merchandise exports) 6 11 10
[334] Petroleum oils or bituminous minerals 70 % oil 3 7 6
[03] Fishery products 1 2 2
[112] Alcoholic beverages 2 2 2
Average price index of the leading commodity group exported 36.5 132.1 103.8
Five leading destination markets of commodity exports (as a share of total commodity exports) 86
European Union (28) 68
United States of America 7
Angola 6
Brazil 3
Morocco 2
Commodity imports (millions of US dollars) 9,453 25,055 24,168
Commodity imports (as a share of total merchandise imports) 28 34 31
Food imports (millions of US dollars and as a share of total merchandise imports) 4,233 (13) 10,270 (14) 10,800 (14)
Fuel imports (millions of US dollars and as a share of total merchandise imports) 2,729 (8) 10,608 (14) 9,042 (12)
Five-leading trading partners for commodity imports (as a share of total commodity imports) 74
European Union (28) 57
Angola 7
Russian Federation 4
Saudi Arabia 3
Brazil 3
Percentage change of GDP measured in constant 2010 prices 4.3 –0.8 2.7
GDP per capita measured in constant 2010 US dollars 17,860 21,943 23,023
Population (thousands) 8,347 8,959 8,921
Human Development Index (value and rank) 0.7600 (32) 0.8420 (39) 0.8470 (39)
Total employment (as a share of the population) 54.3 51.3 53.0
Share of women in total employment 43.8 48.6 48.6
Proportion of population below international poverty line – SDG 1. Indicator 1.1.1 (2003) 1.0 (2015) 0.5
Gini index, latest available year (2003) 38.7 (2015) 35.5
Prevalence of undernourishment (per cent) – SDG 2. Indicator 2.1.1 2.5 2.5
Value added of agriculture/industry/services (as a share of GDP) 5/28/66 2/22/76 2/22/76
Employment in agriculture/industry/services (as a share of total employment) 11/32/56 8/24/68 7/25/68
Share of women in agriculture/industry/services 48/31/50 35/30/57 34/30/57
Institutional quality index, 2018 0.8085
Control of corruption 1.37 0.93 0.87
Rule of law 1.29 1.11 1.13
MERCHANDISE AND COMMODITY EXPORT DEPENDENCE
COMMODITY IMPORT DEPENDENCE
KEY SOCIOECONOMIC INDICATORS
OTHER STRUCTURAL INDICATORS](https://image.slidesharecdn.com/stateofcommoditydependance2019-190524115214/85/State-of-commodity-dependance-2019-171-320.jpg)
![Table of contents Introduction
Chapter 1
Key Findings
from the Report
Chapter 2
Country Statistical
Profiles
List of Country
Statistical Profiles
166
QATAR
1995 2013-2017 2017
Merchandise export value (millions of US dollars) 3,557 94,345 67,444
Unallocated exports (as a share of merchandise exports) 0.5 5.5 0.9
Merchandise export concentration by product line (Herfindahl-Hirschmann index) 0.6281 0.5119 0.5017
Commodity export value (millions of US dollars) 2,916 82,643 59,934
Commodity exports (as a share of total merchandise exports) 82 88 89
Commodity exports (as a share of GDP) 36.3 46.6 36.2
Total natural resources rents (as a share of GDP) 24.8 26.0 21.1
Exports by commodity group (as a share of merchandise exports) 82 88 89
Agricultural commodities – – –
Fuels 81 86 86
Ores, metals, precious stones and non-monetary gold 1 2 3
Three leading commodity exports (as a share of total merchandise exports) 74 80 79
[343] Natural gas, whether or not liquefied 3 47 46
[333] Petroleum oils, oils from bitumin. materials, crude 64 25 24
[334] Petroleum oils or bituminous minerals 70 % oil 6 8 10
Average price index of the leading commodity group exported 36.5 132.1 103.8
Five leading destination markets of commodity exports (as a share of total commodity exports) 76
Japan 27
Republic of Korea 21
India 13
European Union (28) 9
China 7
Commodity imports (millions of US dollars) 438 5,563 5,414
Commodity imports (as a share of total merchandise imports) 13 18 18
Food imports (millions of US dollars and as a share of total merchandise imports) 288 (8) 2,751 (9) 2,702 (9)
Fuel imports (millions of US dollars and as a share of total merchandise imports) 15 (–) 315 (1) 291 (1)
Five-leading trading partners for commodity imports (as a share of total commodity imports) 57
United Arab Emirates 19
European Union (28) 14
Saudi Arabia 9
Australia 8
India 7
Percentage change of GDP measured in constant 2010 prices 2.4 21.9 1.6
GDP per capita measured in constant 2010 US dollars 41,795 66,227 64,711
Population (thousands) 373 2,124 2,273
Human Development Index (value and rank) 0.7840 (25) 0.8544 (32) 0.8560 (35)
Total employment (as a share of the population) 76.4 86.8 86.8
Share of women in total employment 13.7 13.7 14.0
Proportion of population below international poverty line – SDG 1. Indicator 1.1.1 .. ..
Gini index, latest available year .. ..
Prevalence of undernourishment (per cent) – SDG 2. Indicator 2.1.1 .. ..
Value added of agriculture/industry/services (as a share of GDP) 1/53/46 –/61/39 –/50/50
Employment in agriculture/industry/services (as a share of total employment) 5/34/61 1/54/45 1/55/44
Share of women in agriculture/industry/services –/1/22 –/1/29 –/2/30
Institutional quality index, 2018 0.6249
Control of corruption –0.05 0.93 0.73
Rule of law –0.04 0.82 0.72
OTHER STRUCTURAL INDICATORS
MERCHANDISE AND COMMODITY EXPORT DEPENDENCE
COMMODITY IMPORT DEPENDENCE
KEY SOCIOECONOMIC INDICATORS](https://image.slidesharecdn.com/stateofcommoditydependance2019-190524115214/85/State-of-commodity-dependance-2019-172-320.jpg)
![Table of contents Introduction
Chapter 1
Key Findings
from the Report
Chapter 2
Country Statistical
Profiles
List of Country
Statistical Profiles
167
REPUBLIC OF KOREA
1995 2013-2017 2017
Merchandise export value (millions of US dollars) 125,000 545,800 574,000
Unallocated exports (as a share of merchandise exports) – – –
Merchandise export concentration by product line (Herfindahl-Hirschmann index) 0.1485 0.1531 0.1779
Commodity export value (millions of US dollars) 10,636 64,611 61,568
Commodity exports (as a share of total merchandise exports) 9 12 11
Commodity exports (as a share of GDP) 1.9 4.6 4.0
Total natural resources rents (as a share of GDP) – – –
Exports by commodity group (as a share of merchandise exports) 9 12 11
Agricultural commodities 4 2 2
Fuels 2 7 6
Ores, metals, precious stones and non-monetary gold 3 2 2
Three leading commodity exports (as a share of total merchandise exports) 2 8 7
[334] Petroleum oils or bituminous minerals 70 % oil 2 7 6
[682] Copper – 1 1
[232] Synthetic rubber – – 1
Average price index of the leading commodity group exported 36.5 132.1 103.8
Five leading destination markets of commodity exports (as a share of total commodity exports) 55
China 18
Japan 13
Singapore 10
United States of America 8
Australia 6
Commodity imports (millions of US dollars) 45,026 198,199 179,613
Commodity imports (as a share of total merchandise imports) 33 42 38
Food imports (millions of US dollars and as a share of total merchandise imports) 6,804 (5) 25,401 (5) 26,992 (6)
Fuel imports (millions of US dollars and as a share of total merchandise imports) 19,013 (14) 130,252 (28) 109,953 (23)
Five-leading trading partners for commodity imports (as a share of total commodity imports) 43
Saudi Arabia 13
Qatar 9
Australia 9
Kuwait 6
United States of America 6
Percentage change of GDP measured in constant 2010 prices 9.6 13.1 3.1
GDP per capita measured in constant 2010 US dollars 12,001 25,089 26,374
Population (thousands) 34,867 43,513 44,113
Human Development Index (value and rank) 0.7780 (27) 0.8980 (21) 0.9030 (20)
Total employment (as a share of the population) 60.4 60.1 60.3
Share of women in total employment 39.8 41.7 42.0
Proportion of population below international poverty line – SDG 1. Indicator 1.1.1 (2006) 0.3 (2012) 0.3
Gini index, latest available year (2006) 31.7 (2012) 31.6
Prevalence of undernourishment (per cent) – SDG 2. Indicator 2.1.1 2.5 2.5
Value added of agriculture/industry/services (as a share of GDP) 6/40/55 2/38/59 2/39/59
Employment in agriculture/industry/services (as a share of total employment) 12/33/55 5/25/70 5/25/70
Share of women in agriculture/industry/services 47/28/45 42/23/48 41/22/49
Institutional quality index, 2018 0.7979
Control of corruption 0.38 0.49 0.48
Rule of law 0.80 1.04 1.16
OTHER STRUCTURAL INDICATORS
MERCHANDISE AND COMMODITY EXPORT DEPENDENCE
COMMODITY IMPORT DEPENDENCE
KEY SOCIOECONOMIC INDICATORS](https://image.slidesharecdn.com/stateofcommoditydependance2019-190524115214/85/State-of-commodity-dependance-2019-173-320.jpg)
![Table of contents Introduction
Chapter 1
Key Findings
from the Report
Chapter 2
Country Statistical
Profiles
List of Country
Statistical Profiles
168
REPUBLIC OF MOLDOVA
1995 2013-2017 2017
Merchandise export value (millions of US dollars) 746 2,241 2,425
Unallocated exports (as a share of merchandise exports) 0.2 0.3 0.2
Merchandise export concentration by product line (Herfindahl-Hirschmann index) 0.2222 0.1606 0.1735
Commodity export value (millions of US dollars) 539 1,056 1,150
Commodity exports (as a share of total merchandise exports) 72 47 47
Commodity exports (as a share of GDP) 30.5 14.1 14.2
Total natural resources rents (as a share of GDP) 0.3 0.4 0.3
Exports by commodity group (as a share of merchandise exports) 72 47 47
Agricultural commodities 69 45 46
Fuels 1 1 1
Ores, metals, precious stones and non-monetary gold 3 2 1
Three leading commodity exports (as a share of total merchandise exports) 28 25 27
[057] Fruits and nuts (excluding oil nuts), fresh or dried 4 9 10
[222] Oil seeds and oleaginous fruits (excluding flour) 1 9 10
[112] Alcoholic beverages 23 7 6
Average price index of the leading commodity group exported 80.8 109.0 102.7
Five leading destination markets of commodity exports (as a share of total commodity exports) 83
European Union (28) 47
Russian Federation 13
Turkey 10
Belarus 9
Ukraine 4
Commodity imports (millions of US dollars) 486 1,448 1,468
Commodity imports (as a share of total merchandise imports) 58 31 30
Food imports (millions of US dollars and as a share of total merchandise imports) 65 (8) 538 (11) 557 (12)
Fuel imports (millions of US dollars and as a share of total merchandise imports) 366 (44) 615 (13) 573 (12)
Five-leading trading partners for commodity imports (as a share of total commodity imports) 91
European Union (28) 52
Ukraine 19
Russian Federation 12
Belarus 6
Turkey 3
Percentage change of GDP measured in constant 2010 prices –1.4 18.1 4.5
GDP per capita measured in constant 2010 US dollars 920 1,764 1,892
Population (thousands) 3,185 3,423 3,414
Human Development Index (value and rank) 0.5940 (88) 0.6958 (109) 0.7000 (110)
Total employment (as a share of the population) 46.9 40.6 40.5
Share of women in total employment 52.6 49.5 49.7
Proportion of population below international poverty line – SDG 1. Indicator 1.1.1 (1997) 16.1 (2016) 0.2
Gini index, latest available year (1997) 36.9 (2016) 26.4
Prevalence of undernourishment (per cent) – SDG 2. Indicator 2.1.1 .. ..
Value added of agriculture/industry/services (as a share of GDP) 32/31/36 14/21/64 14/20/66
Employment in agriculture/industry/services (as a share of total employment) 49/18/33 32/18/50 33/17/50
Share of women in agriculture/industry/services 51/43/60 44/34/59 45/35/58
Institutional quality index, 2018 0.4314
Control of corruption –0.44 –0.85 –0.80
Rule of law –0.12 –0.38 –0.41
MERCHANDISE AND COMMODITY EXPORT DEPENDENCE
OTHER STRUCTURAL INDICATORS
KEY SOCIOECONOMIC INDICATORS
COMMODITY IMPORT DEPENDENCE](https://image.slidesharecdn.com/stateofcommoditydependance2019-190524115214/85/State-of-commodity-dependance-2019-174-320.jpg)
![Table of contents Introduction
Chapter 1
Key Findings
from the Report
Chapter 2
Country Statistical
Profiles
List of Country
Statistical Profiles
169
REPUBLIC OF NORTH MACEDONIA
1995 2013-2017 2017
Merchandise export value (millions of US dollars) 1,204 4,842 5,670
Unallocated exports (as a share of merchandise exports) – – 0.1
Merchandise export concentration by product line (Herfindahl-Hirschmann index) 0.1218 0.1997 0.2149
Commodity export value (millions of US dollars) 504 938 1,000
Commodity exports (as a share of total merchandise exports) 42 19 18
Commodity exports (as a share of GDP) 10.7 8.6 8.8
Total natural resources rents (as a share of GDP) 0.7 2.1 1.5
Exports by commodity group (as a share of merchandise exports) 41 19 18
Agricultural commodities 24 13 11
Fuels – 2 2
Ores, metals, precious stones and non-monetary gold 18 5 5
Three leading commodity exports (as a share of total merchandise exports) 7 6 6
[121] Tobacco, unmanufactured; tobacco refuse 3 3 3
[287] Ores and concentrates of base metals, n.e.s. 1 2 2
[054] Vegetables 3 1 1
Average price index of the leading commodity group exported 80.8 109.0 102.7
Five leading destination markets of commodity exports (as a share of total commodity exports) 89
European Union (28) 57
Serbia 22
Bosnia and Herzegovina 4
Albania 3
United States of America 3
Commodity imports (millions of US dollars) 606 2,695 2,833
Commodity imports (as a share of total merchandise imports) 35 39 37
Food imports (millions of US dollars and as a share of total merchandise imports) 282 (16) 728 (10) 749 (10)
Fuel imports (millions of US dollars and as a share of total merchandise imports) 199 (12) 836 (12) 752 (10)
Five-leading trading partners for commodity imports (as a share of total commodity imports) 86
European Union (28) 64
Serbia 12
South Africa 5
Russian Federation 3
Turkey 2
Percentage change of GDP measured in constant 2010 prices –1.1 10.4 –
GDP per capita measured in constant 2010 US dollars 3,057 5,054 5,244
Population (thousands) 1,485 1,728 1,735
Human Development Index (value and rank) .. 0.7514 (80) 0.7570 (78)
Total employment (as a share of the population) 35.2 41.1 42.7
Share of women in total employment 37.2 39.5 39.2
Proportion of population below international poverty line – SDG 1. Indicator 1.1.1 (1998) 0.9 (2014) 5.0
Gini index, latest available year (1998) 28.1 (2014) 35.6
Prevalence of undernourishment (per cent) – SDG 2. Indicator 2.1.1 7.9 4.1
Value added of agriculture/industry/services (as a share of GDP) 13/25/63 11/27/62 10/28/61
Employment in agriculture/industry/services (as a share of total employment) 22/41/37 18/30/52 16/30/54
Share of women in agriculture/industry/services 36/36/39 39/33/44 37/32/44
Institutional quality index, 2018 0.5832
Control of corruption –0.61 –0.18 –0.31
Rule of law –0.31 –0.19 –0.24
MERCHANDISE AND COMMODITY EXPORT DEPENDENCE
COMMODITY IMPORT DEPENDENCE
KEY SOCIOECONOMIC INDICATORS
OTHER STRUCTURAL INDICATORS](https://image.slidesharecdn.com/stateofcommoditydependance2019-190524115214/85/State-of-commodity-dependance-2019-175-320.jpg)
![Table of contents Introduction
Chapter 1
Key Findings
from the Report
Chapter 2
Country Statistical
Profiles
List of Country
Statistical Profiles
170
ROMANIA
1995 2013-2017 2017
Merchandise export value (millions of US dollars) 7,910 66,114 70,627
Unallocated exports (as a share of merchandise exports) 0.4 3.2 2.9
Merchandise export concentration by product line (Herfindahl-Hirschmann index) 0.1244 0.1051 0.1135
Commodity export value (millions of US dollars) 1,685 12,549 12,017
Commodity exports (as a share of total merchandise exports) 21 19 17
Commodity exports (as a share of GDP) 4.5 6.5 5.7
Total natural resources rents (as a share of GDP) 2.7 1.4 0.9
Exports by commodity group (as a share of merchandise exports) 21 19 17
Agricultural commodities 10 12 11
Fuels 8 5 4
Ores, metals, precious stones and non-monetary gold 3 2 2
Three leading commodity exports (as a share of total merchandise exports) 9 7 7
[334] Petroleum oils or bituminous minerals 70 % oil 7 4 3
[041] Wheat (including spelt) and meslin, unmilled 1 2 2
[222] Oil seeds and oleaginous fruits (excluding flour) – 2 2
Average price index of the leading commodity group exported 36.5 132.1 103.8
Five leading destination markets of commodity exports (as a share of total commodity exports) 71
European Union (28) 54
Turkey 7
Egypt 4
Republic of Moldova 3
Serbia 2
Commodity imports (millions of US dollars) 3,669 15,556 16,854
Commodity imports (as a share of total merchandise imports) 36 20 20
Food imports (millions of US dollars and as a share of total merchandise imports) 773 (8) 5,982 (8) 6,994 (8)
Fuel imports (millions of US dollars and as a share of total merchandise imports) 2,195 (21) 5,729 (8) 5,572 (7)
Five-leading trading partners for commodity imports (as a share of total commodity imports) 87
European Union (28) 57
Russian Federation 15
Kazakhstan 11
Turkey 2
Brazil 2
Percentage change of GDP measured in constant 2010 prices 7.1 12.3 6.9
GDP per capita measured in constant 2010 US dollars 4,851 9,663 10,791
Population (thousands) 18,187 16,813 16,676
Human Development Index (value and rank) 0.6870 (52) 0.8050 (51) 0.8110 (50)
Total employment (as a share of the population) 62.9 50.6 50.6
Share of women in total employment 46.2 43.9 43.6
Proportion of population below international poverty line – SDG 1. Indicator 1.1.1 (1998) 2.1 (2016) –
Gini index, latest available year (1998) 31.1 (2016) 28.3
Prevalence of undernourishment (per cent) – SDG 2. Indicator 2.1.1 2.5 2.5
Value added of agriculture/industry/services (as a share of GDP) 19/38/42 5/35/60 4/32/63
Employment in agriculture/industry/services (as a share of total employment) 40/31/29 26/29/45 23/29/48
Share of women in agriculture/industry/services 53/36/47 44/31/52 42/30/52
Institutional quality index, 2018 0.6911
Control of corruption –0.45 –0.07 –0.03
Rule of law –0.02 0.24 0.39
OTHER STRUCTURAL INDICATORS
MERCHANDISE AND COMMODITY EXPORT DEPENDENCE
COMMODITY IMPORT DEPENDENCE
KEY SOCIOECONOMIC INDICATORS](https://image.slidesharecdn.com/stateofcommoditydependance2019-190524115214/85/State-of-commodity-dependance-2019-176-320.jpg)
![Table of contents Introduction
Chapter 1
Key Findings
from the Report
Chapter 2
Country Statistical
Profiles
List of Country
Statistical Profiles
171
RUSSIAN FEDERATION
1995 2013-2017 2017
Merchandise export value (millions of US dollars) 78,217 402,600 359,000
Unallocated exports (as a share of merchandise exports) 15.8 4.7 3.9
Merchandise export concentration by product line (Herfindahl-Hirschmann index) 0.2559 0.3322 0.2923
Commodity export value (millions of US dollars) 45,447 311,573 271,749
Commodity exports (as a share of total merchandise exports) 58 77 76
Commodity exports (as a share of GDP) 11.4 18.7 17.7
Total natural resources rents (as a share of GDP) 7.9 12.1 11.5
Exports by commodity group (as a share of merchandise exports) 58 77 76
Agricultural commodities 5 6 8
Fuels 43 64 59
Ores, metals, precious stones and non-monetary gold 10 7 8
Three leading commodity exports (as a share of total merchandise exports) 41 60 54
[333] Petroleum oils, oils from bitumin. materials, crude 17 29 26
[334] Petroleum oils or bituminous minerals 70 % oil 8 20 16
[343] Natural gas, whether or not liquefied 16 11 12
Average price index of the leading commodity group exported 36.5 132.1 103.8
Five leading destination markets of commodity exports (as a share of total commodity exports) 79
European Union (28) 55
China 11
Japan 5
Republic of Korea 5
Turkey 3
Commodity imports (millions of US dollars) 16,232 41,110 37,809
Commodity imports (as a share of total merchandise imports) 26 17 17
Food imports (millions of US dollars and as a share of total merchandise imports) 10,727 (17) 27,472 (11) 24,761 (11)
Fuel imports (millions of US dollars and as a share of total merchandise imports) 1,429 (2) 3,095 (1) 2,432 (1)
Five-leading trading partners for commodity imports (as a share of total commodity imports) 59
European Union (28) 27
Belarus 12
Kazakhstan 8
Brazil 7
China 6
Percentage change of GDP measured in constant 2010 prices –4.1 4.7 1.5
GDP per capita measured in constant 2010 US dollars 5,928 11,483 11,477
Population (thousands) 116,580 119,647 118,640
Human Development Index (value and rank) 0.7000 (47) 0.8110 (47) 0.8160 (47)
Total employment (as a share of the population) 56.2 60.2 60.2
Share of women in total employment 47.6 48.8 48.7
Proportion of population below international poverty line – SDG 1. Indicator 1.1.1 (1996) 3.6 (2015) –
Gini index, latest available year (1996) 46.1 (2015) 37.7
Prevalence of undernourishment (per cent) – SDG 2. Indicator 2.1.1 5.1 2.5
Value added of agriculture/industry/services (as a share of GDP) 7/39/53 4/33/63 5/32/63
Employment in agriculture/industry/services (as a share of total employment) 12/30/58 7/27/66 7/27/66
Share of women in agriculture/industry/services 31/36/57 37/29/58 36/29/58
Institutional quality index, 2018 0.3878
Control of corruption –1.05 –0.92 –0.89
Rule of law –0.79 –0.77 –0.79
OTHER STRUCTURAL INDICATORS
MERCHANDISE AND COMMODITY EXPORT DEPENDENCE
COMMODITY IMPORT DEPENDENCE
KEY SOCIOECONOMIC INDICATORS](https://image.slidesharecdn.com/stateofcommoditydependance2019-190524115214/85/State-of-commodity-dependance-2019-177-320.jpg)
![Table of contents Introduction
Chapter 1
Key Findings
from the Report
Chapter 2
Country Statistical
Profiles
List of Country
Statistical Profiles
172
RWANDA*
1995 2013-2017 2017
Merchandise export value (millions of US dollars) 52 795 1,189
Unallocated exports (as a share of merchandise exports) 1.3 1.5 0.6
Merchandise export concentration by product line (Herfindahl-Hirschmann index) 0.6004 0.3497 0.3414
Commodity export value (millions of US dollars) 47 699 1,058
Commodity exports (as a share of total merchandise exports) 90 88 89
Commodity exports (as a share of GDP) 3.8 8.4 11.6
Total natural resources rents (as a share of GDP) 12.6 6.4 6.5
Exports by commodity group (as a share of merchandise exports) 90 88 89
Agricultural commodities 83 35 31
Fuels – 10 8
Ores, metals, precious stones and non-monetary gold 7 44 51
Three leading commodity exports (as a share of total merchandise exports) 66 53 57
[287] Ores and concentrates of base metals, n.e.s. 4 27 20
[971] Gold, non-monetary (excluding gold ores and concentrates) – 15 29
[071] Coffee and coffee substitutes 62 10 9
Average price index of the leading commodity group exported 44.4 116.0 116.4
Five leading destination markets of commodity exports (as a share of total commodity exports) 60
United Arab Emirates 19
Democratic Republic of the Congo 17
Kenya 9
European Union (28) 8
China 7
Commodity imports (millions of US dollars) 103 551 494
Commodity imports (as a share of total merchandise imports) 43 24 25
Food imports (millions of US dollars and as a share of total merchandise imports) 62 (26) 376 (16) 334 (17)
Fuel imports (millions of US dollars and as a share of total merchandise imports) 24 (10) 80 (3) 86 (4)
Five-leading trading partners for commodity imports (as a share of total commodity imports) 61
Uganda 25
Kenya 13
European Union (28) 8
United Arab Emirates 8
United Republic of Tanzania 7
Percentage change of GDP measured in constant 2010 prices 33.5 31.8 6.1
GDP per capita measured in constant 2010 US dollars 268 707 765
Population (thousands) 3,371 6,893 7,308
Human Development Index (value and rank) 0.2340 (144) 0.5132 (157) 0.5240 (155)
Total employment (as a share of the population) 87.0 85.2 85.0
Share of women in total employment 51.0 51.4 51.5
Proportion of population below international poverty line – SDG 1. Indicator 1.1.1 (2000) 76.5 (2013) 56.0
Gini index, latest available year (2000) 48.6 (2013) 45.1
Prevalence of undernourishment (per cent) – SDG 2. Indicator 2.1.1 55.6 36.1
Value added of agriculture/industry/services (as a share of GDP) 44/12/43 31/18/51 32/18/51
Employment in agriculture/industry/services (as a share of total employment) 90/3/8 68/8/24 66/8/25
Share of women in agriculture/industry/services 54/14/31 59/17/41 59/17/42
Institutional quality index, 2018 0.5746
Control of corruption –0.75 0.66 0.63
Rule of law –1.50 0.04 0.13
MERCHANDISE AND COMMODITY EXPORT DEPENDENCE
COMMODITY IMPORT DEPENDENCE
KEY SOCIOECONOMIC INDICATORS
OTHER STRUCTURAL INDICATORS](https://image.slidesharecdn.com/stateofcommoditydependance2019-190524115214/85/State-of-commodity-dependance-2019-178-320.jpg)
![Table of contents Introduction
Chapter 1
Key Findings
from the Report
Chapter 2
Country Statistical
Profiles
List of Country
Statistical Profiles
173
SAINT KITTS AND NEVIS
1995 2013-2017 2017
Merchandise export value (millions of US dollars) 19 54 50
Unallocated exports (as a share of merchandise exports) 2.4 9.3 6.8
Merchandise export concentration by product line (Herfindahl-Hirschmann index) 0.4285 0.3059 0.2755
Commodity export value (millions of US dollars) 7 5 8
Commodity exports (as a share of total merchandise exports) 38 10 15
Commodity exports (as a share of GDP) 2.4 0.6 0.8
Total natural resources rents (as a share of GDP) – – –
Exports by commodity group (as a share of merchandise exports) 38 10 15
Agricultural commodities 38 8 15
Fuels – 1 –
Ores, metals, precious stones and non-monetary gold – – –
Three leading commodity exports (as a share of total merchandise exports) 2 6 5
[112] Alcoholic beverages – 3 2
[111] Non-alcoholic beverages, n.e.s. 2 2 1
[222] Oil seeds and oleaginous fruits (excluding flour) – 1 2
Average price index of the leading commodity group exported 80.8 109.0 102.7
Five leading destination markets of commodity exports (as a share of total commodity exports) 69
Bangladesh 30
United States of America 13
Trinidad and Tobago 11
Bolivia (Plurinational State of) 11
Belize 5
Commodity imports (millions of US dollars) 38 79 89
Commodity imports (as a share of total merchandise imports) 29 27 29
Food imports (millions of US dollars and as a share of total merchandise imports) 24 (18) 57 (20) 68 (22)
Fuel imports (millions of US dollars and as a share of total merchandise imports) 6 (4) 4 (1) 2 (1)
Five-leading trading partners for commodity imports (as a share of total commodity imports) 82
United States of America 61
Trinidad and Tobago 9
European Union (28) 7
Saint Vincent and the Grenadines 3
Canada 3
Percentage change of GDP measured in constant 2010 prices 5.8 14.2 2.1
GDP per capita measured in constant 2010 US dollars 10,618 15,270 15,839
Population (thousands) .. .. ..
Human Development Index (value and rank) .. 0.7716 (69) 0.7780 (70)
Total employment (as a share of the population) .. .. ..
Share of women in total employment .. .. ..
Proportion of population below international poverty line – SDG 1. Indicator 1.1.1 .. ..
Gini index, latest available year .. ..
Prevalence of undernourishment (per cent) – SDG 2. Indicator 2.1.1 .. ..
Value added of agriculture/industry/services (as a share of GDP) 3/24/73 1/27/72 1/28/71
Employment in agriculture/industry/services (as a share of total employment) .. .. ..
Share of women in agriculture/industry/services .. .. ..
Institutional quality index, 2018 0.5445
Control of corruption .. 0.54 0.51
Rule of law 0.81 0.46 0.53
OTHER STRUCTURAL INDICATORS
MERCHANDISE AND COMMODITY EXPORT DEPENDENCE
COMMODITY IMPORT DEPENDENCE
KEY SOCIOECONOMIC INDICATORS](https://image.slidesharecdn.com/stateofcommoditydependance2019-190524115214/85/State-of-commodity-dependance-2019-179-320.jpg)
![Table of contents Introduction
Chapter 1
Key Findings
from the Report
Chapter 2
Country Statistical
Profiles
List of Country
Statistical Profiles
174
SAINT LUCIA
1995 2013-2017 2017
Merchandise export value (millions of US dollars) 109 150 127
Unallocated exports (as a share of merchandise exports) 7.4 2.5 3.0
Merchandise export concentration by product line (Herfindahl-Hirschmann index) 0.4982 0.4177 0.3665
Commodity export value (millions of US dollars) 64 97 76
Commodity exports (as a share of total merchandise exports) 59 65 60
Commodity exports (as a share of GDP) 10.4 6.9 5.3
Total natural resources rents (as a share of GDP) – – –
Exports by commodity group (as a share of merchandise exports) 59 65 60
Agricultural commodities 59 18 17
Fuels – 43 38
Ores, metals, precious stones and non-monetary gold – 4 5
Three leading commodity exports (as a share of total merchandise exports) 56 55 50
[334] Petroleum oils or bituminous minerals 70 % oil – 42 38
[112] Alcoholic beverages 4 8 7
[057] Fruits and nuts (excluding oil nuts), fresh or dried 52 5 5
Average price index of the leading commodity group exported 36.5 132.1 103.8
Five leading destination markets of commodity exports (as a share of total commodity exports) 71
Suriname 19
Barbados 15
Trinidad and Tobago 14
European Union (28) 14
United States of America 8
Commodity imports (millions of US dollars) 135 441 448
Commodity imports (as a share of total merchandise imports) 44 69 67
Food imports (millions of US dollars and as a share of total merchandise imports) 57 (19) 70 (11) 78 (12)
Fuel imports (millions of US dollars and as a share of total merchandise imports) 59 (19) 353 (55) 349 (52)
Five-leading trading partners for commodity imports (as a share of total commodity imports) 92
United States of America 36
Brazil 34
Trinidad and Tobago 11
Colombia 8
European Union (28) 3
Percentage change of GDP measured in constant 2010 prices 1.1 1.3 2.8
GDP per capita measured in constant 2010 US dollars 6,145 7,125 7,309
Population (thousands) 96 142 145
Human Development Index (value and rank) .. 0.7412 (89) 0.7470 (88)
Total employment (as a share of the population) 53.1 52.8 53.8
Share of women in total employment 39.2 44.3 44.9
Proportion of population below international poverty line – SDG 1. Indicator 1.1.1 (1995) 35.8 ..
Gini index, latest available year (1995) 42.6 ..
Prevalence of undernourishment (per cent) – SDG 2. Indicator 2.1.1 .. ..
Value added of agriculture/industry/services (as a share of GDP) 7/16/76 3/13/84 3/14/83
Employment in agriculture/industry/services (as a share of total employment) 24/26/50 15/17/68 15/17/67
Share of women in agriculture/industry/services 25/38/48 29/21/54 30/21/55
Institutional quality index, 2018 0.7097
Control of corruption .. 0.66 0.59
Rule of law 0.81 0.61 0.60
OTHER STRUCTURAL INDICATORS
MERCHANDISE AND COMMODITY EXPORT DEPENDENCE
COMMODITY IMPORT DEPENDENCE
KEY SOCIOECONOMIC INDICATORS](https://image.slidesharecdn.com/stateofcommoditydependance2019-190524115214/85/State-of-commodity-dependance-2019-180-320.jpg)
![Table of contents Introduction
Chapter 1
Key Findings
from the Report
Chapter 2
Country Statistical
Profiles
List of Country
Statistical Profiles
175
SAINT VINCENT AND THE GRENADINES
1995 2013-2017 2017
Merchandise export value (millions of US dollars) 43 46 42
Unallocated exports (as a share of merchandise exports) 1.0 0.8 0.8
Merchandise export concentration by product line (Herfindahl-Hirschmann index) 0.3540 0.4133 0.4046
Commodity export value (millions of US dollars) 29 21 20
Commodity exports (as a share of total merchandise exports) 67 45 48
Commodity exports (as a share of GDP) 9.3 2.8 2.5
Total natural resources rents (as a share of GDP) – – –
Exports by commodity group (as a share of merchandise exports) 68 45 47
Agricultural commodities 68 44 46
Fuels – – –
Ores, metals, precious stones and non-monetary gold – 1 1
Three leading commodity exports (as a share of total merchandise exports) 11 26 27
[046] Meal and flour of wheat and flour of meslin 9 15 15
[054] Vegetables 2 6 6
[112] Alcoholic beverages – 5 6
Average price index of the leading commodity group exported 80.8 109.0 102.7
Five leading destination markets of commodity exports (as a share of total commodity exports) 75
Saint Lucia 20
Barbados 20
Antigua and Barbuda 15
Trinidad and Tobago 14
Dominica 7
Commodity imports (millions of US dollars) 37 124 120
Commodity imports (as a share of total merchandise imports) 28 36 36
Food imports (millions of US dollars and as a share of total merchandise imports) 21 (15) 61 (18) 63 (19)
Fuel imports (millions of US dollars and as a share of total merchandise imports) 12 (9) 43 (12) 36 (11)
Five-leading trading partners for commodity imports (as a share of total commodity imports) 77
United States of America 30
Trinidad and Tobago 28
European Union (28) 9
Venezuela (Bolivarian Rep. of) 6
Guyana 4
Percentage change of GDP measured in constant 2010 prices 7.5 4.0 0.8
GDP per capita measured in constant 2010 US dollars 4,035 6,558 6,689
Population (thousands) 71 83 84
Human Development Index (value and rank) .. 0.7210 (96) 0.7230 (97)
Total employment (as a share of the population) 52.1 57.0 57.1
Share of women in total employment 35.1 40.7 41.7
Proportion of population below international poverty line – SDG 1. Indicator 1.1.1 .. ..
Gini index, latest available year .. ..
Prevalence of undernourishment (per cent) – SDG 2. Indicator 2.1.1 16.7 5.7
Value added of agriculture/industry/services (as a share of GDP) 11/21/68 8/18/75 8/17/74
Employment in agriculture/industry/services (as a share of total employment) 11/14/76 6/13/81 6/13/81
Share of women in agriculture/industry/services –/20/43 9/21/47 9/21/47
Institutional quality index, 2018 0.6514
Control of corruption .. 0.73 0.72
Rule of law 0.81 0.57 0.43
MERCHANDISE AND COMMODITY EXPORT DEPENDENCE
COMMODITY IMPORT DEPENDENCE
KEY SOCIOECONOMIC INDICATORS
OTHER STRUCTURAL INDICATORS](https://image.slidesharecdn.com/stateofcommoditydependance2019-190524115214/85/State-of-commodity-dependance-2019-181-320.jpg)
![Table of contents Introduction
Chapter 1
Key Findings
from the Report
Chapter 2
Country Statistical
Profiles
List of Country
Statistical Profiles
176
SAMOA
1995 2013-2017 2017
Merchandise export value (millions of US dollars) 9 54 44
Unallocated exports (as a share of merchandise exports) 0.6 10.6 8.3
Merchandise export concentration by product line (Herfindahl-Hirschmann index) 0.7229 0.3060 0.3006
Commodity export value (millions of US dollars) 1 22 21
Commodity exports (as a share of total merchandise exports) 16 40 48
Commodity exports (as a share of GDP) 0.7 2.7 2.5
Total natural resources rents (as a share of GDP) 2.0 0.4 0.5
Exports by commodity group (as a share of merchandise exports) 16 40 48
Agricultural commodities 14 32 37
Fuels – 6 9
Ores, metals, precious stones and non-monetary gold 2 3 2
Three leading commodity exports (as a share of total merchandise exports) – 27 35
[03] Fishery products – 16 21
[334] Petroleum oils or bituminous minerals 70 % oil – 6 9
[112] Alcoholic beverages – 5 4
Average price index of the leading commodity group exported 80.8 109.0 102.7
Five leading destination markets of commodity exports (as a share of total commodity exports) 74
American Samoa 29
Australia 14
New Zealand 14
Colombia 10
United States of America 7
Commodity imports (millions of US dollars) 23 165 153
Commodity imports (as a share of total merchandise imports) 25 45 43
Food imports (millions of US dollars and as a share of total merchandise imports) 15 (16) 84 (23) 84 (24)
Fuel imports (millions of US dollars and as a share of total merchandise imports) 7 (7) 65 (18) 54 (15)
Five-leading trading partners for commodity imports (as a share of total commodity imports) 80
Singapore 34
New Zealand 20
United States of America 13
Fiji 7
China 6
Percentage change of GDP measured in constant 2010 prices 6.0 7.6 2.4
GDP per capita measured in constant 2010 US dollars 2,379 3,791 3,998
Population (thousands) 101 122 125
Human Development Index (value and rank) 0.6180 (79) 0.7066 (103) 0.7130 (102)
Total employment (as a share of the population) 33.7 29.1 28.8
Share of women in total employment 35.3 36.2 36.1
Proportion of population below international poverty line – SDG 1. Indicator 1.1.1 (2008) 0.6 ..
Gini index, latest available year (2008) 42.1 ..
Prevalence of undernourishment (per cent) – SDG 2. Indicator 2.1.1 5.3 3.1
Value added of agriculture/industry/services (as a share of GDP) 20/27/53 10/24/66 10/23/67
Employment in agriculture/industry/services (as a share of total employment) 12/15/74 5/15/80 6/15/79
Share of women in agriculture/industry/services 25/20/40 23/18/40 24/18/40
Institutional quality index, 2018 0.6274
Control of corruption –0.03 0.33 0.66
Rule of law 0.95 0.75 0.87
OTHER STRUCTURAL INDICATORS
MERCHANDISE AND COMMODITY EXPORT DEPENDENCE
COMMODITY IMPORT DEPENDENCE
KEY SOCIOECONOMIC INDICATORS](https://image.slidesharecdn.com/stateofcommoditydependance2019-190524115214/85/State-of-commodity-dependance-2019-182-320.jpg)
![Table of contents Introduction
Chapter 1
Key Findings
from the Report
Chapter 2
Country Statistical
Profiles
List of Country
Statistical Profiles
177
SAO TOME AND PRINCIPE*
1995 2013-2017 2017
Merchandise export value (millions of US dollars) 5 13 16
Unallocated exports (as a share of merchandise exports) 0.9 1.2 2.4
Merchandise export concentration by product line (Herfindahl-Hirschmann index) 0.4915 0.6508 0.6197
Commodity export value (millions of US dollars) 3 10 13
Commodity exports (as a share of total merchandise exports) 61 78 86
Commodity exports (as a share of GDP) 3.1 3.0 3.6
Total natural resources rents (as a share of GDP) .. 3.3 3.4
Exports by commodity group (as a share of merchandise exports) 61 78 86
Agricultural commodities 61 73 71
Fuels – 3 12
Ores, metals, precious stones and non-monetary gold – 2 3
Three leading commodity exports (as a share of total merchandise exports) 54 77 78
[072] Cocoa 54 67 63
[334] Petroleum oils or bituminous minerals 70 % oil – 7 12
[263] Cotton – 3 2
Average price index of the leading commodity group exported 87.2 98.3 93.7
Five leading destination markets of commodity exports (as a share of total commodity exports) 95
European Union (28) 86
Guyana 4
Switzerland 2
Turkey 2
Angola 1
Commodity imports (millions of US dollars) 8 72 76
Commodity imports (as a share of total merchandise imports) 28 48 52
Food imports (millions of US dollars and as a share of total merchandise imports) 5 (17) 36 (24) 35 (24)
Fuel imports (millions of US dollars and as a share of total merchandise imports) 1 (2) 22 (14) 29 (19)
Five-leading trading partners for commodity imports (as a share of total commodity imports) 94
European Union (28) 62
Angola 28
Japan 2
United States of America 1
China 1
Percentage change of GDP measured in constant 2010 prices 2.0 18.3 4.5
GDP per capita measured in constant 2010 US dollars 867 1,238 1,262
Population (thousands) 69 111 117
Human Development Index (value and rank) 0.4690 (112) 0.5760 (142) 0.5890 (140)
Total employment (as a share of the population) 46.4 50.3 50.4
Share of women in total employment 31.3 32.6 32.2
Proportion of population below international poverty line – SDG 1. Indicator 1.1.1 (2000) 29.8 (2010) 32.3
Gini index, latest available year (2000) 32.1 (2010) 30.8
Prevalence of undernourishment (per cent) – SDG 2. Indicator 2.1.1 17.8 10.2
Value added of agriculture/industry/services (as a share of GDP) 26/20/54 12/16/72 11/17/72
Employment in agriculture/industry/services (as a share of total employment) 37/16/47 19/14/67 17/14/69
Share of women in agriculture/industry/services 25/–/47 19/12/41 18/12/41
Institutional quality index, 2018 0.3743
Control of corruption 0.40 –0.03 0.14
Rule of law 0.27 –0.73 –0.68
MERCHANDISE AND COMMODITY EXPORT DEPENDENCE
COMMODITY IMPORT DEPENDENCE
KEY SOCIOECONOMIC INDICATORS
OTHER STRUCTURAL INDICATORS](https://image.slidesharecdn.com/stateofcommoditydependance2019-190524115214/85/State-of-commodity-dependance-2019-183-320.jpg)
![Table of contents Introduction
Chapter 1
Key Findings
from the Report
Chapter 2
Country Statistical
Profiles
List of Country
Statistical Profiles
178
SAUDI ARABIA
1995 2013-2017 2017
Merchandise export value (millions of US dollars) 49,030 274,600 247,000
Unallocated exports (as a share of merchandise exports) 0.2 0.1 0.2
Merchandise export concentration by product line (Herfindahl-Hirschmann index) 0.6871 0.6343 0.5853
Commodity export value (millions of US dollars) 41,572 218,195 186,575
Commodity exports (as a share of total merchandise exports) 85 79 76
Commodity exports (as a share of GDP) 29.0 31.4 27.5
Total natural resources rents (as a share of GDP) 24.9 33.9 27.2
Exports by commodity group (as a share of merchandise exports) 85 79 76
Agricultural commodities 2 2 2
Fuels 82 76 71
Ores, metals, precious stones and non-monetary gold 1 2 2
Three leading commodity exports (as a share of total merchandise exports) 82 76 70
[333] Petroleum oils, oils from bitumin. materials, crude 70 67 60
[334] Petroleum oils or bituminous minerals 70 % oil 6 7 8
[342] Liquefied propane and butane 5 2 2
Average price index of the leading commodity group exported 36.5 132.1 103.8
Five leading destination markets of commodity exports (as a share of total commodity exports) 61
Japan 15
China 13
United States of America 12
Republic of Korea 11
India 10
Commodity imports (millions of US dollars) 6,890 34,492 30,553
Commodity imports (as a share of total merchandise imports) 25 23 25
Food imports (millions of US dollars and as a share of total merchandise imports) 4,290 (15) 20,428 (14) 18,348 (15)
Fuel imports (millions of US dollars and as a share of total merchandise imports) 61 (–) 1,625 (1) 1,411 (1)
Five-leading trading partners for commodity imports (as a share of total commodity imports) 55
European Union (28) 24
United Arab Emirates 12
Brazil 7
India 6
Switzerland 6
Percentage change of GDP measured in constant 2010 prices 0.2 16.7 –0.7
GDP per capita measured in constant 2010 US dollars 18,649 21,154 20,748
Population (thousands) 10,918 23,286 24,650
Human Development Index (value and rank) 0.7220 (43) 0.8514 (36) 0.8530 (37)
Total employment (as a share of the population) 48.9 52.3 53.0
Share of women in total employment 11.8 13.3 13.5
Proportion of population below international poverty line – SDG 1. Indicator 1.1.1 .. ..
Gini index, latest available year .. ..
Prevalence of undernourishment (per cent) – SDG 2. Indicator 2.1.1 6.1 5.5
Value added of agriculture/industry/services (as a share of GDP) 6/49/45 2/51/46 3/43/54
Employment in agriculture/industry/services (as a share of total employment) 7/23/69 6/23/71 6/23/71
Share of women in agriculture/industry/services 1/1/17 1/1/18 1/1/19
Institutional quality index, 2018 0.4389
Control of corruption –0.16 0.14 0.36
Rule of law 0.11 0.17 0.10
OTHER STRUCTURAL INDICATORS
MERCHANDISE AND COMMODITY EXPORT DEPENDENCE
COMMODITY IMPORT DEPENDENCE
KEY SOCIOECONOMIC INDICATORS](https://image.slidesharecdn.com/stateofcommoditydependance2019-190524115214/85/State-of-commodity-dependance-2019-184-320.jpg)
![Table of contents Introduction
Chapter 1
Key Findings
from the Report
Chapter 2
Country Statistical
Profiles
List of Country
Statistical Profiles
179
SENEGAL*
1995 2013-2017 2017
Merchandise export value (millions of US dollars) 993 2,730 2,989
Unallocated exports (as a share of merchandise exports) 0.3 1.0 0.2
Merchandise export concentration by product line (Herfindahl-Hirschmann index) 0.2187 0.2276 0.2146
Commodity export value (millions of US dollars) 705 1,958 2,056
Commodity exports (as a share of total merchandise exports) 71 72 69
Commodity exports (as a share of GDP) 14.5 13.1 12.7
Total natural resources rents (as a share of GDP) 4.1 5.1 5.4
Exports by commodity group (as a share of merchandise exports) 71 72 69
Agricultural commodities 46 34 33
Fuels 13 18 15
Ores, metals, precious stones and non-monetary gold 12 19 20
Three leading commodity exports (as a share of total merchandise exports) 36 45 41
[334] Petroleum oils or bituminous minerals 70 % oil 13 18 15
[03] Fishery products 23 15 14
[971] Gold, non-monetary (excluding gold ores and concentrates) – 13 12
Average price index of the leading commodity group exported 36.5 132.1 103.8
Five leading destination markets of commodity exports (as a share of total commodity exports) 64
European Union (28) 22
Mali 18
Switzerland 14
United Arab Emirates 6
Côte d'Ivoire 5
Commodity imports (millions of US dollars) 567 2,971 3,119
Commodity imports (as a share of total merchandise imports) 40 48 46
Food imports (millions of US dollars and as a share of total merchandise imports) 385 (27) 1,230 (20) 1,406 (21)
Fuel imports (millions of US dollars and as a share of total merchandise imports) 122 (9) 1,502 (24) 1,455 (22)
Five-leading trading partners for commodity imports (as a share of total commodity imports) 70
European Union (28) 41
Nigeria 16
India 7
China 3
Thailand 3
Percentage change of GDP measured in constant 2010 prices 4.7 19.9 6.7
GDP per capita measured in constant 2010 US dollars 784 1,060 1,132
Population (thousands) 4,725 8,533 9,054
Human Development Index (value and rank) 0.3680 (133) 0.4926 (163) 0.5050 (161)
Total employment (as a share of the population) 49.9 53.7 54.4
Share of women in total employment 31.6 41.0 41.3
Proportion of population below international poverty line – SDG 1. Indicator 1.1.1 (2001) 49.2 (2011) 38.0
Gini index, latest available year (2001) 41.2 (2011) 40.3
Prevalence of undernourishment (per cent) – SDG 2. Indicator 2.1.1 28.7 11.3
Value added of agriculture/industry/services (as a share of GDP) 19/25/56 16/24/60 17/23/60
Employment in agriculture/industry/services (as a share of total employment) 47/16/37 54/20/26 53/20/26
Share of women in agriculture/industry/services 34/12/38 46/24/44 46/24/45
Institutional quality index, 2018 0.4073
Control of corruption –0.14 –0.03 –0.09
Rule of law –0.18 –0.14 –0.15
MERCHANDISE AND COMMODITY EXPORT DEPENDENCE
COMMODITY IMPORT DEPENDENCE
KEY SOCIOECONOMIC INDICATORS
OTHER STRUCTURAL INDICATORS](https://image.slidesharecdn.com/stateofcommoditydependance2019-190524115214/85/State-of-commodity-dependance-2019-185-320.jpg)
![Table of contents Introduction
Chapter 1
Key Findings
from the Report
Chapter 2
Country Statistical
Profiles
List of Country
Statistical Profiles
180
SERBIA
1995 2013-2017 2017
Merchandise export value (millions of US dollars) .. 14,929 16,959
Unallocated exports (as a share of merchandise exports) .. 1.4 2.1
Merchandise export concentration by product line (Herfindahl-Hirschmann index) .. 0.0956 0.0808
Commodity export value (millions of US dollars) .. 4,525 4,811
Commodity exports (as a share of total merchandise exports) .. 30 28
Commodity exports (as a share of GDP) .. 9.4 9.8
Total natural resources rents (as a share of GDP) 0.6 1.8 1.5
Exports by commodity group (as a share of merchandise exports) .. 30 28
Agricultural commodities .. 21 19
Fuels .. 3 3
Ores, metals, precious stones and non-monetary gold .. 6 6
Three leading commodity exports (as a share of total merchandise exports) .. 8 8
[682] Copper .. 3 3
[058] Fruit, preserved, and fruit preparations (no juice) .. 3 2
[044] Maize (not including sweet corn), unmilled .. 2 2
Average price index of the leading commodity group exported .. 123.5 127.5
Five leading destination markets of commodity exports (as a share of total commodity exports) 88
European Union (28) 54
Bosnia and Herzegovina 13
Russian Federation 8
Montenegro 7
Republic of North Macedonia 6
Commodity imports (millions of US dollars) .. 5,205 5,560
Commodity imports (as a share of total merchandise imports) .. 26 25
Food imports (millions of US dollars and as a share of total merchandise imports) .. 1,273 (6) 1,349 (6)
Fuel imports (millions of US dollars and as a share of total merchandise imports) .. 2,420 (12) 2,301 (10)
Five-leading trading partners for commodity imports (as a share of total commodity imports) .. 82
European Union (28) 41
Russian Federation 28
Bosnia and Herzegovina 5
Kazakhstan 5
Iraq 3
Percentage change of GDP measured in constant 2010 prices .. 4.0 2.2
GDP per capita measured in constant 2010 US dollars .. 5,387 5,629
Population (thousands) 7,703 7,377 7,344
Human Development Index (value and rank) 0.6950 (50) 0.7796 (66) 0.7870 (65)
Total employment (as a share of the population) 49.4 43.4 46.0
Share of women in total employment 42.3 43.3 43.8
Proportion of population below international poverty line – SDG 1. Indicator 1.1.1 (2002) 0.2 (2015) 0.1
Gini index, latest available year (2002) 32.0 (2015) 28.5
Prevalence of undernourishment (per cent) – SDG 2. Indicator 2.1.1 – 5.6
Value added of agriculture/industry/services (as a share of GDP) .. 9/31/60 9/31/60
Employment in agriculture/industry/services (as a share of total employment) 31/29/40 20/25/56 19/24/57
Share of women in agriculture/industry/services 44/32/49 38/29/51 38/29/52
Institutional quality index, 2018 0.5441
Control of corruption –1.14 –0.30 –0.37
Rule of law –1.26 –0.19 –0.19
OTHER STRUCTURAL INDICATORS
MERCHANDISE AND COMMODITY EXPORT DEPENDENCE
COMMODITY IMPORT DEPENDENCE
KEY SOCIOECONOMIC INDICATORS](https://image.slidesharecdn.com/stateofcommoditydependance2019-190524115214/85/State-of-commodity-dependance-2019-186-320.jpg)
![Table of contents Introduction
Chapter 1
Key Findings
from the Report
Chapter 2
Country Statistical
Profiles
List of Country
Statistical Profiles
181
SEYCHELLES
1995 2013-2017 2017
Merchandise export value (millions of US dollars) 53 524 597
Unallocated exports (as a share of merchandise exports) 2.1 1.5 0.1
Merchandise export concentration by product line (Herfindahl-Hirschmann index) 0.4574 0.5596 0.5747
Commodity export value (millions of US dollars) 49 470 528
Commodity exports (as a share of total merchandise exports) 92 90 88
Commodity exports (as a share of GDP) 7.9 33.7 35.5
Total natural resources rents (as a share of GDP) 0.1 0.1 0.1
Exports by commodity group (as a share of merchandise exports) 91 89 88
Agricultural commodities 52 73 65
Fuels 40 16 23
Ores, metals, precious stones and non-monetary gold – – –
Three leading commodity exports (as a share of total merchandise exports) 85 87 86
[03] Fishery products 45 69 62
[334] Petroleum oils or bituminous minerals 70 % oil 40 16 23
[081] Feeding stuff for animals (no unmilled cereals) – 1 1
Average price index of the leading commodity group exported 80.8 109.0 102.7
Five leading destination markets of commodity exports (as a share of total commodity exports) 93
European Union (28) 65
United Arab Emirates 18
Mauritius 4
Japan 4
Thailand 1
Commodity imports (millions of US dollars) 97 433 487
Commodity imports (as a share of total merchandise imports) 38 39 36
Food imports (millions of US dollars and as a share of total merchandise imports) 49 (19) 224 (20) 256 (19)
Fuel imports (millions of US dollars and as a share of total merchandise imports) 36 (14) 162 (15) 175 (13)
Five-leading trading partners for commodity imports (as a share of total commodity imports) 81
United Arab Emirates 35
European Union (28) 34
Singapore 4
South Africa 4
Malaysia 3
Percentage change of GDP measured in constant 2010 prices –0.6 19.5 4.2
GDP per capita measured in constant 2010 US dollars 7,764 12,978 13,759
Population (thousands) .. .. ..
Human Development Index (value and rank) .. 0.7892 (60) 0.7970 (60)
Total employment (as a share of the population) .. .. ..
Share of women in total employment .. .. ..
Proportion of population below international poverty line – SDG 1. Indicator 1.1.1 (1999) 0.6 (2013) 1.1
Gini index, latest available year (1999) 42.8 (2013) 46.8
Prevalence of undernourishment (per cent) – SDG 2. Indicator 2.1.1 .. ..
Value added of agriculture/industry/services (as a share of GDP) 6/13/81 3/14/83 2/13/85
Employment in agriculture/industry/services (as a share of total employment) .. .. ..
Share of women in agriculture/industry/services .. .. ..
Institutional quality index, 2018 0.5473
Control of corruption 0.55 0.64 0.68
Rule of law 0.60 0.13 0.10
MERCHANDISE AND COMMODITY EXPORT DEPENDENCE
COMMODITY IMPORT DEPENDENCE
KEY SOCIOECONOMIC INDICATORS
OTHER STRUCTURAL INDICATORS](https://image.slidesharecdn.com/stateofcommoditydependance2019-190524115214/85/State-of-commodity-dependance-2019-187-320.jpg)
![Table of contents Introduction
Chapter 1
Key Findings
from the Report
Chapter 2
Country Statistical
Profiles
List of Country
Statistical Profiles
182
SIERRA LEONE*
1995 2013-2017 2017
Merchandise export value (millions of US dollars) 42 1,067 794
Unallocated exports (as a share of merchandise exports) 0.9 0.3 0.2
Merchandise export concentration by product line (Herfindahl-Hirschmann index) 0.2776 0.4156 0.3273
Commodity export value (millions of US dollars) 36 930 716
Commodity exports (as a share of total merchandise exports) 86 87 90
Commodity exports (as a share of GDP) 3.0 21.8 20.5
Total natural resources rents (as a share of GDP) 15.9 24.2 21.8
Exports by commodity group (as a share of merchandise exports) 85 87 90
Agricultural commodities 57 12 19
Fuels 1 – –
Ores, metals, precious stones and non-monetary gold 26 75 71
Three leading commodity exports (as a share of total merchandise exports) 20 67 56
[281] Iron ore and concentrates – 44 25
[667] Pearls, precious semi-precious stones 16 13 13
[287] Ores and concentrates of base metals, n.e.s. 4 10 18
Average price index of the leading commodity group exported 58.3 123.5 127.5
Five leading destination markets of commodity exports (as a share of total commodity exports) 90
China 57
European Union (28) 26
United States of America 5
United Arab Emirates 2
Saudi Arabia 2
Commodity imports (millions of US dollars) 60 664 341
Commodity imports (as a share of total merchandise imports) 45 49 37
Food imports (millions of US dollars and as a share of total merchandise imports) 39 (29) 287 (21) 279 (30)
Fuel imports (millions of US dollars and as a share of total merchandise imports) 13 (10) 288 (21) 8 (1)
Five-leading trading partners for commodity imports (as a share of total commodity imports) 63
Côte d'Ivoire 21
European Union (28) 18
Benin 11
Senegal 9
United States of America 5
Percentage change of GDP measured in constant 2010 prices –10.0 21.2 5.6
GDP per capita measured in constant 2010 US dollars 438 495 469
Population (thousands) 2,360 4,146 4,376
Human Development Index (value and rank) 0.2740 (142) 0.4174 (181) 0.4190 (181)
Total employment (as a share of the population) 62.4 55.5 55.3
Share of women in total employment 50.6 50.6 50.6
Proportion of population below international poverty line – SDG 1. Indicator 1.1.1 (2003) 61.3 (2011) 52.2
Gini index, latest available year (2003) 40.2 (2011) 34.0
Prevalence of undernourishment (per cent) – SDG 2. Indicator 2.1.1 39.6 25.5
Value added of agriculture/industry/services (as a share of GDP) 48/9/43 56/12/32 60/6/34
Employment in agriculture/industry/services (as a share of total employment) 66/6/28 60/6/34 61/6/33
Share of women in agriculture/industry/services 51/8/59 50/7/60 50/7/60
Institutional quality index, 2018 0.2413
Control of corruption –0.76 –0.81 –0.59
Rule of law –1.38 –0.84 –0.79
OTHER STRUCTURAL INDICATORS
MERCHANDISE AND COMMODITY EXPORT DEPENDENCE
COMMODITY IMPORT DEPENDENCE
KEY SOCIOECONOMIC INDICATORS](https://image.slidesharecdn.com/stateofcommoditydependance2019-190524115214/85/State-of-commodity-dependance-2019-188-320.jpg)
![Table of contents Introduction
Chapter 1
Key Findings
from the Report
Chapter 2
Country Statistical
Profiles
List of Country
Statistical Profiles
183
SINGAPORE
1995 2013-2017 2017
Merchandise export value (millions of US dollars) 118,000 375,600 373,000
Unallocated exports (as a share of merchandise exports) 2.3 5.6 5.2
Merchandise export concentration by product line (Herfindahl-Hirschmann index) 0.2224 0.2423 0.2406
Commodity export value (millions of US dollars) 18,615 86,822 83,981
Commodity exports (as a share of total merchandise exports) 16 23 23
Commodity exports (as a share of GDP) 21.2 28.7 27.1
Total natural resources rents (as a share of GDP) – – –
Exports by commodity group (as a share of merchandise exports) 16 23 22
Agricultural commodities 5 3 3
Fuels 9 17 15
Ores, metals, precious stones and non-monetary gold 2 3 5
Three leading commodity exports (as a share of total merchandise exports) 9 19 18
[334] Petroleum oils or bituminous minerals 70 % oil 9 16 14
[971] Gold, non-monetary (excluding gold ores and concentrates) – 2 3
[098] Edible products and preparations, n.e.s. – 1 1
Average price index of the leading commodity group exported 36.5 132.1 103.8
Five leading destination markets of commodity exports (as a share of total commodity exports) 60
Malaysia 18
Indonesia 16
China 10
Australia 9
China, Hong Kong SAR 7
Commodity imports (millions of US dollars) 20,942 111,517 109,216
Commodity imports (as a share of total merchandise imports) 17 34 33
Food imports (millions of US dollars and as a share of total merchandise imports) 4,474 (4) 9,639 (3) 9,537 (3)
Fuel imports (millions of US dollars and as a share of total merchandise imports) 9,292 (7) 80,207 (24) 75,794 (23)
Five-leading trading partners for commodity imports (as a share of total commodity imports) 38
Malaysia 10
Indonesia 8
United Arab Emirates 7
European Union (28) 7
Republic of Korea 5
Percentage change of GDP measured in constant 2010 prices 7.0 17.9 3.6
GDP per capita measured in constant 2010 US dollars 29,390 52,277 53,524
Population (thousands) 2,705 4,675 4,854
Human Development Index (value and rank) 0.7730 (29) 0.9284 (5) 0.9320 (8)
Total employment (as a share of the population) 62.9 66.9 67.1
Share of women in total employment 39.0 44.7 44.9
Proportion of population below international poverty line – SDG 1. Indicator 1.1.1 .. ..
Gini index, latest available year .. ..
Prevalence of undernourishment (per cent) – SDG 2. Indicator 2.1.1 .. ..
Value added of agriculture/industry/services (as a share of GDP) –/34/66 –/26/74 –/26/74
Employment in agriculture/industry/services (as a share of total employment) –/31/69 1/17/82 –/16/84
Share of women in agriculture/industry/services 25/31/42 28/32/47 21/32/47
Institutional quality index, 2018 0.8164
Control of corruption 2.11 2.09 2.13
Rule of law 1.24 1.80 1.82
MERCHANDISE AND COMMODITY EXPORT DEPENDENCE
COMMODITY IMPORT DEPENDENCE
KEY SOCIOECONOMIC INDICATORS
OTHER STRUCTURAL INDICATORS](https://image.slidesharecdn.com/stateofcommoditydependance2019-190524115214/85/State-of-commodity-dependance-2019-189-320.jpg)
![Table of contents Introduction
Chapter 1
Key Findings
from the Report
Chapter 2
Country Statistical
Profiles
List of Country
Statistical Profiles
184
SLOVAKIA
1995 2013-2017 2017
Merchandise export value (millions of US dollars) 8,374 81,653 84,525
Unallocated exports (as a share of merchandise exports) – 0.1 0.1
Merchandise export concentration by product line (Herfindahl-Hirschmann index) 0.0918 0.1827 0.1880
Commodity export value (millions of US dollars) 1,479 9,506 9,474
Commodity exports (as a share of total merchandise exports) 18 12 11
Commodity exports (as a share of GDP) 7.4 10.1 9.9
Total natural resources rents (as a share of GDP) 0.5 0.3 0.3
Exports by commodity group (as a share of merchandise exports) 18 12 11
Agricultural commodities 10 5 4
Fuels 4 4 5
Ores, metals, precious stones and non-monetary gold 4 2 2
Three leading commodity exports (as a share of total merchandise exports) 7 5 5
[334] Petroleum oils or bituminous minerals 70 % oil 4 3 2
[343] Natural gas, whether or not liquefied – 1 2
[24 + 25] Forestry products 3 1 1
Average price index of the leading commodity group exported 36.5 132.1 103.8
Five leading destination markets of commodity exports (as a share of total commodity exports) 97
European Union (28) 96
Ukraine 1
Commodity imports (millions of US dollars) 2,481 15,380 15,302
Commodity imports (as a share of total merchandise imports) 30 20 18
Food imports (millions of US dollars and as a share of total merchandise imports) 631 (8) 4,114 (5) 4,105 (5)
Fuel imports (millions of US dollars and as a share of total merchandise imports) 1,037 (13) 7,374 (9) 7,105 (9)
Five-leading trading partners for commodity imports (as a share of total commodity imports) 94
European Union (28) 56
Russian Federation 33
Ukraine 3
United States of America 1
Switzerland 1
Percentage change of GDP measured in constant 2010 prices 5.8 11.3 3.4
GDP per capita measured in constant 2010 US dollars 8,677 18,636 19,869
Population (thousands) 4,151 4,607 4,610
Human Development Index (value and rank) 0.7510 (35) 0.8496 (38) 0.8550 (36)
Total employment (as a share of the population) 52.1 52.8 54.9
Share of women in total employment 44.5 44.8 45.4
Proportion of population below international poverty line – SDG 1. Indicator 1.1.1 (1996) 0.5 (2015) 0.7
Gini index, latest available year (1996) 25.8 (2015) 26.5
Prevalence of undernourishment (per cent) – SDG 2. Indicator 2.1.1 5.9 2.7
Value added of agriculture/industry/services (as a share of GDP) 6/37/58 4/34/62 4/35/62
Employment in agriculture/industry/services (as a share of total employment) 9/39/52 3/36/61 3/36/61
Share of women in agriculture/industry/services 31/33/56 21/25/57 22/26/58
Institutional quality index, 2018 0.7139
Control of corruption 0.22 0.18 0.22
Rule of law 0.16 0.54 0.57
MERCHANDISE AND COMMODITY EXPORT DEPENDENCE
COMMODITY IMPORT DEPENDENCE
OTHER STRUCTURAL INDICATORS
KEY SOCIOECONOMIC INDICATORS](https://image.slidesharecdn.com/stateofcommoditydependance2019-190524115214/85/State-of-commodity-dependance-2019-190-320.jpg)
![Table of contents Introduction
Chapter 1
Key Findings
from the Report
Chapter 2
Country Statistical
Profiles
List of Country
Statistical Profiles
185
SLOVENIA
1995 2013-2017 2017
Merchandise export value (millions of US dollars) 8,316 34,651 38,443
Unallocated exports (as a share of merchandise exports) 0.5 1.7 1.9
Merchandise export concentration by product line (Herfindahl-Hirschmann index) 0.0912 0.1083 0.1152
Commodity export value (millions of US dollars) 827 5,566 5,751
Commodity exports (as a share of total merchandise exports) 10 16 15
Commodity exports (as a share of GDP) 3.9 11.9 11.8
Total natural resources rents (as a share of GDP) 0.2 0.2 0.3
Exports by commodity group (as a share of merchandise exports) 10 16 15
Agricultural commodities 6 7 6
Fuels 1 5 4
Ores, metals, precious stones and non-monetary gold 3 4 4
Three leading commodity exports (as a share of total merchandise exports) 4 7 7
[334] Petroleum oils or bituminous minerals 70 % oil – 3 2
[684] Aluminium 2 2 3
[24 + 25] Forestry products 2 2 2
Average price index of the leading commodity group exported 36.5 132.1 103.8
Five leading destination markets of commodity exports (as a share of total commodity exports) 93
European Union (28) 86
Bosnia and Herzegovina 3
Algeria 2
Serbia 2
Russian Federation 1
Commodity imports (millions of US dollars) 2,170 8,534 8,556
Commodity imports (as a share of total merchandise imports) 23 26 24
Food imports (millions of US dollars and as a share of total merchandise imports) 688 (7) 2,551 (8) 2,694 (7)
Fuel imports (millions of US dollars and as a share of total merchandise imports) 571 (6) 2,993 (9) 2,742 (8)
Five-leading trading partners for commodity imports (as a share of total commodity imports) 87
European Union (28) 76
Russian Federation 4
Brazil 4
Serbia 2
Bosnia and Herzegovina 2
Percentage change of GDP measured in constant 2010 prices 4.1 4.0 5.0
GDP per capita measured in constant 2010 US dollars 15,051 23,809 25,499
Population (thousands) 1,629 1,769 1,769
Human Development Index (value and rank) 0.7820 (26) 0.8902 (23) 0.8960 (23)
Total employment (as a share of the population) 53.7 52.1 52.6
Share of women in total employment 46.6 45.8 46.1
Proportion of population below international poverty line – SDG 1. Indicator 1.1.1 (1998) – (2015) –
Gini index, latest available year (1998) 28.4 (2015) 25.4
Prevalence of undernourishment (per cent) – SDG 2. Indicator 2.1.1 2.5 2.5
Value added of agriculture/industry/services (as a share of GDP) 4/35/61 2/32/65 2/32/66
Employment in agriculture/industry/services (as a share of total employment) 10/43/46 7/32/61 5/33/62
Share of women in agriculture/industry/services 48/36/56 43/26/56 38/26/57
Institutional quality index, 2018 0.7433
Control of corruption 1.11 0.77 0.81
Rule of law 1.07 1.02 1.02
MERCHANDISE AND COMMODITY EXPORT DEPENDENCE
COMMODITY IMPORT DEPENDENCE
OTHER STRUCTURAL INDICATORS
KEY SOCIOECONOMIC INDICATORS](https://image.slidesharecdn.com/stateofcommoditydependance2019-190524115214/85/State-of-commodity-dependance-2019-191-320.jpg)
![Table of contents Introduction
Chapter 1
Key Findings
from the Report
Chapter 2
Country Statistical
Profiles
List of Country
Statistical Profiles
186
SOLOMON ISLANDS*
1995 2013-2017 2017
Merchandise export value (millions of US dollars) 168 457 500
Unallocated exports (as a share of merchandise exports) 0.1 10.6 0.2
Merchandise export concentration by product line (Herfindahl-Hirschmann index) 0.5771 0.6104 0.6487
Commodity export value (millions of US dollars) 166 401 488
Commodity exports (as a share of total merchandise exports) 99 88 98
Commodity exports (as a share of GDP) 45.5 36.1 40.7
Total natural resources rents (as a share of GDP) 7.7 21.9 20.2
Exports by commodity group (as a share of merchandise exports) 99 88 98
Agricultural commodities 99 82 89
Fuels – – –
Ores, metals, precious stones and non-monetary gold – 6 9
Three leading commodity exports (as a share of total merchandise exports) 30 19 16
[03] Fishery products 23 9 10
[422] Fixed vegetable fats oils, crude, refined, fract. 6 6 6
[971] Gold, non-monetary (excluding gold ores and concentrates) – 3 0
Average price index of the leading commodity group exported 80.8 109.0 102.7
Five leading destination markets of commodity exports (as a share of total commodity exports) 86
China 63
European Union (28) 11
India 5
Australia 5
Thailand 2
Commodity imports (millions of US dollars) 44 204 230
Commodity imports (as a share of total merchandise imports) 29 40 40
Food imports (millions of US dollars and as a share of total merchandise imports) 14 (9) 96 (19) 127 (22)
Fuel imports (millions of US dollars and as a share of total merchandise imports) 23 (15) 91 (18) 80 (14)
Five-leading trading partners for commodity imports (as a share of total commodity imports) 72
Singapore 35
Australia 19
Viet Nam 7
China 6
Papua New Guinea 5
Percentage change of GDP measured in constant 2010 prices 10.0 13.6 3.1
GDP per capita measured in constant 2010 US dollars 1,420 1,443 1,464
Population (thousands) 204 355 374
Human Development Index (value and rank) .. 0.5426 (150) 0.5460 (149)
Total employment (as a share of the population) 68.6 70.2 70.1
Share of women in total employment 42.9 43.4 43.1
Proportion of population below international poverty line – SDG 1. Indicator 1.1.1 (2005) 45.6 (2013) 25.1
Gini index, latest available year (2005) 46.1 (2013) 37.1
Prevalence of undernourishment (per cent) – SDG 2. Indicator 2.1.1 15.0 12.3
Value added of agriculture/industry/services (as a share of GDP) 45/14/41 27/15/58 27/15/58
Employment in agriculture/industry/services (as a share of total employment) 71/9/21 69/9/21 70/10/21
Share of women in agriculture/industry/services 43/25/45 45/31/45 44/32/45
Institutional quality index, 2018 0.4813
Control of corruption 0.34 –0.25 0.11
Rule of law 0.74 –0.41 –0.21
OTHER STRUCTURAL INDICATORS
KEY SOCIOECONOMIC INDICATORS
COMMODITY IMPORT DEPENDENCE
MERCHANDISE AND COMMODITY EXPORT DEPENDENCE](https://image.slidesharecdn.com/stateofcommoditydependance2019-190524115214/85/State-of-commodity-dependance-2019-192-320.jpg)
![Table of contents Introduction
Chapter 1
Key Findings
from the Report
Chapter 2
Country Statistical
Profiles
List of Country
Statistical Profiles
187
SOMALIA*
1995 2013-2017 2017
Merchandise export value (millions of US dollars) 170 468 430
Unallocated exports (as a share of merchandise exports) 0.3 0.8 0.1
Merchandise export concentration by product line (Herfindahl-Hirschmann index) 0.7021 0.6902 0.5515
Commodity export value (millions of US dollars) 165 436 366
Commodity exports (as a share of total merchandise exports) 97 93 85
Commodity exports (as a share of GDP) 14.7 31.9 25.7
Total natural resources rents (as a share of GDP) .. 15.9 17.7
Exports by commodity group (as a share of merchandise exports) 97 93 85
Agricultural commodities 97 88 84
Fuels – – –
Ores, metals, precious stones and non-monetary gold – 5 1
Three leading commodity exports (as a share of total merchandise exports) 72 84 58
[001] Live animals other than animals of division 03 72 71 57
[222] Oil seeds and oleaginous fruits (excluding flour) – 7 1
[971] Gold, non-monetary (excluding gold ores and concentrates) – 6 –
Average price index of the leading commodity group exported 80.8 109.0 102.7
Five leading destination markets of commodity exports (as a share of total commodity exports) 90
Saudi Arabia 39
Oman 29
United Arab Emirates 13
India 5
China 3
Commodity imports (millions of US dollars) 186 627 582
Commodity imports (as a share of total merchandise imports) 69 54 55
Food imports (millions of US dollars and as a share of total merchandise imports) 157 (58) 534 (46) 476 (45)
Fuel imports (millions of US dollars and as a share of total merchandise imports) 4 (1) 23 (2) 47 (4)
Five-leading trading partners for commodity imports (as a share of total commodity imports) 72
United Arab Emirates 22
India 17
Oman 14
Ethiopia 14
Malaysia 4
Percentage change of GDP measured in constant 2010 prices – 10.8 2.5
GDP per capita measured in constant 2010 US dollars 95 88 87
Population (thousands) 4,215 7,418 7,897
Human Development Index (value and rank) .. .. ..
Total employment (as a share of the population) 45.6 43.2 43.4
Share of women in total employment 20.2 20.1 20.3
Proportion of population below international poverty line – SDG 1. Indicator 1.1.1 .. ..
Gini index, latest available year .. ..
Prevalence of undernourishment (per cent) – SDG 2. Indicator 2.1.1 .. ..
Value added of agriculture/industry/services (as a share of GDP) 60/7/33 60/7/32 60/7/32
Employment in agriculture/industry/services (as a share of total employment) 87/7/6 86/8/6 86/8/6
Share of women in agriculture/industry/services 21/14/9 21/14/9 22/14/9
Institutional quality index, 2018 0.0264
Control of corruption –1.27 –1.65 –1.72
Rule of law –2.14 –2.34 –2.31
MERCHANDISE AND COMMODITY EXPORT DEPENDENCE
COMMODITY IMPORT DEPENDENCE
OTHER STRUCTURAL INDICATORS
KEY SOCIOECONOMIC INDICATORS](https://image.slidesharecdn.com/stateofcommoditydependance2019-190524115214/85/State-of-commodity-dependance-2019-193-320.jpg)
![Table of contents Introduction
Chapter 1
Key Findings
from the Report
Chapter 2
Country Statistical
Profiles
List of Country
Statistical Profiles
188
SOUTH AFRICA
1995 2013-2017 2017
Merchandise export value (millions of US dollars) 27,853 86,059 88,268
Unallocated exports (as a share of merchandise exports) 2.6 0.5 0.8
Merchandise export concentration by product line (Herfindahl-Hirschmann index) 0.1140 0.1260 0.1276
Commodity export value (millions of US dollars) 15,014 48,493 50,723
Commodity exports (as a share of total merchandise exports) 54 56 57
Commodity exports (as a share of GDP) 9.5 14.4 14.6
Total natural resources rents (as a share of GDP) 4.0 5.4 4.7
Exports by commodity group (as a share of merchandise exports) 54 56 57
Agricultural commodities 13 13 13
Fuels 11 10 12
Ores, metals, precious stones and non-monetary gold 30 33 32
Three leading commodity exports (as a share of total merchandise exports) 15 21 19
[681] Silver, platinum, other metals of the platinum group 9 8 7
[281] Iron ore and concentrates 1 6 5
[971] Gold, non-monetary (excluding gold ores and concentrates) 5 6 6
Average price index of the leading commodity group exported 58.3 123.5 127.5
Five leading destination markets of commodity exports (as a share of total commodity exports) 58
European Union (28) 20
China 17
Japan 8
India 7
United States of America 6
Commodity imports (millions of US dollars) 7,451 26,272 22,702
Commodity imports (as a share of total merchandise imports) 24 29 27
Food imports (millions of US dollars and as a share of total merchandise imports) 1,234 (4) 5,641 (6) 5,802 (7)
Fuel imports (millions of US dollars and as a share of total merchandise imports) 4,324 (14) 16,235 (18) 12,249 (15)
Five-leading trading partners for commodity imports (as a share of total commodity imports) 53
Saudi Arabia 17
Nigeria 12
European Union (28) 12
India 6
Angola 6
Percentage change of GDP measured in constant 2010 prices 3.1 7.9 1.2
GDP per capita measured in constant 2010 US dollars 5,529 7,534 7,486
Population (thousands) 26,848 39,039 40,278
Human Development Index (value and rank) 0.6490 (70) 0.6894 (112) 0.6990 (111)
Total employment (as a share of the population) 44.3 40.2 39.8
Share of women in total employment 40.1 43.6 43.7
Proportion of population below international poverty line – SDG 1. Indicator 1.1.1 (1996) 33.8 (2014) 18.9
Gini index, latest available year (1996) 60.7 (2014) 63.0
Prevalence of undernourishment (per cent) – SDG 2. Indicator 2.1.1 5.0 6.1
Value added of agriculture/industry/services (as a share of GDP) 4/34/62 2/29/68 2/29/69
Employment in agriculture/industry/services (as a share of total employment) 19/25/56 5/23/71 6/23/71
Share of women in agriculture/industry/services 43/21/48 31/22/52 30/22/52
Institutional quality index, 2018 0.5787
Control of corruption 0.73 – –0.01
Rule of law 0.09 0.11 –0.01
OTHER STRUCTURAL INDICATORS
KEY SOCIOECONOMIC INDICATORS
COMMODITY IMPORT DEPENDENCE
MERCHANDISE AND COMMODITY EXPORT DEPENDENCE](https://image.slidesharecdn.com/stateofcommoditydependance2019-190524115214/85/State-of-commodity-dependance-2019-194-320.jpg)
![Table of contents Introduction
Chapter 1
Key Findings
from the Report
Chapter 2
Country Statistical
Profiles
List of Country
Statistical Profiles
189
SPAIN
1995 2013-2017 2017
Merchandise export value (millions of US dollars) 89,616 302,000 320,000
Unallocated exports (as a share of merchandise exports) 0.8 3.7 4.6
Merchandise export concentration by product line (Herfindahl-Hirschmann index) 0.1417 0.0984 0.1002
Commodity export value (millions of US dollars) 19,149 80,850 85,930
Commodity exports (as a share of total merchandise exports) 21 27 27
Commodity exports (as a share of GDP) 3.1 6.2 6.5
Total natural resources rents (as a share of GDP) 0.1 0.1 0.1
Exports by commodity group (as a share of merchandise exports) 21 27 27
Agricultural commodities 17 17 17
Fuels 2 6 6
Ores, metals, precious stones and non-monetary gold 3 4 4
Three leading commodity exports (as a share of total merchandise exports) 8 9 9
[334] Petroleum oils or bituminous minerals 70 % oil 1 4 4
[057] Fruits and nuts (excluding oil nuts), fresh or dried 4 3 3
[054] Vegetables 3 2 2
Average price index of the leading commodity group exported 36.5 132.1 103.8
Five leading destination markets of commodity exports (as a share of total commodity exports) 80
European Union (28) 68
United States of America 5
China 3
Morocco 3
Gibraltar 2
Commodity imports (millions of US dollars) 33,072 108,155 103,612
Commodity imports (as a share of total merchandise imports) 29 33 30
Food imports (millions of US dollars and as a share of total merchandise imports) 13,562 (12) 33,162 (10) 35,744 (10)
Fuel imports (millions of US dollars and as a share of total merchandise imports) 9,442 (8) 54,094 (16) 45,517 (13)
Five-leading trading partners for commodity imports (as a share of total commodity imports) 55
European Union (28) 33
Algeria 8
Nigeria 6
Russian Federation 5
Saudi Arabia 4
Percentage change of GDP measured in constant 2010 prices 2.8 1.5 3.1
GDP per capita measured in constant 2010 US dollars 23,588 30,633 32,573
Population (thousands) 33,236 39,573 39,546
Human Development Index (value and rank) 0.8000 (21) 0.8840 (24) 0.8910 (24)
Total employment (as a share of the population) 38.6 45.6 47.9
Share of women in total employment 34.0 45.3 45.3
Proportion of population below international poverty line – SDG 1. Indicator 1.1.1 (2003) 0.7 (2015) 1.0
Gini index, latest available year (2003) 31.8 (2015) 36.2
Prevalence of undernourishment (per cent) – SDG 2. Indicator 2.1.1 2.5 2.5
Value added of agriculture/industry/services (as a share of GDP) 4/31/65 3/23/74 3/23/74
Employment in agriculture/industry/services (as a share of total employment) 9/30/61 4/20/76 4/19/76
Share of women in agriculture/industry/services 27/16/44 23/20/53 23/19/53
Institutional quality index, 2018 0.7767
Control of corruption 1.13 0.62 0.49
Rule of law 1.44 0.97 1.01
MERCHANDISE AND COMMODITY EXPORT DEPENDENCE
COMMODITY IMPORT DEPENDENCE
OTHER STRUCTURAL INDICATORS
KEY SOCIOECONOMIC INDICATORS](https://image.slidesharecdn.com/stateofcommoditydependance2019-190524115214/85/State-of-commodity-dependance-2019-195-320.jpg)
![Table of contents Introduction
Chapter 1
Key Findings
from the Report
Chapter 2
Country Statistical
Profiles
List of Country
Statistical Profiles
190
SRI LANKA
1995 2013-2017 2017
Merchandise export value (millions of US dollars) 3,798 10,805 11,741
Unallocated exports (as a share of merchandise exports) 0.7 – 0.1
Merchandise export concentration by product line (Herfindahl-Hirschmann index) 0.2168 0.2030 0.1920
Commodity export value (millions of US dollars) 1,152 3,581 3,901
Commodity exports (as a share of total merchandise exports) 30 33 33
Commodity exports (as a share of GDP) 7.5 4.4 4.5
Total natural resources rents (as a share of GDP) 0.4 0.1 0.1
Exports by commodity group (as a share of merchandise exports) 31 33 33
Agricultural commodities 23 28 28
Fuels 1 2 3
Ores, metals, precious stones and non-monetary gold 7 3 3
Three leading commodity exports (as a share of total merchandise exports) 18 19 18
[074] Tea and mate 10 14 13
[075] Spices 1 3 3
[667] Pearls, precious semi-precious stones 6 3 2
Average price index of the leading commodity group exported 87.2 98.3 93.7
Five leading destination markets of commodity exports (as a share of total commodity exports) 44
European Union (28) 17
India 10
United States of America 7
Russian Federation 6
Iran (Islamic Republic of) 5
Commodity imports (millions of US dollars) 1,239 6,835 7,430
Commodity imports (as a share of total merchandise imports) 24 35 35
Food imports (millions of US dollars and as a share of total merchandise imports) 728 (14) 2,328 (12) 2,645 (12)
Fuel imports (millions of US dollars and as a share of total merchandise imports) 115 (2) 3,360 (17) 3,215 (15)
Five-leading trading partners for commodity imports (as a share of total commodity imports) 58
United Arab Emirates 18
India 17
Singapore 14
China 5
Malaysia 5
Percentage change of GDP measured in constant 2010 prices 5.5 23.9 3.3
GDP per capita measured in constant 2010 US dollars 1,466 3,675 3,944
Population (thousands) 12,864 15,629 15,864
Human Development Index (value and rank) 0.6500 (69) 0.7652 (74) 0.7700 (74)
Total employment (as a share of the population) 48.8 51.7 51.4
Share of women in total employment 29.7 33.2 33.6
Proportion of population below international poverty line – SDG 1. Indicator 1.1.1 (1995) 8.8 (2016) 0.7
Gini index, latest available year (1995) 35.4 (2016) 39.8
Prevalence of undernourishment (per cent) – SDG 2. Indicator 2.1.1 18.6 10.9
Value added of agriculture/industry/services (as a share of GDP) 17/33/51 8/30/61 8/30/62
Employment in agriculture/industry/services (as a share of total employment) 40/25/36 28/26/46 27/26/48
Share of women in agriculture/industry/services 32/36/23 37/33/31 37/33/32
Institutional quality index, 2018 0.4353
Control of corruption –0.06 –0.33 –0.45
Rule of law 0.16 –0.05 0.06
MERCHANDISE AND COMMODITY EXPORT DEPENDENCE
COMMODITY IMPORT DEPENDENCE
OTHER STRUCTURAL INDICATORS
KEY SOCIOECONOMIC INDICATORS](https://image.slidesharecdn.com/stateofcommoditydependance2019-190524115214/85/State-of-commodity-dependance-2019-196-320.jpg)
![Table of contents Introduction
Chapter 1
Key Findings
from the Report
Chapter 2
Country Statistical
Profiles
List of Country
Statistical Profiles
191
SUDAN*
1995 2013-2017 2017
Merchandise export value (millions of US dollars) .. 4,402 4,241
Unallocated exports (as a share of merchandise exports) .. – –
Merchandise export concentration by product line (Herfindahl-Hirschmann index) .. 0.5507 0.4779
Commodity export value (millions of US dollars) .. 4,303 4,123
Commodity exports (as a share of total merchandise exports) .. 98 97
Commodity exports (as a share of GDP) .. 5.3 3.9
Total natural resources rents (as a share of GDP) .. 6.1 4.8
Exports by commodity group (as a share of merchandise exports) .. 98 97
Agricultural commodities .. 18 28
Fuels .. 55 44
Ores, metals, precious stones and non-monetary gold .. 25 25
Three leading commodity exports (as a share of total merchandise exports) .. 84 77
[333] Petroleum oils, oils from bitumin. materials, crude .. 53 43
[971] Gold, non-monetary (excluding gold ores and concentrates) .. 25 24
[001] Live animals other than animals of division 03 .. 6 10
Average price index of the leading commodity group exported .. 98.3 93.7
Five leading destination markets of commodity exports (as a share of total commodity exports) 89
China 46
United Arab Emirates 26
Saudi Arabia 8
Japan 6
European Union (28) 3
Commodity imports (millions of US dollars) .. 2,686 2,576
Commodity imports (as a share of total merchandise imports) .. 29 28
Food imports (millions of US dollars and as a share of total merchandise imports) .. 2,033 (22) 2,102 (23)
Fuel imports (millions of US dollars and as a share of total merchandise imports) .. 410 (4) 270 (3)
Five-leading trading partners for commodity imports (as a share of total commodity imports) .. 41
European Union (28) 12
India 9
Egypt 8
Turkey 6
United Arab Emirates 6
Percentage change of GDP measured in constant 2010 prices .. 9.0 3.1
GDP per capita measured in constant 2010 US dollars .. 1,535 1,561
Population (thousands) 13,454 22,629 23,987
Human Development Index (value and rank) 0.3660 (134) 0.4930 (162) 0.5020 (164)
Total employment (as a share of the population) 44.2 40.7 40.6
Share of women in total employment 23.2 22.5 22.7
Proportion of population below international poverty line – SDG 1. Indicator 1.1.1 (2009) 14.9 ..
Gini index, latest available year (2009) 35.4 ..
Prevalence of undernourishment (per cent) – SDG 2. Indicator 2.1.1 – 25.2
Value added of agriculture/industry/services (as a share of GDP) .. 32/21/48 32/21/48
Employment in agriculture/industry/services (as a share of total employment) 61/18/21 53/19/28 53/19/28
Share of women in agriculture/industry/services 21/41/16 20/37/18 20/38/18
Institutional quality index, 2018 0.0859
Control of corruption –1.24 –1.50 –1.54
Rule of law –1.71 –1.20 –1.11
OTHER STRUCTURAL INDICATORS
KEY SOCIOECONOMIC INDICATORS
COMMODITY IMPORT DEPENDENCE
MERCHANDISE AND COMMODITY EXPORT DEPENDENCE](https://image.slidesharecdn.com/stateofcommoditydependance2019-190524115214/85/State-of-commodity-dependance-2019-197-320.jpg)
![Table of contents Introduction
Chapter 1
Key Findings
from the Report
Chapter 2
Country Statistical
Profiles
List of Country
Statistical Profiles
192
SURINAME
1995 2013-2017 2017
Merchandise export value (millions of US dollars) 483 1,827 2,043
Unallocated exports (as a share of merchandise exports) 1.4 22.8 0.3
Merchandise export concentration by product line (Herfindahl-Hirschmann index) 0.5686 0.5558 0.7474
Commodity export value (millions of US dollars) 458 1,354 1,991
Commodity exports (as a share of total merchandise exports) 95 74 97
Commodity exports (as a share of GDP) 54.3 31.0 59.9
Total natural resources rents (as a share of GDP) 7.9 24.4 29.0
Exports by commodity group (as a share of merchandise exports) 95 74 97
Agricultural commodities 20 12 14
Fuels 2 10 7
Ores, metals, precious stones and non-monetary gold 74 53 76
Three leading commodity exports (as a share of total merchandise exports) 63 62 83
[971] Gold, non-monetary (excluding gold ores and concentrates) 5 47 76
[334] Petroleum oils or bituminous minerals 70 % oil – 9 7
[285] Aluminium ores and concentrates (incl. alumina) 58 5 0
Average price index of the leading commodity group exported 33.4 110.1 107.6
Five leading destination markets of commodity exports (as a share of total commodity exports) 79
Switzerland 27
United Arab Emirates 21
European Union (28) 14
United States of America 9
Guyana 7
Commodity imports (millions of US dollars) 251 538 354
Commodity imports (as a share of total merchandise imports) 43 32 29
Food imports (millions of US dollars and as a share of total merchandise imports) 57 (10) 206 (12) 180 (15)
Fuel imports (millions of US dollars and as a share of total merchandise imports) 176 (30) 263 (16) 111 (9)
Five-leading trading partners for commodity imports (as a share of total commodity imports) 77
Trinidad and Tobago 28
European Union (28) 18
Curaçao 13
United States of America 12
Saint Lucia 6
Percentage change of GDP measured in constant 2010 prices – 3.5 –0.7
GDP per capita measured in constant 2010 US dollars 5,586 8,533 7,980
Population (thousands) 292 404 414
Human Development Index (value and rank) .. 0.7188 (99) 0.7200 (98)
Total employment (as a share of the population) 45.9 49.7 49.0
Share of women in total employment 32.1 37.6 37.4
Proportion of population below international poverty line – SDG 1. Indicator 1.1.1 (1999) 23.4 ..
Gini index, latest available year (1999) 57.6 ..
Prevalence of undernourishment (per cent) – SDG 2. Indicator 2.1.1 13.0 7.6
Value added of agriculture/industry/services (as a share of GDP) 30/28/43 10/32/58 10/32/58
Employment in agriculture/industry/services (as a share of total employment) 6/22/72 3/24/73 3/24/73
Share of women in agriculture/industry/services 12/10/41 16/11/47 14/12/47
Institutional quality index, 2018 0.4101
Control of corruption 0.19 –0.29 –0.17
Rule of law –0.08 –0.14 –0.15
MERCHANDISE AND COMMODITY EXPORT DEPENDENCE
COMMODITY IMPORT DEPENDENCE
OTHER STRUCTURAL INDICATORS
KEY SOCIOECONOMIC INDICATORS](https://image.slidesharecdn.com/stateofcommoditydependance2019-190524115214/85/State-of-commodity-dependance-2019-198-320.jpg)
![Table of contents Introduction
Chapter 1
Key Findings
from the Report
Chapter 2
Country Statistical
Profiles
List of Country
Statistical Profiles
193
SWEDEN
1995 2013-2017 2017
Merchandise export value (millions of US dollars) 77,436 152,800 153,000
Unallocated exports (as a share of merchandise exports) 7.7 4.2 4.3
Merchandise export concentration by product line (Herfindahl-Hirschmann index) 0.1272 0.0904 0.0899
Commodity export value (millions of US dollars) 10,640 33,614 33,300
Commodity exports (as a share of total merchandise exports) 14 22 22
Commodity exports (as a share of GDP) 4.0 6.2 6.2
Total natural resources rents (as a share of GDP) 0.4 0.6 0.4
Exports by commodity group (as a share of merchandise exports) 14 22 22
Agricultural commodities 9 10 10
Fuels 2 7 6
Ores, metals, precious stones and non-monetary gold 3 5 5
Three leading commodity exports (as a share of total merchandise exports) 8 12 11
[334] Petroleum oils or bituminous minerals 70 % oil 2 6 5
[24 + 25] Forestry products 6 4 4
[03] Fishery products – 3 3
Average price index of the leading commodity group exported 87.2 98.3 93.7
Five leading destination markets of commodity exports (as a share of total commodity exports) 88
European Union (28) 72
Norway 9
United States of America 3
Switzerland 2
China 2
Commodity imports (millions of US dollars) 11,441 39,688 37,897
Commodity imports (as a share of total merchandise imports) 19 26 25
Food imports (millions of US dollars and as a share of total merchandise imports) 3,728 (6) 14,765 (10) 14,919 (10)
Fuel imports (millions of US dollars and as a share of total merchandise imports) 3,589 (6) 17,270 (11) 15,461 (10)
Five-leading trading partners for commodity imports (as a share of total commodity imports) 91
European Union (28) 53
Norway 22
Russian Federation 12
Nigeria 3
United States of America 2
Percentage change of GDP measured in constant 2010 prices 4.0 10.0 2.3
GDP per capita measured in constant 2010 US dollars 37,646 55,344 57,882
Population (thousands) 7,172 8,081 8,173
Human Development Index (value and rank) 0.8560 (6) 0.9252 (10) 0.9330 (7)
Total employment (as a share of the population) 58.0 59.2 59.7
Share of women in total employment 47.9 47.7 47.8
Proportion of population below international poverty line – SDG 1. Indicator 1.1.1 (2003) 0.2 (2015) 0.5
Gini index, latest available year (2003) 25.3 (2015) 29.2
Prevalence of undernourishment (per cent) – SDG 2. Indicator 2.1.1 2.5 2.5
Value added of agriculture/industry/services (as a share of GDP) 3/31/66 1/25/73 1/25/74
Employment in agriculture/industry/services (as a share of total employment) 3/25/72 2/18/80 2/18/80
Share of women in agriculture/industry/services 23/21/58 24/18/55 25/18/55
Institutional quality index, 2018 0.9540
Control of corruption 2.17 2.20 2.14
Rule of law 1.80 1.99 1.94
COMMODITY IMPORT DEPENDENCE
MERCHANDISE AND COMMODITY EXPORT DEPENDENCE
KEY SOCIOECONOMIC INDICATORS
OTHER STRUCTURAL INDICATORS](https://image.slidesharecdn.com/stateofcommoditydependance2019-190524115214/85/State-of-commodity-dependance-2019-199-320.jpg)
![Table of contents Introduction
Chapter 1
Key Findings
from the Report
Chapter 2
Country Statistical
Profiles
List of Country
Statistical Profiles
194
SWITZERLAND
1995 2013-2017 2017
Merchandise export value (millions of US dollars) 81,641 313,000 299,000
Unallocated exports (as a share of merchandise exports) – 1.2 1.2
Merchandise export concentration by product line (Herfindahl-Hirschmann index) 0.0901 0.2846 0.2576
Commodity export value (millions of US dollars) 7,402 106,669 87,337
Commodity exports (as a share of total merchandise exports) 9 34 29
Commodity exports (as a share of GDP) 2.1 15.4 12.7
Total natural resources rents (as a share of GDP) – – –
Exports by commodity group (as a share of merchandise exports) 9 34 29
Agricultural commodities 4 3 3
Fuels – 1 1
Ores, metals, precious stones and non-monetary gold 5 30 25
Three leading commodity exports (as a share of total merchandise exports) 3 29 24
[971] Gold, non-monetary (excluding gold ores and concentrates) – 27 23
[681] Silver, platinum, other metals of the platinum group 1 1 1
[667] Pearls, precious semi-precious stones 2 1 1
Average price index of the leading commodity group exported 33.4 110.1 107.6
Five leading destination markets of commodity exports (as a share of total commodity exports) 81
European Union (28) 27
China, Hong Kong SAR 20
India 18
China 12
Singapore 5
Commodity imports (millions of US dollars) 13,562 117,016 101,902
Commodity imports (as a share of total merchandise imports) 17 42 38
Food imports (millions of US dollars and as a share of total merchandise imports) 4,156 (5) 9,557 (3) 9,638 (4)
Fuel imports (millions of US dollars and as a share of total merchandise imports) 2,317 (3) 10,595 (4) 8,197 (3)
Five-leading trading partners for commodity imports (as a share of total commodity imports) 71
European Union (28) 52
United States of America 8
United Arab Emirates 5
China, Hong Kong SAR 3
Peru 2
Percentage change of GDP measured in constant 2010 prices 0.5 7.0 1.1
GDP per capita measured in constant 2010 US dollars 62,187 76,421 76,956
Population (thousands) 5,780 7,081 7,215
Human Development Index (value and rank) 0.8480 (9) 0.9412 (2) 0.9440 (2)
Total employment (as a share of the population) 64.8 64.9 65.1
Share of women in total employment 42.8 46.4 46.5
Proportion of population below international poverty line – SDG 1. Indicator 1.1.1 (2006) – (2015) –
Gini index, latest available year (2006) 33.9 (2015) 32.3
Prevalence of undernourishment (per cent) – SDG 2. Indicator 2.1.1 2.5 2.5
Value added of agriculture/industry/services (as a share of GDP) 2/30/68 1/26/73 1/26/73
Employment in agriculture/industry/services (as a share of total employment) 4/28/68 3/21/75 4/21/76
Share of women in agriculture/industry/services 36/23/51 38/23/53 40/23/53
Institutional quality index, 2018 0.9645
Control of corruption 1.99 2.08 1.99
Rule of law 1.93 1.92 1.93
KEY SOCIOECONOMIC INDICATORS
OTHER STRUCTURAL INDICATORS
COMMODITY IMPORT DEPENDENCE
MERCHANDISE AND COMMODITY EXPORT DEPENDENCE](https://image.slidesharecdn.com/stateofcommoditydependance2019-190524115214/85/State-of-commodity-dependance-2019-200-320.jpg)
![Table of contents Introduction
Chapter 1
Key Findings
from the Report
Chapter 2
Country Statistical
Profiles
List of Country
Statistical Profiles
195
SYRIAN ARAB REPUBLIC
1995 2013-2017 2017
Merchandise export value (millions of US dollars) 3,563 2,080 1,800
Unallocated exports (as a share of merchandise exports) 0.1 0.4 –
Merchandise export concentration by product line (Herfindahl-Hirschmann index) 0.5272 0.1790 0.1698
Commodity export value (millions of US dollars) 3,067 1,408 1,243
Commodity exports (as a share of total merchandise exports) 86 68 69
Commodity exports (as a share of GDP) 22.6 5.0 4.8
Total natural resources rents (as a share of GDP) 23.2 .. ..
Exports by commodity group (as a share of merchandise exports) 86 68 69
Agricultural commodities 22 46 48
Fuels 63 17 17
Ores, metals, precious stones and non-monetary gold 1 5 4
Three leading commodity exports (as a share of total merchandise exports) 63 30 32
[111] Non-alcoholic beverages, n.e.s. – 14 15
[333] Petroleum oils, oils from bitumin. materials, crude 54 10 10
[334] Petroleum oils or bituminous minerals 70 % oil 9 6 6
Average price index of the leading commodity group exported 80.8 109.0 102.7
Five leading destination markets of commodity exports (as a share of total commodity exports) 77
Iraq 41
European Union (28) 17
Lebanon 9
Jordan 6
Turkey 4
Commodity imports (millions of US dollars) 1,055 2,671 2,500
Commodity imports (as a share of total merchandise imports) 22 49 49
Food imports (millions of US dollars and as a share of total merchandise imports) 756 (16) 974 (18) 899 (18)
Fuel imports (millions of US dollars and as a share of total merchandise imports) 51 (1) 1,364 (25) 1,254 (25)
Five-leading trading partners for commodity imports (as a share of total commodity imports) 76
Russian Federation 43
European Union (28) 13
Turkey 13
Ukraine 4
Egypt 3
Percentage change of GDP measured in constant 2010 prices 7.0 –37.5 –2.0
GDP per capita measured in constant 2010 US dollars 2,169 1,670 1,629
Population (thousands) 8,047 11,807 11,587
Human Development Index (value and rank) 0.5790 (90) 0.5464 (149) 0.5360 (152)
Total employment (as a share of the population) 49.0 35.6 35.0
Share of women in total employment 20.4 10.6 10.5
Proportion of population below international poverty line – SDG 1. Indicator 1.1.1 (2004) 1.7 ..
Gini index, latest available year (2004) 35.8 ..
Prevalence of undernourishment (per cent) – SDG 2. Indicator 2.1.1 .. ..
Value added of agriculture/industry/services (as a share of GDP) 28/18/54 21/30/49 21/30/49
Employment in agriculture/industry/services (as a share of total employment) 28/31/41 21/32/47 23/33/44
Share of women in agriculture/industry/services 43/7/14 10/4/15 10/5/15
Institutional quality index, 2018 0.0447
Control of corruption –0.88 –1.50 –1.56
Rule of law –0.55 –1.65 –2.09
MERCHANDISE AND COMMODITY EXPORT DEPENDENCE
COMMODITY IMPORT DEPENDENCE
KEY SOCIOECONOMIC INDICATORS
OTHER STRUCTURAL INDICATORS](https://image.slidesharecdn.com/stateofcommoditydependance2019-190524115214/85/State-of-commodity-dependance-2019-201-320.jpg)
![Table of contents Introduction
Chapter 1
Key Findings
from the Report
Chapter 2
Country Statistical
Profiles
List of Country
Statistical Profiles
196
TAJIKISTAN
1995 2013-2017 2017
Merchandise export value (millions of US dollars) 749 1,007 1,176
Unallocated exports (as a share of merchandise exports) 0.1 2.1 0.2
Merchandise export concentration by product line (Herfindahl-Hirschmann index) 0.4413 0.3698 0.3067
Commodity export value (millions of US dollars) 635 847 955
Commodity exports (as a share of total merchandise exports) 85 84 81
Commodity exports (as a share of GDP) 52.1 10.6 13.1
Total natural resources rents (as a share of GDP) 0.3 2.2 3.0
Exports by commodity group (as a share of merchandise exports) 85 84 81
Agricultural commodities 47 28 26
Fuels 1 1 2
Ores, metals, precious stones and non-monetary gold 37 55 54
Three leading commodity exports (as a share of total merchandise exports) 68 61 54
[684] Aluminium 34 33 26
[263] Cotton 33 18 15
[287] Ores and concentrates of base metals, n.e.s. 1 10 13
Average price index of the leading commodity group exported 58.3 123.5 127.5
Five leading destination markets of commodity exports (as a share of total commodity exports) 67
Turkey 25
China 13
Russian Federation 11
Switzerland 10
Kazakhstan 8
Commodity imports (millions of US dollars) 432 1,390 1,126
Commodity imports (as a share of total merchandise imports) 53 39 41
Food imports (millions of US dollars and as a share of total merchandise imports) 159 (20) 563 (16) 483 (17)
Fuel imports (millions of US dollars and as a share of total merchandise imports) 114 (14) 536 (15) 393 (14)
Five-leading trading partners for commodity imports (as a share of total commodity imports) 78
Russian Federation 35
Kazakhstan 23
Uzbekistan 8
China 6
European Union (28) 5
Percentage change of GDP measured in constant 2010 prices –12.4 28.5 7.1
GDP per capita measured in constant 2010 US dollars 450 889 969
Population (thousands) 3,212 5,541 5,776
Human Development Index (value and rank) 0.5500 (100) 0.6466 (124) 0.6500 (124)
Total employment (as a share of the population) 53.4 53.0 53.2
Share of women in total employment 40.5 38.6 38.4
Proportion of population below international poverty line – SDG 1. Indicator 1.1.1 (1999) 54.4 (2015) 4.8
Gini index, latest available year (1999) 29.5 (2015) 34.0
Prevalence of undernourishment (per cent) – SDG 2. Indicator 2.1.1 .. ..
Value added of agriculture/industry/services (as a share of GDP) 32/48/20 24/27/48 23/30/47
Employment in agriculture/industry/services (as a share of total employment) 61/18/21 52/16/32 52/16/32
Share of women in agriculture/industry/services 52/13/30 52/10/31 51/10/32
Institutional quality index, 2018 0.2554
Control of corruption –1.27 –1.20 –1.33
Rule of law –1.65 –1.16 –1.35
OTHER STRUCTURAL INDICATORS
MERCHANDISE AND COMMODITY EXPORT DEPENDENCE
COMMODITY IMPORT DEPENDENCE
KEY SOCIOECONOMIC INDICATORS](https://image.slidesharecdn.com/stateofcommoditydependance2019-190524115214/85/State-of-commodity-dependance-2019-202-320.jpg)
![Table of contents Introduction
Chapter 1
Key Findings
from the Report
Chapter 2
Country Statistical
Profiles
List of Country
Statistical Profiles
197
THAILAND
1995 2013-2017 2017
Merchandise export value (millions of US dollars) 56,439 223,400 235,000
Unallocated exports (as a share of merchandise exports) 0.8 0.2 –
Merchandise export concentration by product line (Herfindahl-Hirschmann index) 0.0895 0.0762 0.0719
Commodity export value (millions of US dollars) 15,929 59,208 62,340
Commodity exports (as a share of total merchandise exports) 28 27 27
Commodity exports (as a share of GDP) 9.4 14.2 13.9
Total natural resources rents (as a share of GDP) 0.6 1.8 1.2
Exports by commodity group (as a share of merchandise exports) 28 27 27
Agricultural commodities 25 18 18
Fuels 1 4 3
Ores, metals, precious stones and non-monetary gold 3 5 5
Three leading commodity exports (as a share of total merchandise exports) 12 9 8
[334] Petroleum oils or bituminous minerals 70 % oil – 3 3
[03] Fishery products 8 3 3
[231] Natural rubber similar gums, in primary forms 4 3 3
Average price index of the leading commodity group exported 36.5 132.1 103.8
Five leading destination markets of commodity exports (as a share of total commodity exports) 47
China 16
Japan 10
European Union (28) 8
United States of America 7
Singapore 6
Commodity imports (millions of US dollars) 14,190 72,487 69,648
Commodity imports (as a share of total merchandise imports) 20 33 31
Food imports (millions of US dollars and as a share of total merchandise imports) 2,400 (3) 12,511 (6) 13,419 (6)
Fuel imports (millions of US dollars and as a share of total merchandise imports) 4,775 (7) 37,158 (17) 30,739 (14)
Five-leading trading partners for commodity imports (as a share of total commodity imports) 38
United Arab Emirates 14
Saudi Arabia 8
Switzerland 6
Australia 6
Indonesia 5
Percentage change of GDP measured in constant 2010 prices 8.1 13.8 3.9
GDP per capita measured in constant 2010 US dollars 3,522 5,806 6,180
Population (thousands) 43,378 56,307 57,081
Human Development Index (value and rank) 0.6110 (81) 0.7414 (88) 0.7550 (81)
Total employment (as a share of the population) 73.8 69.1 67.8
Share of women in total employment 45.2 45.7 45.6
Proportion of population below international poverty line – SDG 1. Indicator 1.1.1 (1996) 2.2 (2015) –
Gini index, latest available year (1996) 42.9 (2015) 36.0
Prevalence of undernourishment (per cent) – SDG 2. Indicator 2.1.1 18.8 9.0
Value added of agriculture/industry/services (as a share of GDP) 9/38/53 10/37/54 8/36/56
Employment in agriculture/industry/services (as a share of total employment) 52/20/28 34/23/43 33/23/45
Share of women in agriculture/industry/services 46/41/45 42/40/51 42/39/51
Institutional quality index, 2018 0.5258
Control of corruption –0.36 –0.41 –0.39
Rule of law 0.54 –0.08 0.04
OTHER STRUCTURAL INDICATORS
MERCHANDISE AND COMMODITY EXPORT DEPENDENCE
COMMODITY IMPORT DEPENDENCE
KEY SOCIOECONOMIC INDICATORS](https://image.slidesharecdn.com/stateofcommoditydependance2019-190524115214/85/State-of-commodity-dependance-2019-203-320.jpg)
![Table of contents Introduction
Chapter 1
Key Findings
from the Report
Chapter 2
Country Statistical
Profiles
List of Country
Statistical Profiles
198
TIMOR-LESTE*
1995 2013-2017 2017
Merchandise export value (millions of US dollars) .. 18 17
Unallocated exports (as a share of merchandise exports) .. 0.7 0.8
Merchandise export concentration by product line (Herfindahl-Hirschmann index) .. 0.6735 0.6124
Commodity export value (millions of US dollars) .. 16 15
Commodity exports (as a share of total merchandise exports) .. 91 89
Commodity exports (as a share of GDP) .. 0.4 0.5
Total natural resources rents (as a share of GDP) .. 29.4 20.2
Exports by commodity group (as a share of merchandise exports) .. 91 89
Agricultural commodities .. 21 27
Fuels .. 69 61
Ores, metals, precious stones and non-monetary gold .. 1 1
Three leading commodity exports (as a share of total merchandise exports) .. 87 83
[333] Petroleum oils, oils from bitumin. materials, crude .. 62 60
[071] Coffee and coffee substitutes .. 18 22
[342] Liquefied propane and butane .. 7 1
Average price index of the leading commodity group exported .. 132.1 103.8
Five leading destination markets of commodity exports (as a share of total commodity exports) 86
Singapore 36
Republic of Korea 21
Thailand 15
Indonesia 7
European Union (28) 7
Commodity imports (millions of US dollars) .. 408 363
Commodity imports (as a share of total merchandise imports) .. 49 47
Food imports (millions of US dollars and as a share of total merchandise imports) .. 215 (26) 213 (27)
Fuel imports (millions of US dollars and as a share of total merchandise imports) .. 93 (11) 60 (8)
Five-leading trading partners for commodity imports (as a share of total commodity imports) .. 82
Viet Nam 25
Indonesia 22
Malaysia 16
Singapore 13
Australia 7
Percentage change of GDP measured in constant 2010 prices .. –12.0 –0.5
GDP per capita measured in constant 2010 US dollars .. 3,036 3,009
Population (thousands) 501 694 731
Human Development Index (value and rank) .. 0.6220 (129) 0.6250 (129)
Total employment (as a share of the population) 56.9 38.0 37.5
Share of women in total employment 32.3 31.4 31.4
Proportion of population below international poverty line – SDG 1. Indicator 1.1.1 (2001) 46.0 (2014) 30.3
Gini index, latest available year (2001) 35.9 (2014) 28.7
Prevalence of undernourishment (per cent) – SDG 2. Indicator 2.1.1 40.4 27.2
Value added of agriculture/industry/services (as a share of GDP) .. 7/69/24 7/69/24
Employment in agriculture/industry/services (as a share of total employment) 51/9/40 34/14/52 25/15/60
Share of women in agriculture/industry/services 34/28/32 36/16/33 35/13/34
Institutional quality index, 2018 0.2912
Control of corruption – –0.56 –0.54
Rule of law –1.57 –1.16 –1.17
MERCHANDISE AND COMMODITY EXPORT DEPENDENCE
COMMODITY IMPORT DEPENDENCE
KEY SOCIOECONOMIC INDICATORS
OTHER STRUCTURAL INDICATORS](https://image.slidesharecdn.com/stateofcommoditydependance2019-190524115214/85/State-of-commodity-dependance-2019-204-320.jpg)
![Table of contents Introduction
Chapter 1
Key Findings
from the Report
Chapter 2
Country Statistical
Profiles
List of Country
Statistical Profiles
199
TOGO*
1995 2013-2017 2017
Merchandise export value (millions of US dollars) 383 1,175 982
Unallocated exports (as a share of merchandise exports) 0.2 0.5 0.6
Merchandise export concentration by product line (Herfindahl-Hirschmann index) 0.3596 0.2342 0.2433
Commodity export value (millions of US dollars) 337 816 706
Commodity exports (as a share of total merchandise exports) 88 69 72
Commodity exports (as a share of GDP) 20.3 18.3 14.7
Total natural resources rents (as a share of GDP) 12.6 21.8 19.8
Exports by commodity group (as a share of merchandise exports) 88 69 72
Agricultural commodities 48 20 23
Fuels 6 19 26
Ores, metals, precious stones and non-monetary gold 34 30 23
Three leading commodity exports (as a share of total merchandise exports) 32 40 41
[971] Gold, non-monetary (excluding gold ores and concentrates) 5 20 16
[334] Petroleum oils or bituminous minerals 70 % oil 2 12 20
[272] Crude fertilizers (excluding those of division 56) 25 7 4
Average price index of the leading commodity group exported 33.4 110.1 107.6
Five leading destination markets of commodity exports (as a share of total commodity exports) 49
United Arab Emirates 12
India 11
Switzerland 9
Cameroon 9
Benin 8
Commodity imports (millions of US dollars) 223 1,438 1,438
Commodity imports (as a share of total merchandise imports) 40 59 61
Food imports (millions of US dollars and as a share of total merchandise imports) 91 (16) 207 (8) 222 (9)
Fuel imports (millions of US dollars and as a share of total merchandise imports) 98 (18) 1,182 (48) 1,168 (50)
Five-leading trading partners for commodity imports (as a share of total commodity imports) 75
European Union (28) 54
United States of America 8
Republic of Korea 5
India 4
Malaysia 3
Percentage change of GDP measured in constant 2010 prices 6.8 25.9 5.3
GDP per capita measured in constant 2010 US dollars 579 621 655
Population (thousands) 2,329 4,303 4,555
Human Development Index (value and rank) 0.4090 (126) 0.4902 (166) 0.5030 (162)
Total employment (as a share of the population) 80.3 76.4 76.1
Share of women in total employment 50.2 49.4 49.4
Proportion of population below international poverty line – SDG 1. Indicator 1.1.1 (2006) 55.6 (2015) 49.2
Gini index, latest available year (2006) 42.2 (2015) 43.1
Prevalence of undernourishment (per cent) – SDG 2. Indicator 2.1.1 31.1 16.2
Value added of agriculture/industry/services (as a share of GDP) 33/20/47 29/18/53 29/17/54
Employment in agriculture/industry/services (as a share of total employment) 44/18/38 39/18/43 38/17/45
Share of women in agriculture/industry/services 45/57/53 44/51/54 44/50/54
Institutional quality index, 2018 0.2325
Control of corruption –0.84 –0.81 –0.71
Rule of law –0.73 –0.80 –0.71
OTHER STRUCTURAL INDICATORS
MERCHANDISE AND COMMODITY EXPORT DEPENDENCE
COMMODITY IMPORT DEPENDENCE
KEY SOCIOECONOMIC INDICATORS](https://image.slidesharecdn.com/stateofcommoditydependance2019-190524115214/85/State-of-commodity-dependance-2019-205-320.jpg)
![Table of contents Introduction
Chapter 1
Key Findings
from the Report
Chapter 2
Country Statistical
Profiles
List of Country
Statistical Profiles
200
TONGA
1995 2013-2017 2017
Merchandise export value (millions of US dollars) 15 22 32
Unallocated exports (as a share of merchandise exports) 11.7 1.6 1.6
Merchandise export concentration by product line (Herfindahl-Hirschmann index) 0.4696 0.3321 0.3343
Commodity export value (millions of US dollars) 13 19 27
Commodity exports (as a share of total merchandise exports) 85 83 84
Commodity exports (as a share of GDP) 6.3 4.4 6.3
Total natural resources rents (as a share of GDP) 0.1 – –
Exports by commodity group (as a share of merchandise exports) 84 83 84
Agricultural commodities 84 80 82
Fuels – – –
Ores, metals, precious stones and non-monetary gold – 3 2
Three leading commodity exports (as a share of total merchandise exports) 69 67 70
[03] Fishery products 18 33 37
[054] Vegetables 50 28 27
[057] Fruits and nuts (excluding oil nuts), fresh or dried 2 6 6
Average price index of the leading commodity group exported 80.8 109.0 102.7
Five leading destination markets of commodity exports (as a share of total commodity exports) 81
New Zealand 21
Japan 18
China, Hong Kong SAR 17
United States of America 15
Republic of Korea 9
Commodity imports (millions of US dollars) 32 103 94
Commodity imports (as a share of total merchandise imports) 41 49 47
Food imports (millions of US dollars and as a share of total merchandise imports) 20 (26) 54 (26) 52 (26)
Fuel imports (millions of US dollars and as a share of total merchandise imports) 3 (4) 36 (17) 30 (15)
Five-leading trading partners for commodity imports (as a share of total commodity imports) -
New Zealand 25
Fiji 24
Singapore 20
United States of America 13
Australia 4
Percentage change of GDP measured in constant 2010 prices 4.0 5.9 3.7
GDP per capita measured in constant 2010 US dollars 3,089 3,742 3,946
Population (thousands) 58 67 69
Human Development Index (value and rank) 0.6710 (59) 0.7208 (97) 0.7260 (96)
Total employment (as a share of the population) 58.6 59.1 59.4
Share of women in total employment 38.2 38.2 39.0
Proportion of population below international poverty line – SDG 1. Indicator 1.1.1 (2001) 2.8 (2009) 1.1
Gini index, latest available year (2001) 37.7 (2009) 37.5
Prevalence of undernourishment (per cent) – SDG 2. Indicator 2.1.1 .. ..
Value added of agriculture/industry/services (as a share of GDP) 22/22/56 20/19/62 19/19/61
Employment in agriculture/industry/services (as a share of total employment) 34/31/34 31/31/38 32/32/37
Share of women in agriculture/industry/services 8/73/33 5/72/39 5/71/39
Institutional quality index, 2018 0.6137
Control of corruption – –0.33 –0.16
Rule of law 0.81 0.04 0.31
MERCHANDISE AND COMMODITY EXPORT DEPENDENCE
KEY SOCIOECONOMIC INDICATORS
COMMODITY IMPORT DEPENDENCE
OTHER STRUCTURAL INDICATORS](https://image.slidesharecdn.com/stateofcommoditydependance2019-190524115214/85/State-of-commodity-dependance-2019-206-320.jpg)
![Table of contents Introduction
Chapter 1
Key Findings
from the Report
Chapter 2
Country Statistical
Profiles
List of Country
Statistical Profiles
201
TRINIDAD AND TOBAGO
1995 2013-2017 2017
Merchandise export value (millions of US dollars) 2,467 12,105 8,861
Unallocated exports (as a share of merchandise exports) 1.1 0.6 –
Merchandise export concentration by product line (Herfindahl-Hirschmann index) 0.2996 0.3423 0.3096
Commodity export value (millions of US dollars) 1,334 7,329 4,916
Commodity exports (as a share of total merchandise exports) 54 61 55
Commodity exports (as a share of GDP) 25.0 28.8 21.1
Total natural resources rents (as a share of GDP) 9.0 12.0 7.1
Exports by commodity group (as a share of merchandise exports) 54 61 55
Agricultural commodities 10 3 4
Fuels 43 56 49
Ores, metals, precious stones and non-monetary gold 1 1 3
Three leading commodity exports (as a share of total merchandise exports) 39 53 44
[343] Natural gas, whether or not liquefied – 27 23
[334] Petroleum oils or bituminous minerals 70 % oil 26 20 16
[333] Petroleum oils, oils from bitumin. materials, crude 13 6 5
Average price index of the leading commodity group exported 36.5 132.1 103.8
Five leading destination markets of commodity exports (as a share of total commodity exports) 57
United States of America 24
Argentina 13
European Union (28) 9
Chile 6
Jamaica 6
Commodity imports (millions of US dollars) 452 5,007 3,481
Commodity imports (as a share of total merchandise imports) 26 53 54
Food imports (millions of US dollars and as a share of total merchandise imports) 255 (15) 893 (9) 600 (9)
Fuel imports (millions of US dollars and as a share of total merchandise imports) 92 (5) 3,546 (37) 2,540 (39)
Five-leading trading partners for commodity imports (as a share of total commodity imports) 81
Gabon 31
Russian Federation 18
Colombia 15
United States of America 12
Brazil 6
Percentage change of GDP measured in constant 2010 prices 4.0 1.0 –2.3
GDP per capita measured in constant 2010 US dollars 6,855 16,465 15,801
Population (thousands) 869 1,077 1,086
Human Development Index (value and rank) 0.6830 (55) 0.7820 (64) 0.7840 (67)
Total employment (as a share of the population) 49.8 60.3 59.1
Share of women in total employment 36.3 41.8 41.4
Proportion of population below international poverty line – SDG 1. Indicator 1.1.1 .. ..
Gini index, latest available year .. ..
Prevalence of undernourishment (per cent) – SDG 2. Indicator 2.1.1 11.6 4.9
Value added of agriculture/industry/services (as a share of GDP) 2/42/56 –/44/56 –/38/62
Employment in agriculture/industry/services (as a share of total employment) 11/25/64 4/28/68 4/27/70
Share of women in agriculture/industry/services 17/18/47 20/21/52 19/21/51
Institutional quality index, 2018 0.5203
Control of corruption 0.90 –0.31 –0.36
Rule of law 0.53 –0.13 –0.11
OTHER STRUCTURAL INDICATORS
KEY SOCIOECONOMIC INDICATORS
COMMODITY IMPORT DEPENDENCE
MERCHANDISE AND COMMODITY EXPORT DEPENDENCE](https://image.slidesharecdn.com/stateofcommoditydependance2019-190524115214/85/State-of-commodity-dependance-2019-207-320.jpg)
![Table of contents Introduction
Chapter 1
Key Findings
from the Report
Chapter 2
Country Statistical
Profiles
List of Country
Statistical Profiles
202
TUNISIA
1995 2013-2017 2017
Merchandise export value (millions of US dollars) 5,475 15,134 14,200
Unallocated exports (as a share of merchandise exports) – – 0.2
Merchandise export concentration by product line (Herfindahl-Hirschmann index) 0.2128 0.1423 0.1410
Commodity export value (millions of US dollars) 1,134 3,383 2,663
Commodity exports (as a share of total merchandise exports) 21 22 19
Commodity exports (as a share of GDP) 5.7 7.7 6.7
Total natural resources rents (as a share of GDP) 2.3 4.0 2.8
Exports by commodity group (as a share of merchandise exports) 21 22 19
Agricultural commodities 10 11 11
Fuels 8 10 6
Ores, metals, precious stones and non-monetary gold 2 2 2
Three leading commodity exports (as a share of total merchandise exports) 13 13 9
[333] Petroleum oils, oils from bitumin. materials, crude 7 6 4
[421] Fixed vegetable fats oils, crude, refined, fractio. 4 4 3
[334] Petroleum oils or bituminous minerals 70 % oil 2 3 2
Average price index of the leading commodity group exported 36.5 132.1 103.8
Five leading destination markets of commodity exports (as a share of total commodity exports) 86
European Union (28) 62
Switzerland 8
Libya 8
United States of America 5
Morocco 2
Commodity imports (millions of US dollars) 2,152 6,830 6,106
Commodity imports (as a share of total merchandise imports) 27 31 30
Food imports (millions of US dollars and as a share of total merchandise imports) 926 (12) 2,194 (10) 2,103 (10)
Fuel imports (millions of US dollars and as a share of total merchandise imports) 572 (7) 3,310 (15) 2,679 (13)
Five-leading trading partners for commodity imports (as a share of total commodity imports) 73
European Union (28) 38
Algeria 14
Russian Federation 8
Azerbaijan 7
United States of America 4
Percentage change of GDP measured in constant 2010 prices 2.3 7.5 1.9
GDP per capita measured in constant 2010 US dollars 2,389 4,212 4,243
Population (thousands) 6,036 8,599 8,763
Human Development Index (value and rank) 0.6070 (82) 0.7286 (94) 0.7350 (93)
Total employment (as a share of the population) 40.6 39.9 39.7
Share of women in total employment 23.1 24.4 24.0
Proportion of population below international poverty line – SDG 1. Indicator 1.1.1 (1995) 10.9 (2010) 2.0
Gini index, latest available year (1995) 41.7 (2010) 35.8
Prevalence of undernourishment (per cent) – SDG 2. Indicator 2.1.1 4.9 4.9
Value added of agriculture/industry/services (as a share of GDP) 10/30/60 10/28/62 10/26/64
Employment in agriculture/industry/services (as a share of total employment) 26/43/31 14/44/42 14/43/44
Share of women in agriculture/industry/services 24/24/21 21/23/27 21/22/27
Institutional quality index, 2018 0.4674
Control of corruption –0.53 –0.08 –0.11
Rule of law –0.30 –0.06 0.07
OTHER STRUCTURAL INDICATORS
KEY SOCIOECONOMIC INDICATORS
COMMODITY IMPORT DEPENDENCE
MERCHANDISE AND COMMODITY EXPORT DEPENDENCE](https://image.slidesharecdn.com/stateofcommoditydependance2019-190524115214/85/State-of-commodity-dependance-2019-208-320.jpg)
![Table of contents Introduction
Chapter 1
Key Findings
from the Report
Chapter 2
Country Statistical
Profiles
List of Country
Statistical Profiles
203
TURKEY
1995 2013-2017 2017
Merchandise export value (millions of US dollars) 21,599 150,800 157,000
Unallocated exports (as a share of merchandise exports) – 1.6 1.5
Merchandise export concentration by product line (Herfindahl-Hirschmann index) 0.1114 0.0738 0.0795
Commodity export value (millions of US dollars) 5,545 33,936 34,490
Commodity exports (as a share of total merchandise exports) 26 23 22
Commodity exports (as a share of GDP) 2.4 3.8 4.0
Total natural resources rents (as a share of GDP) 0.3 0.4 0.3
Exports by commodity group (as a share of merchandise exports) 26 23 22
Agricultural commodities 21 12 11
Fuels 1 3 3
Ores, metals, precious stones and non-monetary gold 3 8 8
Three leading commodity exports (as a share of total merchandise exports) 7 9 9
[971] Gold, non-monetary (excluding gold ores and concentrates) – 4 4
[334] Petroleum oils or bituminous minerals 70 % oil 1 3 2
[057] Fruits and nuts (excluding oil nuts), fresh or dried 6 3 2
Average price index of the leading commodity group exported 33.4 110.1 107.6
Five leading destination markets of commodity exports (as a share of total commodity exports) 63
European Union (28) 32
Iraq 10
United Arab Emirates 8
Switzerland 6
China 6
Commodity imports (millions of US dollars) 11,204 58,159 67,182
Commodity imports (as a share of total merchandise imports) 31 26 29
Food imports (millions of US dollars and as a share of total merchandise imports) 2,324 (7) 10,606 (5) 11,596 (5)
Fuel imports (millions of US dollars and as a share of total merchandise imports) 4,619 (13) 16,631 (7) 16,497 (7)
Five-leading trading partners for commodity imports (as a share of total commodity imports) 61
European Union (28) 26
Russian Federation 15
United States of America 8
United Arab Emirates 6
Switzerland 6
Percentage change of GDP measured in constant 2010 prices 7.2 28.5 7.4
GDP per capita measured in constant 2010 US dollars 7,288 13,825 14,933
Population (thousands) 39,168 58,265 60,593
Human Development Index (value and rank) 0.6070 (82) 0.7820 (64) 0.7910 (62)
Total employment (as a share of the population) 49.4 45.7 45.8
Share of women in total employment 29.7 30.9 31.1
Proportion of population below international poverty line – SDG 1. Indicator 1.1.1 (2002) 1.7 (2016) 0.2
Gini index, latest available year (2002) 41.4 (2016) 41.9
Prevalence of undernourishment (per cent) – SDG 2. Indicator 2.1.1 2.5 2.5
Value added of agriculture/industry/services (as a share of GDP) 12/38/49 7/32/61 7/32/61
Employment in agriculture/industry/services (as a share of total employment) 43/22/34 21/27/52 19/27/54
Share of women in agriculture/industry/services 48/13/17 47/18/31 46/19/32
Institutional quality index, 2018 0.5020
Control of corruption –0.15 –0.12 –0.19
Rule of law –0.14 –0.10 –0.25
MERCHANDISE AND COMMODITY EXPORT DEPENDENCE
COMMODITY IMPORT DEPENDENCE
KEY SOCIOECONOMIC INDICATORS
OTHER STRUCTURAL INDICATORS](https://image.slidesharecdn.com/stateofcommoditydependance2019-190524115214/85/State-of-commodity-dependance-2019-209-320.jpg)
![Table of contents Introduction
Chapter 1
Key Findings
from the Report
Chapter 2
Country Statistical
Profiles
List of Country
Statistical Profiles
204
TURKMENISTAN
1995 2013-2017 2017
Merchandise export value (millions of US dollars) 1,939 11,860 7,000
Unallocated exports (as a share of merchandise exports) 0.2 0.2 –
Merchandise export concentration by product line (Herfindahl-Hirschmann index) 0.4845 0.7065 0.5211
Commodity export value (millions of US dollars) 1,804 11,001 5,850
Commodity exports (as a share of total merchandise exports) 93 93 84
Commodity exports (as a share of GDP) 82.4 28.5 15.5
Total natural resources rents (as a share of GDP) 30.7 24.3 16.7
Exports by commodity group (as a share of merchandise exports) 93 93 83
Agricultural commodities 23 7 26
Fuels 69 84 57
Ores, metals, precious stones and non-monetary gold 1 1 –
Three leading commodity exports (as a share of total merchandise exports) 80 86 74
[343] Natural gas, whether or not liquefied 46 74 51
[334] Petroleum oils or bituminous minerals 70 % oil 14 7 4
[263] Cotton 20 6 19
Average price index of the leading commodity group exported 36.5 132.1 103.8
Five leading destination markets of commodity exports (as a share of total commodity exports) 91
China 61
Ukraine 16
European Union (28) 9
Turkey 3
Iran (Islamic Republic of) 3
Commodity imports (millions of US dollars) 443 990 795
Commodity imports (as a share of total merchandise imports) 32 12 13
Food imports (millions of US dollars and as a share of total merchandise imports) 336 (25) 618 (8) 517 (9)
Fuel imports (millions of US dollars and as a share of total merchandise imports) 26 (2) 87 (1) 59 (1)
Five-leading trading partners for commodity imports (as a share of total commodity imports) 71
Turkey 22
Russian Federation 21
European Union (28) 16
Kazakhstan 7
Ukraine 6
Percentage change of GDP measured in constant 2010 prices –7.2 43.0 5.9
GDP per capita measured in constant 2010 US dollars 2,054 6,653 7,276
Population (thousands) 2,547 3,868 3,978
Human Development Index (value and rank) .. 0.7002 (105) 0.7060 (106)
Total employment (as a share of the population) 61.0 63.0 63.2
Share of women in total employment 42.1 41.9 41.8
Proportion of population below international poverty line – SDG 1. Indicator 1.1.1 (1998) 51.4 ..
Gini index, latest available year (1998) 40.8 ..
Prevalence of undernourishment (per cent) – SDG 2. Indicator 2.1.1 8.2 5.5
Value added of agriculture/industry/services (as a share of GDP) 17/65/18 13/51/36 13/51/36
Employment in agriculture/industry/services (as a share of total employment) 19/50/31 9/45/46 8/45/47
Share of women in agriculture/industry/services 49/33/52 56/25/55 55/25/56
Institutional quality index, 2018 0.0521
Control of corruption –1.02 –1.41 –1.48
Rule of law –1.49 –1.43 –1.49
OTHER STRUCTURAL INDICATORS
KEY SOCIOECONOMIC INDICATORS
MERCHANDISE AND COMMODITY EXPORT DEPENDENCE
COMMODITY IMPORT DEPENDENCE](https://image.slidesharecdn.com/stateofcommoditydependance2019-190524115214/85/State-of-commodity-dependance-2019-210-320.jpg)
![Table of contents Introduction
Chapter 1
Key Findings
from the Report
Chapter 2
Country Statistical
Profiles
List of Country
Statistical Profiles
205
TUVALU*
1995 2013-2017 2017
Merchandise export value (in 1,000 US$) 164 166 99
Unallocated exports (as a share of merchandise exports) 1.8 0.8 5.1
Merchandise export concentration by product line (Herfindahl-Hirschmann index) 0.2180 0.5849 0.5540
Commodity export value (in 1,000 US$) 6 98 60
Commodity exports (as a share of total merchandise exports) 4 59 61
Commodity exports (as a share of GDP) – 0.3 0.2
Total natural resources rents (as a share of GDP) – – –
Exports by commodity group (as a share of merchandise exports) 3 59 61
Agricultural commodities 2 58 60
Fuels – 1 1
Ores, metals, precious stones and non-monetary gold 1 – –
Three leading commodity exports (as a share of total merchandise exports) 1 59 61
[03] Fishery products 0.4 57 59
[334] Petroleum oils or bituminous minerals 70 % oil - 1 1
[057] Fruits and nuts (excluding oil nuts), fresh or dried 0.1 1 1
Average price index of the leading commodity group exported 80.8 109.0 102.7
Five leading destination markets of commodity exports (as a share of total commodity exports) 98
Japan 77
China 16
Australia 2
Fiji 2
Taiwan, Province of China 1
Commodity imports (millions of US dollars) 2 7 10
Commodity imports (as a share of total merchandise imports) 36 23 26
Food imports (millions of US dollars and as a share of total merchandise imports) 1 (26) 3 (10) 5 (11)
Fuel imports (millions of US dollars and as a share of total merchandise imports) 0.08 (1) 2 (8) 3 (8)
Five-leading trading partners for commodity imports (as a share of total commodity imports) 81
Fiji 30
Australia 17
Taiwan, Province of China 16
New Zealand 12
China 7
Percentage change of GDP measured in constant 2010 prices –5.0 12.3 1.5
GDP per capita measured in constant 2010 US dollars 2,386 3,379 3,549
Population (thousands) .. .. ..
Human Development Index (value and rank) .. .. ..
Total employment (as a share of the population) .. .. ..
Share of women in total employment .. .. ..
Proportion of population below international poverty line – SDG 1. Indicator 1.1.1 (2010) 3.3 ..
Gini index, latest available year (2010) 39.1 ..
Prevalence of undernourishment (per cent) – SDG 2. Indicator 2.1.1 .. ..
Value added of agriculture/industry/services (as a share of GDP) 24/14/62 23/9/68 24/8/67
Employment in agriculture/industry/services (as a share of total employment) .. .. ..
Share of women in agriculture/industry/services .. .. ..
Institutional quality index, 2018 ..
Control of corruption – –0.07 0.06
Rule of law 0.81 0.45 0.56
OTHER STRUCTURAL INDICATORS
MERCHANDISE AND COMMODITY EXPORT DEPENDENCE
COMMODITY IMPORT DEPENDENCE
KEY SOCIOECONOMIC INDICATORS](https://image.slidesharecdn.com/stateofcommoditydependance2019-190524115214/85/State-of-commodity-dependance-2019-211-320.jpg)
![Table of contents Introduction
Chapter 1
Key Findings
from the Report
Chapter 2
Country Statistical
Profiles
List of Country
Statistical Profiles
206
UGANDA*
1995 2013-2017 2017
Merchandise export value (millions of US dollars) 460 2,464 2,901
Unallocated exports (as a share of merchandise exports) 0.1 2.0 0.5
Merchandise export concentration by product line (Herfindahl-Hirschmann index) 0.7047 0.1915 0.2102
Commodity export value (millions of US dollars) 447 1,807 2,381
Commodity exports (as a share of total merchandise exports) 97 73 82
Commodity exports (as a share of GDP) 6.3 6.9 8.9
Total natural resources rents (as a share of GDP) 19.5 12.8 15.3
Exports by commodity group (as a share of merchandise exports) 97 73 82
Agricultural commodities 93 64 63
Fuels – 2 4
Ores, metals, precious stones and non-monetary gold 4 8 15
Three leading commodity exports (as a share of total merchandise exports) 82 32 38
[071] Coffee and coffee substitutes 72 19 19
[971] Gold, non-monetary (excluding gold ores and concentrates) 4 7 14
[03] Fishery products 6 6 5
Average price index of the leading commodity group exported 87.2 98.3 93.7
Five leading destination markets of commodity exports (as a share of total commodity exports) 69
European Union (28) 28
Kenya 16
United Arab Emirates 11
South Sudan 8
Rwanda 5
Commodity imports (millions of US dollars) 245 1,674 1,839
Commodity imports (as a share of total merchandise imports) 24 30 33
Food imports (millions of US dollars and as a share of total merchandise imports) 150 (14) 581 (10) 670 (12)
Fuel imports (millions of US dollars and as a share of total merchandise imports) 44 (4) 849 (15) 955 (17)
Five-leading trading partners for commodity imports (as a share of total commodity imports) 66
India 22
United Arab Emirates 16
Kenya 14
Saudi Arabia 7
European Union (28) 7
Percentage change of GDP measured in constant 2010 prices 9.4 20.2 6.4
GDP per capita measured in constant 2010 US dollars 332 618 636
Population (thousands) 10,485 20,806 22,413
Human Development Index (value and rank) 0.3210 (138) 0.5050 (160) 0.5160 (159)
Total employment (as a share of the population) 68.7 69.4 69.2
Share of women in total employment 46.1 47.5 47.6
Proportion of population below international poverty line – SDG 1. Indicator 1.1.1 (1996) 61.3 (2016) 41.6
Gini index, latest available year (1996) 39.0 (2016) 42.8
Prevalence of undernourishment (per cent) – SDG 2. Indicator 2.1.1 27.7 41.4
Value added of agriculture/industry/services (as a share of GDP) 40/17/43 26/22/52 26/23/52
Employment in agriculture/industry/services (as a share of total employment) 74/7/19 71/7/22 69/7/24
Share of women in agriculture/industry/services 51/31/34 51/23/44 51/22/44
Institutional quality index, 2018 0.3749
Control of corruption –0.72 –1.06 –1.04
Rule of law –0.58 –0.33 –0.30
OTHER STRUCTURAL INDICATORS
MERCHANDISE AND COMMODITY EXPORT DEPENDENCE
COMMODITY IMPORT DEPENDENCE
KEY SOCIOECONOMIC INDICATORS](https://image.slidesharecdn.com/stateofcommoditydependance2019-190524115214/85/State-of-commodity-dependance-2019-212-320.jpg)
![Table of contents Introduction
Chapter 1
Key Findings
from the Report
Chapter 2
Country Statistical
Profiles
List of Country
Statistical Profiles
207
UKRAINE
1995 2013-2017 2017
Merchandise export value (millions of US dollars) 13,317 47,030 43,428
Unallocated exports (as a share of merchandise exports) 1.2 0.6 0.8
Merchandise export concentration by product line (Herfindahl-Hirschmann index) 0.1059 0.1339 0.1415
Commodity export value (millions of US dollars) 4,325 22,691 23,397
Commodity exports (as a share of total merchandise exports) 32 48 54
Commodity exports (as a share of GDP) 8.6 18.6 21.4
Total natural resources rents (as a share of GDP) 2.0 4.9 3.8
Exports by commodity group (as a share of merchandise exports) 32 48 54
Agricultural commodities 20 36 43
Fuels 4 3 2
Ores, metals, precious stones and non-monetary gold 8 9 10
Three leading commodity exports (as a share of total merchandise exports) 4 20 23
[421] Fixed vegetable fats oils, crude, refined, fractio. 1 8 10
[044] Maize (not including sweet corn), unmilled – 7 7
[281] Iron ore and concentrates 3 6 6
Average price index of the leading commodity group exported 76.6 115.7 106.2
Five leading destination markets of commodity exports (as a share of total commodity exports) 61
European Union (28) 33
China 9
Russian Federation 7
India 7
Egypt 6
Commodity imports (millions of US dollars) 9,815 20,456 17,586
Commodity imports (as a share of total merchandise imports) 61 40 36
Food imports (millions of US dollars and as a share of total merchandise imports) 1,040 (6) 4,198 (8) 3,391 (7)
Fuel imports (millions of US dollars and as a share of total merchandise imports) 7,665 (48) 13,329 (26) 11,559 (23)
Five-leading trading partners for commodity imports (as a share of total commodity imports) 80
Russian Federation 34
European Union (28) 28
Belarus 12
United States of America 3
Switzerland 3
Percentage change of GDP measured in constant 2010 prices –12.2 –7.4 2.5
GDP per capita measured in constant 2010 US dollars 2,016 2,912 2,874
Population (thousands) 40,795 37,949 37,371
Human Development Index (value and rank) 0.6640 (61) 0.7466 (83) 0.7510 (86)
Total employment (as a share of the population) 56.4 49.8 49.1
Share of women in total employment 49.6 48.2 48.2
Proportion of population below international poverty line – SDG 1. Indicator 1.1.1 (1995) 5.4 (2016) 0.1
Gini index, latest available year (1995) 39.3 (2016) 25.0
Prevalence of undernourishment (per cent) – SDG 2. Indicator 2.1.1 4.5 3.3
Value added of agriculture/industry/services (as a share of GDP) 14/42/44 12/26/61 14/27/59
Employment in agriculture/industry/services (as a share of total employment) 19/37/43 16/25/59 15/25/60
Share of women in agriculture/industry/services 47/38/61 43/27/59 43/27/58
Institutional quality index, 2018 0.3408
Control of corruption –1.11 –0.94 –0.78
Rule of law –0.82 –0.78 –0.71
OTHER STRUCTURAL INDICATORS
MERCHANDISE AND COMMODITY EXPORT DEPENDENCE
COMMODITY IMPORT DEPENDENCE
KEY SOCIOECONOMIC INDICATORS](https://image.slidesharecdn.com/stateofcommoditydependance2019-190524115214/85/State-of-commodity-dependance-2019-213-320.jpg)
![Table of contents Introduction
Chapter 1
Key Findings
from the Report
Chapter 2
Country Statistical
Profiles
List of Country
Statistical Profiles
208
UNITED ARAB EMIRATES
1995 2013-2017 2017
Merchandise export value (millions of US dollars) 27,753 341,600 317,000
Unallocated exports (as a share of merchandise exports) 0.9 0.4 0.1
Merchandise export concentration by product line (Herfindahl-Hirschmann index) 0.5658 0.2772 0.2443
Commodity export value (millions of US dollars) 22,568 228,986 209,987
Commodity exports (as a share of total merchandise exports) 81 67 66
Commodity exports (as a share of GDP) 33.9 60.8 54.8
Total natural resources rents (as a share of GDP) 15.0 19.2 15.3
Exports by commodity group (as a share of merchandise exports) 81 67 66
Agricultural commodities 4 5 5
Fuels 72 42 38
Ores, metals, precious stones and non-monetary gold 5 20 23
Three leading commodity exports (as a share of total merchandise exports) 66 46 44
[333] Petroleum oils, oils from bitumin. materials, crude 59 28 23
[971] Gold, non-monetary (excluding gold ores and concentrates) 1 9 11
[334] Petroleum oils or bituminous minerals 70 % oil 7 9 9
Average price index of the leading commodity group exported 36.5 132.1 103.8
Five leading destination markets of commodity exports (as a share of total commodity exports) 51
Japan 17
India 13
Taiwan, Province of China 8
Republic of Korea 7
Thailand 6
Commodity imports (millions of US dollars) 3,584 82,575 84,947
Commodity imports (as a share of total merchandise imports) 15 30 31
Food imports (millions of US dollars and as a share of total merchandise imports) 2,100 (9) 18,525 (7) 19,687 (7)
Fuel imports (millions of US dollars and as a share of total merchandise imports) 395 (2) 13,441 (5) 13,137 (5)
Five-leading trading partners for commodity imports (as a share of total commodity imports) 45
India 19
European Union (28) 14
United States of America 5
Switzerland 4
Saudi Arabia 4
Percentage change of GDP measured in constant 2010 prices 8.2 18.1 2.1
GDP per capita measured in constant 2010 US dollars 59,115 39,853 41,143
Population (thousands) 1,781 7,917 8,094
Human Development Index (value and rank) 0.7640 (31) 0.8582 (31) 0.8630 (32)
Total employment (as a share of the population) 73.8 79.2 78.3
Share of women in total employment 11.6 11.5 12.0
Proportion of population below international poverty line – SDG 1. Indicator 1.1.1 .. ..
Gini index, latest available year .. ..
Prevalence of undernourishment (per cent) – SDG 2. Indicator 2.1.1 2.5 2.5
Value added of agriculture/industry/services (as a share of GDP) 2/47/51 1/48/51 1/40/59
Employment in agriculture/industry/services (as a share of total employment) 8/34/58 –/34/66 –/39/61
Share of women in agriculture/industry/services –/5/17 1/2/17 1/2/18
Institutional quality index, 2018 0.6955
Control of corruption –0.01 1.17 1.13
Rule of law 0.69 0.71 0.80
MERCHANDISE AND COMMODITY EXPORT DEPENDENCE
COMMODITY IMPORT DEPENDENCE
KEY SOCIOECONOMIC INDICATORS
OTHER STRUCTURAL INDICATORS](https://image.slidesharecdn.com/stateofcommoditydependance2019-190524115214/85/State-of-commodity-dependance-2019-214-320.jpg)
![Table of contents Introduction
Chapter 1
Key Findings
from the Report
Chapter 2
Country Statistical
Profiles
List of Country
Statistical Profiles
209
UNITED KINGDOM OF GREAT BRITAIN
AND NORTHERN IRELAND
1995 2013-2017 2017
Merchandise export value (millions of US dollars) 234,000 475,600 442,000
Unallocated exports (as a share of merchandise exports) 0.7 3.6 3.6
Merchandise export concentration by product line (Herfindahl-Hirschmann index) 0.0699 0.1184 0.1080
Commodity export value (millions of US dollars) 45,284 132,415 103,354
Commodity exports (as a share of total merchandise exports) 19 28 23
Commodity exports (as a share of GDP) 3.4 4.8 3.9
Total natural resources rents (as a share of GDP) 0.6 0.5 0.4
Exports by commodity group (as a share of merchandise exports) 19 28 23
Agricultural commodities 8 7 7
Fuels 6 9 8
Ores, metals, precious stones and non-monetary gold 5 12 8
Three leading commodity exports (as a share of total merchandise exports) 6 16 11
[971] Gold, non-monetary (excluding gold ores and concentrates) – 8 4
[333] Petroleum oils, oils from bitumin. materials, crude 4 5 4
[334] Petroleum oils or bituminous minerals 70 % oil 1 3 3
Average price index of the leading commodity group exported 33.4 110.1 107.6
Five leading destination markets of commodity exports (as a share of total commodity exports) 81
European Union (28) 44
Switzerland 21
United States of America 7
China 6
China, Hong Kong SAR 3
Commodity imports (millions of US dollars) 55,425 184,714 176,943
Commodity imports (as a share of total merchandise imports) 21 28 28
Food imports (millions of US dollars and as a share of total merchandise imports) 22,454 (9) 53,938 (8) 53,188 (8)
Fuel imports (millions of US dollars and as a share of total merchandise imports) 9,241 (4) 62,302 (10) 51,647 (8)
Five-leading trading partners for commodity imports (as a share of total commodity imports) 68
European Union (28) 41
Norway 11
United States of America 6
Canada 6
Russian Federation 4
Percentage change of GDP measured in constant 2010 prices 2.5 8.7 1.8
GDP per capita measured in constant 2010 US dollars 30,583 41,029 42,199
Population (thousands) 46,696 53,894 54,460
Human Development Index (value and rank) 0.8390 (11) 0.9188 (13) 0.9220 (13)
Total employment (as a share of the population) 55.5 58.8 59.6
Share of women in total employment 45.1 46.6 46.6
Proportion of population below international poverty line – SDG 1. Indicator 1.1.1 (2004) 0.5 (2015) 0.2
Gini index, latest available year (2004) 36.0 (2015) 33.2
Prevalence of undernourishment (per cent) – SDG 2. Indicator 2.1.1 2.5 2.5
Value added of agriculture/industry/services (as a share of GDP) 1/27/71 1/20/79 1/20/79
Employment in agriculture/industry/services (as a share of total employment) 2/27/71 1/19/80 1/18/81
Share of women in agriculture/industry/services 27/23/54 26/19/53 26/19/53
Institutional quality index, 2018 0.9303
Control of corruption 1.98 1.81 1.84
Rule of law 1.63 1.76 1.68
OTHER STRUCTURAL INDICATORS
MERCHANDISE AND COMMODITY EXPORT DEPENDENCE
COMMODITY IMPORT DEPENDENCE
KEY SOCIOECONOMIC INDICATORS](https://image.slidesharecdn.com/stateofcommoditydependance2019-190524115214/85/State-of-commodity-dependance-2019-215-320.jpg)
![Table of contents Introduction
Chapter 1
Key Findings
from the Report
Chapter 2
Country Statistical
Profiles
List of Country
Statistical Profiles
210
UNITED REPUBLIC OF TANZANIA*
1995 2013-2017 2017
Merchandise export value (millions of US dollars) 685 4,570 4,178
Unallocated exports (as a share of merchandise exports) 0.3 0.6 0.7
Merchandise export concentration by product line (Herfindahl-Hirschmann index) 0.2645 0.2932 0.2901
Commodity export value (millions of US dollars) 634 3,918 3,602
Commodity exports (as a share of total merchandise exports) 93 85 86
Commodity exports (as a share of GDP) 8.2 8.0 6.7
Total natural resources rents (as a share of GDP) 14.0 6.9 7.4
Exports by commodity group (as a share of merchandise exports) 92 86 86
Agricultural commodities 88 41 45
Fuels – 2 2
Ores, metals, precious stones and non-monetary gold 4 43 39
Three leading commodity exports (as a share of total merchandise exports) 24 43 48
[971] Gold, non-monetary (excluding gold ores and concentrates) – 30 29
[057] Fruits and nuts (excluding oil nuts), fresh or dried 11 7 12
[121] Tobacco, unmanufactured; tobacco refuse 12 6 6
Average price index of the leading commodity group exported 33.4 110.1 107.6
Five leading destination markets of commodity exports (as a share of total commodity exports) 64
India 21
European Union (28) 14
United Arab Emirates 11
China 9
South Africa 8
Commodity imports (millions of US dollars) 398 4,168 3,181
Commodity imports (as a share of total merchandise imports) 24 38 32
Food imports (millions of US dollars and as a share of total merchandise imports) 208 (13) 970 (9) 1,061 (11)
Fuel imports (millions of US dollars and as a share of total merchandise imports) 83 (5) 2,889 (26) 1,862 (19)
Five-leading trading partners for commodity imports (as a share of total commodity imports) 66
India 29
Saudi Arabia 16
United Arab Emirates 10
Switzerland 7
Malaysia 4
Percentage change of GDP measured in constant 2010 prices 3.6 30.2 7.0
GDP per capita measured in constant 2010 US dollars 457 824 885
Population (thousands) 16,305 29,580 31,572
Human Development Index (value and rank) 0.3710 (132) 0.5242 (154) 0.5380 (151)
Total employment (as a share of the population) 79.8 81.5 81.5
Share of women in total employment 49.7 48.7 48.6
Proportion of population below international poverty line – SDG 1. Indicator 1.1.1 (2000) 86.0 (2011) 49.1
Gini index, latest available year (2000) 37.3 (2011) 37.8
Prevalence of undernourishment (per cent) – SDG 2. Indicator 2.1.1 36.5 32.0
Value added of agriculture/industry/services (as a share of GDP) 34/17/49 31/25/43 31/27/42
Employment in agriculture/industry/services (as a share of total employment) 78/5/17 68/6/26 67/6/27
Share of women in agriculture/industry/services 52/31/45 51/23/49 51/21/49
Institutional quality index, 2018 0.3823
Control of corruption –0.70 –0.64 –0.48
Rule of law –0.19 –0.41 –0.45
COMMODITY IMPORT DEPENDENCE
KEY SOCIOECONOMIC INDICATORS
OTHER STRUCTURAL INDICATORS
MERCHANDISE AND COMMODITY EXPORT DEPENDENCE](https://image.slidesharecdn.com/stateofcommoditydependance2019-190524115214/85/State-of-commodity-dependance-2019-216-320.jpg)
![Table of contents Introduction
Chapter 1
Key Findings
from the Report
Chapter 2
Country Statistical
Profiles
List of Country
Statistical Profiles
211
UNITED STATES OF AMERICA
1995 2013-2017 2017
Merchandise export value (millions of US dollars) 583,000 1,540,000 1,550,000
Unallocated exports (as a share of merchandise exports) 3.0 10.3 10.6
Merchandise export concentration by product line (Herfindahl-Hirschmann index) 0.0746 0.0967 0.0968
Commodity export value (millions of US dollars) 113,229 384,910 388,312
Commodity exports (as a share of total merchandise exports) 19 25 25
Commodity exports (as a share of GDP) 1.5 2.1 2.0
Total natural resources rents (as a share of GDP) 0.9 0.6 0.3
Exports by commodity group (as a share of merchandise exports) 19 25 25
Agricultural commodities 14 11 11
Fuels 2 8 9
Ores, metals, precious stones and non-monetary gold 4 6 5
Three leading commodity exports (as a share of total merchandise exports) 3 9 8
[334] Petroleum oils or bituminous minerals 70 % oil 1 6 5
[971] Gold, non-monetary (excluding gold ores and concentrates) 1 2 1
[222] Oil seeds and oleaginous fruits (excluding flour) 1 1 1
Average price index of the leading commodity group exported 36.5 132.1 103.8
Five leading destination markets of commodity exports (as a share of total commodity exports) 57
Canada 15
Mexico 13
European Union (28) 13
China 11
Japan 5
Commodity imports (millions of US dollars) 145,530 509,608 464,657
Commodity imports (as a share of total merchandise imports) 19 22 19
Food imports (millions of US dollars and as a share of total merchandise imports) 31,170 (4) 111,226 (5) 120,437 (5)
Fuel imports (millions of US dollars and as a share of total merchandise imports) 62,984 (8) 262,942 (11) 203,932 (8)
Five-leading trading partners for commodity imports (as a share of total commodity imports) 58
Canada 28
European Union (28) 10
Mexico 10
Saudi Arabia 6
Venezuela (Bolivarian Rep. of) 4
Percentage change of GDP measured in constant 2010 prices 2.8 8.9 2.3
GDP per capita measured in constant 2010 US dollars 38,514 51,506 53,023
Population (thousands) 207,153 258,472 263,094
Human Development Index (value and rank) 0.8770 (3) 0.9200 (11) 0.9240 (12)
Total employment (as a share of the population) 62.1 58.7 59.2
Share of women in total employment 45.2 45.9 45.8
Proportion of population below international poverty line – SDG 1. Indicator 1.1.1 (1997) 0.7 (2016) 1.3
Gini index, latest available year (1997) 40.8 (2016) 41.5
Prevalence of undernourishment (per cent) – SDG 2. Indicator 2.1.1 2.5 2.5
Value added of agriculture/industry/services (as a share of GDP) 1/24/74 1/20/79 1/19/80
Employment in agriculture/industry/services (as a share of total employment) 3/24/74 2/19/80 2/19/79
Share of women in agriculture/industry/services 25/24/53 24/20/52 24/20/52
Institutional quality index, 2018 0.9141
Control of corruption 1.57 1.37 1.38
Rule of law 1.50 1.61 1.64
MERCHANDISE AND COMMODITY EXPORT DEPENDENCE
COMMODITY IMPORT DEPENDENCE
KEY SOCIOECONOMIC INDICATORS
OTHER STRUCTURAL INDICATORS](https://image.slidesharecdn.com/stateofcommoditydependance2019-190524115214/85/State-of-commodity-dependance-2019-217-320.jpg)
![Table of contents Introduction
Chapter 1
Key Findings
from the Report
Chapter 2
Country Statistical
Profiles
List of Country
Statistical Profiles
212
URUGUAY
1995 2013-2017 2017
Merchandise export value (millions of US dollars) 2,106 8,151 7,889
Unallocated exports (as a share of merchandise exports) 0.3 – –
Merchandise export concentration by product line (Herfindahl-Hirschmann index) 0.1594 0.2241 0.2311
Commodity export value (millions of US dollars) 1,286 6,365 6,384
Commodity exports (as a share of total merchandise exports) 61 78 81
Commodity exports (as a share of GDP) 6.0 11.4 10.7
Total natural resources rents (as a share of GDP) 0.4 1.6 1.8
Exports by commodity group (as a share of merchandise exports) 61 78 81
Agricultural commodities 59 76 78
Fuels 1 1 2
Ores, metals, precious stones and non-monetary gold 1 1 1
Three leading commodity exports (as a share of total merchandise exports) 12 42 45
[011] Meat of bovine animals, fresh, chilled or frozen 10 17 19
[222] Oil seeds and oleaginous fruits (excluding flour) – 16 15
[24 + 25] Forestry products 2 8 11
Average price index of the leading commodity group exported 80.8 109.0 102.7
Five leading destination markets of commodity exports (as a share of total commodity exports) 65
China 23
European Union (28) 16
Brazil 15
United States of America 6
Venezuela (Bolivarian Rep. of) 4
Commodity imports (millions of US dollars) 735 2,846 2,415
Commodity imports (as a share of total merchandise imports) 26 29 29
Food imports (millions of US dollars and as a share of total merchandise imports) 270 (9) 1,083 (11) 1,032 (12)
Fuel imports (millions of US dollars and as a share of total merchandise imports) 288 (10) 1,378 (14) 1,041 (12)
Five-leading trading partners for commodity imports (as a share of total commodity imports) 70
Brazil 20
Argentina 17
Nigeria 13
European Union (28) 11
United States of America 8
Percentage change of GDP measured in constant 2010 prices –1.5 13.8 2.7
GDP per capita measured in constant 2010 US dollars 8,323 13,906 14,335
Population (thousands) 2,418 2,697 2,729
Human Development Index (value and rank) 0.7110 (44) 0.8008 (53) 0.8040 (53)
Total employment (as a share of the population) 56.2 60.2 59.7
Share of women in total employment 40.1 44.3 44.6
Proportion of population below international poverty line – SDG 1. Indicator 1.1.1 (2006) 0.5 (2016) 0.1
Gini index, latest available year (2006) 46.0 (2016) 39.7
Prevalence of undernourishment (per cent) – SDG 2. Indicator 2.1.1 4.2 2.5
Value added of agriculture/industry/services (as a share of GDP) 8/26/66 7/27/65 7/28/66
Employment in agriculture/industry/services (as a share of total employment) 5/27/69 9/21/71 8/20/72
Share of women in agriculture/industry/services 12/25/48 21/21/54 21/21/54
Institutional quality index, 2018 0.7036
Control of corruption 1.12 1.33 1.29
Rule of law 0.56 0.64 0.59
OTHER STRUCTURAL INDICATORS
MERCHANDISE AND COMMODITY EXPORT DEPENDENCE
COMMODITY IMPORT DEPENDENCE
KEY SOCIOECONOMIC INDICATORS](https://image.slidesharecdn.com/stateofcommoditydependance2019-190524115214/85/State-of-commodity-dependance-2019-218-320.jpg)
![Table of contents Introduction
Chapter 1
Key Findings
from the Report
Chapter 2
Country Statistical
Profiles
List of Country
Statistical Profiles
213
UZBEKISTAN
1995 2013-2017 2017
Merchandise export value (millions of US dollars) 3,430 10,700 10,500
Unallocated exports (as a share of merchandise exports) 0.1 0.7 0.1
Merchandise export concentration by product line (Herfindahl-Hirschmann index) 0.5938 0.3341 0.4248
Commodity export value (millions of US dollars) 3,181 7,540 7,746
Commodity exports (as a share of total merchandise exports) 93 70 74
Commodity exports (as a share of GDP) 23.6 12.3 15.9
Total natural resources rents (as a share of GDP) 10.3 15.7 11.4
Exports by commodity group (as a share of merchandise exports) 93 70 74
Agricultural commodities 64 17 11
Fuels 15 13 9
Ores, metals, precious stones and non-monetary gold 14 41 54
Three leading commodity exports (as a share of total merchandise exports) 79 50 55
[971] Gold, non-monetary (excluding gold ores and concentrates) 10 31 44
[343] Natural gas, whether or not liquefied 8 12 9
[263] Cotton 61 8 2
Average price index of the leading commodity group exported 33.4 110.1 107.6
Five leading destination markets of commodity exports (as a share of total commodity exports) 90
Switzerland 42
China 21
Turkey 12
Kazakhstan 10
Russian Federation 4
Commodity imports (millions of US dollars) 721 2,531 2,512
Commodity imports (as a share of total merchandise imports) 26 21 20
Food imports (millions of US dollars and as a share of total merchandise imports) 511 (19) 1,158 (10) 1,120 (9)
Fuel imports (millions of US dollars and as a share of total merchandise imports) 62 (2) 684 (6) 753 (6)
Five-leading trading partners for commodity imports (as a share of total commodity imports) 91
Russian Federation 43
Kazakhstan 33
European Union (28) 8
China 4
Malaysia 2
Percentage change of GDP measured in constant 2010 prices –0.9 34.4 5.3
GDP per capita measured in constant 2010 US dollars 727 1,863 2,037
Population (thousands) 13,671 22,272 22,981
Human Development Index (value and rank) .. 0.6992 (107) 0.7100 (103)
Total employment (as a share of the population) 58.5 60.3 60.9
Share of women in total employment 41.5 41.8 41.7
Proportion of population below international poverty line – SDG 1. Indicator 1.1.1 (1998) 40.2 (2003) 62.1
Gini index, latest available year (1998) 44.7 (2003) 35.3
Prevalence of undernourishment (per cent) – SDG 2. Indicator 2.1.1 16.2 7.4
Value added of agriculture/industry/services (as a share of GDP) 31/31/38 18/33/49 18/33/50
Employment in agriculture/industry/services (as a share of total employment) 37/34/29 23/38/39 22/38/40
Share of women in agriculture/industry/services 48/29/48 50/27/51 50/26/52
Institutional quality index, 2018 0.2308
Control of corruption –1.13 –1.21 –1.16
Rule of law –1.24 –1.14 –1.11
MERCHANDISE AND COMMODITY EXPORT DEPENDENCE
COMMODITY IMPORT DEPENDENCE
KEY SOCIOECONOMIC INDICATORS
OTHER STRUCTURAL INDICATORS](https://image.slidesharecdn.com/stateofcommoditydependance2019-190524115214/85/State-of-commodity-dependance-2019-219-320.jpg)
![Table of contents Introduction
Chapter 1
Key Findings
from the Report
Chapter 2
Country Statistical
Profiles
List of Country
Statistical Profiles
214
VANUATU*
1995 2013-2017 2017
Merchandise export value (millions of US dollars) 28 43 36
Unallocated exports (as a share of merchandise exports) 0.3 1.1 1.1
Merchandise export concentration by product line (Herfindahl-Hirschmann index) 0.2278 0.4539 0.4062
Commodity export value (millions of US dollars) 25 26 21
Commodity exports (as a share of total merchandise exports) 89 61 58
Commodity exports (as a share of GDP) 9.0 3.2 2.3
Total natural resources rents (as a share of GDP) 1.0 0.8 0.9
Exports by commodity group (as a share of merchandise exports) 88 61 58
Agricultural commodities 88 59 58
Fuels – 1 –
Ores, metals, precious stones and non-monetary gold – – –
Three leading commodity exports (as a share of total merchandise exports) 31 48 36
[03] Fishery products 31 36 36
[048] Cereal preparations, flour of fruits or vegetables – 9 –
[042] Rice – 3 –
Average price index of the leading commodity group exported 80.8 109.0 102.7
Five leading destination markets of commodity exports (as a share of total commodity exports) 73
Japan 27
Thailand 22
Mauritania 15
China 4
Philippines 4
Commodity imports (millions of US dollars) 11 119 128
Commodity imports (as a share of total merchandise imports) 12 36 36
Food imports (millions of US dollars and as a share of total merchandise imports) 4 (5) 50 (15) 53 (15)
Fuel imports (millions of US dollars and as a share of total merchandise imports) 2 (2) 54 (16) 56 (16)
Five-leading trading partners for commodity imports (as a share of total commodity imports) 88
Singapore 40
Australia 24
Fiji 9
United States of America 9
New Zealand 6
Percentage change of GDP measured in constant 2010 prices 4.7 8.9 3.4
GDP per capita measured in constant 2010 US dollars 2,655 2,926 2,978
Population (thousands) 96 168 177
Human Development Index (value and rank) .. 0.5994 (134) 0.6030 (135)
Total employment (as a share of the population) 66.7 66.6 66.7
Share of women in total employment 42.2 43.4 43.2
Proportion of population below international poverty line – SDG 1. Indicator 1.1.1 (2010) 13.2 ..
Gini index, latest available year (2010) 37.6 ..
Prevalence of undernourishment (per cent) – SDG 2. Indicator 2.1.1 8.2 7.1
Value added of agriculture/industry/services (as a share of GDP) 30/9/60 27/10/63 27/10/63
Employment in agriculture/industry/services (as a share of total employment) 62/5/33 63/6/31 65/6/29
Share of women in agriculture/industry/services 42/33/43 44/16/47 45/17/46
Institutional quality index, 2018 0.6771
Control of corruption 0.22 0.11 0.01
Rule of law 0.32 0.28 0.49
OTHER STRUCTURAL INDICATORS
MERCHANDISE AND COMMODITY EXPORT DEPENDENCE
COMMODITY IMPORT DEPENDENCE
KEY SOCIOECONOMIC INDICATORS](https://image.slidesharecdn.com/stateofcommoditydependance2019-190524115214/85/State-of-commodity-dependance-2019-220-320.jpg)
![Table of contents Introduction
Chapter 1
Key Findings
from the Report
Chapter 2
Country Statistical
Profiles
List of Country
Statistical Profiles
215
VENEZUELA (BOLIVARIAN REPUBLIC OF)
1995 2013-2017 2017
Merchandise export value (millions of US dollars) 19,093 51,312 31,130
Unallocated exports (as a share of merchandise exports) 0.2 0.1 0.1
Merchandise export concentration by product line (Herfindahl-Hirschmann index) 0.4984 0.7211 0.6119
Commodity export value (millions of US dollars) 16,079 47,548 25,435
Commodity exports (as a share of total merchandise exports) 84 93 82
Commodity exports (as a share of GDP) 21.5 12.2 4.4
Total natural resources rents (as a share of GDP) 12.0 12.7 ..
Exports by commodity group (as a share of merchandise exports) 84 93 82
Agricultural commodities 3 1 3
Fuels 74 90 77
Ores, metals, precious stones and non-monetary gold 7 2 2
Three leading commodity exports (as a share of total merchandise exports) 72 90 77
[333] Petroleum oils, oils from bitumin. materials, crude 46 74 61
[334] Petroleum oils or bituminous minerals 70 % oil 25 16 15
[971] Gold, non-monetary (excluding gold ores and concentrates) – 1 –
Average price index of the leading commodity group exported 36.5 132.1 103.8
Five leading destination markets of commodity exports (as a share of total commodity exports) 87
United States of America 37
India 16
China 15
Taiwan, Province of China 12
Singapore 7
Commodity imports (millions of US dollars) 2,880 6,685 2,234
Commodity imports (as a share of total merchandise imports) 23 24 23
Food imports (millions of US dollars and as a share of total merchandise imports) 1,609 (13) 4,846 (17) 1,639 (17)
Fuel imports (millions of US dollars and as a share of total merchandise imports) 162 (1) 1,106 (4) 309 (3)
Five-leading trading partners for commodity imports (as a share of total commodity imports) 68
United States of America 23
Brazil 19
Argentina 11
European Union (28) 8
Colombia 7
Percentage change of GDP measured in constant 2010 prices 4.0 –9.1 –9.5
GDP per capita measured in constant 2010 US dollars 12,565 12,150 9,358
Population (thousands) 14,139 22,370 23,153
Human Development Index (value and rank) 0.6580 (65) 0.7712 (70) 0.7610 (76)
Total employment (as a share of the population) 56.4 59.4 58.8
Share of women in total employment 34.6 39.7 39.7
Proportion of population below international poverty line – SDG 1. Indicator 1.1.1 (1995) 10.4 (2006) 10.2
Gini index, latest available year (1995) 47.8 (2006) 46.9
Prevalence of undernourishment (per cent) – SDG 2. Indicator 2.1.1 16.4 11.7
Value added of agriculture/industry/services (as a share of GDP) 6/47/47 6/39/55 6/39/55
Employment in agriculture/industry/services (as a share of total employment) 14/24/63 9/23/68 10/23/67
Share of women in agriculture/industry/services 5/21/46 12/21/49 15/23/49
Institutional quality index, 2018 0.0645
Control of corruption –0.86 –1.36 –1.36
Rule of law –0.75 –2.05 –2.26
OTHER STRUCTURAL INDICATORS
MERCHANDISE AND COMMODITY EXPORT DEPENDENCE
COMMODITY IMPORT DEPENDENCE
KEY SOCIOECONOMIC INDICATORS](https://image.slidesharecdn.com/stateofcommoditydependance2019-190524115214/85/State-of-commodity-dependance-2019-221-320.jpg)
![Table of contents Introduction
Chapter 1
Key Findings
from the Report
Chapter 2
Country Statistical
Profiles
List of Country
Statistical Profiles
216
VIET NAM
1995 2013-2017 2017
Merchandise export value (millions of US dollars) 5,449 167,000 214,000
Unallocated exports (as a share of merchandise exports) 4.3 0.2 –
Merchandise export concentration by product line (Herfindahl-Hirschmann index) 0.2000 0.1813 0.1777
Commodity export value (millions of US dollars) 2,837 35,647 44,749
Commodity exports (as a share of total merchandise exports) 52 21 21
Commodity exports (as a share of GDP) 13.7 18.2 20.0
Total natural resources rents (as a share of GDP) 6.9 4.1 2.3
Exports by commodity group (as a share of merchandise exports) 52 21 21
Agricultural commodities 33 16 16
Fuels 18 4 3
Ores, metals, precious stones and non-monetary gold 1 1 1
Three leading commodity exports (as a share of total merchandise exports) 25 10 10
[03] Fishery products 8 5 5
[333] Petroleum oils, oils from bitumin. materials, crude 15 3 2
[057] Fruits and nuts (excluding oil nuts), fresh or dried 1 2 3
Average price index of the leading commodity group exported 80.8 109.0 102.7
Five leading destination markets of commodity exports (as a share of total commodity exports) 63
China 23
European Union (28) 12
United States of America 12
Japan 10
Republic of Korea 6
Commodity imports (millions of US dollars) 1,634 35,521 43,904
Commodity imports (as a share of total merchandise imports) 20 21 21
Food imports (millions of US dollars and as a share of total merchandise imports) 345 (4) 13,616 (8) 16,852 (8)
Fuel imports (millions of US dollars and as a share of total merchandise imports) 840 (10) 9,210 (6) 10,025 (5)
Five-leading trading partners for commodity imports (as a share of total commodity imports) 39
China 11
United States of America 8
Singapore 7
Republic of Korea 7
Thailand 6
Percentage change of GDP measured in constant 2010 prices 9.5 26.2 6.7
GDP per capita measured in constant 2010 US dollars 571 1,656 1,833
Population (thousands) 48,452 71,941 73,508
Human Development Index (value and rank) 0.5290 (103) 0.6840 (115) 0.6940 (114)
Total employment (as a share of the population) 75.9 76.7 76.6
Share of women in total employment 48.7 48.2 48.2
Proportion of population below international poverty line – SDG 1. Indicator 1.1.1 (1998) 35.5 (2016) 2.0
Gini index, latest available year (1998) 35.4 (2016) 35.2
Prevalence of undernourishment (per cent) – SDG 2. Indicator 2.1.1 24.3 10.8
Value added of agriculture/industry/services (as a share of GDP) 25/26/49 19/37/44 18/36/45
Employment in agriculture/industry/services (as a share of total employment) 71/11/19 44/23/33 41/25/34
Share of women in agriculture/industry/services 49/41/52 50/40/52 50/40/52
Institutional quality index, 2018 0.3675
Control of corruption –0.49 –0.48 –0.58
Rule of law –0.48 –0.21 0.07
MERCHANDISE AND COMMODITY EXPORT DEPENDENCE
COMMODITY IMPORT DEPENDENCE
KEY SOCIOECONOMIC INDICATORS
OTHER STRUCTURAL INDICATORS](https://image.slidesharecdn.com/stateofcommoditydependance2019-190524115214/85/State-of-commodity-dependance-2019-222-320.jpg)
![Table of contents Introduction
Chapter 1
Key Findings
from the Report
Chapter 2
Country Statistical
Profiles
List of Country
Statistical Profiles
217
YEMEN*
1995 2013-2017 2017
Merchandise export value (millions of US dollars) 1,917 3,917 1,209
Unallocated exports (as a share of merchandise exports) 0.2 1.0 0.1
Merchandise export concentration by product line (Herfindahl-Hirschmann index) 0.8127 0.4684 0.3736
Commodity export value (millions of US dollars) 1,873 3,729 1,114
Commodity exports (as a share of total merchandise exports) 98 95 92
Commodity exports (as a share of GDP) 31.6 12.6 4.0
Total natural resources rents (as a share of GDP) 34.7 7.9 1.0
Exports by commodity group (as a share of merchandise exports) 98 95 92
Agricultural commodities 4 10 20
Fuels 93 82 46
Ores, metals, precious stones and non-monetary gold 1 3 26
Three leading commodity exports (as a share of total merchandise exports) 91 81 46
[333] Petroleum oils, oils from bitumin. materials, crude 82 40 30
[343] Natural gas, whether or not liquefied – 36 13
[334] Petroleum oils or bituminous minerals 70 % oil 9 5 3
Average price index of the leading commodity group exported 36.5 132.1 103.8
Five leading destination markets of commodity exports (as a share of total commodity exports) 76
China 32
Republic of Korea 18
Thailand 14
Japan 6
India 6
Commodity imports (millions of US dollars) 709 4,312 3,658
Commodity imports (as a share of total merchandise imports) 45 47 52
Food imports (millions of US dollars and as a share of total merchandise imports) 485 (31) 3,140 (34) 2,722 (39)
Fuel imports (millions of US dollars and as a share of total merchandise imports) 154 (10) 768 (8) 532 (8)
Five-leading trading partners for commodity imports (as a share of total commodity imports) 51
European Union (28) 13
United Arab Emirates 12
Brazil 10
India 9
Saudi Arabia 6
Percentage change of GDP measured in constant 2010 prices 16.7 –29.8 –9.5
GDP per capita measured in constant 2010 US dollars 773 677 457
Population (thousands) 7,632 15,995 16,973
Human Development Index (value and rank) 0.4150 (123) 0.4818 (167) 0.4520 (175)
Total employment (as a share of the population) 41.6 32.4 32.6
Share of women in total employment 20.2 6.9 6.6
Proportion of population below international poverty line – SDG 1. Indicator 1.1.1 (1998) 7.4 (2014) 18.8
Gini index, latest available year (1998) 35.0 (2014) 36.7
Prevalence of undernourishment (per cent) – SDG 2. Indicator 2.1.1 29.9 34.4
Value added of agriculture/industry/services (as a share of GDP) 17/27/55 15/31/54 15/31/54
Employment in agriculture/industry/services (as a share of total employment) 55/11/34 35/14/51 45/13/43
Share of women in agriculture/industry/services 32/5/5 11/7/4 10/6/3
Institutional quality index, 2018 0.0756
Control of corruption –0.74 –1.51 –1.59
Rule of law –1.38 –1.41 –1.75
OTHER STRUCTURAL INDICATORS
MERCHANDISE AND COMMODITY EXPORT DEPENDENCE
COMMODITY IMPORT DEPENDENCE
KEY SOCIOECONOMIC INDICATORS](https://image.slidesharecdn.com/stateofcommoditydependance2019-190524115214/85/State-of-commodity-dependance-2019-223-320.jpg)
![Table of contents Introduction
Chapter 1
Key Findings
from the Report
Chapter 2
Country Statistical
Profiles
List of Country
Statistical Profiles
218
ZAMBIA*
1995 2013-2017 2017
Merchandise export value (millions of US dollars) 1,055 8,386 8,158
Unallocated exports (as a share of merchandise exports) 0.1 0.4 0.3
Merchandise export concentration by product line (Herfindahl-Hirschmann index) 0.7548 0.6536 0.6682
Commodity export value (millions of US dollars) 990 7,301 7,154
Commodity exports (as a share of total merchandise exports) 94 87 88
Commodity exports (as a share of GDP) 26.0 29.6 27.8
Total natural resources rents (as a share of GDP) 15.7 15.9 15.1
Exports by commodity group (as a share of merchandise exports) 94 87 88
Agricultural commodities 5 13 12
Fuels 2 1 1
Ores, metals, precious stones and non-monetary gold 87 73 75
Three leading commodity exports (as a share of total merchandise exports) 77 72 72
[682] Copper 77 67 69
[121] Tobacco, unmanufactured; tobacco refuse – 3 2
[044] Maize (not including sweet corn), unmilled – 2 2
Average price index of the leading commodity group exported 58.3 123.5 127.5
Five leading destination markets of commodity exports (as a share of total commodity exports) 72
Switzerland 28
China 28
United Arab Emirates 7
South Africa 5
Zimbabwe 4
Commodity imports (millions of US dollars) 187 3,057 3,085
Commodity imports (as a share of total merchandise imports) 26 34 35
Food imports (millions of US dollars and as a share of total merchandise imports) 63 (9) 467 (5) 480 (5)
Fuel imports (millions of US dollars and as a share of total merchandise imports) 94 (13) 948 (11) 1,138 (13)
Five-leading trading partners for commodity imports (as a share of total commodity imports) 82
Democratic Republic of the Congo 42
South Africa 19
Kuwait 11
Kenya 7
Mauritius 3
Percentage change of GDP measured in constant 2010 prices 2.9 21.8 4.1
GDP per capita measured in constant 2010 US dollars 906 1,621 1,644
Population (thousands) 4,878 8,801 9,439
Human Development Index (value and rank) 0.4120 (124) 0.5822 (139) 0.5880 (141)
Total employment (as a share of the population) 65.6 69.1 69.0
Share of women in total employment 46.9 47.4 47.5
Proportion of population below international poverty line – SDG 1. Indicator 1.1.1 (1996) 41.7 (2015) 57.5
Gini index, latest available year (1996) 48.3 (2015) 57.1
Prevalence of undernourishment (per cent) – SDG 2. Indicator 2.1.1 47.4 44.5
Value added of agriculture/industry/services (as a share of GDP) 15/37/48 7/35/58 5/36/59
Employment in agriculture/industry/services (as a share of total employment) 71/6/23 54/11/35 53/12/35
Share of women in agriculture/industry/services 52/16/39 56/16/44 56/16/45
Institutional quality index, 2018 0.3740
Control of corruption –0.84 –0.39 –0.54
Rule of law –0.53 –0.27 –0.33
MERCHANDISE AND COMMODITY EXPORT DEPENDENCE
COMMODITY IMPORT DEPENDENCE
KEY SOCIOECONOMIC INDICATORS
OTHER STRUCTURAL INDICATORS](https://image.slidesharecdn.com/stateofcommoditydependance2019-190524115214/85/State-of-commodity-dependance-2019-224-320.jpg)
![Table of contents Introduction
Chapter 1
Key Findings
from the Report
Chapter 2
Country Statistical
Profiles
List of Country
Statistical Profiles
219
ZIMBABWE
1995 2013-2017 2017
Merchandise export value (millions of US dollars) 2,121 3,600 4,060
Unallocated exports (as a share of merchandise exports) 0.4 0.4 0.1
Merchandise export concentration by product line (Herfindahl-Hirschmann index) 0.2352 0.3293 0.3337
Commodity export value (millions of US dollars) 1,441 3,080 3,495
Commodity exports (as a share of total merchandise exports) 68 86 86
Commodity exports (as a share of GDP) 15.1 19.1 20.2
Total natural resources rents (as a share of GDP) 8.0 8.2 8.8
Exports by commodity group (as a share of merchandise exports) 68 86 86
Agricultural commodities 51 48 50
Fuels 2 2 1
Ores, metals, precious stones and non-monetary gold 14 35 35
Three leading commodity exports (as a share of total merchandise exports) 23 51 50
[121] Tobacco, unmanufactured; tobacco refuse 23 31 32
[971] Gold, non-monetary (excluding gold ores and concentrates) – 12 13
[284] Nickel ores concentrates; nickel mattes, etc. 1 8 5
Average price index of the leading commodity group exported 80.8 109.0 102.7
Five leading destination markets of commodity exports (as a share of total commodity exports) 85
South Africa 38
China 19
European Union (28) 12
United Arab Emirates 10
Mozambique 5
Commodity imports (millions of US dollars) 461 1,459 1,321
Commodity imports (as a share of total merchandise imports) 17 36 34
Food imports (millions of US dollars and as a share of total merchandise imports) 173 (7) 865 (22) 787 (20)
Fuel imports (millions of US dollars and as a share of total merchandise imports) 119 (4) 403 (10) 342 (9)
Five-leading trading partners for commodity imports (as a share of total commodity imports) 81
South Africa 40
Zambia 25
Singapore 7
Kuwait 6
Malawi 4
Percentage change of GDP measured in constant 2010 prices 0.2 25.7 1.8
GDP per capita measured in constant 2010 US dollars 683 919 904
Population (thousands) 6,260 9,248 9,719
Human Development Index (value and rank) 0.4670 (113) 0.5274 (152) 0.5350 (153)
Total employment (as a share of the population) 69.9 79.0 79.4
Share of women in total employment 47.8 48.8 48.8
Proportion of population below international poverty line – SDG 1. Indicator 1.1.1 (2011) 21.4 ..
Gini index, latest available year (2011) 43.1 ..
Prevalence of undernourishment (per cent) – SDG 2. Indicator 2.1.1 40.2 46.6
Value added of agriculture/industry/services (as a share of GDP) 14/29/57 11/25/63 11/24/64
Employment in agriculture/industry/services (as a share of total employment) 60/14/27 67/7/25 68/7/24
Share of women in agriculture/industry/services 56/21/44 52/15/50 52/16/50
Institutional quality index, 2018 0.1285
Control of corruption –0.28 –1.32 –1.27
Rule of law –0.81 –1.41 –1.38
OTHER STRUCTURAL INDICATORS
MERCHANDISE AND COMMODITY EXPORT DEPENDENCE
COMMODITY IMPORT DEPENDENCE
KEY SOCIOECONOMIC INDICATORS](https://image.slidesharecdn.com/stateofcommoditydependance2019-190524115214/85/State-of-commodity-dependance-2019-225-320.jpg)
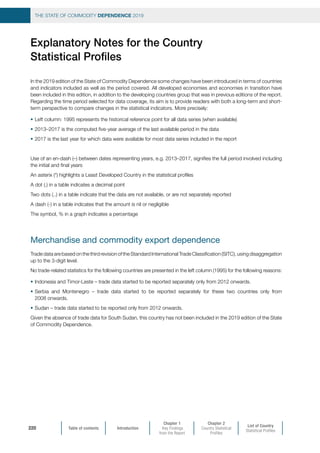
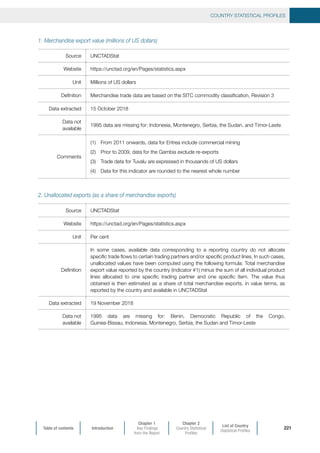
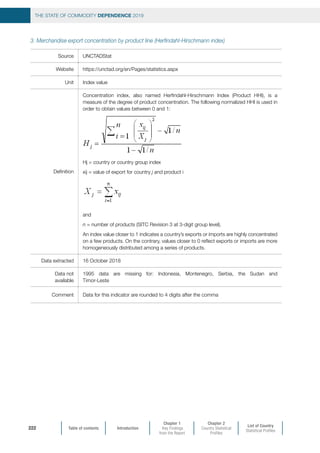
![Table of contents Introduction
Chapter 1
Key Findings
from the Report
Chapter 2
Country Statistical
Profiles
List of Country
Statistical Profiles
COUNTRY STATISTICAL PROFILES
223
4. Commodity export value (millions of US dollars)
Source UNCTADStat
Website https://unctad.org/en/Pages/statistics.aspx
Unit Millions of US dollars
Definition
Commodity export data include data for food and live animals [0], Beverages and tobacco
[1], Crude materials, inedible, except fuels [2], Mineral fuels, lubricants and related
materials [3], Animal and vegetable oils, fats and waxes [4], Non-ferrous metals [68],
Pearls, precious and semi-precious stones [667], Gold, non-monetary (excluding gold
ores and concentrates) [971]
Data extracted 15 October 2018
Data not
available
1995 data are missing for: Indonesia, Montenegro, Serbia, the Sudan and Timor-Leste
Comments
(1) From 2011 onwards, data for Eritrea include commercial mining
(2) Prior to 2009, data for the Gambia exclude re-exports
(3) Trade data for Tuvalu are expressed in thousands of 1,000 US dollars
(4) Data for this indicator are rounded to the nearest whole number
5. Commodity exports (as a share of total merchandise exports)
Source UNCTADStat
Website https://unctad.org/en/Pages/statistics.aspx
Unit Per cent
Definition
Ratio (in percentage) of data series 3 (Commodity export value) versus data series 1
(Merchandise export value)
Data extracted 15 October 2018
Data not
available
1995 data are missing for: Indonesia, Montenegro, Serbia, the Sudan,
Timor-Leste
Comment Data for this indicator are rounded to the nearest whole number](https://image.slidesharecdn.com/stateofcommoditydependance2019-190524115214/85/State-of-commodity-dependance-2019-229-320.jpg)
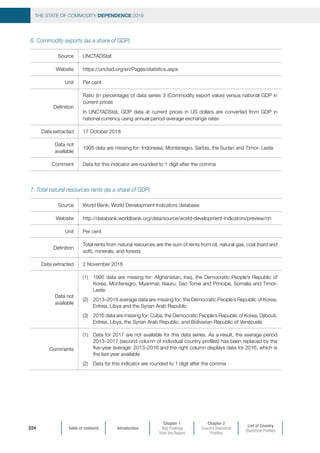
![Table of contents Introduction
Chapter 1
Key Findings
from the Report
Chapter 2
Country Statistical
Profiles
List of Country
Statistical Profiles
COUNTRY STATISTICAL PROFILES
225
8. Exports by commodity group (as a share of merchandise exports)
Source UNCTADStat
Website https://unctad.org/en/Pages/statistics.aspx
Unit Per cent
Definition
Distribution of commodity exports by commodity group:
(1) Agricultural products (SITC 0 + 1 + 2 (less 27 and 28) + 4)
(2) Fuels (SITC 3)
(3) Ores, metals, precious stones and non-monetary gold (SITC 27 + 28 +667 + 68
+971)
Data extracted 18 October 2018
Data not
available
1995 data are missing for: Indonesia, Montenegro, Serbia, the Sudan and Timor- Leste
Comment Data for this indicator are rounded to the nearest whole number
9. Three leading commodity exports (as a share of total merchandise exports)
Source UNCTADStat
Website https://unctad.org/en/Pages/statistics.aspx
Unit Per cent
Definitions
Leading commodity exports are the main individual commodities exports at the 3-digit
level, except for “fishery products” and “forestry products” which are the result of the
aggregation of several 3-digit commodity items, as follows:
(1) Fishery products
[034] Fish, fresh (live or dead), chilled or frozen,
[035] Fish, dried, salted or in brine; smoked fish,
[036] Crustaceans, molluscs and aquatic invertebrates,
[037] Fish, aqua. invertebrates, prepared, preserved, n.e.s.)
(2) Forestry products
[245] Fuel wood (excluding wood waste) and wood charcoal,
[246] Wood in chips or particles and wood waste,
[247] Wood in the rough or roughly squared,
[248] Wood simply worked, and railway sleepers of wood,
[251] Pulp and waste paper
The share of each individual commodity product in the total merchandise exports has
been computed using data from indicator #1 as the denominator
Data extracted 25 October 2018
Data not
available
1995 data are missing for: Indonesia, Montenegro, Serbia, the Sudan and Timor- Leste](https://image.slidesharecdn.com/stateofcommoditydependance2019-190524115214/85/State-of-commodity-dependance-2019-231-320.jpg)
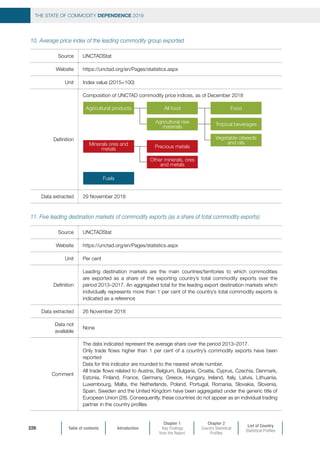
![Table of contents Introduction
Chapter 1
Key Findings
from the Report
Chapter 2
Country Statistical
Profiles
List of Country
Statistical Profiles
COUNTRY STATISTICAL PROFILES
227
Commodity import dependence
12. Commodity imports (millions of US dollars)
Source UNCTADStat
Website https://unctad.org/en/Pages/statistics.aspx
Unit Millions of US dollars
Definition
Import data for primary commodities are based on the SITC third revision. They include
the following commodity groups and individual commodities:
(1) Food and live animals [0]
(2) Beverages and tobacco [1]
(3) Crude materials, inedible, except fuels [2]
(4) Mineral fuels, lubricants and related materials [3]
(5) Animal and vegetable oils, fats and waxes [4]
(6) Non-ferrous metals [68]
(7) Pearls, precious and semi-precious stones [667]
Gold, non-monetary (excluding gold ores and concentrates) [971]
Data extracted 29 October 2018
Data not
available
1995 data are missing for: Indonesia, Montenegro, Serbia, the Sudan and Timor- Leste
Data for this indicator are rounded to the nearest whole number
13. Commodity imports (as a share of total merchandise imports)
Source UNCTADStat
Website https://unctad.org/en/Pages/statistics.aspx
Unit Per cent
Definition
Ratio (in percentage) of indicator #11 (Commodity imports) versus Merchandise imports,
in value terms
Data extracted 30 October 2018
Data not
available
1995 data are missing for: Indonesia, Montenegro, Serbia, the Sudan and Timor-Leste](https://image.slidesharecdn.com/stateofcommoditydependance2019-190524115214/85/State-of-commodity-dependance-2019-233-320.jpg)
![Table of contents Introduction
Chapter 1
Key Findings
from the Report
Chapter 2
Country Statistical
Profiles
List of Country
Statistical Profiles
THE STATE OF COMMODITY DEPENDENCE 2019
228
14. Food imports (millions of US dollars and as a share of total merchandise imports)
Source UNCTADStat
Website https://unctad.org/en/Pages/statistics.aspx
Unit Millions of US dollars and per cent
Definitions
Basic food imports have been considered for indicator #14. Thus, data cover all 3-digit
commodity items under the following titles: [0] Food and live animals, [22] Oil seeds and
oleaginous fruits and [4] Animal and vegetable oils, fats and waxes
Data extracted 21 November 2018
Data not
available
1995 data are missing for: Indonesia, Montenegro, Serbia, the Sudan and Timor-Leste
Data are rounded to the nearest whole number in both absolute and percentage terms
15. Fuel imports (millions of US dollars and as a share of total merchandise imports)
Source UNCTADStat
Website https://unctad.org/en/Pages/statistics.aspx
Unit Millions of US dollars and per cent
Definition Fuel import data are based on SITC, third revision, SITC code [3]
Data extracted 30 October 2018
Data not
available
1995 data are missing for: Indonesia, Montenegro, Serbia, the Sudan and Timor-Leste
Data are rounded to the nearest whole number in both absolute and percentage terms
16. Five-leading trading partners for commodity imports (as a share of total commodity imports)
Source UNCTADStat
Website https://unctad.org/en/Pages/statistics.aspx
Unit Per cent
Definition
Leading importing markets are the main individual countries/territories in terms of a
country’s commodity imports as a share of its total commodities imports over the 2013–
2017 period. An aggregated total is indicated as a reference
Data extracted 26 November 2018
Data not available None
Comment
The data indicated represent the average share over the 2013–2017 period.
Only trade flows higher than 1 per cent of a country’s commodity imports have been
presented. Data are rounded to the nearest whole number](https://image.slidesharecdn.com/stateofcommoditydependance2019-190524115214/85/State-of-commodity-dependance-2019-234-320.jpg)
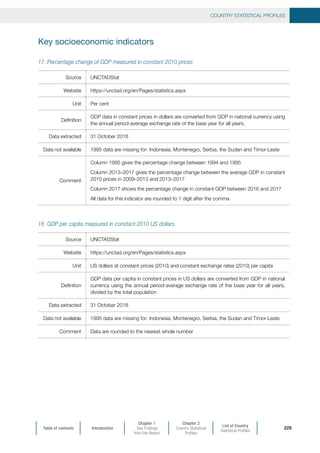
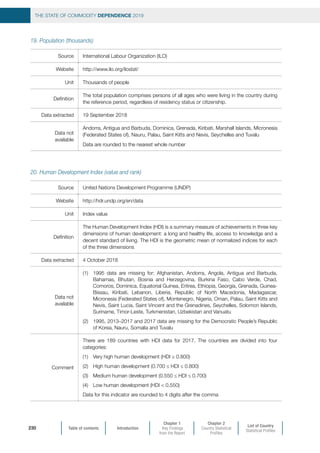
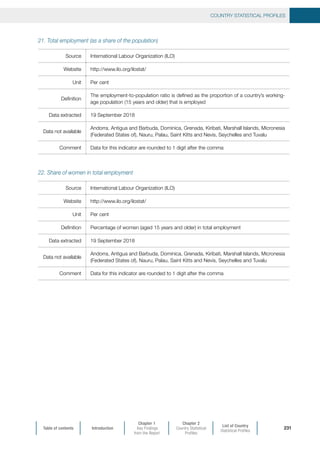
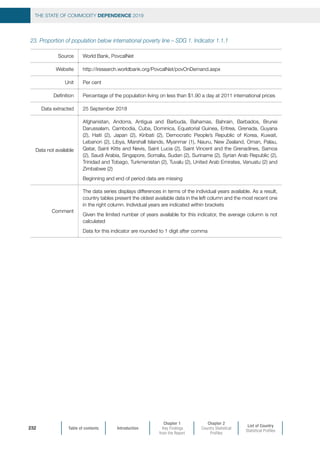
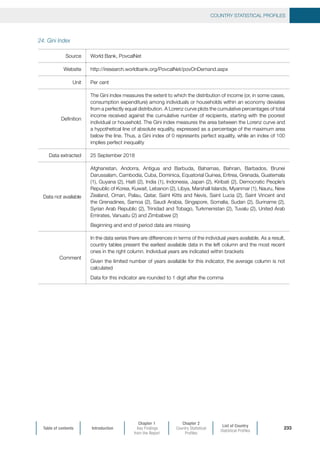
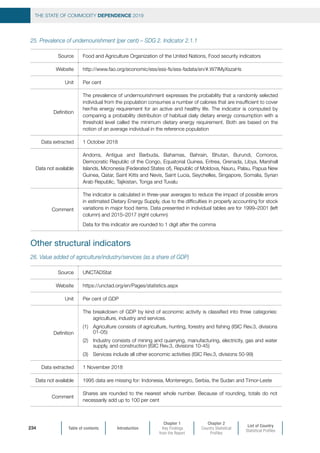
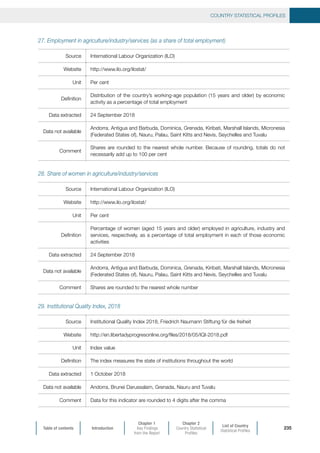
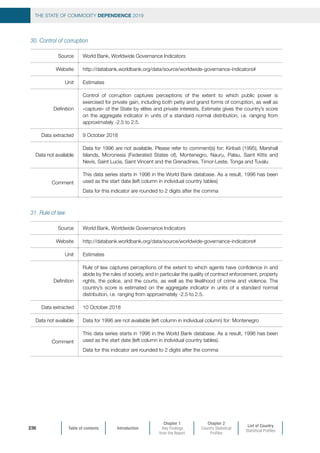
![Table of contents Introduction
Chapter 1
Key Findings
from the Report
Chapter 2
Country Statistical
Profiles
List of Country
Statistical Profiles
COUNTRY STATISTICAL PROFILES
237
List of Standard International Trade Classification (SITC),
Third Revision Codes
All commodities [0 + 1 + 2 + 3 + 4 + 667 + 68 + 971]
Fishery products [034 +035 + 036 + 037]
Forestry products [245 + 246 + 247 + 248 + 251]
This classification follows closely that of UNCTADStat, except that code 26 (Textile Fibres and their Wastes) is not
included in Apparel and Textiles, but in Agricultural Raw Materials.
See https://unctadstat.unctad.org/EN/Classifications/DimSitcRev3Products_DsibSpecialGroupings_Hierarchy.pdf
1. AGRICULTURAL PRODUCTS
a. FOOD
[001] Live animals other than animals of division 03
[011] Meat of bovine animals, fresh, chilled or frozen
[012] Other meat and edible meat offal
[016] Meat, edible meat offal, salted, dried; flours,
meals
[017] Meat, edible meat offal, prepared, preserved,
n.e.s.
[022] Milk, cream and milk products (excluding butter,
cheese)
[023] Butter and other fats and oils derived from milk
[024] Cheese and curd
[025] Birds’ eggs, and eggs’ yolks; egg albumin
[034] Fish, fresh (live or dead), chilled or frozen
[035] Fish, dried, salted or in brine; smoked fish
[036] Crustaceans, mollusks and aquatic invertebrates
[037] Fish, aqua. invertebrates, prepared, preserved,
n.e.s.
[041] Wheat (including spelt) and meslin, unmilled
[042] Rice
[043] Barley, unmilled
[044] Maize (not including sweet corn), unmilled
[045] Cereals, unmilled (excluding wheat, rice, barley,
maize)
[046] Meal and flour of wheat and flour of meslin
[047] Other cereal meals and flour
[048] Cereal preparations, flour of fruits or vegetables
[054] Vegetables
[056] Vegetables, roots, tubers, prepared, preserved,
n.e.s.
[057] Fruits and nuts (excluding oil nuts), fresh or dried
[058] Fruit, preserved, and fruit preparations (no juice)
[059] Fruit and vegetable juices, unfermented, no spirit
[061] Sugar, molasses and honey
[062] Sugar confectionery
[081] Feeding stuff for animals (no unmilled cereals)
[091] Margarine and shortening
[098] Edible products and preparations, n.e.s.
[222] Oil seeds and oleaginous fruits (excluding flour)
[223] Oil seeds oleaginous fruits (incl. flour, n.e.s.)
[411] Animals oils and fats
[421] Fixed vegetable fats oils, crude, refined,
fractio.
[422] Fixed vegetable fats oils, crude, refined, fract.
[431] Animal or veg. oils fats, processed, n.e.s.;
mixt.
b. TROPICAL BEVERAGES AND SPICES
[071] Coffee and coffee substitutes
[072] Cocoa
[073] Chocolate, food preparations with cocoa, n.e.s.
[074] Tea and mate
[075] Spices
c. BEVERAGES AND TOBACCO
[111] Non-alcoholic beverages, n.e.s.
[112] Alcoholic beverages
[121] Tobacco, unmanufactured; tobacco refuse
[122] Tobacco, manufactured](https://image.slidesharecdn.com/stateofcommoditydependance2019-190524115214/85/State-of-commodity-dependance-2019-243-320.jpg)
![Table of contents Introduction
Chapter 1
Key Findings
from the Report
Chapter 2
Country Statistical
Profiles
List of Country
Statistical Profiles
THE STATE OF COMMODITY DEPENDENCE 2019
238
d. AGRICULTURAL RAW MATERIALS
[211] Hides and skins (except furskins), raw
[212] Furskins, raw, other than hides skins of group
211
[231] Natural rubber similar gums, in primary forms
[232] Synthetic rubber
[245] Fuel wood (excluding wood waste) and wood
charcoal
[246] Wood in chips or particles and wood waste
[247] Wood in the rough or roughly squared
[248] Wood simply worked, and railway sleepers of
wood
[251] Pulp and waste paper
[261] Silk
[263] Cotton
[265] Vegetable textile fibres, not spun; waste of them
[266] Synthetic fibres suitable for spinning
[267] Other man-made fibres suitable for spinning
[268] Wool and other animal hair (incl. wool tops)
[269] Worn clothing and other worn textile articles
[291] Crude animal materials, n.e.s.
[292] Crude vegetable materials, n.e.s.
2. ENERGY
[321] Coal, whether or not pulverized, not
agglomerated
[322] Briquettes, lignites and peat
[325] Coke semi-cokes of coal, lign., peat; retort
carbon
[333] Petroleum oils, oils from bitumin. materials,
crude
[334] Petroleum oils or bituminous minerals 70 % oil
[335] Residual petroleum products, n.e.s., related
mater.
[342] Liquefied propane and butane
[343] Natural gas, whether or not liquefied
[344] Petroleum gases, other gaseous hydrocarbons,
n.e.s.
[351] Electric current
3. MINERALS, ORES AND METALS
[272] Crude fertilizers (excluding those of division 56)
[273] Stone, sand and gravel
[274] Sulphur and unroasted iron pyrites
[277] Natural abrasives, n.e.s. (incl. industri. diamonds)
[278] Other crude minerals
[281] Iron ore and concentrates
[282] Ferrous waste, scrape; remelting ingots, iron,
steel
[283] Copper ores and concentrates; copper mattes,
cemen
[284] Nickel ores concentrates; nickel mattes, etc.
[285] Aluminium ores and concentrates (incl. alumina)
[286] Ores and concentrates of uranium or thorium
[287] Ores and concentrates of base metals, n.e.s.
[288] Non-ferrous base metal waste and scrap, n.e.s.
[289] Ores concentrates of precious metals; waste,
scrap
[667] Pearls, precious semi-precious stones
[681] Silver, platinum, other metals of the platinum
group
[682] Copper
[683] Nickel
[684] Aluminium
[685] Lead
[686] Zinc
[687] Tin
[689] Miscellaneous no-ferrous base metals for
metallur.
[971] Gold, non-monetary (excluding gold ores and
concentrates
All other products are considered as non-commodities.
They include the following sub-groups:
- Chemical products [5]
- Manufactures [61 + 62 + 63 + 64 + 66 (less 667) +
67 + 69]
- Machinery and Transport Equipment [7]
- Apparel and Textiles [65 + 84]
- Other Manufactures [8 (less 84)]](https://image.slidesharecdn.com/stateofcommoditydependance2019-190524115214/85/State-of-commodity-dependance-2019-244-320.jpg)

Over half of all countries and two thirds of developing countries are commodity-dependent, with commodity dependence concentrated in sub-Saharan Africa and least developed countries. The number of commodity-dependent countries has increased over the past 20 years, mainly due to a rise in mineral-dependent countries, while the dominant export product group changed in only 25% of countries. Changes in commodity prices partly explain the evolution of commodity dependence by product group, with dependence on agricultural exports declining as prices fell.


