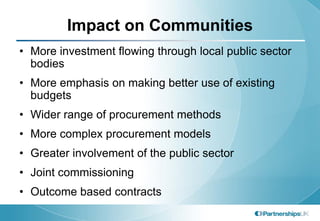
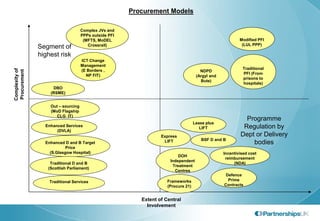
World class public services:
meeting the delivery challenge

      27 November 2009
Market segmentation
• Looking after the past
• Current pipeline
• Looking to the future
Project Pipeline - size and value
                                                                               NUMBER                  Total Value
Number

45                                                                                                           3.000
40
                                                                                                             2.500
35
30                                                                                                           2.000
25
                                                                                                             1.500
20
15                                                                                                           1.000
10
                                                                                                             0.500
 5
 0                                                                                                           -


                                                                                                    1001-
         0 - 50


                  51-100


                           101-150


                                     151-200


                                                 201-250


                                                           251-300


                                                                     301-400


                                                                               401-500


                                                                                         501-1000
                                                                                                            £bn


                                                                                                    2000
                                               Capital Value £m
Impact on Communities
• More investment flowing through local public sector
  bodies
• More emphasis on making better use of existing
  budgets
• Wider range of procurement methods
• More complex procurement models
• Greater involvement of the public sector
• Joint commissioning
• Outcome based contracts
The Future
New Challenges
• Strategic infrastructure planning
• Funding and Financing
• Prioritisation of Spend
• New procurement models
• Efficiency and Transformation
Strategic Infrastructure Planning
• Need to plan now for 5 to 50 years’ time
• Key sectors – Water, waste, telecoms, energy, and
  transport
• In the last ten years most of the attention has been
  on the PFI/PPP programme
New Procurement Models
Procurement Models

                                     Complex JVs and
                                     PPPs outside PFI
                                      (MFTS, MoDEL                                                         Modified PFI
                                        Crossrail)                                                          (LUL PPP)
                Segment of
                highest risk
                                     ICT Change
                                     Management
                                                                                                            Traditional
Complexity of


                                     (E Borders ,
Procurement


                                                                                        NDPD
                                       NP FIT)                                                              PFI (From
                                                                                      (Argyl and
                                                                                                            prisons to
                                                                                        Bute)
                                                                                                            hospitals)
                     DBO
                    (RSME)


                    Out – sourcing
                    (MoD Flagship
                       CLG IT)
                                                                                                             Programme
                                                                                     Lease plus
                  Enhanced Services
                                                                                        LIFT                Regulation by
                       (DVLA)
                                                                   Express                                 Dept or Delivery
                                                                                        BSF D and B
                  Enhanced D and B Target                           LIFT                                       bodies
                            Price
                    (S.Glasgow Hospital)                                                           Incentivised cost
                                                                           DOH
                                                                                                    reimbursement
                                                                       Independent
                    Traditional D and B                                                                 (NDA)
                                                                        Treatment
                   (Scottish Parliament)
                                                                         Centres
                                                                                                    Defence
                    Traditional Services                              Frameworks                     Prime
                                                                      (Procure 21)                 Contracts


                                                           Extent of Central
                                                             Involvement
Capturing the benefits of PPP
• Extended risk transfer
• Whole life cost approach
• Set aside budgets
• Output based contracting
• Management of supply markets
Bridging the Gap
                         High
                                   Cost-plus                                JVs
Contract Flexibility


                                              Partnering
                                                                     Integrator
                                 Frameworks

                       Medium
                                        D&B
                                                           DBO+


                                                            PFI−
                                                                             PFI


                                                                         Concessions
                         Low
                                Short                      Medium                  Long
                                 1-5                        7-12                   20-30

                                                 Contract Term (years)
Efficiency and Transformation
Public Services
The Broader Context – The Role of the
                State
• The state operates primarily as the champion of the user of
  public services (the patient, the pupil, the infirm, the offender,
  the traveller).
• Where the state is involved in delivery of public services, it is
  a “means” to achieving good, stable, value-for-money public
  services; it is not an end in itself.
• A key test of the state’s role in the area of public services is
  largely pragmatic (i.e. is a market operable?). This may be a
  moving target, as demand and supply dynamics can shift over
  time.
• Strategic decisions to modify the state’s role in an area of
  public service delivery can be taken – market building and
  market development programmes can be actively pursued.
Changing Market Dynamics in Public
                                     Services
High

                                • Insurance                            Supporting People
                                • Social housing
 Number of Commissions


                                • Utilities
                                                                          Social Care


                               Community health
                                  services

                                                                       Welfare to work

                               Probation services

Low

                         Low                                                               High
                                              Plurality of Provision
What Opportunities are Emerging – Community
                   Health?
                                    Average Weekly Tenders 2008

9


8


7                                                                                               Tenders in Period:                                 Number       Percentage
                                                                                                July - August 2008
6


5
                                                                                                Service Lines with
                                                                                                more than one tender
4
                                                                                                Primary Care                                               17      27%
                                                                                                Healthy Lifestyles*                                        7       11%
3
                                                                                                Mental Health                                              4        6%
                                                                                                Sexual Health                                              4        6%
2                                                                                               Childrens Services                                         3        5%
                                                                                                Dermatology                                                3        5%
1
                                                                                                Diabetes                                                   2        3%
                                                                                                Prison Health                                              2        3%
                                                                                                Dental                                                     2        3%
0                                                                                               Occupational Health                                        2        3%
    Janu ary   Fe bruary   Ma rch    April       May        June   July   August   Se ptember
                                                                                                Physio / MSK                                               2        3%
                                                                                                Eating Disorder                                            1        2%

                                                                                                Services with
                                                                                                single tender                                              14      22%

                                                                                                Total                                                      63      100%

                                                                                                Mean tenders                                   This Period Previous
                                                                                                per month                                                  Periods

                                                                                                                                                           21        7

                                                                                                * Healthy Lifestyles: cov ers smoking cessation, fit for
                                                                                                work, weight management
So What Will the Public Sector Buy-Side
         Look Like in the Future?
• The distinction between those sourcing public services and
  those supplying public services should be much clearer and
  cleaner

• Sector asymmetries should be less prevalent

• Market mechanisms should be sharper and market
  management and regulatory apparatus more fit for purpose

• Outcome based commissioning should lead to those sourcing
  public services being less prescriptive about the “who” and the
  “how”, and more prescriptive about the “what”
So what will the provider side look like in the
                   future?

• A mixed economy

• Public, private and third sectors working together

• Federations of cross-sectoral service providers

• Contractual structures recalibrated to reward
  outcomes
James Stewart


james.stewart@partnershipsuk.org.uk

World Class Public Services

  • 1.
    World class publicservices: meeting the delivery challenge 27 November 2009
  • 2.
    Market segmentation • Lookingafter the past • Current pipeline • Looking to the future
  • 3.
    Project Pipeline -size and value NUMBER Total Value Number 45 3.000 40 2.500 35 30 2.000 25 1.500 20 15 1.000 10 0.500 5 0 - 1001- 0 - 50 51-100 101-150 151-200 201-250 251-300 301-400 401-500 501-1000 £bn 2000 Capital Value £m
  • 4.
    Impact on Communities •More investment flowing through local public sector bodies • More emphasis on making better use of existing budgets • Wider range of procurement methods • More complex procurement models • Greater involvement of the public sector • Joint commissioning • Outcome based contracts
  • 5.
  • 6.
    New Challenges • Strategicinfrastructure planning • Funding and Financing • Prioritisation of Spend • New procurement models • Efficiency and Transformation
  • 7.
    Strategic Infrastructure Planning •Need to plan now for 5 to 50 years’ time • Key sectors – Water, waste, telecoms, energy, and transport • In the last ten years most of the attention has been on the PFI/PPP programme
  • 8.
  • 9.
    Procurement Models Complex JVs and PPPs outside PFI (MFTS, MoDEL Modified PFI Crossrail) (LUL PPP) Segment of highest risk ICT Change Management Traditional Complexity of (E Borders , Procurement NDPD NP FIT) PFI (From (Argyl and prisons to Bute) hospitals) DBO (RSME) Out – sourcing (MoD Flagship CLG IT) Programme Lease plus Enhanced Services LIFT Regulation by (DVLA) Express Dept or Delivery BSF D and B Enhanced D and B Target LIFT bodies Price (S.Glasgow Hospital) Incentivised cost DOH reimbursement Independent Traditional D and B (NDA) Treatment (Scottish Parliament) Centres Defence Traditional Services Frameworks Prime (Procure 21) Contracts Extent of Central Involvement
  • 10.
    Capturing the benefitsof PPP • Extended risk transfer • Whole life cost approach • Set aside budgets • Output based contracting • Management of supply markets
  • 11.
    Bridging the Gap High Cost-plus JVs Contract Flexibility Partnering Integrator Frameworks Medium D&B DBO+ PFI− PFI Concessions Low Short Medium Long 1-5 7-12 20-30 Contract Term (years)
  • 12.
  • 13.
  • 14.
    The Broader Context– The Role of the State • The state operates primarily as the champion of the user of public services (the patient, the pupil, the infirm, the offender, the traveller). • Where the state is involved in delivery of public services, it is a “means” to achieving good, stable, value-for-money public services; it is not an end in itself. • A key test of the state’s role in the area of public services is largely pragmatic (i.e. is a market operable?). This may be a moving target, as demand and supply dynamics can shift over time. • Strategic decisions to modify the state’s role in an area of public service delivery can be taken – market building and market development programmes can be actively pursued.
  • 15.
    Changing Market Dynamicsin Public Services High • Insurance Supporting People • Social housing Number of Commissions • Utilities Social Care Community health services Welfare to work Probation services Low Low High Plurality of Provision
  • 16.
    What Opportunities areEmerging – Community Health? Average Weekly Tenders 2008 9 8 7 Tenders in Period: Number Percentage July - August 2008 6 5 Service Lines with more than one tender 4 Primary Care 17 27% Healthy Lifestyles* 7 11% 3 Mental Health 4 6% Sexual Health 4 6% 2 Childrens Services 3 5% Dermatology 3 5% 1 Diabetes 2 3% Prison Health 2 3% Dental 2 3% 0 Occupational Health 2 3% Janu ary Fe bruary Ma rch April May June July August Se ptember Physio / MSK 2 3% Eating Disorder 1 2% Services with single tender 14 22% Total 63 100% Mean tenders This Period Previous per month Periods 21 7 * Healthy Lifestyles: cov ers smoking cessation, fit for work, weight management
  • 17.
    So What Willthe Public Sector Buy-Side Look Like in the Future? • The distinction between those sourcing public services and those supplying public services should be much clearer and cleaner • Sector asymmetries should be less prevalent • Market mechanisms should be sharper and market management and regulatory apparatus more fit for purpose • Outcome based commissioning should lead to those sourcing public services being less prescriptive about the “who” and the “how”, and more prescriptive about the “what”
  • 18.
    So what willthe provider side look like in the future? • A mixed economy • Public, private and third sectors working together • Federations of cross-sectoral service providers • Contractual structures recalibrated to reward outcomes
  • 19.