We investigate if a period of time feels longer or shorter when pe.docxmelbruce90096
We investigate if a period of time feels longer or shorter when people are bored compared to when they are not bored. Using independent samples, we obtain these estimates of the time period (in minutes):
Sample 1 (bored): = 14.5, s = 10.22, n = 28
Sample 2 (not bored): = 9.0, s = 14.6, n = 34
a) What are the null and alternative hypothesis in terms of Ha and Ho
b) Compute t obt
c) With alpha = .05, what is t crit
d) What should we conclude about this relationship?
e) Using our two approaches, how important is boredom in determining how quickly time seems to pass?
HR Diagram Activity (30 points)
Brief Overview of Activity: Use an HR diagram to learn about the differences between the stars in our stellar neighborhood and the brightest stars in the sky.
Required Items:this HR diagram, red & black ink pens.
Procedure:
On the HR diagram, plot each star from the "Brightest Stars Group" in black ink and then plot each star from the "Nearest Stars Group" in red ink.
Data for both groups of stars can be found below.
Describe any differences between the two groups of stars - such as their location on the diagram, color, mass, and the types of stars in each group.
Which of the two groups of stars is most representative of the vast majority stars in the universe?
Data
Brightest Stars Group
Name
Spectral Type
Absolute Mag
Sirius
A1
1.45
Canopus
F0
-5.63
Rigel Kentaurus
G2
4.39
Arcturus
K2
-0.32
Vega
A0
0.61
Capella
G8
-0.52
Rigel
B8
-7.01
Procyon
F5
2.66
Betelgeuse
M2
-5.48
Achernar
B3
-2.71
Hadar
B1
-4.78
Altair
A7
2.22
Aldebaran
K5
-0.63
Acrux
B0.5
-4.18
Spica
B1
-3.44
Antares
M1
-5.12
Fomalhaut
A3
1.75
Pollux
K0
1.07
Deneb
A2
-6.90
Mimosa
B0.5
-3.90
Nearest Stars Group
Name
Spectral Type
Absolute Mag
Sun
G2
4.83
Proxima Centauri
M5.5
15.48
Alpha Centauri A
G2
4.38
Alpha Centauri B
K0
5.71
Barnard's Star
M3.5
13.25
Wolf 359
M5.5
16.64
Lalande 21185
M2
10.44
Sirius A
A1
1.44
Sirius B
A2
11.34
Epsilon Eridani
K2
6.20
Lacaille 9352
M1
9.76
Ross 128
M4
13.53
61 Cygni A
K5
7.48
61 Cygni B
K7
8.31
Procyon A
F5
2.65
Procyon B
A0
12.98
Struve 2398
M3
11.17
Groombridge 34
M1.5
10.31
Epsilon Indi
K4
6.98
Tau Ceti
G8.5
5.68
Radioactive Dating Activity (due at Stage 2) (30 points)
Brief Overview of Activity: Radioactive decay is one of the sources of the heat that drive the Earth's geologic activity. Radioactive decay also allows us to date rocks and determine the age of the Earth and other solar system bodies.
Required Items: 36 coins, a calculator, pencil & paper.
Procedure:
In this activity you will simulate the radioactive decay of 36 atoms of a rare isotope of uranium, U-235. Uranium-235 has a half-life of 700 million years. Gather 36 coins and arrange them in a 6 x 6 grid with all of the coins facing heads up.
Flip each coin into the air and then place it back in its original location on the grid. This represents the passage of 1 half-life (700 million years for this example). The coins that came up heads represent atoms that have not .
Brief Overview of Activity Locate and analyze two news reports of.docxchestnutkaitlyn
Brief Overview of Activity
: Locate and analyze two news reports of recent astronomical discoveries.
Required Items:
The internet and/or periodicals such as (for example)
The Washington Post
or
Sky and Telescope
The daily news is not just sports and politics. It includes science too! For this simple activity all you need to do is find two articles related to astronomy (either online or in hard copy), summarize and analyze them. The topics can be anything of your choosing so long as they are relevant to the course material. Examples could be a new telescope that has recently come online, the discovery of a new exoplanet, etc.; the idea is for you to find and write up something you are interested in! The writeup should be roughly one page long (double-spaced); the first half should be a summary of what was discovered, and the second should be your analysis of it--did it make sense? Was it well-written? Did it tie into things we've discussed in class? What are some of the ramifications, etc.? Include the complete citation of the original article (hyperlinked if it is from the internet). Make sure your sources are reputable ones, whether online or not; if you have any concerns about whether that's the case or not, please simply contact me and I can give you my opinion.
HR Diagram Activity (30 points)
Brief Overview of Activity
: Use an HR diagram to learn about the differences between the stars in our stellar neighborhood and the brightest stars in the sky.
Required Items:
this HR diagram
, red & black ink pens.
Procedure:
On the HR diagram, plot each star from the "Brightest Stars Group" in black ink and then plot each star from the "Nearest Stars Group" in red ink.
Data for both groups of stars can be found below.
Describe any differences between the two groups of stars - such as their location on the diagram, color, mass, and the types of stars in each group.
Which of the two groups of stars is most representative of the vast majority stars in the universe?
Data
Brightest Stars Group
Name
Spectral Type
Absolute Mag
Sirius
A1
1.45
Canopus
F0
-5.63
Rigel Kentaurus
G2
4.39
Arcturus
K2
-0.32
Vega
A0
0.61
Capella
G8
-0.52
Rigel
B8
-7.01
Procyon
F5
2.66
Betelgeuse
M2
-5.48
Achernar
B3
-2.71
Hadar
B1
-4.78
Altair
A7
2.22
Aldebaran
K5
-0.63
Acrux
B0.5
-4.18
Spica
B1
-3.44
Antares
M1
-5.12
Fomalhaut
A3
1.75
Pollux
K0
1.07
Deneb
A2
-6.90
Mimosa
B0.5
-3.90
Nearest Stars Group
Name
Spectral Type
Absolute Mag
Sun
G2
4.83
Proxima Centauri
M5.5
15.48
Alpha Centauri A
G2
4.38
Alpha Centauri B
K0
5.71
Barnard's Star
M3.5
13.25
Wolf 359
M5.5
16.64
Lalande 21185
M2
10.44
Sirius A
A1
1.44
Sirius B
A2
11.34
Epsilon Eridani
K2
6.20
Lacaille 9352
M1
9.76
Ross 128
M4
13.53
61 Cygni A
K5
7.48
61 Cygni B
K7
8.31
Procyon A
F5
2.65
Procyon B
A0
12.98
Struve 2398
M3
11.17
Groombridge 34
M1.5
10.31
Epsilon Indi
K4
6.98
Tau Ceti
G8.5
5.68
Radioactive Dating Activity (due at Stage 2) (30 points)
Brief Overview of Activity
: Radioactive decay is one of the .
Diameter of the Sun Activity (25 points)Brief Overview of Activity.docxmeghanthrelkeld256
Diameter of the Sun Activity (25 points)
Brief Overview of Activity
: A pinhole can form an image in much the same way as a lens. Measuring the size of the Sun's projected image and the distance between the pinhole and the image, you will be able to calculate the diameter of the Sun.
Required Items:
a friend to help you, a broom handle (or mop handle or long straight piece of wood of similar dimensions), a ruler (marked in centimeters), two envelopes (or two 5 x 7 index cards), a pencil, masking tape, one stickpin.
Number of Observations needed:
1
Timing of Observations:
near noon on a bright sunny day
Procedure:
Preparation:
Use the stickpin to poke a small hole near the center of one of the envelopes. Mark a location near the top of the broom handle with masking tape (this is where your friend will hold the envelope with the pin-hole). Mark another location near the end of the broom handle with masking tape (this is where you will observe and mark the image). Carefully measure the distance between your two marked locations on your broom handle. Make your measurement to the nearest 0.1 centimeter and record here: ___________ cm.
Observation:
Caution: never stare directly at the Sun. Gather your friend, marked broom handle, two envelopes, pencil, and then head outside. With your friend holding the envelope with the pinhole at the upper marked position and you holding the other envelope at the lower marked location, align the broom handle such that a small faint image of the Sun's disk is seen on the lower envelope. You may find it convenient to actually sit on the ground for this procedure. With a pencil, carefully mark the location of opposite sides of the Sun's disk. Here is a link showing a diagram of the
setup
.
Calculation:
From your marked envelope, carefully measure the size of the projected image of the Sun's disk to the nearest 0.1 centimeter and record here: __________ cm.
Next, use the relationship below to calculate the Sun's diameter in kilometers. Note that the distance to the Sun is 1.5 x 10
8
km.
Sun's diameter in kilometers image diameter in centimeters
------------------------------------- = ------------------------------------------
Distance to the Sun in kilometers distance between image and pinhole in cm
Record your calculated value for the diameter of the Sun ______________________ km
Setup Diagram
Moon Position Activity (25 points)
Brief Overview of Activity
: Over a period of at least three consecutive evenings, you will make careful observation of the Moon's changes in appearance and position.
Required Items:
a notebook to take notes or make a sketch (bring your red flashlight), you may take digital photos if you wish.
Number of Observations needed:
3
Timing of Observations:
3 consecutive nights, around (and after) sunset, a few days after the Moon is new. Your instructor will inform you what the appropriate viewing days are in the term.
Procedure:
Choose a location with a g.
This work is on Remote sensing consisting the following sub topics:
Scale
Satellite imagery
Annotation
Visual Interpretation
Aerial Photograph
Annotation
Visual Interpretation
Digital image and Linear Stretching
Unit 8 Algorithms - AssignmentTotal points for Assignment 3.docxdickonsondorris
Unit 8: Algorithms - Assignment
Total points for Assignment: 35 points. Assignments must be submitted as a Microsoft Word document and uploaded to the Dropbox for Unit 8. All Assignments are due by Tuesday at 11:59 PM ET of the assigned Unit.
NOTE: Assignment problems should not be posted to the Discussion threads. Questions on the Assignment problems should be addressed to the instructor by sending an email or by attending office hours.
You must show your work on all problems. If a problem is worth 2 points and you only show the answer, then you will receive only 1 point credit. If you use a calculator or online website, give the source and tell me exactly what you provided as input. For example, if you used Excel to compute 16 * 16, state “I typed =16*16 into Excel and got 256. You may type your answer right into this document.
Part I. Basic Computations
1. (5 points) Consider the following pseudo code for determining any sum in this form:
ComputeSum:
INPUT m
sum = 0
for k = 6 to m do
sum = sum + 5*k^2 + 2*k -10
next k
OUTPUT sum
a. Are the inputs and outputs for this algorithm well defined? Explain.
b. Identify an iterative operation in this algorithm.
2. ( 5 points) Consider this algorithm used to sort an array in this form:
5
8
6
3
5
1
6
19
7
4
S(n) =
BUBBLESORT:
INPUT S, n (an array called S, with n elements)
FOR i = 1 to n – 1
FOR j = 1 to n – 1
if S(j) > S(J+1) then
exchange the contents of S(j) with S(j+1)
NEXT
NEXT
OUTPUT S
Using the following grid, show a trace for this algorithm using the following values:
Part II. Case Study Season Finale: Unlocking the Treasure
The directors and producers of the “Patty Madeye Mysteries” have decided that the season finale for the show will be filmed in a secret location. They have identifed a remote island and visited it to determine what facilities and features are available on the island. The interns that were sent to scout out the island only had time to draw this map of the island and collect some other information.
In order to open the lock to the treasure chest, you will need to solve a puzzle using discrete math. Shown below are the paths and distances that connect the 7 locations on the map.
From
To
Distance
(in meters)
C
D
80
D
E
25
E
G
80
D
G
80
D
A
100
A
F
80
A
G
80
B
A
25
C
B
25
C
E
100
B
E
100
G
F
25
B
F
80
A
C
80
Clue #1: (3 points) One of the things that the film crew will need to know about is the condition of light during the day at the island. The only marking on the island was this binary representation of the longitude. Convert this longitude to decimal so that the crew can estimate time of sunrise and sunset. Show your work.
Longitude:
Answer: =Bin2Dec(10010100) the answer is 148
Clue #2. (3 ...
Mapping the maps (BL Labs annual symposium, 2 November 2015)James Heald
Updated snapshot of the "Mapping the Maps" project -- discovery and georeferencing of maps in the BL "Mechanical Curator" 1 million Flickr image set, including how the maps were found, how people can participate, and how the results can be accessed.
The purpose of this lab is to explore basic properties of the Jovian.docxhelen23456789
The purpose of this lab is to explore basic properties of the Jovian planets and to examine geologic processes on some of the larger moons of the outer solar system.
Part 1: A Comparison of Planetary Sizes
Background
As we saw last week, a basic property of planets is their size. To compare sizes, we can compare the diameter (distance from one side to the other) of one planet to another, or we can compare the radius (half the diameter) of one planet to another.
Graphing All the Major Planets
Table 1. The average diameters* of the planets in our solar system in kilometers (km)
MercuryVenusEarthMarsJupiterSaturnUranusNeptune487912,10412,7426779139,822116,46450,72449,244
*Data source:
AstronomyNotes.com
Size comparison is better shown graphically than with numbers. You have already done this for the terrestrial planets in last week's lab.
The image above shows an example of what you will be doing. Remember scientific notation. The numbers on the axes are 0; 20,000; 40,000; and 60,000; and refer to kilometers. In order to plot a circle representing a planet with a 70,000 km diameter, I first took the radius (35,000 which is half the diameter), moved along the x-axis to 35,000, and drew a line up from zero that was 70,000 units long. Then I repeated this for the y-axis and sketched in the circle around the “+” that I’d drawn. Detail about drawing the circles were shown in the video last week.
Table 1 gives the average diameters for the planets in our solar system in kilometers. Use this data to plot circles representing the different planets to their correct sizes on the graph paper provided (
.png version
;
.docx version
; and
.pdf version
). Use a different color for each circle. Clearly identify which circle corresponds to which planet (labels or keys to colors). When you have finished, upload your completed graph to the correct assignment box.
Figure 1. Example of graph paper used for plotting planet sizes. Links to downloadable
.png
,
.docx
, and
.pdf
versions.
UPLOAD TO
ASSIGNMENT BOX
FOR LAB 5 - Solar-System-Planet-Sizes
Upload your diagram to the Assignment Box—name your files: [Yourlastname]_Solar_System_Planet_Sizes
In addition to looking at a graphical representation, we sometimes compare objects by saying how many times larger or smaller one is relative to the other. For example: If one student is 5.5 feet tall, and another is 6 feet tall, then we can say that the taller student is 1.1 times taller than the shorter student or that the shorter student is 0.92 times shorter than the taller student. This is done by simply dividing one number into another.
Lab 5: Question 1
Jupiter and Saturn are similar in size, but Jupiter is the largest planet in the solar system. Jupiter is _________ times larger than Saturn. Enter a number only. Use two significant figure [example, 2.2 or 22]
Lab 5: Question 2
SHORT ESSAY: Spend a bit of time looking at the graph you've created. Describe the variation that y.
Operation “Blue Star” is the only event in the history of Independent India where the state went into war with its own people. Even after about 40 years it is not clear if it was culmination of states anger over people of the region, a political game of power or start of dictatorial chapter in the democratic setup.
The people of Punjab felt alienated from main stream due to denial of their just demands during a long democratic struggle since independence. As it happen all over the word, it led to militant struggle with great loss of lives of military, police and civilian personnel. Killing of Indira Gandhi and massacre of innocent Sikhs in Delhi and other India cities was also associated with this movement.
Francesca Gottschalk - How can education support child empowerment.pptxEduSkills OECD
Francesca Gottschalk from the OECD’s Centre for Educational Research and Innovation presents at the Ask an Expert Webinar: How can education support child empowerment?
The Roman Empire A Historical Colossus.pdfkaushalkr1407
The Roman Empire, a vast and enduring power, stands as one of history's most remarkable civilizations, leaving an indelible imprint on the world. It emerged from the Roman Republic, transitioning into an imperial powerhouse under the leadership of Augustus Caesar in 27 BCE. This transformation marked the beginning of an era defined by unprecedented territorial expansion, architectural marvels, and profound cultural influence.
The empire's roots lie in the city of Rome, founded, according to legend, by Romulus in 753 BCE. Over centuries, Rome evolved from a small settlement to a formidable republic, characterized by a complex political system with elected officials and checks on power. However, internal strife, class conflicts, and military ambitions paved the way for the end of the Republic. Julius Caesar’s dictatorship and subsequent assassination in 44 BCE created a power vacuum, leading to a civil war. Octavian, later Augustus, emerged victorious, heralding the Roman Empire’s birth.
Under Augustus, the empire experienced the Pax Romana, a 200-year period of relative peace and stability. Augustus reformed the military, established efficient administrative systems, and initiated grand construction projects. The empire's borders expanded, encompassing territories from Britain to Egypt and from Spain to the Euphrates. Roman legions, renowned for their discipline and engineering prowess, secured and maintained these vast territories, building roads, fortifications, and cities that facilitated control and integration.
The Roman Empire’s society was hierarchical, with a rigid class system. At the top were the patricians, wealthy elites who held significant political power. Below them were the plebeians, free citizens with limited political influence, and the vast numbers of slaves who formed the backbone of the economy. The family unit was central, governed by the paterfamilias, the male head who held absolute authority.
Culturally, the Romans were eclectic, absorbing and adapting elements from the civilizations they encountered, particularly the Greeks. Roman art, literature, and philosophy reflected this synthesis, creating a rich cultural tapestry. Latin, the Roman language, became the lingua franca of the Western world, influencing numerous modern languages.
Roman architecture and engineering achievements were monumental. They perfected the arch, vault, and dome, constructing enduring structures like the Colosseum, Pantheon, and aqueducts. These engineering marvels not only showcased Roman ingenuity but also served practical purposes, from public entertainment to water supply.
Unit 8 - Information and Communication Technology (Paper I).pdfThiyagu K
This slides describes the basic concepts of ICT, basics of Email, Emerging Technology and Digital Initiatives in Education. This presentations aligns with the UGC Paper I syllabus.
A Strategic Approach: GenAI in EducationPeter Windle
Artificial Intelligence (AI) technologies such as Generative AI, Image Generators and Large Language Models have had a dramatic impact on teaching, learning and assessment over the past 18 months. The most immediate threat AI posed was to Academic Integrity with Higher Education Institutes (HEIs) focusing their efforts on combating the use of GenAI in assessment. Guidelines were developed for staff and students, policies put in place too. Innovative educators have forged paths in the use of Generative AI for teaching, learning and assessments leading to pockets of transformation springing up across HEIs, often with little or no top-down guidance, support or direction.
This Gasta posits a strategic approach to integrating AI into HEIs to prepare staff, students and the curriculum for an evolving world and workplace. We will highlight the advantages of working with these technologies beyond the realm of teaching, learning and assessment by considering prompt engineering skills, industry impact, curriculum changes, and the need for staff upskilling. In contrast, not engaging strategically with Generative AI poses risks, including falling behind peers, missed opportunities and failing to ensure our graduates remain employable. The rapid evolution of AI technologies necessitates a proactive and strategic approach if we are to remain relevant.
Synthetic Fiber Construction in lab .pptxPavel ( NSTU)
Synthetic fiber production is a fascinating and complex field that blends chemistry, engineering, and environmental science. By understanding these aspects, students can gain a comprehensive view of synthetic fiber production, its impact on society and the environment, and the potential for future innovations. Synthetic fibers play a crucial role in modern society, impacting various aspects of daily life, industry, and the environment. ynthetic fibers are integral to modern life, offering a range of benefits from cost-effectiveness and versatility to innovative applications and performance characteristics. While they pose environmental challenges, ongoing research and development aim to create more sustainable and eco-friendly alternatives. Understanding the importance of synthetic fibers helps in appreciating their role in the economy, industry, and daily life, while also emphasizing the need for sustainable practices and innovation.
June 3, 2024 Anti-Semitism Letter Sent to MIT President Kornbluth and MIT Cor...Levi Shapiro
Letter from the Congress of the United States regarding Anti-Semitism sent June 3rd to MIT President Sally Kornbluth, MIT Corp Chair, Mark Gorenberg
Dear Dr. Kornbluth and Mr. Gorenberg,
The US House of Representatives is deeply concerned by ongoing and pervasive acts of antisemitic
harassment and intimidation at the Massachusetts Institute of Technology (MIT). Failing to act decisively to ensure a safe learning environment for all students would be a grave dereliction of your responsibilities as President of MIT and Chair of the MIT Corporation.
This Congress will not stand idly by and allow an environment hostile to Jewish students to persist. The House believes that your institution is in violation of Title VI of the Civil Rights Act, and the inability or
unwillingness to rectify this violation through action requires accountability.
Postsecondary education is a unique opportunity for students to learn and have their ideas and beliefs challenged. However, universities receiving hundreds of millions of federal funds annually have denied
students that opportunity and have been hijacked to become venues for the promotion of terrorism, antisemitic harassment and intimidation, unlawful encampments, and in some cases, assaults and riots.
The House of Representatives will not countenance the use of federal funds to indoctrinate students into hateful, antisemitic, anti-American supporters of terrorism. Investigations into campus antisemitism by the Committee on Education and the Workforce and the Committee on Ways and Means have been expanded into a Congress-wide probe across all relevant jurisdictions to address this national crisis. The undersigned Committees will conduct oversight into the use of federal funds at MIT and its learning environment under authorities granted to each Committee.
• The Committee on Education and the Workforce has been investigating your institution since December 7, 2023. The Committee has broad jurisdiction over postsecondary education, including its compliance with Title VI of the Civil Rights Act, campus safety concerns over disruptions to the learning environment, and the awarding of federal student aid under the Higher Education Act.
• The Committee on Oversight and Accountability is investigating the sources of funding and other support flowing to groups espousing pro-Hamas propaganda and engaged in antisemitic harassment and intimidation of students. The Committee on Oversight and Accountability is the principal oversight committee of the US House of Representatives and has broad authority to investigate “any matter” at “any time” under House Rule X.
• The Committee on Ways and Means has been investigating several universities since November 15, 2023, when the Committee held a hearing entitled From Ivory Towers to Dark Corners: Investigating the Nexus Between Antisemitism, Tax-Exempt Universities, and Terror Financing. The Committee followed the hearing with letters to those institutions on January 10, 202
Palestine last event orientationfvgnh .pptxRaedMohamed3
An EFL lesson about the current events in Palestine. It is intended to be for intermediate students who wish to increase their listening skills through a short lesson in power point.
Honest Reviews of Tim Han LMA Course Program.pptxtimhan337
Personal development courses are widely available today, with each one promising life-changing outcomes. Tim Han’s Life Mastery Achievers (LMA) Course has drawn a lot of interest. In addition to offering my frank assessment of Success Insider’s LMA Course, this piece examines the course’s effects via a variety of Tim Han LMA course reviews and Success Insider comments.
How to Make a Field invisible in Odoo 17Celine George
It is possible to hide or invisible some fields in odoo. Commonly using “invisible” attribute in the field definition to invisible the fields. This slide will show how to make a field invisible in odoo 17.
2024.06.01 Introducing a competency framework for languag learning materials ...Sandy Millin
http://sandymillin.wordpress.com/iateflwebinar2024
Published classroom materials form the basis of syllabuses, drive teacher professional development, and have a potentially huge influence on learners, teachers and education systems. All teachers also create their own materials, whether a few sentences on a blackboard, a highly-structured fully-realised online course, or anything in between. Despite this, the knowledge and skills needed to create effective language learning materials are rarely part of teacher training, and are mostly learnt by trial and error.
Knowledge and skills frameworks, generally called competency frameworks, for ELT teachers, trainers and managers have existed for a few years now. However, until I created one for my MA dissertation, there wasn’t one drawing together what we need to know and do to be able to effectively produce language learning materials.
This webinar will introduce you to my framework, highlighting the key competencies I identified from my research. It will also show how anybody involved in language teaching (any language, not just English!), teacher training, managing schools or developing language learning materials can benefit from using the framework.
1. Where on Earth Am I?
Satellites improve life
1st
part
Warming-up: How does GPS work?
Activity 1: watch the video at edpuzzle and answer the questions.
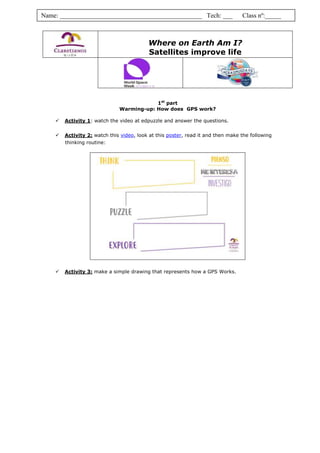
Activity 2: watch this video, look at this poster, read it and then make the following
thinking routine:
Activity 3: make a simple drawing that represents how a GPS Works.
Name: ____________________________________________ Tech: ___ Class nº:_____
2. 2nd part
Lost in No-man’s land
Materials:
Topographical map of Europe, including 4 satellites already positioned.
Compasses (drawing tool)
Pencil
Ruler (at least 20 cm)
Calculator
Activity 4: On the map, write down the capitals of the European countries. If you don’t
remember…look it up!
Activity 5: What is the scale of the map?
Identify on your map the scale (it is a line that contains a number with units above…) and measure
the length of the line.
The scale of map is ______ km real distance are ______
mm in the map.
Activity 6: How far away are the satellites from me?
Hints and steps to calculate how far de satellites are:
In the table below, time is given in milliseconds (1ms=1000s). Don’t forget to transform
data into seconds (3rd column ).
Radio signals are transmitted with the speed of light. Its value is c=3.108
m/s or c=3.105
km/s
To calculate the real distance between the satellites and you we use the formula in
the box. (fill in the 4th column )
Satellite
Signal
travel time
(ms)
Signal travel
time (s)
Satellite distance
from me (km)
Satellite distance
on the map (mm)
Satellite
distance on the
map (cm)
Satellite 1 6,49
Satellite 2 12,68
Satellite 3 4,64
Satellite 4 11,87
You were abducted by aliens and taken on a ride across the solar system. On your return, you were
dropped off somewhere in Europe. You have no idea where you are, but luckily you have your GPS
receiver with you that should guide you to a place from where you can receive help or return home. But
... oh no ... the receiver is broken. Instead of showing your location on Earth, it only displays the signal
travel time of four receiving satellite signals. You will have to do it all by yourself.
Are you ready!!!!???
Distance=speed of light x time d= c x t
3. Activity 7: What is your location?
7.1. Using the map scale, calculate the distance between the satellites and you but in the map. Fill
in the last column in the table above. I give you the calculation to do:
7.2. Transform into cm and fill the last column. You can approximate 1
decimal. Take your compasses and draw and arch from satellite 1.. The
measure of the arch for satellite 1 is the length you have calculated before (7.1)
7.3. Do the same for the others satellites.
Activity 8: Here you are!
8.1. Your position must be somewhere on the area determined by the arcs drawn by the
compasses. Give colour to that area on the map.
8.2. Which are the possible countries of your location? _________________________________
8.3. Estimate the centre of the area between the four arcs, draw a spot or a person
on the map where the centre is and… In which country aliens dropped you off??
________________________
4. ACTIVITIES SCHEDULE
Activity Time invested Time expected I got it? Comments
Explanation, read the
worksheet by yourself.
Edpuzzle, watch the video
again and analyse the poster
and do activities 1, 2 and 3.
Consult bibliography to write
the capitals of the European
countries and identify the scale
(activities 4 and 5)
Make calculations to fill in the
table (activity 6 and 7.1)
Draw the arcs on the map and
point out the area (activities
7.2, 7.3, 8.1)
The country where you are!
(activities 8.2 and 8.3)