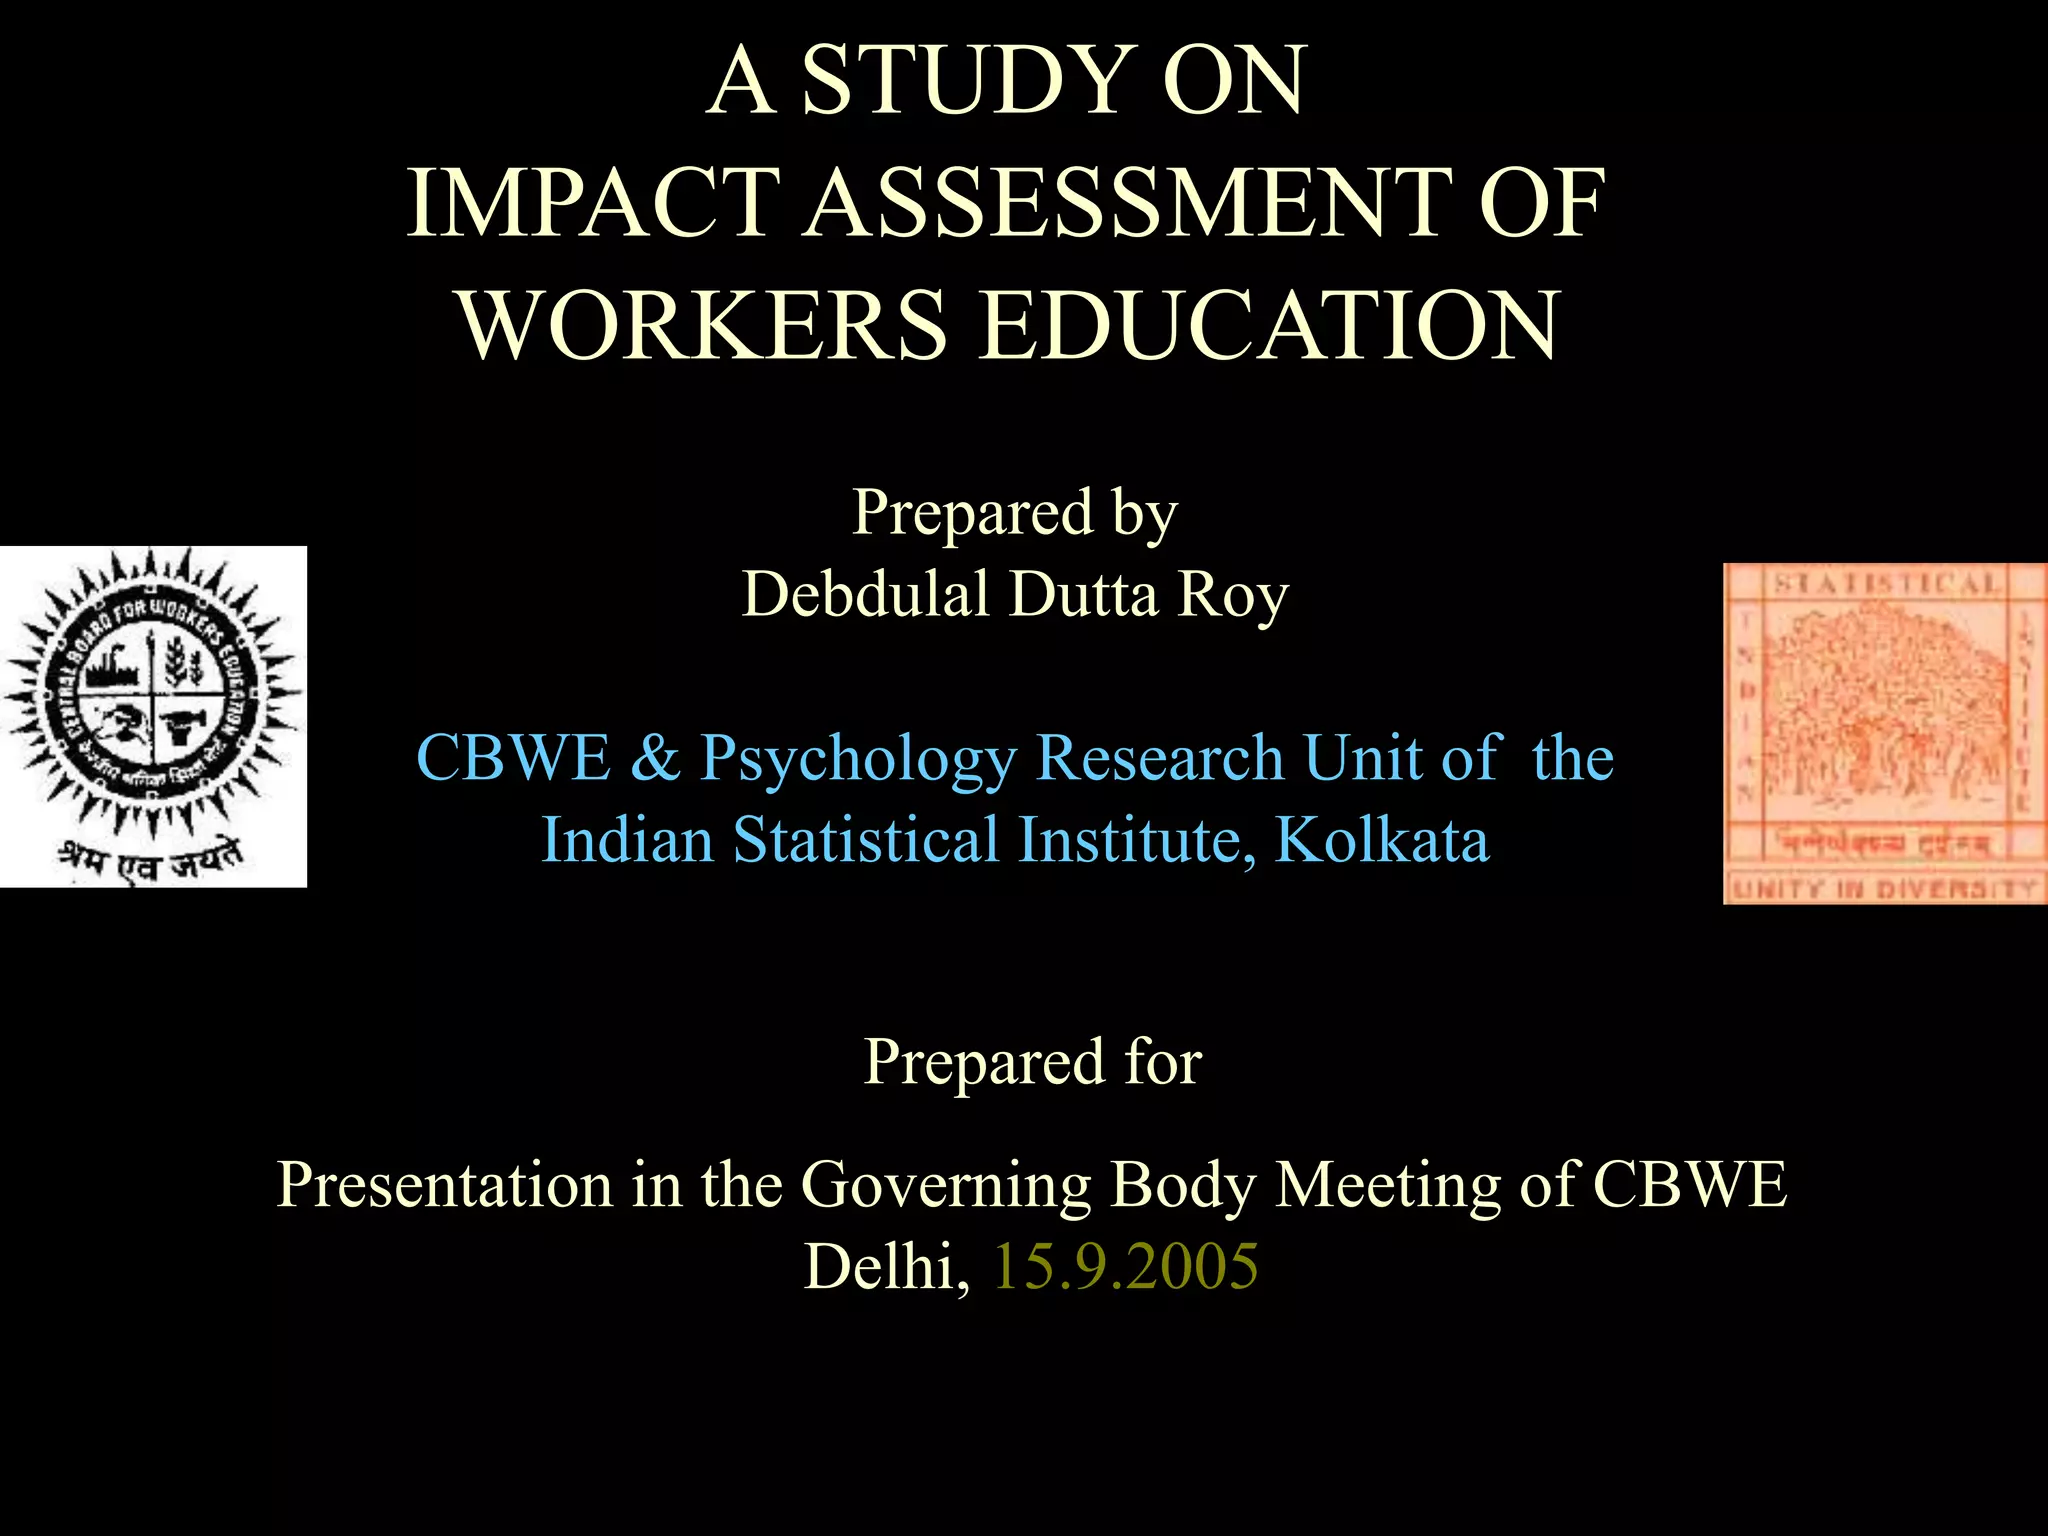
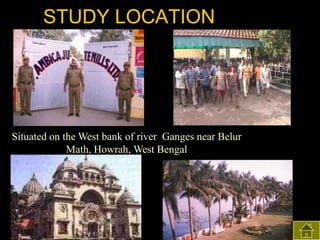
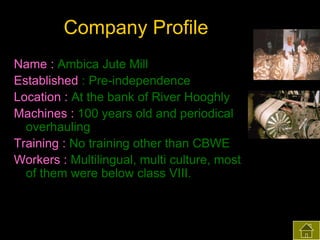
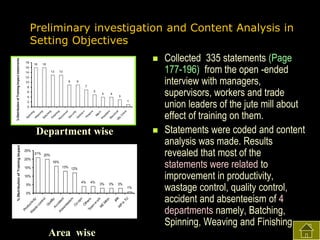
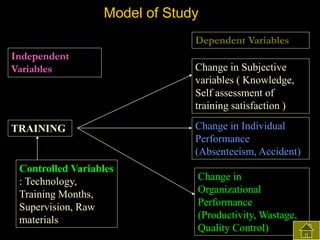
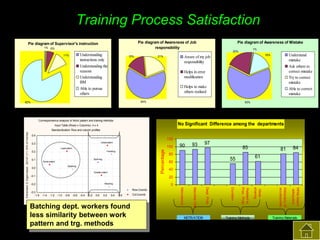
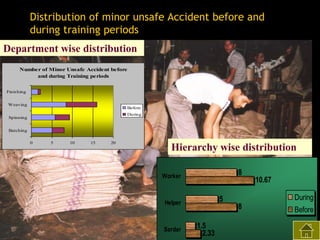
53.33
During
60
62
65
1) The document describes a study conducted to assess the impact of workers' education training provided by the Centre for Budget and Workers Education (CBWE) at Ambica Jute Mill in West Bengal.
2) Both subjective and objective data were collected before and after training to analyze the impact on knowledge, satisfaction, productivity, waste control, quality control, accidents, and absenteeism.
3) The results found significant improvements in trainees' achievement test scores compared to non-trainees. It also found increased productivity, reduced waste and improved quality control in the spinning, weaving and finishing departments after training.
Discipline, Grievance and Industrial Relations.Anubha Rastogi
Grievance is the first requisite that leads to indiscipline. Effective grievance handling is not only crucial to maintain harmony but also employee satisfaction.
Discipline, Grievance and Industrial Relations.Anubha Rastogi
Grievance is the first requisite that leads to indiscipline. Effective grievance handling is not only crucial to maintain harmony but also employee satisfaction.
International Journal of Business and Management Invention (IJBMI)inventionjournals
International Journal of Business and Management Invention (IJBMI) is an international journal intended for professionals and researchers in all fields of Business and Management. IJBMI publishes research articles and reviews within the whole field Business and Management, new teaching methods, assessment, validation and the impact of new technologies and it will continue to provide information on the latest trends and developments in this ever-expanding subject. The publications of papers are selected through double peer reviewed to ensure originality, relevance, and readability. The articles published in our journal can be accessed online.
International Journal of Business and Management Invention (IJBMI)inventionjournals
International Journal of Business and Management Invention (IJBMI) is an international journal intended for professionals and researchers in all fields of Business and Management. IJBMI publishes research articles and reviews within the whole field Business and Management, new teaching methods, assessment, validation and the impact of new technologies and it will continue to provide information on the latest trends and developments in this ever-expanding subject. The publications of papers are selected through double peer reviewed to ensure originality, relevance, and readability. The articles published in our journal can be accessed online
ORIENTATION TRAINING WORKSHOP ON RABINDRIK PSYCHOTHERAPY Debdulal Dutta RoyPsychology Research Unit, Indian Statistical Institute, 203, B. T. Road, West Bengal, Kolkata, India – 700108E-mail: dduttaroy@gmail.comInternational Psychology Conference Dubai to be held on 21st & 22nd Oct 2016.
Orientation workshop on Rabindrik PsychotherapyD Dutta Roy
Rabindrik Psychotherapy is paradigm shift in Psychotherapy. This will give you how Rabindrik psychotherapy acts on consciousness, develop flow and control system in order to feel positive
Explore our most comprehensive guide on lookback analysis at SafePaaS, covering access governance and how it can transform modern ERP audits. Browse now!
Cracking the Workplace Discipline Code Main.pptxWorkforce Group
Cultivating and maintaining discipline within teams is a critical differentiator for successful organisations.
Forward-thinking leaders and business managers understand the impact that discipline has on organisational success. A disciplined workforce operates with clarity, focus, and a shared understanding of expectations, ultimately driving better results, optimising productivity, and facilitating seamless collaboration.
Although discipline is not a one-size-fits-all approach, it can help create a work environment that encourages personal growth and accountability rather than solely relying on punitive measures.
In this deck, you will learn the significance of workplace discipline for organisational success. You’ll also learn
• Four (4) workplace discipline methods you should consider
• The best and most practical approach to implementing workplace discipline.
• Three (3) key tips to maintain a disciplined workplace.
Premium MEAN Stack Development Solutions for Modern BusinessesSynapseIndia
Stay ahead of the curve with our premium MEAN Stack Development Solutions. Our expert developers utilize MongoDB, Express.js, AngularJS, and Node.js to create modern and responsive web applications. Trust us for cutting-edge solutions that drive your business growth and success.
Know more: https://www.synapseindia.com/technology/mean-stack-development-company.html
The world of search engine optimization (SEO) is buzzing with discussions after Google confirmed that around 2,500 leaked internal documents related to its Search feature are indeed authentic. The revelation has sparked significant concerns within the SEO community. The leaked documents were initially reported by SEO experts Rand Fishkin and Mike King, igniting widespread analysis and discourse. For More Info:- https://news.arihantwebtech.com/search-disrupted-googles-leaked-documents-rock-the-seo-world/
[Note: This is a partial preview. To download this presentation, visit:
https://www.oeconsulting.com.sg/training-presentations]
Sustainability has become an increasingly critical topic as the world recognizes the need to protect our planet and its resources for future generations. Sustainability means meeting our current needs without compromising the ability of future generations to meet theirs. It involves long-term planning and consideration of the consequences of our actions. The goal is to create strategies that ensure the long-term viability of People, Planet, and Profit.
Leading companies such as Nike, Toyota, and Siemens are prioritizing sustainable innovation in their business models, setting an example for others to follow. In this Sustainability training presentation, you will learn key concepts, principles, and practices of sustainability applicable across industries. This training aims to create awareness and educate employees, senior executives, consultants, and other key stakeholders, including investors, policymakers, and supply chain partners, on the importance and implementation of sustainability.
LEARNING OBJECTIVES
1. Develop a comprehensive understanding of the fundamental principles and concepts that form the foundation of sustainability within corporate environments.
2. Explore the sustainability implementation model, focusing on effective measures and reporting strategies to track and communicate sustainability efforts.
3. Identify and define best practices and critical success factors essential for achieving sustainability goals within organizations.
CONTENTS
1. Introduction and Key Concepts of Sustainability
2. Principles and Practices of Sustainability
3. Measures and Reporting in Sustainability
4. Sustainability Implementation & Best Practices
To download the complete presentation, visit: https://www.oeconsulting.com.sg/training-presentations
RMD24 | Debunking the non-endemic revenue myth Marvin Vacquier Droop | First ...BBPMedia1
Marvin neemt je in deze presentatie mee in de voordelen van non-endemic advertising op retail media netwerken. Hij brengt ook de uitdagingen in beeld die de markt op dit moment heeft op het gebied van retail media voor niet-leveranciers.
Retail media wordt gezien als het nieuwe advertising-medium en ook mediabureaus richten massaal retail media-afdelingen op. Merken die niet in de betreffende winkel liggen staan ook nog niet in de rij om op de retail media netwerken te adverteren. Marvin belicht de uitdagingen die er zijn om echt aansluiting te vinden op die markt van non-endemic advertising.
RMD24 | Retail media: hoe zet je dit in als je geen AH of Unilever bent? Heid...BBPMedia1
Grote partijen zijn al een tijdje onderweg met retail media. Ondertussen worden in dit domein ook de kansen zichtbaar voor andere spelers in de markt. Maar met die kansen ontstaan ook vragen: Zelf retail media worden of erop adverteren? In welke fase van de funnel past het en hoe integreer je het in een mediaplan? Wat is nu precies het verschil met marketplaces en Programmatic ads? In dit half uur beslechten we de dilemma's en krijg je antwoorden op wanneer het voor jou tijd is om de volgende stap te zetten.
India Orthopedic Devices Market: Unlocking Growth Secrets, Trends and Develop...Kumar Satyam
According to TechSci Research report, “India Orthopedic Devices Market -Industry Size, Share, Trends, Competition Forecast & Opportunities, 2030”, the India Orthopedic Devices Market stood at USD 1,280.54 Million in 2024 and is anticipated to grow with a CAGR of 7.84% in the forecast period, 2026-2030F. The India Orthopedic Devices Market is being driven by several factors. The most prominent ones include an increase in the elderly population, who are more prone to orthopedic conditions such as osteoporosis and arthritis. Moreover, the rise in sports injuries and road accidents are also contributing to the demand for orthopedic devices. Advances in technology and the introduction of innovative implants and prosthetics have further propelled the market growth. Additionally, government initiatives aimed at improving healthcare infrastructure and the increasing prevalence of lifestyle diseases have led to an upward trend in orthopedic surgeries, thereby fueling the market demand for these devices.
What is the TDS Return Filing Due Date for FY 2024-25.pdfseoforlegalpillers
It is crucial for the taxpayers to understand about the TDS Return Filing Due Date, so that they can fulfill your TDS obligations efficiently. Taxpayers can avoid penalties by sticking to the deadlines and by accurate filing of TDS. Timely filing of TDS will make sure about the availability of tax credits. You can also seek the professional guidance of experts like Legal Pillers for timely filing of the TDS Return.
Affordable Stationery Printing Services in Jaipur | Navpack n PrintNavpack & Print
Looking for professional printing services in Jaipur? Navpack n Print offers high-quality and affordable stationery printing for all your business needs. Stand out with custom stationery designs and fast turnaround times. Contact us today for a quote!
Personal Brand Statement:
As an Army veteran dedicated to lifelong learning, I bring a disciplined, strategic mindset to my pursuits. I am constantly expanding my knowledge to innovate and lead effectively. My journey is driven by a commitment to excellence, and to make a meaningful impact in the world.
Business Valuation Principles for EntrepreneursBen Wann
This insightful presentation is designed to equip entrepreneurs with the essential knowledge and tools needed to accurately value their businesses. Understanding business valuation is crucial for making informed decisions, whether you're seeking investment, planning to sell, or simply want to gauge your company's worth.
Remote sensing and monitoring are changing the mining industry for the better. These are providing innovative solutions to long-standing challenges. Those related to exploration, extraction, and overall environmental management by mining technology companies Odisha. These technologies make use of satellite imaging, aerial photography and sensors to collect data that might be inaccessible or from hazardous locations. With the use of this technology, mining operations are becoming increasingly efficient. Let us gain more insight into the key aspects associated with remote sensing and monitoring when it comes to mining.
"𝑩𝑬𝑮𝑼𝑵 𝑾𝑰𝑻𝑯 𝑻𝑱 𝑰𝑺 𝑯𝑨𝑳𝑭 𝑫𝑶𝑵𝑬"
𝐓𝐉 𝐂𝐨𝐦𝐬 (𝐓𝐉 𝐂𝐨𝐦𝐦𝐮𝐧𝐢𝐜𝐚𝐭𝐢𝐨𝐧𝐬) is a professional event agency that includes experts in the event-organizing market in Vietnam, Korea, and ASEAN countries. We provide unlimited types of events from Music concerts, Fan meetings, and Culture festivals to Corporate events, Internal company events, Golf tournaments, MICE events, and Exhibitions.
𝐓𝐉 𝐂𝐨𝐦𝐬 provides unlimited package services including such as Event organizing, Event planning, Event production, Manpower, PR marketing, Design 2D/3D, VIP protocols, Interpreter agency, etc.
Sports events - Golf competitions/billiards competitions/company sports events: dynamic and challenging
⭐ 𝐅𝐞𝐚𝐭𝐮𝐫𝐞𝐝 𝐩𝐫𝐨𝐣𝐞𝐜𝐭𝐬:
➢ 2024 BAEKHYUN [Lonsdaleite] IN HO CHI MINH
➢ SUPER JUNIOR-L.S.S. THE SHOW : Th3ee Guys in HO CHI MINH
➢FreenBecky 1st Fan Meeting in Vietnam
➢CHILDREN ART EXHIBITION 2024: BEYOND BARRIERS
➢ WOW K-Music Festival 2023
➢ Winner [CROSS] Tour in HCM
➢ Super Show 9 in HCM with Super Junior
➢ HCMC - Gyeongsangbuk-do Culture and Tourism Festival
➢ Korean Vietnam Partnership - Fair with LG
➢ Korean President visits Samsung Electronics R&D Center
➢ Vietnam Food Expo with Lotte Wellfood
"𝐄𝐯𝐞𝐫𝐲 𝐞𝐯𝐞𝐧𝐭 𝐢𝐬 𝐚 𝐬𝐭𝐨𝐫𝐲, 𝐚 𝐬𝐩𝐞𝐜𝐢𝐚𝐥 𝐣𝐨𝐮𝐫𝐧𝐞𝐲. 𝐖𝐞 𝐚𝐥𝐰𝐚𝐲𝐬 𝐛𝐞𝐥𝐢𝐞𝐯𝐞 𝐭𝐡𝐚𝐭 𝐬𝐡𝐨𝐫𝐭𝐥𝐲 𝐲𝐨𝐮 𝐰𝐢𝐥𝐥 𝐛𝐞 𝐚 𝐩𝐚𝐫𝐭 𝐨𝐟 𝐨𝐮𝐫 𝐬𝐭𝐨𝐫𝐢𝐞𝐬."
What are the main advantages of using HR recruiter services.pdfHumanResourceDimensi1
HR recruiter services offer top talents to companies according to their specific needs. They handle all recruitment tasks from job posting to onboarding and help companies concentrate on their business growth. With their expertise and years of experience, they streamline the hiring process and save time and resources for the company.
What are the main advantages of using HR recruiter services.pdf
Workers Education
1. A STUDY ON
IMPACT ASSESSMENT OF
WORKERS EDUCATION
Prepared by
Debdulal Dutta Roy
CBWE & Psychology Research Unit of the
Indian Statistical Institute, Kolkata
Prepared for
Presentation in the Governing Body Meeting of CBWE
Delhi, 15.9.2005
2. OVERVIEW
What is Workers Education? , Perspectives of Impact Assessment
SETTING OBJECTIVES : Company Profile, Interviewing President,
Management, Workers ,Trade union leaders, Trainers, Studying course
contents, training manual, observing training program. Content
analysis, Departments under study
OBJECTIVES
Model of the study
Subjective Data collection : instrument development, Studying the
constraints and collection of data, Sampling criteria and Characteristics
of Samples
DATA ANALYSIS
Results of Subjective data : Achievement test and training process
satisfaction
Objective Data collection :Constraints, Study periods
RESULTS : Productivity- 1, 2, 3 , Wastage - 1, 2, 3, 4 Quality control 1, 2 Accident - 1, 2 and Absenteeism - 1, 2
CONCLUSION & FUTURE RESEARCH
THANK YOU
3. What is Workers Education ?
Workers Education is humanized training process to
change in knowledge and skills required for on and off the
job life.
So it makes a balance between on and off the job life in
designing training inputs.
It assumes that worker is a total man with complex
adaptive open system. They have own reasoning for self
direction and self control.
Workers education affects the reasoning level so that
workers feel inner urge to learn new knowledge and skills.
4. PERSPECTIVES OF IMPACT ASSESSMENT
Workers Perspective
Acquiring knowledge about working operations, self control
(faulty habits).
Satisfaction with training process
Job Satisfaction or Employee Satisfaction
Organizational Perspective
Improvement in productivity
Reduction of wastage
Improving quality
Reduction of accidents
Reduction of absenteeism
Change in Return of Investment
Change in Organizational Climate or Organizational health
6. Company Profile
Name : Ambica Jute Mill
Established : Pre-independence
Location : At the bank of River Hooghly
Machines : 100 years old and periodical
overhauling
Training : No training other than CBWE
Workers : Multilingual, multi culture, most
of them were below class VIII.
7. ASSESSING PERCEPTION OF
PRESIDENT ABOUT TRAINING IMPACT
Collecting data from
the President about
underlying motives
for training, his own
observation about
training course,
training methods
and its impact on
the mill workers and
mill performance.
8. ASSESSING PERCEPTION OF MANAGERS,
& SUPERVISORS, WORKERS AND TRADE
UNION LEADERS ABOUT TRAINING IMPACT
MANAGERS AND
SUPERVISORS
WORKERS
INTUC LEADER
CITU LEADER
11. OBSERVING TRAINING
PROGRAMME
USED DIFFERENT TRAINING AIDS LIKE LECTURE,ROLE PLAY,
GROUP DISCUSSION, EXHIBITS, QUESTION ANSWER SESSION,
EXERCISES, AUDIO-VISUAL AIDS, DEMONSTRATION
13. 18
16
16
16
13
14
13
12
9
10
9
7
8
5
6
4
4
3
4
1
2
M
ec
h.
Pr
es
id
en
t
El
ec
tri
ca
Q
l
lty
Cn
tro
l
0
Sp
in
ni
ng
W
ea
vi
ng
Ba
tc
hi
ng
Fi
ni
sh
in
g
Pe
rs
on
ne
l
Se
cu
rit
y
G
od
ow
n
Fi
na
nc
e
% Distribution of Training Impact statements
Preliminary investigation and Content Analysis in
Setting Objectives
% Distribution of Training Im pact
Pr
od
uc
W
tiv
as
ity
te
co
nt
ro
l
Qu
ali
ty
Ac
c id
Ab
en
se
t
nt
ee
is m
Co
-o
pn
Ot
he
Te
r
am s
w
or
MC k
Mn
tn
Department wise
25%
20%
15%
21% 20%
16%
13% 12%
10%
5%
4%
4%
3%
3%
3%
1%
Area wise
W
P
in
TU
IPR
0%
Collected 335 statements (Page
177-196) from the open -ended
interview with managers,
supervisors, workers and trade
union leaders of the jute mill about
effect of training on them.
Statements were coded and content
analysis was made. Results
revealed that most of the
statements were related to
improvement in productivity,
wastage control, quality control,
accident and absenteeism of 4
departments namely, Batching,
Spinning, Weaving and Finishing.
15. OBJECTIVES
To determine extent of difference in knowledge
(achievement) about course contents between the
trained and non-trained employees of the mill
To determine extent of Training process
Satisfaction of trainees
To determine extent of difference in Productivity,
Waste control, Quality control, Rate of accidents
and Absenteeism between before and during
training periods
16. Model of Study
Dependent Variables
Independent
Variables
TRAINING
Controlled Variables
: Technology,
Training Months,
Supervision, Raw
materials
Change in Subjective
variables ( Knowledge,
Self assessment of
training satisfaction )
Change in Individual
Performance
(Absenteeism, Accident)
Change in
Organizational
Performance
(Productivity, Wastage,
Quality Control)
17. SUBJECTIVE DATA COLLECTION
CONSTRAINTS
Non- availability of all
the workers at a time
at one location as they
are scattered around
different locations and
due to shifting duties
Giving assurance that
production process will
not be disturbed during
evaluation.
COLLECTION OF DATA
Therefore, one specific day was
selected and data were collected
randomly from different
categories of workers in their
respective departments without
any prior intimation to the
interviewees. In sampling, each
machine of the respective
departments was initially listed
and machines were randomly
selected out of the list. Samples
were selected based on the
operators of randomly selected
machines.
18. Sample Criteria and Characteristics
Criteria
Training received before 1 month
Able to read the questionnaires
Due to his absence, there will be no disturbance in
production process
Sample must belong to the respective department more than
5 years
Sample Characteristics
More than 10 years experience in same department
Middle aged
Income above Rs.3000
Educational level in average ranged from grade V to VIII
Common languages were Hindi and Bengali
Most of them married
Most of them possessed 1 or 2 children
Most of them came from West Bengal and Bihar and
Most of them trained before 1 month.
19. Tools : Psychometric Test Properties
Achievement Test
No. of Items: 4 items (2 on
awareness and 2 on application)
X 5 issues (Productivity, Waste
control, Quality control,
Absenteeism, Safety)
Item Categories : 7 common and
13 department wise questions
Type : Multiple Choice. 4 Options.
Range of scores : 0 to 20
Content validity : Item-total
correlation was significant across
departments (Table 5.7)
Reliability range : 0.75 to 0.93
(Table 5.8)
Training Process
Satisfaction
Variables : Awareness,
Motivation and Attitude
towards training
Type : Multiple choice to
assess awareness and
motivation variables. 4
point interval scale to
assess attitude variables.
20. Statistics Used for Analysis
Pearson Product Moment Correlation
t-test
Chi-square test
Correspondence Analysis
Wilcoxon Matched Paired Signed Rank test
Item discrimination
Item total correlation
Kuder Richardson Coefficient
21. Trainee and Non-trainee difference in Achievement Test
Trainee and Non-trainee difference in
dimension wise Achievement test
Department wise Achievement score
distribution
Trainees
8
Non-trainees
20
Critical
ratio
15
Mean
6
10
5
4
2
0
Batching
Batching
Spinning
Weaving
4.37
2.73
6.14
Waste control
2.17
3.32
4.79
3.9
2.18
6.98
Absenteeism
2.89
3.12
4.88
Safety
Weaving
Sp inning
Productivity
0
6.57
2.04
3.92
Quality Control
C o r r e s p o n d e n c e a n a ly s is b e tw e e n lo c a tio n o f d e p a r tme n ts a n d a c h ie v e me n t s c o r e s
Sta n d a r d iz a tio n : R o w a n d c o lu mn p r o file s
D imension 2; Eigenvalue: .07161 (30.49% of Inertia)
1 .0
5-8
0 .8
1-4
0 .6
0 .4
Achievement score was
high in Weaving,
Spinning and finishing
department than
batching
Spinning
Finishing
0 .2
13-16
0 .0
9-12
- 0 .2
- 0 .4
- 0 .8
17-20
Weaving
Batching
R o w .C o o r d s
- 0 .6
- 0 .4
- 0 .2
0 .0
0 .2
0 .4
D ime n s io n 1 ; Eig e n v a lu e : .1 3 8 3 5 ( 5 8 .9 0 % o f In e r tia )
0 .6
0 .8
C o l.C o o r d s
22. Training Process Satisfaction
Pie diagram of Awareness of Job
responsibility
Pie diagram of Supervisor's instruction
1% 6%
Pie diagram of Awareness of Mistake
1%
20%
Understanding
instructions only
Understanding the
reasons
Understanding
BM
Able to pursue
others
11%
15%
Understand
mistake
Ask others to
correct mistake
Try to correct
mistake
Able to correct
mistake
16%
Aware of my job
responsibility
21%
Helps in error
modification
Helps to make
others realized
64%
82%
63%
Correspondence analysis of Work pattern and training methods
No Significant Difference among the departments
Input Table (Rows x Columns): 4 x 4
0.4
120
Great extent
0.3
Percentage
0.1
Spinning
Some extent
Batching
0.0
Greater extent
-0.1
97
85
80
84
61
55
60
81
40
20
Weaving
-0.2
0
-0.8
-0.6
-0.4
-0.2
0.0
0.2
0.4
0.6
Dimension 1; Eigenvalue: .16533 (85.84% of Inertia)
Batching dept. workers found
less similarity between work
pattern and trg. methods
Col.Coords
MOTIVATION
Training Methods
Ideas
sharing
-1.0
Related to
Prac. Prob.
-1.2
Duration
-1.4
Dept. Prob.
Row.Coords
Machine Chk
-0.3
-1.6
93
White board
adequacy
Finishing
0.2
90
Adequacy of
accessories
100
Least extent
Attendance
Dimension 2; Eigenvalue: .02147 (11.15% of Inertia)
Standardization: Row and column profiles
Training Materials
23. OBJECTIVE DATA COLLECTION
CONSTRAINTS
Before and after experimental
design can not be followed as
training is continuous process.
All the months were not in
analysis as production process
depends upon months.
Individual productivity data
were not available.
No use of Medical data as
company wise data records
were not available in the ESI
hospitals.
Individual wise absenteeism
and accident data were not
available.
COLLECTION OF DATA
Before and During
Experimental design
Only selected
months were
considered
Department and
hierarchy wise data
were used for
analysis.
24. Determining the Periods for study
Years
Months
Total
Phase -1
Before
During
2000-02
2003
Aug-Dec Aug-Dec
15 months 5 months
Phase -2
Before
During
2001-03
2004
Jan-Mar Jan-Mar
9 months 3 months
Since company performance is related to month wise variation,
months were kept constant in both before and during training
periods. Wilcoxon’s matched paired signed rank test was
computed to estimate between period difference.
25. Products for Assessing Productivity
Productivity was measured in terms of
Production efficiency of 4 finished products.
Fine Yarn
Course Yarn
Hessian Cloth
Sacking Cloth
26. Productivity of Spinning Dept
FINE YARN
Fine yarn (P-2)
Fine Yarn (P-1)
82
80
78
78
76
Before
Percentage
Percentage
80
76
Before
74
During
During
74
72
72
70
Before
During
70
Aug
73.667
77
Sep
Oct
74.333
75.333
80
80
Nov
75.667
81
Jan
Feb
Mar
Before
73.66
73.66
74
During
80
80
80
Dec
75.667
79
COARSE YARN
Coarse Yarn (P-2)
Coarse Yarn (P-1)
82
84
Percentage
78
Before
During
Percentage
82
80
80
78
76
Before
74
During
72
76
70
74
Aug
Sep
Oct
Nov
Dec
Before
77.3
76.7
77
76.7
77
During
80
81
80
81
82
Jan
Feb
Mar
Before
75
76
78.6
During
81
83
82
27. Productivity of Weaving Dept
HESSIAN
Hessian Cloth (P-1)
Hessian Cloth (P-2)
80
60
50
40
Before
During
Percentage
Percentage
60
40
30
Before
20
During
10
20
0
0
Aug
Sep
Oct
Nov
Before
45
47.33
49
48
44
52
54
61
Mar
42.33
42.66
37.33
During
52
Feb
58
59
60
47.67
During
Jan
Before
Dec
SACKING
Sacking (P-1)
Sacking (p-2)
80
60
60
40
Before
20
0
During
Aug
Sep
Oct
Nov
Dec
Before
59.67
57.33
57.67
56.67
55
During
65
65
67
64
68
Percentage
Percentage
80
40
Before
During
20
0
Jan
Feb
Mar
Before
55.66
54
54.66
During
70
71
74
29. Wastage Difference in Batching Department
SLIVER WASTAGE
Sliver ( P-2)
Sliver ( P - 1)
4
4
Percentage
Percentage
3
2
Before
2
Before
During
During
1
0
0
Jan
Feb
Mar
Aug
Sep
Oct
Nov
Dec
Before
3.3333
3.3233
3.1967
Before
2.97
3.04
3.15
3.26
3.1
During
2.39
2.36
2.31
During
3.36
2.5
2.45
2.4
2.37
CADDIES WASTAGE
Caddies ( P-1)
Caddies (P-2)
8
10
4
Before
During
2
0
Aug
Sep
Oct
Nov
6.1
5.88
5.61
5
Before
During
Dec
6.23
Percentage
Percentage
6
5.58
0
Before
During
4.2
4.3
4.2
4
3.8
Jan
Feb
Mar
Before
6.3467
5.74
5.9433
During
3.5
3.6
3.4
30. Thread Wastage Difference
SPINNING DEPARTMENT
(P-1)
P-2
0.8
0.6
0.5
0.4
Before
During
0.2
Percentage
Percentage
0.6
0.4
0.3
Before
0.2
During
0.1
0
Aug
Sep
Oct
Nov
0.56
0.56
0.53
0.63
0.6
During
0.41
0.39
0.39
0.38
Jan
Feb
0.55
0.52
0.5
0.37
0.38
0.35
Dec
Before
Before
During
0
Mar
0.35
WEAVING DEPARTMENT
P-1
P-2
4
4
2
Before
During
1
Percentage
Percentage
3
3
2
Before
0
0
Aug
Sep
Oct
Nov
Dec
Before
2.74
2.7
2.78
2.87
3.06
During
3
2.75
2.62
2.6
2.48
During
1
Jan
Feb
Mar
Before
3.15
3.29
3.09
During
2.5
2.43
2.45
31. Wastage in Finishing Department
THREAD WASTAGE
( P - 1)
(P-2)
0.2
0.15
0.1
Before
During
Percentage
Percentage
0.15
0.1
Bef ore
0.05
During
0.05
0
0
Aug
Sep
Oct
Nov
Before
0.15
0.16
0.18
0.12
0.1
0.09
0.09
0.08
0.1
Feb
Mar
0.15
0.13
0.15
During
0.13
During
Jan
Bef ore
Dec
0.09
0.07
0.08
GUNNY CUTTING WASTAGE
Phase - 2
Phase - 1
0.6
0.4
Before
During
0.2
0
Percentage
0.8
0.6
Percentage
0.8
0.4
Before
During
0.2
0
Aug
Sep
Oct
Nov
Dec
Before
0.62
0.74
0.74
0.63
0.69
Before
During
0.56
0.52
0.48
0.46
0.45
During
Jan
Feb
Mar
0.7
0.7
0.66
0.48
0.48
0.46
32. Quality Control Parameters
Batching (3 nos.)
•CV% of Morah Weight
•CV% of Sliver Weight ,F.C
•CV% of Sliver Weight ,F.D
Weaving (2 nos.)
•No. of Ends observed
•Heavy light %
Spinning (6 nos.)
•CV% of Weight of F.Yarn
•CV% of Strength of F.Yarn
•CV% of count of C. Yarn
•CV% of count of S. Yarn
•Quality ratio of W.Yarn
•Quality ratio of W.Yarn of Fine Side
from standard
Finishing (2 nos.)
•Fabric fault %
•Weight of Sacking
33. Change in Quality Control Data
No. of Ends Observed (Weaving Dept)
Decrease in CV% of weight of Yarn
Quality for fine side (Spinning Dept)
4
After
Jan Feb Mar Aug Sep Oct Nov Dec
Ja
n
Dec
Nov
Oct
Before
After
M
ar
Au
g
Se
p
O
ct
N
ov
D
ec
Before
5
4
3
2
1
0
b
6
% of fabric fault
CV %
8
0
Sep
% of Fabric faults of Hessian and
Sacking (Finishing Dept.)
10
2
Aug
Jan Feb Mar Aug Sep Oct Nov Dec
Mar
Jan
After
Before
After
Standard
Feb
Before
475
474
473
472
471
470
469
468
Fe
16
14
12
10
8
6
4
2
0
CV %
CV %
Decrease in CV% of Morah weight
(Batching Dept)
34. Accident Pattern Analysis
Accident due to human error
was used for analysis - unsafe
act.
Only minor injury due to unsafe
act was taken into
consideration.
Difference in incidence of
accident across the years
before and during training
period was assessed.
Department and hierarchy
wise difference was studied.
35. Distribution of minor unsafe Accident before and
during training periods
Department wise distribution
Number of Minor Unsafe Accident before
and during Training periods
Finishing
Weaving
Before
During
Spinning
Batching
0
5
10
15
20
Hierarchy wise distribution
8
Worker
10.67
Sardar
During
5
Helper
8
1.5
2.33
Before
36. Analysis of Absenteeism Pattern
The database is supposed to have 420 data
(4 years ((2000-03) X 8 months X 4
departments X 3 hierarchies) + (1 year
(2004) X 3 months X 4 departments X 3
hierarchies)). Expected data set will be
140 data for each category of employees
for the purpose of comparison of
absenteeism rate between before and during
training periods. But the actual data set
includes 57 data of Sardars, 50 data of
helpers and 140 data of workers.
Therefore, current analysis was limited to
change in absenteeism pattern of workers
only
37. Pattern of Absences of Workers
Percentage of Absences
(Weaving Dept)
8
6
5
4
3
2
1
0
Before
After
%
6
Before
After
4
2
O
ct
N
ov
D
ec
p
Se
g
O
ct
N
ov
D
ec
p
Se
g
Au
M
ar
Fe
b
Before
After
n
O
ct
N
ov
D
ec
p
Se
g
Au
M
ar
b
Fe
n
0
%
Before
After
Ja
%
6
5
4
3
2
1
0
Ja
8
2
Au
Percentage of Absences
(Finishing Dept)
Percentage of Absences
(Spinning Dept)
4
M
ar
b
Fe
n
Ja
O
ct
N
ov
D
ec
g
p
Se
Au
M
ar
b
Ja
n
0
Fe
%
Percentage of Absences (Batching
Dept)
38. Conclusion
1.
Results revealed significant impact of
Workers Education program conducted by
CBWE at Ambica Jute Mill, Howrah on both
subjective and objective criteria of
Organizational Effectiveness.
39. Future Research
1.
2.
3.
4.
5.
Comparison between trainees and non trainees
in their individual productivity level, level of
absenteeism and of the accident.
Impact of workers education on the Quality of
working life ( Job satisfaction, Health and Off-the
job life) of workers.
Impact of workers education on the
organizational climate or interpersonal trust
among the employees;
Impact of workers education on the Return of
investment;
Current model may be used in other Industries
and diverse sectors like Education , health,
service, etc.