Two Categories –Various Techniques
Control Systems
Field Instrumentation
3.
Control Systems
WiredEthernet has become the default standard
for interconnecting controllers.
Wiring systems are already in place where
hardware is located.
Firewall protection for connections outside of
wired LAN thoroughly understood.
Currently not much interest in wireless
backbone systems using the 802.11 a,b,c…n
Ethernet standard.
4.
Field Instrumentation
Steadilygrowing interest in wireless field
instrumentation.
Many industrial installation applications.
Recommended for data acquisition only.
5.
Field Wireless Advantages
Physical installation can be easier.
Physical installation can be less expensive due to
wiring, conduit and cable tray associated cost.
Low instrumentation density applications such
as tank farm monitoring can have significant
savings.
6.
Disadvantages
Battery life,although greatly improved in the last
few years, is under two years under optimal
conditions.
Consistency of communication performance.
Security of data.
Many variations of proprietary systems are not
compatible, although a standard is being / has
been developed.
7.
Wireless Techniques
Analogmeasurement instruments digitize their
measurement to a digital signal of 1’s and 0’s.
The digital signal is converted to a radio signal
using various modulation techniques such as
ASK, FSK, PSK or QAM.
Transmitted via an antenna in an elliptical path
of concentric circles to a receiver’s antenna.
8.
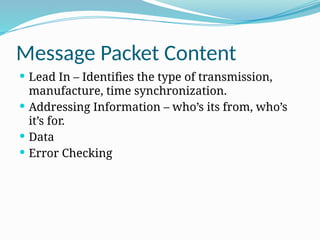
Message Packet Content
Lead In – Identifies the type of transmission,
manufacture, time synchronization.
Addressing Information – who’s its from, who’s
it’s for.
Data
Error Checking
9.
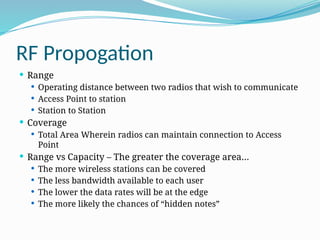
RF Propogation
Range
Operating distance between two radios that wish to communicate
Access Point to station
Station to Station
Coverage
Total Area Wherein radios can maintain connection to Access
Point
Range vs Capacity – The greater the coverage area…
The more wireless stations can be covered
The less bandwidth available to each user
The lower the data rates will be at the edge
The more likely the chances of “hidden notes”
10.
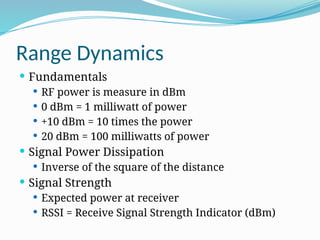
Range Dynamics
Fundamentals
RF power is measure in dBm
0 dBm = 1 milliwatt of power
+10 dBm = 10 times the power
20 dBm = 100 milliwatts of power
Signal Power Dissipation
Inverse of the square of the distance
Signal Strength
Expected power at receiver
RSSI = Receive Signal Strength Indicator (dBm)
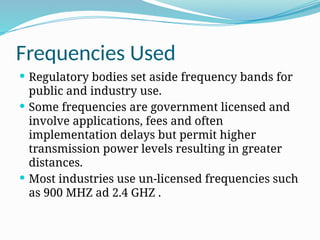
Frequencies Used
Regulatorybodies set aside frequency bands for
public and industry use.
Some frequencies are government licensed and
involve applications, fees and often
implementation delays but permit higher
transmission power levels resulting in greater
distances.
Most industries use un-licensed frequencies such
as 900 MHZ ad 2.4 GHZ .
13.
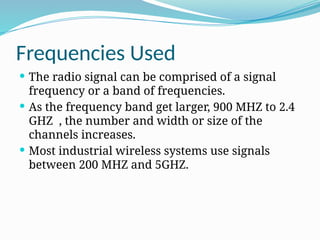
Frequencies Used
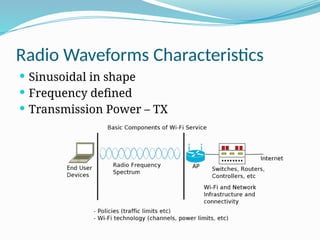
Theradio signal can be comprised of a signal
frequency or a band of frequencies.
As the frequency band get larger, 900 MHZ to 2.4
GHZ , the number and width or size of the
channels increases.
Most industrial wireless systems use signals
between 200 MHZ and 5GHZ.
14.
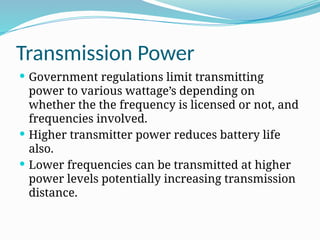
Transmission Power
Governmentregulations limit transmitting
power to various wattage’s depending on
whether the the frequency is licensed or not, and
frequencies involved.
Higher transmitter power reduces battery life
also.
Lower frequencies can be transmitted at higher
power levels potentially increasing transmission
distance.
15.
Frequency Considerations
Higherfrequencies support higher data
throughput but shorter transmission distance.
Lower frequency signals propagate further but
have lower data rates.
Lower frequencies are less effected by
obstructions in the path of the signal.
16.
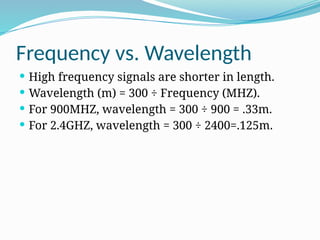
Frequency vs. Wavelength
High frequency signals are shorter in length.
Wavelength (m) = 300 ÷ Frequency (MHZ).
For 900MHZ, wavelength = 300 ÷ 900 = .33m.
For 2.4GHZ, wavelength = 300 ÷ 2400=.125m.
17.
Received Signal Strengthcan be Reduced By
Whether there is a clear line of sight or not.
Signal Diffraction
Signal Reflection
Signal Scattering
18.
Signal Diffraction
Ifsignals encounter a large object, such as
process tanks or buildings between transmitter
and receiver, signals will diffract, spreading out
the energy and reducing intensity at receiver
location.
The bending of the signal helps though if there is
not a clear line of sight.
Lower frequencies bend more, which is a good
thing.
19.
Signal Reflection
Whensignal encounter objects larger then their
wavelength there can be significant reflections.
Lower frequencies attenuate less when bounced
of solid surfaces.
20.
Signal Scattering
Signalthat encounter smaller objects such as
busy piping systems verse large tanks, or leaves
on a tree, can scatter in all different directions
reducing signal intensity at the receiving device.
Lower frequencies scatter less, which is a good
thing.
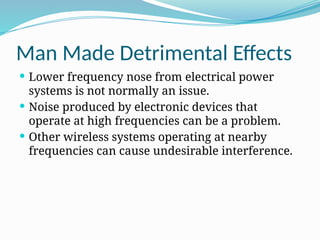
Man Made DetrimentalEffects
Lower frequency nose from electrical power
systems is not normally an issue.
Noise produced by electronic devices that
operate at high frequencies can be a problem.
Other wireless systems operating at nearby
frequencies can cause undesirable interference.
24.
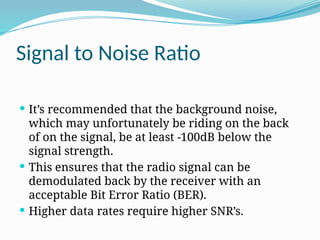
Signal to NoiseRatio
It’s recommended that the background noise,
which may unfortunately be riding on the back
of on the signal, be at least -100dB below the
signal strength.
This ensures that the radio signal can be
demodulated back by the receiver with an
acceptable Bit Error Ratio (BER).
Higher data rates require higher SNR’s.
25.
Receiver Sensitivity
Receivingdevices with greater sensitivity and/or
larger antennas can decode weaker signals at
acceptable BER’s
Receivers are often specified by their ability to
decode weak signals at a particular BER such as -
110 dB @ 1X10-
5 (1 bit error for every 100,000
bits)
26.
Error Detection
CyclicRedundancy Check – CRC is often used for
error detection.
When errors are detected the individual corrupt
packet may just be discarded or the entire
message, depending on technique used.
Automatic Repeat Request (ARM) mechanisms
are the norm.
27.
Packet Size
UnlikeEthernet with a fixed packet size, various
system utilize different sized packets.
The likely hood of corrupted data relates to the
length of the message x transmitted data rate.
Therefore larger packets have a detrimental
effect on one influencing aspect and a positive
effect on another. By reducing transmission time.
28.
Transmission Power
Doublingthe useful transmission distance
requires quadrupling the transmission power.
If the transmitting power is halved the useable
transmission distance will be around 71%.
Transmission power is limited by both
governmental regulations and battery life.
Increasing receiver sensitivity has the same
effect as increasing transmitting power.
29.
Frequency Effects onSignal Strength
Increasing transmission frequency has the same
effect as increasing transmission distance.
If the transmitting frequency doubles the signal
strength at the receiver drops to ¼.
New Distance = Old Distance x (old freq/new
freq)1/2
Higher Frequencies also suffer from multipath
fading more due to phase differences due to
different path lengths.
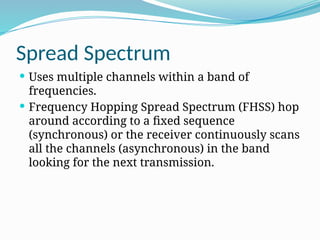
Spread Spectrum
Usesmultiple channels within a band of
frequencies.
Frequency Hopping Spread Spectrum (FHSS) hop
around according to a fixed sequence
(synchronous) or the receiver continuously scans
all the channels (asynchronous) in the band
looking for the next transmission.
32.
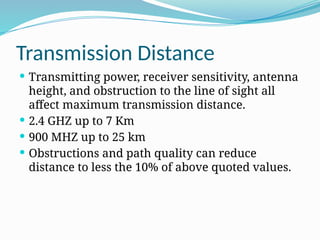
Transmission Distance
Transmittingpower, receiver sensitivity, antenna
height, and obstruction to the line of sight all
affect maximum transmission distance.
2.4 GHZ up to 7 Km
900 MHZ up to 25 km
Obstructions and path quality can reduce
distance to less the 10% of above quoted values.
33.
Mesh Networks
Relyon multiple devices being able to receive a
message not intended for itself then
retransmitting the signal to the intended device.
Permits lower transmitting power levels which
increases battery life.
Networks are highly intelligent and self learning
which increases reliability yet reduces
retransmissions.
34.
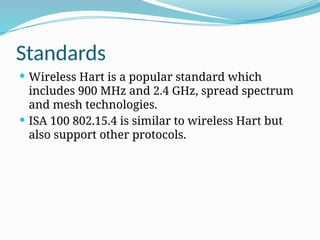
Standards
Wireless Hartis a popular standard which
includes 900 MHz and 2.4 GHz, spread spectrum
and mesh technologies.
ISA 100 802.15.4 is similar to wireless Hart but
also support other protocols.
35.
Security
Wireless systemsare inherently not as safe as
wired systems.
Signals can be jammed by accident or on
purpose. FHSS are much less vulnerable then
fixed frequency systems.
Many modern systems encrypt data and utilize
WPA2 type security (same technique you likely
use on your home wireless network).
36.
Industrial Wifi…
What’sneeded :
Host system: Any system accepting data produced by the
WirelessHART Field Network (WFN). This could be a DCS,
PLC, RTU, Data Historian, asset management software, etc.
Join key A 128 bit security key used to authenticate wireless
field devices when joining the network, including
encryption of the join request. A common Join Key may be
used among all devices on a given network, or each device
may have a unique join key.
Network ID: Each Gateway at a facility or location should be
programmed with a unique Network ID. All authenticated
wireless field devices with the same Network ID will
communicate on the same network and Gateway.
37.
Industrial Wifi
Wirelessadapter Enables an existing 4-20 mA,
HART-enabled field device to become wireless.
Adapters allow the existing 4-20 mA signal to
operate simultaneously with the digital wireless
signal.
Wireless field devices: Field device enabled with
a WirelessHART radio and software or an
existing installed HART-enabled field device with
an attached WirelessHART adapter.