SlideShare a Scribd company logo
1 of 24
Download to read offline
Page 1
WIPAC MONTHLYThe Monthly Update from Water Industry Process Automation & Control
	www.wipac.org.uk												Issue 7/2016 - July 2016
Page 2
In this Issue
	 From the Editor....................................................................................................................	 3
	 Industry News.....................................................................................................................	 4 - 12	
	 Highlights of the news of the month from the global water industry centred around the successes of a few of the
	 companies in the global market.
	 Smart Water Networks to become pervasive..................................................................... 13-14
	 In this month’s opinion article, Joel Hagan of i2O discusses the trend in the exploitation of Smart Water Networks in the
	 potable water side of the industry and the need for the technology to become all pervasive across the industry in order
	 to operate efficiently across the industry as a whole	
	
	 The Great Area Velocity Debate......................................................................................... 15-17	
	 In the UK Water Industry at the current time the use of Area Velocity flow measurement for the regulated measurement
	 of flow is being debated. In this article by Oliver Grievson the theory of area velocity measurement is discussed along with
	 case studies of its accuracy from the field and how the validity of measurement is being demonstrated moving forwards.
	 Smart Water Semantics: Meaningful Interoperability beyond data & syntax..................... 18-19		
	 The subject of semantics within data in the Water Industry is a subject that has been discussed for many years. In this
	 article by Shaun Howell of Cardiff University he discusses the need to bring together the work that has already been done
	 by the international community in the development of semantics and the need to produce a single semantic model so that
	 the Global Water Industry can realise the true benefit of the Smart Water Industry.
	 Industrial IoT identifying the threat of field devices.............................................................. 20-22
	 In this article originally published on Water Online, Michelle Nadboy of Ayyeka discusses the threat that field devices
	 pose to cyber security and what steps can be taken in the Industrial Internet of Things to ensure that potential points of
	 risk that are created can be protected against/			
	
	 Workshops, Conferences & Seminars................................................................................... 23-24	
	 The highlights of the conferences and workshops in the coming months
	
	 WIPAC Monthly is a publication of the Water Industry Process Automation & Control Group. It is produced by the group 		
	 manager and WIPAC Monthly Editor, Oliver Grievson. This is a free publication for the benefit of the Water Industry and please 		
	 feel free to distribute to any who you may feel benefit.
	 All enquires about WIPAC Monthly, including those who want to publish news or articles within these pages, should be directed 	
	 to the publications editor, Oliver Grievson
	 The pictures on the front cover this month is a photo of the OTT Hydrometry’s phosphate monitor, the Cycle P, in place at Lake 		
	 Windermere in the UK
Page 3
From the Editor
					
Each month I have a hope that I can finally have that Eureka moment with the Water Industry when I can say “I think
they have gone and got it,” and each month I force myself to say “we’re close but no cigar,” as yet but as an industry I
am forced to say “we’re getting there.” That is to say we are at least talking about getting there.
But what am I talking about......of course one of my favourite subjects.....the subject of data, its use and its conversion to
useful information. The guidance in the UK Water Industry has been that of moving away from the old ways of working
and building are way out of trouble by constructing bigger and bigger structures in shiny concrete and moving towards
actually being able to operate the structures that we built five, ten or even twenty years ago or the additional package
plant that we added to the process. It is a step change for an industry that has been, until now, incentivised on building
stuff. What of course we are finding is that some of the data that we gathered those five, ten or twenty years ago was
of course fundamentally flawed as there was little quality control. If we’re really lucky the data errors resulted in things
being oversized and inefficient but in the end of the day works. The unlucky minority which were undersized means a
return to the drawing board and an extension of the design. Its amazing what situations bad data can lead to.
So what is different now....why are we changing and how are we changing?
Well firstly, the difficult step of admitting that there is a problem, taking off the glasses and noticing the elephant in the room is actually in the room and
causing a problem has been, I think, acknowledged by the majority. Data Richness/Information Poverty exists!! Its not the stuff of myth & legend. This, for me,
has been acknowledged by the majority of the global industry. The research is happening...you only have to look at the IWA Conference that WIPAC is involved
in organising to see the popularity of the project. I have certainly been approached by I don’t know how many people at the moment to take part in the next
big “ Data in the Water Industry project” and organisations around the world are arranging “meeting on the use of data and analytics” but in this we have to
take care in what we are doing and where we are going so as to not clash with other things going on and other ways of working. Reading a press release this
afternoon about the announcement of the formation of a discussion group on data and work that the group are planning the question that came to mind was
whether the group were aware of and looking at the work that has already been done on semantics (see Shaun Howell’s article in this issue) or had even talked
to their colleagues in telemetry who of course are the people who are going to be the one’s collecting all the data.
All of this forces me to reflect on the situation and ask the question of
•	 Have we got there; or
•	 Are we getting there; or
•	 Have we even started yet
It is of course a question of where the Water Industry is in their maturity in using data. Where are we on the maturity scale in the management of data and
the processes surrounding the management of data
1.	 Initial - the desirable processes are non-existent or ad hoc, with no organisational oversight.
2.	 Repeatable - processes are becoming refined and repeatable, but only within the scope of individual teams or projects. There are no organisational 	
	standards.
3.	 Defined - processes are standardised within the organisation based on best practices identified internally or from external sources. Knowledge and 		
	 best practices start to be shared internally. However the processes may still not be widely adopted.
4.	 Managed - the organisation has widely adopted the standard processes and begins monitors them using defined metrics.
5.	 Optimising - the organisation is attempting to optimise and rene its process to increase efficiency within the organisation and, more widely, within 		
	 its business sector.
These are of course broad strokes but they do depend upon the global industry coming together to formulate the basics of the use of data and information in
the water industry and then competing upon the steps beyond the basic level as to go forward and formulate the basics separately is bound to result in failure
and this of course, when it comes to the use of data, is a terrible result for the Water Industry.
So, let’s come together, under whatever banner we choose to unite under and openly discuss the standards around data, the semantics and the common
language of data and establish the “vocabulary” between us all and then once we’ve done that move on from there. November is a natural place to start all
of this , so whose coming?
Have a good month
Oliver
Registration opens for Water Sector’s ‘Big Data’ Conference
Big Data’ and the ‘Internet of Things are starting to affect every industry, and the water sector is no exception. The forthcoming International Water
Association (IWA) Conference, entitled: ‘New Developments in IT & Water,’ will therefore provide an update on how data collection and processing is affecting
the management of water and wastewater, and how it will develop in the future.
The IWA Conference will run alongside WWEM 2016 in Telford (UK) 2-3rd November 2016, and registration for both events is now open at www.wwem.uk.com.
With high profile speakers from 14 different countries, the IWA Conference will be a truly international event, attracting delegates from around the world. “IT
has been a key factor in the development of the modern Water Industry and still offers exciting opportunities for the future,” says Oliver Grievson from Anglian
Water, a member of the IWA Scientific Committee. “The nature of IT infrastructure is changing, and opportunities are being created in the drive for better envi-
ronmental performance whilst lowering costs, becoming more sustainable and mitigating risk.
As technological developments enable the collection of vast amounts of accurate, reliable data, the key challenges are to understand which data is important
and to find ways to exploit the value in the data. Delegates will be provided with an insight into the sensors, controllers, dataloggers, telemetry, software and
web-enabled control systems that make it all possible, and many of the speakers will explain how to optimise the value of the data.
“The concept of a ’smarter’ Water Industry will be addressed through discussions on the value of Smart Systems, Network Protocols, Modelling & Control, and
Decision Support Systems.”
Fellow organiser Marcus Pattison believes that the IWA Conference is particularly well timed: “The Water Industry is a significant consumer of IT systems and
a large producer of data, but it has infamously suffered from ‘Data Richness and Information Poverty, producing millions of pieces of data every day, and strug-
gling to extract the value. However, the industry is changing rapidly and pressure is building from a number of directions: population growth is driving a need
for greater efficiency; environmental and product quality requirements are becoming tighter and there is a constant desire to lower costs. As a result, the water
sector needs to be ‘smarter’ in the way that it operates, with process and network monitoring systems working in tandem with modelling, communications and
control technologies that are fast, intelligent and secure.”
WWEM 2016, the co-located international Water, Wastewater and Environmental Monitoring conference and exhibition, will focus on all aspects of testing and
monitoring, providing an update on the techniques, technologies, methods, standards and regulatory requirements that relate to monitoring both on-site and
in the laboratory; covering sampling, field analysis, gas detection and continuous water and wastewater monitoring applications.
Both WWEM and IWA visitors will benefit from free access to the WWEM Exhibition which will feature almost all of the world’s leading providers of water testing
and monitoring equipment products and services, in addition to regulators, standards authorities and academia.
Page 4
Industry News
British Water puts focus on data and analytics
British Water, which is the lead representative and business development organisation for the
supply chain of the UK water industry has recently launched a new technical focus group covering
data and analytics in the UK Water Industy. This group has become the latest addition to the British
Water Technical Forum. The Data & Analytics Focus Group, which had its first meeting in June, will
bring together experts on data capturing, processing and usage from across the industry.
British Water recently set up focus groups specialising in extractive industries and innovation too,
bringing the total number of expert technical platforms to six.
Sharing knowledge
Technical Director Marta Perez said: “Over the last 12 months British Water has doubled the number
of technical forums, which are free and open to members. Becoming a part of these forums allows
members from all aspects of the water industry to share knowledge, make new connections and to
have a say in common standards and future regulation.”
At its first meeting, members of Data & Analytics Focus Group vowed to work towards a code of practice to advise UK utilities and their supply chain. The data
and analytics experts also propose to compile a glossary of technical terms to streamline the way language is used across the industry.
The Innovation Focus Group had its first meeting in September 2015. Its aim is to share knowledge about the process by which new products can be developed
and brought to a commercialisation stage, to improve information about grant funding and to build new links with academia.
British Water set up the Extractive Industries Focus Group in June last year. Its objective is to explore the opportunities for the water industry’s supply chain
presented by the development of hydraulic fracturing in the UK and to help regulators identify available technologies.
The three new focus groups are in addition to the existing British Water groups, which address issues relating to package treatment plants, network management
and sustainable water management.
Opportunity
Marta Perez, British Water’s Technical Director said: “Focus groups are a fantastic opportunity for British Water members to share their expertise, and develop
new contacts across the industry. As well as setting common standards and codes of practice for different areas of the water industry, British Water focus groups
help build knowledge of the challenges our members face.
“The sort of detailed information provided by British Water focus groups can be tremendously useful when advising governments and regulatory bodies about
new standards and legislation.”
Marta Perez, Technical Director of British Water “the number of
Focus Groups has doubled over the last year”
Defra holds open flood data competition
A new nationwide competition to consider the future of flood defences for the UK has been launched by the Department for the Environment, Food and Rural
Affairs (DEFRA).
Entrants have been given access to river catchment data, published as part of Defra’s open data programme, to consider how best to tackle flooding in Cumbria.
The competition is focused on practical solutions and bold innovation. Government will consider how any of the creative ideas could be applied to real world flood
management.
Defra Chief Scientist Ian Boyd said: “We have now published more than 10,000 datasets in just one year with our Open Data programme. This competition is a
fantastic opportunity for some of the best and brightest talent around the UK to use this vast resource to help us keep communities, families and homes safer
from flooding. It will also help improve our understanding of the nation’s natural environment.”
At the launch event, held at Defra’s Nobel House in London, sessions were held on river modelling research, the power of open data and latest technologies.
Interest is expected from academic experts, insurance companies, water companies, technology and consultancy companies, as well as environmental NGOs.
The competition follows the creation of the Cumbria Floods Partnership, and work on the government’s National Flood Resilience Review, which will highlight new
ways to better protect the country from floods.
Membership of British Water technical focus groups is free and open to all members. To find out more about becoming
a member of British Water.
British Water is an association which has a wide and varied membership covering all sectors of the water industry.
From consultants, legal and financial partnerships, manufacturers of equipment and multi-disciplinary contractors to
SMEs and independent consultants. We work to bring a coherent approach to delivering in partnership with the water
companies, the best for the British water industry. We try to ensure each member company has access to services that
will enhance their development potential and provide an added value factor to the way they do business.
Page 5
Optiqua to provide EventLab real time monitoring for drinking
water network Shandong, China
Optiqua Technologies and Shandong provincial water & waste water monitoring centre have entered into a collaboration for an integrated water quality moni-
toring scheme for Shandong, based on Optiqua’s EventLab and MiniLab solutions.
The Memorandum of Understanding (MoU) was signed by director Sun
Shaohua at Shandong monitoring centre and managing director Melchior
van Wijlen at Optiqua Technologies. The signing took place at the Singapore
International Water Week on 12 July. It was attended by Hans Akerboom of
the Dutch embassy in Singapore and Shao Yipeng of the Chinese embassy in
Singapore.
Optiqua Eventlabs are operational in the Netherlands, Singapore and USA.
Shandong monitoring centre is the first deployment of the technology in China.
Three stage programme
The first phase of the collaboration, starting August 2016, will demonstrate
Optiqua’s EventLab technology, a real time water quality monitoring solution,
at a drinking water treatment plant in Jinan.
The objective is to monitor the stability of the water quality before it is re-
leased into the network.
Full scale real time monitoring network
In the second phase of the project, scheduled for January 2017, Shandong and Optiqua plan
to deploy a medium scale network of EventLab sensors at multiple treatment plants as well
as in the drinking water distribution grid.
The final phase of the collaboration will see the deployment of a full-scale sensor network
covering all treatment plants and the entire distribution grid.
Fast response to unknown pollutants
Director professor Jia Rui Bao at Shandong monitoring centre, said: “Our vision and
strategy is to build a multi-level water quality monitoring system for the city, achieving fast
responses to the sudden and unknown pollutants, on-site efficient identification, and
qualitative and quantitative laboratory analysis of the pollutants.”
According to Jia Rui Bao Optiqua’s technology provides a good match with that vision.
Long-term collaboration on monitoring scheme
In his response managing director Melchior van Wijlen at Optiqua Technologies said to be pleased to be able to demonstrate this for the first time in China. He
emphasised the long-term collaboration.
“It has a clear long-term vision and well-defined applications for the water supply and water distribution”, Van Wijlen added.
As Optiqua is based in Singapore the development of the real time monitoring scheme is supported by Singapore’s national water agency PUB.
Detection highest priority pollutants in rivers
In addition to the use of Optiqua’s real time EventLab technology, the collaboration also includes the use of the MiniLab lab-on-chip technology which will be
tested and researched by Shandong monitoring centre in pollution monitoring applications.
The two partners agreed to develop tests for the highest priority pollutants in the Yellow River and Chang Jiang River
About Shandong monitoring centre
The Shandong provincial water & waste water monitoring Centre is responsible for supervising and monitoring the quality of water supply and drainage for Jinan
and Shandong province, China.
The centre is also responsible for the development of water treatment technology, application of research results and technical training across the province, as
well as urban water supply and drainage industry monitoring for Shandong housing and urban-rural development department.
Page 6
Water industry dare to start and learn by doing
“Dare to start, dare to learn. Find your way by doing”, that was the message by Dutch special water envoy Henk Ovink at the Water Leaders Summit in Singapore
on 10 July.
Ovink participated in the panel of the first of a series of meetings by global water industry leaders to share their ideas on pressing water issues together with
government regulators and policy think-thanks. The kick off meeting of the Water Leaders Summit was part of the Singapore International Water Week 2016 that
took place from 10th – 14tn July.
No excuse to wait any longer
“There is no lack of money for water projects to address the pressing water issue”, Ovink declined the outcome of an opinion poll amongst the summit’s attend-
ance that had been asked for the largest threat to success in the water industry. By far the attendance choose for the lack of money.
“The money is sitting out there. We need bankable water projects”, he riposted.
“There is no golden bullet. The water issues are complex but that is no excuse to wait any longer. Find your way and learn by doing”, the Dutch special envoy
advised the water industry present.
Ovink emphasized the importance of a process that include the involvement of local communities. “Create a confidential setting for collaboration and don’t be
afraid to fail.”
Even more complex
Cities are growing at staggering rates and in the developed world the water infrastructure is ageing. If the water industry does not move fast enough it will not
be able to deliver its services.
At the same time cities will become un-liveable if they fail to create more space for green-blue corridors.
“And climate change makes it even more complex”, added Michel Jarraud, former chair on UN water, who also participated in the panel. “We are used to base
our decisions on data from the past, but due to climate change this data is no longer good enough.”
Jarraud also warned that the water industry cannot solve all water issues at once. “Try to achieve more and make reasonable steps forwards”, he recommended.
Grants for innovative projects
Good news came from panellist Amy Leung, deputy assistance at the water office of the Asian Development Bank. “We are providing special grants for project
involving innovative water technology or innovative business models”.
According to Leung the ADB focuses on the reduction of non-revenue water. “We calculated that water utilities in Asian countries loss 9 billion US dollar on the
production of water that is not paid for. Proposals for water projects shall to address, for instance by concluding leak detection”, Leung said.
The Asian Development Bank wants to allocated 25 percent of its future loans to water projects.
Page 7
Syrinix launch TrunkMinder, PipeMinder and RADAR onto
FATHOM Store
Syrinix, a leading provider of intelligent pipeline monitoring solutions has announced a new partnership with FATHOM Water Management, Inc. (“FATHOM”).
Syrinix will offer its TrunkMinder, PipeMinder and RADAR solutions through the FATHOM Store, an online marketplace designed to enable simple, fast and risk-
free adoption of new technologies for US water utilities.
Syrinix TrunkMinder transforms the asset and risk management of critical and high consequence pipelines. It is a real-time network monitoring solution, always
on and highly automated with immediate event alerts (any detected leaks or breaks) plus, high resolution pressure and flow data.
Building on Syrinix’s established portfolio of solutions, PipeMinder is the next generation of monitoring hardware, transforming the way utility companies calm
their networks and reduce leakage and breaks. Combining a 5 year battery life, automated alerts for transients and bursts plus high resolution data capture,
it gives the clearest ever view with new levels of detail and accuracy, of where there is greatest risk of pipeline failure. Efficiently equipped with this view,
PipeMinder allows utilities to address underlying causes and so actively and substantially reduce leaks and bursts in a way that has not been possible before.
RADAR is a cloud based portal for device set-up and data analysis. Its single platform for multiple products provides detailed analytics, reporting and
notifications. It comes accompanied with a range of service bundles for additional functionality.
Cliff Jones SVP Syrinix said “We are delighted to have TrunkMinder, PipeMinder and RADAR on board for the launch of the Fathom Store, which we see as a
great new opportunity to showcase our innovation to a direct audience.”
The FATHOM Store is a simple, secure data integration platform that connects water utilities with technologies that help streamline business processes, recover
revenue and better engage with customers. FATHOM’s expert team thoroughly vets each product submitted for consideration to the Store and selects only the
top-performing tools, like TrunkMinder, PipeMinder and RADAR, for inclusion. Through open application program interfaces (APIs), technology companies can
exchange data with FATHOM, as well as utilities, to deliver maximum value.
Utilities can now easily access and acquire TrunkMinder, PipeMinder and RADAR without the risks common to technology adoption.
“Nationwide, more than 56,000 water systems are searching for technologies that can help them make the most efficient use of ever-dwindling resources.
Unfortunately, finding, vetting and integrating new technologies demands a level of investment most cannot afford to make – until now,” said Trevor Hill, CEO of
FATHOM. “Through the FATHOM Store, we are connecting technology innovators, like Syrinix, directly to the utilities that need their support most. By mitigating
the time and financial commitment required to modernize water utilities’ processes, we are propelling the Smart Grid for Water into reality.”
The FATHOM Store is available at https://store.gwfathom.com.
Water utilities gain new insight from network data
New software offering improves network analysis, visualisation and maintenance
i2O, the smart water network company, today launched a new software tool to help water companies monitor their networks and improve performance
using data. i2O’s iNet software increases the ability of water companies to analyse and make automated decisions based on pressure and flow data and is
the first software product available that diagnoses problems with Pressure Reducing Valves (PRVs) automatically.
i2O’s new software features data visualisation tools that make it is possible to display water network data immediately through a range of flexible graphs,
maps and dashboards. Multiple data sets can be combined in different ways to provide users with greater context, making it easier for engineers to identify
and investigate potential anomalies.
iNet uses an intelligent algorithm to automatically detect abnormal performance – including sudden changes of pressure, threshold breaches and other
unusual patterns of operation – by monitoring data gathered from points of interest across the network.
i2O completed an extensive diagnostic analysis of PRV failure modes when developing iNet, so it can now predict the underlying cause of PRV problems
by analysing pressure data. Problem diagnosis enables water companies to improve the efficiency of maintenance operations and eliminate unnecessary
network operation. i2O is currently working on a surge analytics programme to broaden the range of problems iNet is available to diagnose.
Joel Hagan, Chief Executive Officer of i2O, comments: “iNet enables water companies to get maximum insight from their networks and improve the service
they provide. Today the first most utilities know they have a problem is when a customer tells them about it. By monitoring and making sense of pressure
and flow data it becomes possible to improve network operations, diagnose issues as they occur and fix them before they affect customers or create a cat-
astrophic failure.”
i2O’s smart water network technologies are already used by more than 100 utilities around the world to reduce leakage, burst frequency, energy use,
operational costs and customer complaints. They include oNet, technologies providing water utilities with the ability to monitor and manage the pressure
and flow of water across their networks, and dNet, a system of low-cost loggers that gather data about water demand, flow, pressure, asset condition and
transients from points of interest on the network.
Page 8
Nivuflow NF750 awarded MCERTS certification
The area velocity flow specialist company, Nivus, have been awarded MCERTS Class 2Certification for
their Nivuflow NF750 transmitter in conjunction with their POA Wedge sensor this month. Field trials
which form a part of the testing process were conducted at WWTP of Eppingen, Germany.
The NivuFlow 750 including the Correlation Sensor is intended to be used for continuous flow
measurement in slight to heavy polluted media with various compositions. The flowmeter can be
operated in partly filled and full channels and pipes with various shapes and dimensions. It is a
stationary measurement system for flow measurement and storage of the measurement data.
The flowmeter simultaneously determines the velocity and level at a common measurement
point. Depending on the level selected sensor type, the air-ultrasonic sensor or the pressure
combi- sensor may contain two different built-in level measurements, an air-ultrasonic and
hydrostatic level measurement. To ensure accurate level measurement, the fluid temperature is
constantly monitored and fluctuations in atmospheric pressure are compensated for. A piezo crystal
with a certain installation angle towards the flow direction operates as a flow velocity sensor. All the particles in the measurement path (air, dirt, suspended
solids) reflect a part of the emitted ultrasonic signal pulse.
This echo is received by the piezo crystal again and converted to electric signals. After a certain period the echoes of a second pulse are measured too. By
correlation these echo the velocity and a velocity profile can be determined. Associated to the cross section, the discharge is evaluated.
Municipal Utility Leaders Recognize Sensus With Best Smart Grid
Solution Award
For the third year in a row, municipal utility executives named the Sensus Advanced Metering Infrastructure (AMI) product portfolio the “Best Smart Grid
Solution” during the Municipal Smart Grid Summit (MSGS).
The solution features the FlexNet® communication system, which provides the basis for smart city infrastructure by wirelessly and securely transporting criti-
cal data for public service providers including electric, water and gas utilities.
“The FlexNet system is a reliable, two-way communication network that can grow for the future,” said David Stair, director of public power and cooperative
markets at Sensus. “It supports all types of smart city sensors such as metering, distribution automation and IoT initiatives including outdoor lighting control.
With FlexNet, utilities, municipalities and cities can manage multiple applications over a single network.”
The sixth annual MSGS focused on executives at public power utilities seeking the latest industry research, regulatory news, standards and cutting edge tech-
nology. The summit featured smart grid technology companies presenting to more than one hundred municipal utility executives from across the country.
Sensus also received a best presentation award for its high-energy FlexNet session.
South East Water has joined forces with behavioural science experts Advizzo to develop new innovative approaches that empower customers to better
control the water they use and therefore the bill they pay.
For several years South East Water has been utilising various information channels to encourage behaviour change and has seen good results through its
customer metering programme. But the company is now looking ahead to find new innovative approaches using technology and behavioural science to
encourage future savings.
David Hinton, South East Water’s Asset and Regulation Director said: “Our customer metering programme has had great results with research showing
average savings of around 16 per cent - the unknown though is how long will the savings last for and can we continue to encourage further savings in years
to come.
“When we met the team at Advizzo we felt their experience was just what we had been looking for and we are hoping to take the partnership on to run a
series of experiments to really use engagement methods to maximise the impact behavioural science can have.
“It’s a new way of thinking about how customers value their water supply and fits well with our vision for the future.”
Julien Lancha, Chief Customer Officer and co-founder of Advizzo, added: “Where we believe we add value is we work closely with social scientists and be-
haviour change experts to develop customer engagement tools that will make a difference.
“It’s an exciting time and we can’t wait to see the results as we work together on innovative approaches to water efficiency and customer engagement.”
South East Water partners with behavioural science experts
Page 9
Anglian Water today announced it has selected Arqiva, the communications infrastructure and media services company, to provide a smart water metering
network trial as part of Anglian’s long term plans for a smart metering programme.
The four-year contract will see Arqiva partner up with technology provider Sensus to create the relevant infrastructure to operate 7,500 new smart water
meters in and around Newmarket, Suffolk.
Anglian Water is using Newmarket as what it calls an ‘Innovation Shop Window.’, trialling technology which will help to achieve goals of 100 per cent custom-
er satisfaction, zero bursts and leakage, and a reduction in water consumption to 80 litres per head, per day.
Residential and non-residential properties during the trial period will be covered by the Sensus smart water meters. They will transmit hourly usage readings
via the Arqiva network back to Anglian Water. These readings will give Anglian Water the knowledge to better comprehend customers water consumption,
and allow the company to quickly identify bursts or leaks.
The two-way communications capability of the fixed network will also enable Anglian Water to remotely reconfigure meters to deliver more frequent meter
readings (every 15 minutes) for even more accurate identification of system leakage. It is intended that customers taking part in the trial will have online
access to their consumption data, and will be given guidance and advice to minimise their water consumption.
Paul Glass, Anglian Water’s Programme Manager for the smart metering initiative, said: “Long-term access to secure supplies of water is one of the most
pressing environmental and economic challenges the world faces today, and that challenge is particularly acute in the east of England, which is the driest
region in the UK. Getting to grips with it is not something that can wait until tomorrow. We want to lead the way in raising awareness about how essential
water is to life, people and the environment, but also draw attention to the role technologies like this can have in helping address the challenges of a growing
population and changing climate.
“Smart metering has a key role to play in giving our customers access to information about their water use – helping them to understand how much water
they are using, and therefore how to reduce their consumption and bills. In combination with our efforts on the wider network, this will help secure water
supplies for the future.
“We procured Arqiva (and Sensus as subcontractor) through an EU compliant tender process. We selected them because of the long-term commitment they
made to the deployment and on-going monitoring of our fixed network trial, as well as their proven expertise in delivering large-scale network builds.”
Sean Weir, Director Smart M2M at Arqiva, said: “Arqiva is committed to working with water companies to help them use smart metering to tackle the chal-
lenge of water scarcity. Accurate monitoring enables consumers to better understand their usage and helps the water companies pinpoint and act quickly
on leakages. We pride ourselves on the delivery of robust, reliable and comprehensive network solutions that aid this process, and are delighted that Anglian
Water has recognised our reputation in this area by choosing us to support the progression of its smart metering programme.”
Neil Adams, Director UK & Ireland at Sensus, said: “Anglian Water is taking an important step toward water conservation that will benefit its customers for
years to come. Sensus technology enables Anglian to reduce non-revenue water, detect leaks and ensure reading accuracy from day one and into the future.”
Routeco announce a special live event or two
Routeco, the automation specialist has announced a new event in the industry calendar. Routeco LIVE will showcase the very latest in Industrial Control &
Automation products and give attendees the opportunity to learn about the latest trends and hot topics within the industrial sector. The events will comprise
of both a show floor, where people will find exhibits from Routeco’s manufacturing partners, and three break out rooms with presentations and discussions
running throughout the day covering topics such as:
•	 Industry 4.0, SMART Manufacturing, Enabling a Connected Enterprise
•	 IT/OT Convergence, Network Infrastructure for the factories of the future
•	 Machinery Safety, Legislation/Standards and Compliance
•	 Accessing and expanding into global markets for UK Machine Builders
•	 Enabling IoT technologies in the industrial sector
•	 Cyber Security best practices and protection concepts and technologies
•	 Migration of legacy control systems and managing obsolescence
•	 Motion Control optimisation and introduction to new technologies
In total there are two events that are taking place. The first is at the AJ Bell Stadium in Salford near Manchester in the
north of the United Kingdom on 4th
October 2016 and the second is at the MK Dons in Milton Keynes on 6th
October
2016.
The events are free of charge however, all attendees must pre-register for admittance on the day. People who want to
attend can register by sending their full name and contact details and company name starting which day they want to
attend to RoutecoLIVE@routeco.com
Anglian selects Arqiva for smart metering fixed network trial
Page 10
Rapid, low cost water quality assessment for all
Real-time water quality testing would be a significant step forward for water treatment and public health, both in the developed and developing world.
Researchers at the University of Birmingham are developing an optical instrument which uses fluorescence to give a rapid, in-situ indicator of quality.
A primary concern for water utilities worldwide is to ensure that drinking water does not pose an unacceptable health risk to consumers. The number and type
of different pathogens present in waters is extensive, varied and dependent on a range of environmental factors. It is, therefore, not feasible to regularly isolate
and identify each specific pathogen.
Reliance has traditionally been placed on the measurement of total plate counts, as an overall indicator of microbial load and detection of faecal
indicator bacteria and other coliform bacteria for contamination. Although precise, these tests can take more than 30 hours to produce results. In the natural
environment, often only 1% or less of microbes can be cultured in this way, leading to what has become commonly known as the “great plate count anomaly”.
In less developed countries, the length of time, expert analysis and relatively expensive reagents needed mean the use of such tests in community water
management and disaster relief scenarios, such as refugee camps, is problematic and infrequent. Furthermore, these techniques are beyond the reach of those
poorest communities in urgent need of drinking water and sanitation improvements. Situations like these demonstrate that rapid science and engineering-based
indicators of safe drinking water are essential to reduce poverty and develop sustainable livelihoods. Such indicators are likely to be most widely adopted when
delivered as part of a community-based drinking water solution.
In more developed nations, the challenge to ensure microbial quality is addressed by water utilities through disinfection during treatment processes. Using
chlorine, ozone, or chlorine dioxide as a disinfectant in water rich in organic matter, which also acts as a microbial food source, can generate potentially
carcinogenic disinfection by-products. Consequently, utilities must manage the competing needs of biological and chemical compliance. It is, therefore, vital
that companies monitor the microbial and chemical quality of drinking water at various stages of treated water supply systems, including trunk mains, service
reservoirs and the distribution network.
In-situ real time measurement is, therefore, highly desirable, as it would enable rapid assurance of water quality. For developed countries, this would facilitate
optimisation of process control and overall proactive and preventative operation of water supply systems. In less developed nations it would provide first-level
screening and safety assessment of an area’s water supply arrangements. There is a pressing need for novel technologies that enable real time, in-situ, low
powered and, ideally, continuous analysis of drinking water quality.
Focusing on these global challenges, researchers from the Department of Civil Engineering at the University of Birmingham have developed a novel optical
instrument, based on fluorescence spectroscopy, to indicate water quality and suitability for consumption almost instantly. All water fluoresces, although the
insensitivity of the human eye to the appropriate wavelengths renders fluorescence invisible to us. Research has demonstrated that water fluorescence is
particularly good at identifying faecal contamination. The fluorescence emitted from humic and fulvic substances, fluorescent pollutants such as whitening
agents, and microbially-derived intrinsic fluorescence from both cellular material and exudates can all be detected. The advantages of fluorescence include a
rapid analysis time, no sample pre-treatment necessary, and a sample volume of only a few microlitres.
We have developed a prototype dual-LED instrument, ‘Duo Fluor’. This can detect fluorescence at wavelengths that can be used as surrogates for both
microbial and organic carbon presence. We have benchmarked prototype performance against research grade instruments and recorded excellent performance.
Our initial work examined the feasibility of using the Duo Fluor as a proxy for organic matter.
The instrument detected fulvic acid at 0.25 mg/l, and could differentiate between deionized water and tap water. Attempting to observe similar differences using
standard TOC analysis was less successful, meaning that the Duo Fluor could detect lower levels of pollution than standard TOC analysis.
The response of the Duo Fluor to deionized water, as a clean control, and local pond waters spiked with L-Tryptophan was subsequently assessed. Incremental
dosing of Tryptophan into both types of water yielded a steady fluorescence signal response demonstrating the capability to detect a surrogate for microbial
presence.
Duo Fluor performance has also been assessed when continuously measuring the Peak T fluorescence (a surrogate for microbial presence) and Peak C
fluorescence (a surrogate for humic and fulvic acids) of pond water spiked with quinine sulphate (QS). It was used to analyse water quality continuously over
three distinct phases: 15 minutes of water flowing continuously with no addition of QS; 15 minutes of water spiked with 0.4 mg/L QS, and finally 15 minutes of
water spiked with 0.8 mg/L QS. The results are shown in Figure 2 and demonstrate an appropriate and anticipated response in both Peak C and Peak.
Unlike most commercially-available instruments, fluorescence responses can be enhanced by adjusting gain settings. This means it can be set up to provide an
accurate comparison among samples as well as allowing the most appropriate sensitivity ranges to be identified for the quality of water being tested.
The Duo Fluor represents a hugely significant advance for the management of water and wastewater systems in both developed and developing countries. It
offers multiple potential uses within the global water industry for the rapid, cost-effective and robust indication of:
•	 organics and microbial matter across a wide range of water qualities (from sewage to drinking water)
•	 process efficiency at treatment works
•	 identification of potential ingress into service reservoirs and distribution systems
•	 disinfection byproduct formation potential
•	 effluent quality at wastewater treatment works
•	 river water quality at abstraction points and wastewater treatment works’ discharge points
•	 identification of misconnected sewer discharges.
The equipment is inexpensive and off-the-shelf; furthermore, it allows both expert interpretation of results and simplified pictorial interpretation for use by
non-experts.
Page 11
Phosphate Monitor Protects Cumbrian Lake During Restoration
Novel phosphate monitoring technology from OTT Hydrometry is helping the
South Cumbria Rivers Trust (SCRT) to improve water quality during a project to
restore a lake in the north of England. Funded by United Utilities, the
Elterwater Remediation Project has been created to improve water quality by
increasing water flow through the lake and dramatically lowering residency time.
Background
Situated 2 km North West of Lake Windermere, Elterwater is a high amenity value
lake comprised of three basins measuring 930m long with variable widths up to
320m. The Lake is also a Site of Special Scientific Interest (SSSI). Between 1974
and 1999 United Utilities operated a wastewater treatment works serving the
Elterwater village within the consents of the day. However this and other sources,
left a legacy of phosphorus enriched sediments in the inner and middle basins of
the lake. These in turn caused eutrophic and hyper-eutrophic conditions leading to
algal blooms, anoxia and poor water quality.
In the United Utilities asset management plan for April 2010 to March 2015 (AMP5)
a study was commissioned that identified the key issues and options for resolution. These included improving the lake’s water quality by dredging to remove
the phosphorus rich sediments or diverting two local becks to improve water turnover and prevent the conditions necessary for phosphorus release and the
creation of algal blooms.
Dredging would permanently remove the phosphorus rich sediments but could cause significant environmental damage particularly in the disposal of the
enriched sediments. Consequently, the preferred solution is to divert the becks. Dr Mike Sturt SCRT’s Technical Officer explains: “Soluble Reactive Phosphate
(SRP) released from the sediment accumulates over time and becomes bioavailable resulting in a proliferation of algae and bacteria, which causes a lowering
of dissolved oxygen and pH, which in turn causes an increase in SRP desorption from the sediment. So there is a complex cycle in play which causes thermal
stratification and anoxic/high turbidity conditions in the summer months. As a result, Elterwater is incapable of supporting natural, healthy populations of fauna
and flora beyond benthic invertebrates.”
Phosphate Monitoring
Phosphate in the lake sediment is clearly the cause of the lake’s ongoing water quality problems, so the aim of the restoration project is to implement a
sustainable solution that does not result in an increase in SRP within the water body. Background phosphate monitoring therefore commenced in August 2014
and samples have been taken at 2 week intervals for laboratory analysis. However, continuous monitoring is always preferable, when possible, because spot
sampling risks missing pollution incidents.
Traditional continuous phosphate monitors employ colorimetry and generally require mains power, which is often not available at remote sites. However, the
‘Cycle-P’ from OTT Hydrometry is battery powered and able to operate unattended in the field, running over 1,000 tests before a field service is necessary to
change the reagents. When combined with telemetry, the instrument delivers almost real-time data at user-selectable intervals (typically 1 to 4 hours). “The
Cycle-P is ideal for Elterwater,” Mike says. “The lake is an hour’s drive each way from our office, so the facility to leave it running, but with remote access, saves
a great deal of time and money.
“Initially, two Cycle-P units were installed at Elterwater; either side of the middle basin, but after 1 year of operation, it became clear that one unit was sufficient
– at the outlet of the inner basin.
“The performance of the Cycle-P has been excellent; it has proved to be accurate and reliable, producing good quality data that is consistent with laboratory
analysis.”
The Cycle-P is an in-water total reactive phosphate analyser that has been designed for operation by both chemists and non-chemists. The instrument has an
onboard logger, and the quality of the data is underpinned by QA/QC processing in conjunction with an on-board NIST standard. The Cycle-P methodology is
based on US EPA standard methods, employing pre-mixed onboard colour coded cartridges for simple reagent replacement in the field. With a detection limit
equal to or less than 0.0023 mg/L PO4-P, and a range of 0-0.3 mg/L PO4-P the Cycle-P is able to measure down to extremely low levels, which makes it ideal for
the Elterwater application. However, a higher range can be specified at the time of order (0 to 1.2 mg/L).
Progress to-date
The background monitoring undertaken by the Cycle-P (and lab samples) has not shown significant SRP in the water body because the release of phosphate
from the sediment is quickly taken up by algae. However, the piped diversion of the Great Langdale Beck delivers around 122 litres/sec of very clean water, and
the Cycle-P constantly checks that this is not causing a rise in SRP from the sediment. If alarm conditions arise, the system automatically sends a text message
to Dr Sturt’s mobile phone. The Environment Agency has also installed a water quality monitor (DO, pH, EC, turbidity) at the same location and this also has a
text alarm system.
Mike says: “The clean water from Great Langdale Beck started to arrive in the inner basin during early February 2016 and at the time of writing no alarms have
occurred, so we are cautiously optimistic!”
Page 12
Water utilities around the world face huge challenges. Population growth, urbanisation and more frequent extreme weather events make delivering adequate
customer service through aging infrastructure increasingly difficult.
Given the extent of these challenges, regulatory requirements and the reality that there is no more money available, water companies need to be smarter
about what they do. Specifically, they need to extend the life of their existing assets and push out the significant investment required by large capital projects
– new supply infrastructure and pipe replacement.
So, what is a smart network? It has three key essential components: sensors, analytics and automation much like PLCs or SCADA for treatment works.
Sensors enable accurate data on network status to be reliably gathered regularly without the need for anyone to physically collect readings. This can be done
today with pressure and flow. It is likely in future that this will extend to water quality parameters possibly including turbidity, chlorine, etc.
Analytics crunches the data. This can be anything from simple maths – adding, multiplying and averaging – to hugely complicated algorithms which
combine diverse datasets. In each case, the aim is to turn the data into actionable insight, the ability to do something as a result. Software does the crunching
relentlessly 24 hours a day, seven days a week and 365 days a year without bias or error. This is something that people just can’t do.
Automation enables the network to be controlled remotely without human intervention. It is the transition from the analogue to the digital world. It will mean
that an engineer visiting site to make manual adjustments is the exception rather than the rule.
Each of these components has its particular challenges.
Sensors first of all
Sensors need to operate remotely without power. Few network locations have readily accessible mains power. The batteries that power them need to last a
long time so low power designs are required.
The sensors need to be robust. They are often located in harsh environments and operate in high and low temperatures and wildly variable temperatures; in
humid environments and arid environments; in dry environments and submerged in water of all qualities.
They also need to communicate from remote places through concrete chambers or from under heavy manhole covers.
Analytics has a diverse range of challenges.
The main requirement is for accurate, reliable and timely data. Without this, decisions made on the basis of the data can’t be trusted.
Visualisation is a specialist field in itself. It’s not just about graphing data but making it possible for a person to assimilate it by putting it into its appropriate
context, whether that’s a graph or a map or a schema.
Data security is critical and although largely mitigated we have to accept that it can never be solved in full. Even if the technology is impregnable then the
human operator is a significant weak point. How many people still have “password” as their password?
The actual processing and storage of data is often considered by utilities as a big challenge but the data volumes and complexity of calculations is in the foothills
of big data challenges that the business and scientific world has learnt to manage today.
At CERN, for example, the raw data per event is around one million bytes (1 Mb), produced at a rate of about 600 million events per second. The total data flow
is around 5 GB per second. In total CERN generates 25 petabytes of data a year. Compare that to a smart meter reading every half hour, communicating daily,
clocking up a tiny 17,500 meter readings a year.
The challenge of automation is two-fold
Hardware that was designed for manual control needs to be remotely actuated. The more difficult thing is that people need to accept that machines can do the
majority of what they used to do, probably more reliably. This is proving easier for the younger generation coming through than experienced engineers that
may embrace new and better ways of doing things less willingly.
Smart networks aren’t new. This is a well-trodden path in other industries including utilities. The electricity utility industry has been doing this for a decade.
The communications industry has been down this path for 40 years starting with the digitisation of exchanges.
Opinion:
Smart water networks
set to become pervasive
Page 13
But an interesting analogy comes from the aeroplane. At the beginnings of flight every control in an aeroplane was connected physically and operated
manually by the pilot. In the 1930s the RAF chose a set of six essential flight instruments. Five of these, “the big five” as they are known, are still included in all
cockpits. They have proved to be the enduringly critical visualisation tools.
Today aeroplanes largely fly themselves. The role of the pilot is restricted to entering desired outcomes (destination, speed, rate of climb/descent) and
intervening to deal with unexpected and unanticipated events. It’s interesting to note however that less than one per cent of landings are automatic in spite
of the vast majority of jetliners being certified to land automatically. Hopefully they like to keep their hand in, but perhaps they still think they do it better!
i2O has been delivering smart water network solutions to utilities for 10 years. Its clients number more than 100 in more than 25 countries around the world.
i2O has three solutions that enable water networks to be smart:
•	 dNet enables data to be returned from permanently deployed pressure/flow sensors at points of interest on the network
•	 iNet takes that data and visualises it in ways that make it easier for engineers to interpret, identifies anomalies in the data which indicate events of 	
	 interest on the network (parameter breaches, abnormal patterns), and enables maintenance to be scheduled on the basis of condition rather than time
•	 oNet enables pressure to be remotely controlled and automatically optimised at PRVs and booster stations across the whole network.
i2O’s solutions reduce leakage, bursts and operating costs, extend asset life, and improve customer service. Payback can be as short as seven months.
Now that is smart.
About the Author
Joel Hagan has more than 20 years of business leadership and technology expertise. He has a deep understanding
of the utilities sector and significant experience of building early stage companies and developing data analytics and
control technologies.
i2O provides a suite of smart network solutions to help water utilities respond to the challenges created by an
increasing and urbanising population, more extreme weather events, ageing infrastructure and more demanding
customers. More than 100 utilities in over 25 countries around the world have installed i2O technology since the
company was founded in 2005; extending asset life, reducing operating costs, improving customer service and
achieving return on investment within 12 months.
Amey and VTOL form drone JV for asset management inspections
A new joint venture between global asset management consultancy, Amey, and world
leading drone technology experts, VTOL Technologies, will use precision, long-range
drones to transform asset management inspections – making it safer, quicker and
easier to assess vital infrastructure such as bridges and railways.
Richard Butterfield, AmeyVTOL’s Service Development Director said:
“Doing more with less is a challenge most businesses will understand. As asset
managers, we’re often asked to deliver cost efficiencies for our clients while increasing
inspections to meet the growing demands on the UK’s networks.
Using this cutting-edge technology to inspect the vital infrastructure that we all rely on
is a world first. It will change the way we inspect assets forever; allowing us to assess at
the touch of a button, make real-time recommendations and potentially save millions
of pounds for our clients.”
AmeyVTOL’s unique patented unmanned autonomous drone, known as The Flying Wing, is at the forefront of long-range, beyond visual line of sight (BVLOS),
remotely piloted aerial systems (RPAS) autonomous drone technology worldwide and offers a number of benefits that traditional drones fall short of.
The Flying Wing will carry Ground Penetrating Radar, High Definition video
and still, Infrared, thermal and Light Detection and Ranging sensors, amongst
others. It can take off and land anywhere, travel up to 150km, at speeds of up
to 60kph and change direction to precisely map the same route over and over,
regardless of weather conditions. It also has the added benefit of capturing
data in real time and streaming it live to a data processing engine.
Mark Shaw, Director for AmeyVTOL said:
“Our unique and patented Flying Wing outperforms existing drones
and represents the future of aerial inspections. We’re really excited
to be introducing this market-leading technology which will revolutionise the
asset management industry to deliver repeatable, consistent and accurate
inspections as early as 2018.”
Page 14
At the current time in England & Wales there is a debate going on as to the use of area-velocity flow meters for the measurement of wastewater flow. It is
a subject that has been rumbling on for the past few years as to how to check whether or not the flow measurement technique is accurate and compares
to more traditional techniques like open-channel level based techniques that use a primary device or how it compares to techniques such as closed-pipe
electromagnetic flow measurement and the issue at the heart of the debate – how to check that they are recording accurately on a year on year basis.
In the rest of this article I intend to touch on the principals of the technique, its beneficial use within the Water Industry, and its comparative accuracy compared
to other techniques and a potential question as to potential validation techniques.
The types and principals of area-velocity flow measurement
Area velocity techniques for flow measurement have been around for a significant time within the water industry in a variety of different forms but the
principal of the technique is that the height and velocity of a body of water is measured using two separate types of measurement. The depth of a fluid in a
channel that fixes the width and the speed that the fluid is moving through the channel. The two multiplied together as in the following equation is used to
calculate the flow rate.
Flow (Q) in m3/s = Area (m2) x Velocity (m/s)
Where the area is equal to
Area (m2) = Depth of fluid (m) x width of channel (m)
Where of course the width of the channel is a set parameter and only the depth is measured. This is demonstrated in figure 1 which has been borrowed from
the Greyline website
The development of this technique has brought many innovations in flow measurement that can be vaguely be split into:
•	 Submerged area velocity flow meters (including Doppler)
•	 In-pipe velocity measurement
•	 Cross channel based area velocity flow measurement
•	 Non-contact area velocity flow measurement
The submerged techniques have been in existence for many years and under the UK MCERTS scheme there are currently two companies certified for regulated
flow measurement including Nivus and Teledyne Isco both with traditional area-velocity measurement units.
The in-pipe velocity measurement technique uses just the velocity measurement of a traditional area-velocity unit to measure the velocity of fluid through
a pipe. The area part of the equation is not necessary as the pipe is a fixed dimension and, as long as the pipe remains full, is a fixed area. Although the
measurement technique is very different the principle of calculation (i.e. the use of velocity as a measurement parameter) is similar to that used for
electro-magnetic flow meters.
Cross channel techniques have been used in the past with instruments such as slab-electromagentic flow meters or with sensors that measure the velocity
across a channel by mounting the velocity sensors on the channel sides. These are uncommon in the wastewater industry and are generally not used.
Non-contact area velocity flow measurement is a technique that started by the development of the Hach Flodar system and has continued with technologies
such as the Raveneye & Laserflow flow meters. These instruments work by measuring the surface or near surface velocity of the flow of water and measure
the height of water by taking away the measured ullage from a programmed empty distance of a channel (the height from the sensor face to the bottom of the
channel. Of all the non-contact area velocity techniques only the ISCO Laserflow is currently accepted under the MCERTS measurement scheme.
Feature Article:
The Great Area Velocity Debate
Figure 1 - Basic Area Velocity Flow Measurement (courtesy of Greyline - http://www.greyline.com/)
Page 15
The use of Area-Velocity flow measurement in the Water Industry
By far the most common types of flow measurement in the UK Water Industry are ultra-sonic level
based flow for open channel flow measurement techniques and electro-magnetic flow measurement
in closed pipes. Between these two techniques over 90% of all flow measurement is accounted for.
However, the remaining 10% of flow measurement (approximate guesstimate) pose a significant
challenge for the measurement of flow and can result in either a significant investment or a significant
risk to the environment when installing a measurement solution. It is in these applications that
area-velocity flow measurement becomes an attractive alternative measurement solution as no primary
measurement device (a flume or a weir) is necessary and civil costs are minimised. The impact on the
process and thus the impact on the environment can either be minimised or in the case of non-contact
area velocity measurement eliminated entirely.
Examples of this include open channels where the spare head of water is limited to almost nothing and
it is not possible to install a primary device. This is the case of the channel in figure 2.
In this case the old measurement structure was a flat v which over time had developed a slope
meaning that the existing ultrasonic flow measurement had, through the failure of the primary
structure, become unreliable.
The available head within the channel was in the order of 50-70 mm which precluded the use of a flume
or a weir. The remaining choice was to either install an area-velocity flow measurement system or dig up
a concrete car park and install an electro-magnetic flow meter. The former option was chosen.
The second example was the measurement of flow within an inlet channel of a relatively large
treatment works. The works in question did not have storm tanks as all flows were treated at the works
or in n emergency could overflow to the nearby water course. However, it was necessary to install inlet
flow measurement for control purposes. Isolation at the inlet pumping station was possible for a period
of only two hours at the lowest of flows. In this particular case the installation of a flow meter was not
an emergency, the time restrictions were too short for an electro-magnetic flow meter and pipe lengths
were not suitable for time of flight measurement. The best alternative form of measurement was time
of flight.
So it can be seen that the use of Area-Velocity flow measurement has significant benefits within the
water industry.
Is area-velocity flow measurement accurate?
Of course when you talk to the suppliers of these technologies the answer, most of the time, will be yes. The cannier within the industry will say “if installed
correctly.” From the Water Company’s the typical answer is – “we’ll have to try it and see.” So here are two case-studies.
In the first of these two area-velocity measurement techniques are compared. A within technology test. In this particular case study we have an inlet channel
non-contact area velocity device mounted above the channel against an insertion velocity measurement which on occasion loses its pipe full profile and the
measurement is lost. This is more to do with the installation and the particular pipe conditions rather than the measurement technique itself.
Despite this limitation there was an average of a 7% uncertainty between the flow measurement techniques with 80 percentile of an uncertainty of around 6%
once the errors had been taken into account. This shows that, despite the flow meters being opposite end of the treatment works that there is an agreement
between the two different measurement techniques.
Figure 2 - Channel where head limitations meant that area
velocity flow measurement was the intelligent choice
Figure 3 -Time of flight versus insertion flow measurement techniques
Page 16
About the Author
Oliver Grievson is the Flow & Instrumentation Specialist for the Foundation for Water Research as well as being a
Director of the Sensors for Water Interest Group and also Wastewater Education 501 (c)3 as well as being the group
manager of the Water Industry Process Automation & Control Group (WIPAC). He has had many years experience in
both the operation and engineering sides of the Water Industry and is currently a technical expert and manager in
flow and instrumentation regularly consulting & lecturing on both a national and international basis.
He is a Chartered Scientist, Environmentalist and Water & Environmental Manager as well as a Fellow of both CIWEM
& the Institute of Environmental Sciences and a Member of the Institute of Measurement & Control.
In our second case study a Time of Flight flow meter is compared to a insertion velocity measurement technique on a large bore pipe (see figure 3)
Comparing the flow measurement reveals that in a 26 day period, on average the two different flow meter technologies were within 3% of each other and
this rises to a 6% differential for 90% of the 2,402 readings are taken into account over the period. The results of this are shown in figure 4
Discussion
Area-velocity flow measurement is a current and accurate flow measurement technique that is of a significant benefit to the operation of the current water
industry. It is a proven and accurate technique that in a similar fashion to all measurement techniques must be applied to the right measurement conditions
and correctly installed for the measurement to work. At the current time the technique is being called into question as to the standards and verification
techniques to verify whether the measurement technique is operating as it should do.
For the more traditional techniques these are well established. For example for level based flow measurement with a primary device the use of simple
surveying techniques are used to ensure that the structure is bowed or warped beyond certain tolerances and what is acceptable and what is not acceptable
is set out in both the Minimum Standards for MCERTS and additionally in British Standards. For electromagnetic flow meters each instrument is minutely
inspected and calibrated within the factory environment to ensure that at the time of manufacture the instrument is working as it should be. The
closeness of the electronics to the factory calibration is checked by the user of the device at a period of their own choice and this ensures that the flow
meter is working correctly.
The Big Debate of course is that these techniques don’t exist for Area Velocity devices and therefore the accuracy of the measurement technique as installed
within a channel or pipe cannot necessarily be verified in a scientific or structured way and the user cannot independently ensure that the area velocity
measurement technique is working as it should. The level/area part of the technique is relatively simple and checking this is a relatively simple job that any
calibration engineer should be able to do as part of their daily routines. However when it comes to checking velocity readings the industry, at the
current time, is at somewhat of a loss and the standards that have been so carefully prepared for other measurement techniques don’t exist for area-
velocity techniques.
Without any doubt, the measurement of flow within the Water Industry needs the area-velocity technique for flow measurement to address the more
challenging of measurement techniques were installing traditional techniques become prohibitively expensive, dangerous or completely impractical. There
is knowledge and evidence within the Water Industry as to the accuracy of the technique for the measurement of wastewater. However, at the current
time the so-called “elephant in the room” with the technique is how to routinely prove via validation and calibration techniques that a flow measurement
system is recording as it should be.
The use of Area Velocity as a measurement technique will be openly discussed at this year’s WIPAC Flow Forum @WWEM on the 2nd November 2016 in
Telford in the United Kingdom. The day long session on Flow is free to attend for all those who have registered for the Water, Wastewater & Environmental
Monitoring Conference. For those interested please go to http://www.wwem.uk.com/ and select conference registration under the conference menu
80.00%
90.00%
100.00%
110.00%
120.00%
130.00%
140.00%
150.00%
160.00%
01/07/2016 00:00 07/07/2016 00:00 13/07/2016 00:00 19/07/2016 00:00
Comparative graph of measured flow differences between Time of Flight and an
Insertion Meter
Figure 4 - Graph comparing the two flow measurement techniques under test. A time of flight flow meter and an insertion flow meter
Page 17
Article:
Smart Water Semantics:
Meaningful Interoperability beyond
Data and Syntax
The water sector is being transformed through the use of smart systems, which aim to manage the assets and services they provide in a more sustainable
and economic manner. Smart water networks have been noted to promote efficacy, efficiency, and resilience in water infrastructure 1, 2
. They are based on
the use of data to make improved operational and investment decisions to lower risk, use of energy and financial resources. This is achieved through the use
and integration of sensors, analytics software, and decision support software.
In order to conduct research into Smart Water Networks, a European Commission cluster of projects, named ICT4Water 3
, is investigating the claims and
technologies behind them. These projects started between 2012 and 2015, and are finishing between 2015 and 2018. They are exploring ICT applications
across the water value chain, including clean water, wastewater, and consumer interventions.
One ICT4Water project is building an Internet of Things (IoT) water platform, as well as exploring domestic and industrial business services built on the
platform. This project is called WISDOM, or ‘Water analytics and Intelligent Sensing for Demand Optimised Management’. A big part of the project is
integrating and contextualising data from sensors across the water value chain, using knowledge-based systems. A central challenge for the exploitation of
smart water technologies is ensuring a shared meaning of the data between different pieces of software supplied by different vendors and researchers. This
is termed semantic interoperability. In order for programs to properly use data, its meaning must be properly interpreted. One way of achieving this is by
describing the meaning explicitly in a semantic model, such as in the form of an ‘ontology’.
The terms ‘semantics’ and ‘ontology’ come from the philosophical study of meaning, but are now used by the semantic web field to refer to a specific type
of knowledge model. These models assist interoperability by describing the objects in a domain in a machine-interpretable way, as well as the relationships
between them. They also describe the objects’ properties, and restrictions on how the model should be used, such as only allowing a circular pipe to have
one absolute diameter. It is true that common protocols and data communication methods are already being addressed, through initiatives such as the
internet of things 4
. However, semantic interoperability remains a largely untouched issue, and especially in the field of water management.
This challenge has been noted by the ICT4Water cluster as a critical obstacle 5
. The issue has already received significant attention in smart grids, given the
precedent set by the Institute of Electrical and Electronics Engineers in their guide to interoperability 6
. The issue is also receiving attention in the Smart City
field, after being highlighted in a seminal report on smart cities 7
.
Given this growing body of evidence, WISDOM decided to manage water data using a detailed semantic model. This was then used to support powerful
applications by offering integrated, coherent, and contextualised knowledge through a web interface. This semantic model took the form of a domain
ontology for the water sector. It was developed over 2 years through close collaboration with industrial partners, and a variety of stakeholders.
Page 18
The work has been built on previous efforts such as controlled vocabularies [8,9], a format for hydrologic time-series data 10
, and a data model of geospatial
utility networks 11
. The main advantages of the work are:
•	 The use of greater semantic expressivity (more detailed and machine-interpretable descriptions of meaning).
•	 Modelling the domain with more breadth and depth (including things like sensors, people and GIS descriptions).
•	 Using techniques to allow alignment with other smart city systems (e.g. smart grids) so that interoperability can be achieved with them in the future.
This process of building and using a domain ontology converts the raw data which comes from sensors. Specifically, the text and numbers, are converted into
machine interpretable knowledge: detailed and contextualised statements about the network. This is a big advantage when trying to apply things like artificial
intelligence, or advanced optimisation algorithms. By making the meaning of the data explicit, interoperability is achieved with more confidence, less cost, and
in less time. Further, by using an open knowledge model, you avoid vendor tie-in, and can build or change the data models as smartness develops, requiring
much less effort than traditional approaches.
The WISDOM ontology viewed the water sector as 3 parallel systems; physical, social, and cyber. Firstly, the physical ontology includes tangible components
of the network at two levels of detail. These were the network level and the asset level. The network level was based on a traditional GIS data schema. The
asset level provided a way to extend the ontology to describe devices and schematics at specific assets, such as pumping stations. One extension which covers
these details well is the Semantic Water Interoperability Model (SWIM) 12
. This captures 30+ years of water utility experience into semantic descriptions of
water assets and devices. Secondly, the WISDOM social modelling used two further levels of detail: organisational and personnel. Examples of these are the
relationships between utilities and regulators, and between functional managers within a utility. Finally, the cyber network modelling adapted a well-accepted
sensor ontology 13
for the water domain. This described sensors, data, and ICT objects.
From the detailed domain ontology, a comprehensive view of a utility’s network can be built. This can then be deployed as a web service with a standard
application programming interface (API). This has been delivered in WISDOM, and advanced business services have been built on top of it, including pumping
optimisation, combined sewer overflow spill predictions, and energy-water decision support.
A lot of ground has been covered by organisations like the European Commission, NASA and the Open Geospatial Consortium, and by projects such as WatERP,
SWIM and WISDOM. These have built a strong foundation for syntactic and semantic interoperability in the water sector, but there is a lot left to do. Critically,
these largely separate efforts should be brought together in a coherent manner by the water industry. This will deliver a semantic model which is necessary for
the next generation of truly smart water networks. The model will enable powerful interoperability across traditional silos in the water industry. The initiative
has to be driven by industry, through a mechanism which echoes the transformation the construction industry has recently undergone with BIM.
In the construction industry, BuildingSmart has standardised and driven the adoption of the industry foundation classes 14
. This has empowered stakeholders
through previously unheard of interoperability and a knowledge-driven culture, through an open semantic model. The water sector needs a similar initiative,
with the goal of developing, standardising, and driving the adoption of semantic models for the water sector. These models should use the latest advances in
ICT, such as the semantic web, big data, and cybersecurity. This will greatly accelerate the growth of smart water markets and unlock their potential impact on
the modernisation of the sector.
References
1.	 “CTRL+SWAN - Cloud Technologies & ReaL time monitoring + Smart WAter Network (AG126) | EIP Water.” [Online]. Available: http://www.eip-water.eu/
CTRL_SWAN. [Accessed: 18-Feb-2016].
2.	 SWAN, “What are smart water networks.” 2013.
3.	 ICT4Water Cluster. [Online]. Available: http://www.ict4water.eu/. [Accessed: 19-Jul-16].
4.	 “Hypercat - Home.” [Online]. Available: http://www.hypercat.io/. [Accessed: 01-Jun-2016].
5.	 ICT4Water, “ICT4Water standards report.” 2015.
6.	 IEEE Standards Committee, IEEE guide for smart grid interoperability of energy technology and information technology operation with the electric power
system (EPS), end-use applications and loads. New York, N.Y.: Institute of Electrical and Electronics Engineers, 2011.
7.	 ISO/IEC JTC1, “Smart Cities Preliminary Report,” 2014.
8.	 CUAHSI, “CUAHSI Hydrologic Information System - Hydrologic Ontology for Discovery.” [Online]. Available: http://his.cuahsi.org/ontologyfiles.html.
[Accessed: 23-Oct-2015].
9.	 SWEET, “SWEET Overview.” [Online]. Available: https://sweet.jpl.nasa.gov/. [Accessed: 23-Oct-2015].
10.	OGC, “WaterML2 - A Global Standard for Hydrological Time Series.” [Online]. Available: http://www.waterml2.org/. [Accessed: 18-Jan-2016].
11.	INSPIRE Thematic Working Group Utility and Government Services, “D2.8.III.6 Data Specification on Utility and Government Services – Technical
Guidelines,” European Commission Joint Research Centre, Dec. 2013.
12.	Aquamatix. SWIM: a semantic ontology for interoperability. 2014.
13.	M. Compton, et al., “The SSN ontology of the W3C semantic sensor network incubator group,” Web Semant. Sci. Serv. Agents World Wide Web, vol. 17, pp.
25–32, Dec. 2012.
14.	buildingSMART, “Industry Foundation Classes Version 4.” 2013
About the Author
Whilst conducting PhD research at Cardiff University for the past three years, Shaun Howell has assisted and led tasks
across six research projects relating to ICT in the built environment, and extended existing BIM and smart city
standards in line with UK agendas. This has resulted in the successful delivery of water and energy semantic
models to the EC, a retrofit energy management system which has shown 25% energy savings, and input towards
international OGC CityGML modelling standards. His PhD aims to contribute an open and extensible framework for
knowledge based systems and interoperability in smart cities, with case studies in energy and water systems at both
the building and city scales.
Page 19
Article:
Industrial Internet Of Things (IIoT):
Identifying The Vulnerabilities
Of Field Devices
The Industrial Internet of Things (IIoT) industry is growing at a rapid pace. By year-end 2015, an estimated 13.4 billion IoT connected devices had flooded the
global market. The number of connected devices is forecast to reach 38.5 billion by 2020.1 But why are so many companies working to develop IIoT devices?
Because most industrial processes are not fully automated, they are capital and labour intensive and need to find an effective way to identify network issues
and improve performance. The main draw of IIoT devices is that they can improve safety, reliability, and energy efficiency. These devices integrate sensors that
gather real-time or continuous data and connect to data analytics and control systems. Analyzing data trends is essential for delivering actionable insights in
order for utilities to prioritize network upgrades or monitor supply-demand mismatch. The smartest solutions not only offer data analytics software, but also
integrate with existing software and industrial control systems (ICS).
For example, sewer water levels can be monitored and programmed to send real-time alerts when the water level has reached a predetermined threshold in
order to prevent combined sewer overflow (CSO) events. Sensors can also be installed inside different types of equipment to monitor if measured parameters
exceed predetermined thresholds. This enables predictive maintenance — maintenance that can be scheduled before an equipment failure occurs, which
prevents expensive equipment replacements or repairs. Agriculture applications can monitor soil moisture levels, humidity, and pesticide usage. Farmers can
use this data to implement optimal crop growing conditions.2
These examples are illustrative of how IIoT devices can optimize operations for the user. But connecting devices also creates a network vulnerable to attack
and compromise.
As the number of connected devices increases, so do potentially devastating cyber threats. Cyber threats on critical infrastructure can have far more
damaging and widespread effects than individual terror attacks. A common method of attacking consumers using ransomware, a type of malware that infects
a computer and limits users from accessing the system until they pay a ransom. The Internet Crime Complaint Centre reported that from April 2014 to June
2015, damages caused by ransomware alone cost companies $18 million.3
Ransomware attacks primarily target consumers and therefore result in individual
and financial damages. However, attacks on critical infrastructure could cost billions and cause far greater damage.
An intentional shutdown or tampering with critical infrastructure data could result in power outages, toxic water levels, along with a communication
shutdown preventing emergency response. The rising concern is a twofold attack, while emergency workers are responding to a water main break, hackers
can attack a power plant and leave an entire city in the dark. Security experts continue to implement cyber defence strategies. However, with the increasing
risk of cyber wars no strategy is completely secure.
The Cost Of Cyber Threats
Three decades ago, malicious activity and cyberattacks were rarely an issue. But now threats have become a reality and cybersecurity has become an absolute
necessity. A recent study published by the Atlantic Council and the Zurich Insurance group estimates that cyberattacks could cost up to $90 trillion by 2030
if cybersecurity fails to advance at a rapid pace.4
Therefore, every IIoT company should be aware that their device can serve as a backdoor to an industrial
control system. ICS or Supervisory Control and Data Acquisition (SCADA) systems are extremely vulnerable, as they are the brain of critical infrastructure.
Surprisingly, companies still create devices with insufficient security technology, lacking even basic features such as authentication and authorization.
Without proper security, attackers can use these devices as an entry point into the SCADA system. Once the SCADA system is compromised, the attackers can
leak critical information and even reconfigure the programmable logic controllers (PLCs) to cause significant damage. For example, in a water utility this could
be executed by setting the water network to a very high pressure, resulting in network-wide pipe leaks and main breaks. False low sewer water level data could
be transmitted, resulting in CSO events which would flood the streets and result in public health and safety risks and heavy regulatory fines.
Even with cyber defense on the rise, there have been many more documented and undocumented attacks. There were over 160,000 reported attacks on
SCADA systems worldwide during 2013 and over 675,000 attacks in 2014. Many of the attacks were carried out by exploiting simple buffer overflows (e.g.,
feeding more data than the system’s temporary memory storage could hold), which can result in corrupted data, a program crash, or cause the execution
of malicious code. The number of unreported attacks is potentially significantly greater, as most companies are only required to report data breaches that
compromise payment or personal information.5
The threats to critical infrastructure are increasing, especially on infrastructure controlled by ICS. As our world becomes more connected, the potential scale
of damage to critical infrastructure begins to boggle the mind. In 2003, the infamous Northeast Blackout left 50 million people in eight states without power.
It cost around $6 billion and resulted in 11 fatalities.6
The power outage was caused by a software bug. Imagine the severity and scale of damage that could
have transpired had the blackout been caused intentionally by a hacker.
Securing An IIoT Device
As an IIoT company, Ayyeka developed a device that incorporates current best practices in cybersecurity. This paper will cover the key steps to securing an IIoT
devices and understanding device vulnerabilities. These include: embedding cybersecurity into the IT architecture, securing communication protocols, and
implementing additional security measures for delivering data to SCADA systems.
Page 20
The most basic security level is to install a firewall along with an intrusion detection system (IDS). Humans cannot be programmed to detect when a suspicious
person is looming on their property, but firewalls can. A firewall is run by security rules that control the incoming and outgoing network traffic as protection
from unauthorized attackers.
The next step is to encrypt sensitive data. For utilities, it is a given that hackers will try to intercept the communication from field devices. Therefore, it is
crucial to think like a hacker and identify the weakest link in the network and implement additional security measures. For example, encrypt all communications
between field devices and the SCADA system.
Investing In Cybersecurity
Devices that communicate from the field to a SCADA system create an entry point into the SCADA system. The most notorious example of a digital weapon
attacking a SCADA system was a malicious virus known as Stuxnet. The virus silently took over Iranian uranium enrichment plant for over a year without being
detected. Stuxnet manipulated the SCADA system and damaged the centrifuges as well as the enrichment process. Many believe the attack was carried out via
infected USB drives, clearly demonstrating the vulnerability of SCADA systems.7
After the attack made headlines, world leaders began to worry about their own
critical infrastructure and started to implement cybersecurity task forces to regulate security requirements.
Although these issues are under the radar for some private companies, the U.S. Federal Administration is investing in and enforcing stringent cybersecurity
regulations which will quickly spillover into the private sector. In the U.S. alone, the 2016 proposed national cybersecurity budget has reached $19 billion. The
budget includes a proposal for a National Centre for Cybersecurity Resilience where companies and organizations can test security measures by initiating a
cyberattack on a replica power grid, investing in enhanced cybersecurity, and securing the personal data of its many citizens. While government is taking a more
proactive approach, cyber-attackers continue to become increasingly sophisticated. Cyberattacks come in many forms.
After an IIoT company secures all the endpoints, the next step is securing the data. For example, in a water treatment plant, attackers could inject false
chlorine readings and then feed the false data to the SCADA system. It is very difficult to detect tampered data, which is why critical infrastructure operators
need to implement preventative security measures. A useful tool for preventing false data injection is an automated system to detect suspicious activity. For
example, when monitoring drinking water, if the pH level spikes, the chlorine levels are likely to drop. Machine learning algorithms can automatically learn such
relationships between various parameters and warn if one parameter deviates from its expected behaviour.
Cloud Storage And Reverse Entry Points
While cloud storage is the most common data storage method in the consumer market, many industrial end users prefer to bypass third-party cloud storage
and ensure the data is securely stored and delivered from field devices to their closed networks or SCADA systems. This can only be achieved by investing in
cybersecurity and ensuring seamless SCADA integration for end-users. Some government offices worry about the security of cloud storage when considering
the damage that could result if the data was accessed by someone intending to do harm. For this reason, companies should offer secure data transmission with
on-premises servers in addition to cloud storage. Non-critical data can be viewed on the cloud and used as an auxiliary system, entirely outside a SCADA system.
IIoT Devices: A Step-By-Step Security Strategy
It is critical to develop multilayered cybersecurity solutions that reduce the risk to the ICS. IIoT devices that deliver data to ICS need to have a communication
pathway that is secure and difficult to intercept. Ideally, devices should not be connected via a fixed IP address and wait for incoming connections — such
devices are sitting ducks begging to be infiltrated. Instead, devices should use dynamic IP addresses and initiate the data sessions to the SCADA system only
when needed. The logic is simple — it is easier to protect the SCADA side from malicious incoming connections than it is to protect the device side.
Authentication is just as important; it guarantees that unidentified devices cannot intercept the communication. An additional level of security is restricting the
device’s communication to short intervals and as soon as the data transmission is complete, the device shuts off the communication channel. Hackers looking
to attack a field device would have a narrow window to do so. They would need to call into the private network at the right time, successfully proceed past
authentication, and decipher the encryption, which is difficult to achieve.
Endpoint Security For Cellular IIoT Devices
Endpoint security is just as important for IIoT devices. The device must meet certain criteria before transmitting data to an internal server or cloud storage.
Since many IIoT devices communicate over cellular networks, they use SIM cards. Many end users rely on cellular operators to provide them with a ‘secured’
Access Point Name (APN). They assume the information is secure and therefore do not encrypt their data. But how can one secure something one does not
control? APNs lack full security monitoring capabilities, thus securing the endpoints and encrypting the data is vital. If an unauthorized user gains access to the
SIM card, they could easily access all the devices under the same APN.
IIoT is built upon a device to device communication, or Machine to Machine (M2M) communication. Sensors enable us to measure and monitor almost
anything. Integrating sensors with IIoT devices enables equipment (like a water tank) to become a smart device and transmit data to an internal server or cloud
based software.
When considering reverse entry points to ICS, many overlook the vulnerability of sensors because they have yet to be reported in malicious attacks. A cyber-
attacker can easily uninstall a sensor from an IIoT device and reinstall a malicious sensor to feed false data to the control system. Worse yet, an attacker could
use the sensor as an entry point into the SCADA system and carry out an attack and damage critical infrastructure. The best way to protect the sensor is through
sensor fingerprinting, which provides an additional layer of authentication. Moreover, sensors with built-in alarms can be programmed to send an alert anytime
a sensor is tampered with. These two security features are designed to prevent unauthorized users from accessing or tampering with the sensor.
Best Practices In Cybersecurity
Cybersecurity is not a one-time investment. Each and every utility and critical infrastructure operator needs to take into account every device that has
Page 21
About the Author
Michelle Nadboy is responsible for marketing and business development at Ayyeka, a technology company that develops end-
to-end remote monitoring solutions for industrial and environmental applications. Prior to Ayyeka, Michelle worked in both
the private and public sectors with a focus on environmental and sustainability issues. She holds an M.Sc. in Sustainability
Management from Columbia University and a B.A. in Environmental Law and Policy from Binghamton University.
Ayyeka provides cyber-secure, plug-and-play, remote monitoring solutions designed for various markets. Founded in 2011,
Ayyeka has a successful installed base in challenging locations and earned a reputation for excellent sales and service.
Bringing together a state-of-the-art hardware and cloud-based software package, Ayyeka’s solutions are leading the
infrastructure monitoring sector into the future.
communication capabilities. Cyber protections require a holistic approach; a customized solution should be designed for each utility and operator. It begins
with assessing every component in the internal network and identifying the devices with communication capabilities supplied by external vendors.
Ayyeka researches and invests in implementing best practices in the IIoT industry: this includes encrypting data, using a private network or subnet for field
deployed devices, authentication, minimizing the usage of the device’s communication channel, restricting the communication between the device and the ICS,
and securing the sensor. Security features should be designed to protect the SCADA system and to secure every connection point where data is being collected
and delivered. Today, more advanced sensors are being developed and integrated with autonomous IIoT devices. Cybersecurity must evolve and anticipate
more sophisticated and creative attacks.
There are currently over 13 billion connected devices operating in the field; each device likely has at least one loophole or backdoor that could serve as an
entry into critical infrastructure data. Therefore, we have a pressing need to secure all these devices before we continue to flood the market with additional
IIoT devices. Advanced cybersecurity practices need to be implemented now; before we reach a point of no return, with the predicted 38.5 billion insecure
IoT devices deployed in the field.
References
1.	 “‘Internet of Things’ Connected Devices to Almost Triple to Over 38 Billion Units by 2020.” Juniper Research, 28 July 2015. Web. Retrieved 8 Mar. 2016.
http://www. juniperresearch.com/press/press-releases/iot-connected-devices-to-triple-to-38-bn-by-2020
2.	 “Internet of Things: Example Applications.” Internet of Things. Postscapes, n.d. Web. 30 May 2016. http://postscapes.com/internet-of-things-examples/
3.	 FBI, IC3. “Internet Crime Complaint Centre (IC3) Criminals Continue to Defraud and Extort Funds from Victims Using CryptoWall Ransomware Schemes.”
Internet Crime Complaint Centre. 23 June 2015. Web. Retrieved 10 March 2016. http://www.ic3.gov/media/2015/150623.aspx
4.	 Morgan, Steven C. “Cyber Security Market Report.” Cyber-Security Ventures. People’s Communications Inc., 3 Aug. 2015. Web. 21 Mar. 2016. http:// cyber-
securityventures.com/cybersecurity-market-report-q3-2015/
5.	 “SCADA Vulnerability on the Rise | EE Times.” EETimes. Rich Quinnell, 24 Sept. 2015. Web. 26 Apr. 2016. http://www.eetimes.com/document.asp?doc_
id=1327785
6.	 Minkel, J. R. “The 2003 Northeast Blackout -Five Years Later.” Scientific American, 13 Aug. 2008. Retrieved 8 Mar. 2016. http://www.scientificamerican.com/
article/2003-blackout-five-years-later/
7.	 Kushner, David. “The Real Story of Stuxnet.” IEEE Spectrum. N.p., 23 Feb. 2016. Web. 1 June 2016. http://spectrum.ieee.org/telecom/security/the-real-
story-of- stuxnet
8.	 “FACT SHEET: Cybersecurity National Action Plan.” The White House. Office of the Press Secretary, 09 Feb. 2016. Web. 01 June 2016. https://www.white-
house.gov/ the-press-office/2016/02/09/fact-sheet-cybersecurity-national-action-plan
Page 22
WIPAC Monthly - July 2016

More Related Content

What's hot

The Internet of Things: An Overview
The Internet of Things: An OverviewThe Internet of Things: An Overview
The Internet of Things: An OverviewAli Babaoglan Blog
 
Predicting Big Data Adoption in Companies With an Explanatory and Predictive ...
Predicting Big Data Adoption in Companies With an Explanatory and Predictive ...Predicting Big Data Adoption in Companies With an Explanatory and Predictive ...
Predicting Big Data Adoption in Companies With an Explanatory and Predictive ...eraser Juan José Calderón
 
Run through of Resourceful and Sustainable Computing Source: Green Computing
Run through of Resourceful and Sustainable Computing Source: Green ComputingRun through of Resourceful and Sustainable Computing Source: Green Computing
Run through of Resourceful and Sustainable Computing Source: Green ComputingIRJET Journal
 
Eventrys Company Presentation
Eventrys Company PresentationEventrys Company Presentation
Eventrys Company PresentationTatyana Larin
 
big data Big Things
big data Big Thingsbig data Big Things
big data Big Thingspateelhs
 
Big Data Analytics: A New Business Opportunity
Big Data Analytics: A New Business OpportunityBig Data Analytics: A New Business Opportunity
Big Data Analytics: A New Business OpportunityEdward Curry
 
A Statistician's 'Big Tent' View on Big Data and Data Science (Version 8)
A Statistician's 'Big Tent' View on Big Data and Data Science (Version 8)A Statistician's 'Big Tent' View on Big Data and Data Science (Version 8)
A Statistician's 'Big Tent' View on Big Data and Data Science (Version 8)Prof. Dr. Diego Kuonen
 

What's hot (9)

The Internet of Things: An Overview
The Internet of Things: An OverviewThe Internet of Things: An Overview
The Internet of Things: An Overview
 
Predicting Big Data Adoption in Companies With an Explanatory and Predictive ...
Predicting Big Data Adoption in Companies With an Explanatory and Predictive ...Predicting Big Data Adoption in Companies With an Explanatory and Predictive ...
Predicting Big Data Adoption in Companies With an Explanatory and Predictive ...
 
Run through of Resourceful and Sustainable Computing Source: Green Computing
Run through of Resourceful and Sustainable Computing Source: Green ComputingRun through of Resourceful and Sustainable Computing Source: Green Computing
Run through of Resourceful and Sustainable Computing Source: Green Computing
 
The Digital Enterprise
The Digital EnterpriseThe Digital Enterprise
The Digital Enterprise
 
Eventrys Company Presentation
Eventrys Company PresentationEventrys Company Presentation
Eventrys Company Presentation
 
Impact of data overloading on productivity
Impact of data overloading on productivityImpact of data overloading on productivity
Impact of data overloading on productivity
 
big data Big Things
big data Big Thingsbig data Big Things
big data Big Things
 
Big Data Analytics: A New Business Opportunity
Big Data Analytics: A New Business OpportunityBig Data Analytics: A New Business Opportunity
Big Data Analytics: A New Business Opportunity
 
A Statistician's 'Big Tent' View on Big Data and Data Science (Version 8)
A Statistician's 'Big Tent' View on Big Data and Data Science (Version 8)A Statistician's 'Big Tent' View on Big Data and Data Science (Version 8)
A Statistician's 'Big Tent' View on Big Data and Data Science (Version 8)
 

Similar to WIPAC Monthly - July 2016

Similar to WIPAC Monthly - July 2016 (20)

WIPAC Monthly - December 2015
WIPAC Monthly - December 2015WIPAC Monthly - December 2015
WIPAC Monthly - December 2015
 
WIPAC Monthly - February 2020
WIPAC Monthly - February 2020WIPAC Monthly - February 2020
WIPAC Monthly - February 2020
 
WIPAC Monthly - January 2016
WIPAC Monthly - January 2016WIPAC Monthly - January 2016
WIPAC Monthly - January 2016
 
WIPAC Monthly - October 2023
WIPAC Monthly - October 2023WIPAC Monthly - October 2023
WIPAC Monthly - October 2023
 
WIPAC Monthly June 2020
WIPAC Monthly June 2020WIPAC Monthly June 2020
WIPAC Monthly June 2020
 
WIPAC Monthly - July 2023.pdf
WIPAC Monthly - July 2023.pdfWIPAC Monthly - July 2023.pdf
WIPAC Monthly - July 2023.pdf
 
WIPAC Monthly - January 2023.pdf
WIPAC Monthly - January 2023.pdfWIPAC Monthly - January 2023.pdf
WIPAC Monthly - January 2023.pdf
 
WIPAC Monthly February 2018
WIPAC Monthly   February 2018WIPAC Monthly   February 2018
WIPAC Monthly February 2018
 
WIPAC Monthly - February 2016
WIPAC Monthly - February 2016WIPAC Monthly - February 2016
WIPAC Monthly - February 2016
 
WIPAC Monthly - November 2016
WIPAC Monthly - November 2016WIPAC Monthly - November 2016
WIPAC Monthly - November 2016
 
WIPAC Monthly - November 2020
WIPAC Monthly - November 2020WIPAC Monthly - November 2020
WIPAC Monthly - November 2020
 
WIPAC Monthly August 2021
WIPAC Monthly August 2021WIPAC Monthly August 2021
WIPAC Monthly August 2021
 
WIPAC Monthly - May 2017
WIPAC Monthly - May 2017WIPAC Monthly - May 2017
WIPAC Monthly - May 2017
 
WIPAC Monthly July 2020
WIPAC Monthly July 2020WIPAC Monthly July 2020
WIPAC Monthly July 2020
 
WIPAC Monthly - February 2017
WIPAC Monthly - February 2017WIPAC Monthly - February 2017
WIPAC Monthly - February 2017
 
WIPAC Monthly - May 2022
WIPAC Monthly - May 2022WIPAC Monthly - May 2022
WIPAC Monthly - May 2022
 
WIPAC Monthly - February 2021
WIPAC Monthly - February 2021WIPAC Monthly - February 2021
WIPAC Monthly - February 2021
 
WIPAC Monthly - April 2018
WIPAC Monthly - April 2018WIPAC Monthly - April 2018
WIPAC Monthly - April 2018
 
WIPAC Monthly - April 2017
WIPAC Monthly - April 2017WIPAC Monthly - April 2017
WIPAC Monthly - April 2017
 
WIPAC Monthly - July 2017
WIPAC Monthly - July 2017WIPAC Monthly - July 2017
WIPAC Monthly - July 2017
 

More from Water Industry Process Automation & Control

More from Water Industry Process Automation & Control (20)

Water Industry Process Automation & Control Monthly - April 2024
Water Industry Process Automation & Control Monthly - April 2024Water Industry Process Automation & Control Monthly - April 2024
Water Industry Process Automation & Control Monthly - April 2024
 
WIPAC Monthly Magazine - February 2024
WIPAC Monthly Magazine  -  February 2024WIPAC Monthly Magazine  -  February 2024
WIPAC Monthly Magazine - February 2024
 
WIPAC Monthly - January 2024.pdf
WIPAC Monthly - January 2024.pdfWIPAC Monthly - January 2024.pdf
WIPAC Monthly - January 2024.pdf
 
WIPAC Monthly - November & December 2023
WIPAC Monthly - November & December  2023WIPAC Monthly - November & December  2023
WIPAC Monthly - November & December 2023
 
WIPAC Monthly - September 2023
WIPAC Monthly - September 2023WIPAC Monthly - September 2023
WIPAC Monthly - September 2023
 
WIPAC Monthly - August 2023.pdf
WIPAC Monthly - August 2023.pdfWIPAC Monthly - August 2023.pdf
WIPAC Monthly - August 2023.pdf
 
WIPAC Monthly - June 2023.pdf
WIPAC Monthly - June 2023.pdfWIPAC Monthly - June 2023.pdf
WIPAC Monthly - June 2023.pdf
 
WIPAC Monthly - May 2023.pdf
WIPAC Monthly - May 2023.pdfWIPAC Monthly - May 2023.pdf
WIPAC Monthly - May 2023.pdf
 
WIPAC Monthly - April 2023.pdf
WIPAC Monthly - April 2023.pdfWIPAC Monthly - April 2023.pdf
WIPAC Monthly - April 2023.pdf
 
WIPAC Monthly - March 2023.pdf
WIPAC Monthly - March 2023.pdfWIPAC Monthly - March 2023.pdf
WIPAC Monthly - March 2023.pdf
 
WIPAC Monthly - February 2023.pdf
WIPAC Monthly - February 2023.pdfWIPAC Monthly - February 2023.pdf
WIPAC Monthly - February 2023.pdf
 
WIPAC Monthly - December 2022.pdf
WIPAC Monthly - December 2022.pdfWIPAC Monthly - December 2022.pdf
WIPAC Monthly - December 2022.pdf
 
WIPAC Monthly - October 2022.pdf
WIPAC Monthly - October 2022.pdfWIPAC Monthly - October 2022.pdf
WIPAC Monthly - October 2022.pdf
 
WIPAC Monthly - September 2022.pdf
WIPAC Monthly - September 2022.pdfWIPAC Monthly - September 2022.pdf
WIPAC Monthly - September 2022.pdf
 
WIPAC Monthly - August 2022.pdf
WIPAC Monthly - August 2022.pdfWIPAC Monthly - August 2022.pdf
WIPAC Monthly - August 2022.pdf
 
WIPAC Monthly - July 2022.pdf
WIPAC Monthly - July 2022.pdfWIPAC Monthly - July 2022.pdf
WIPAC Monthly - July 2022.pdf
 
WIPAC Monthly - June 2022.pdf
WIPAC Monthly - June 2022.pdfWIPAC Monthly - June 2022.pdf
WIPAC Monthly - June 2022.pdf
 
WIPAC Monthly - April 2022.pdf
WIPAC Monthly - April 2022.pdfWIPAC Monthly - April 2022.pdf
WIPAC Monthly - April 2022.pdf
 
WIPAC Monthly - March 2022
WIPAC Monthly - March 2022WIPAC Monthly - March 2022
WIPAC Monthly - March 2022
 
WIPAC Monthly - February 2022
WIPAC Monthly - February 2022WIPAC Monthly - February 2022
WIPAC Monthly - February 2022
 

Recently uploaded

(MEERA) Dapodi Call Girls Just Call 7001035870 [ Cash on Delivery ] Pune Escorts
(MEERA) Dapodi Call Girls Just Call 7001035870 [ Cash on Delivery ] Pune Escorts(MEERA) Dapodi Call Girls Just Call 7001035870 [ Cash on Delivery ] Pune Escorts
(MEERA) Dapodi Call Girls Just Call 7001035870 [ Cash on Delivery ] Pune Escortsranjana rawat
 
MANUFACTURING PROCESS-II UNIT-2 LATHE MACHINE
MANUFACTURING PROCESS-II UNIT-2 LATHE MACHINEMANUFACTURING PROCESS-II UNIT-2 LATHE MACHINE
MANUFACTURING PROCESS-II UNIT-2 LATHE MACHINESIVASHANKAR N
 
(ANVI) Koregaon Park Call Girls Just Call 7001035870 [ Cash on Delivery ] Pun...
(ANVI) Koregaon Park Call Girls Just Call 7001035870 [ Cash on Delivery ] Pun...(ANVI) Koregaon Park Call Girls Just Call 7001035870 [ Cash on Delivery ] Pun...
(ANVI) Koregaon Park Call Girls Just Call 7001035870 [ Cash on Delivery ] Pun...ranjana rawat
 
chaitra-1.pptx fake news detection using machine learning
chaitra-1.pptx  fake news detection using machine learningchaitra-1.pptx  fake news detection using machine learning
chaitra-1.pptx fake news detection using machine learningmisbanausheenparvam
 
Introduction to Multiple Access Protocol.pptx
Introduction to Multiple Access Protocol.pptxIntroduction to Multiple Access Protocol.pptx
Introduction to Multiple Access Protocol.pptxupamatechverse
 
High Profile Call Girls Nagpur Isha Call 7001035870 Meet With Nagpur Escorts
High Profile Call Girls Nagpur Isha Call 7001035870 Meet With Nagpur EscortsHigh Profile Call Girls Nagpur Isha Call 7001035870 Meet With Nagpur Escorts
High Profile Call Girls Nagpur Isha Call 7001035870 Meet With Nagpur Escortsranjana rawat
 
Architect Hassan Khalil Portfolio for 2024
Architect Hassan Khalil Portfolio for 2024Architect Hassan Khalil Portfolio for 2024
Architect Hassan Khalil Portfolio for 2024hassan khalil
 
College Call Girls Nashik Nehal 7001305949 Independent Escort Service Nashik
College Call Girls Nashik Nehal 7001305949 Independent Escort Service NashikCollege Call Girls Nashik Nehal 7001305949 Independent Escort Service Nashik
College Call Girls Nashik Nehal 7001305949 Independent Escort Service NashikCall Girls in Nagpur High Profile
 
What are the advantages and disadvantages of membrane structures.pptx
What are the advantages and disadvantages of membrane structures.pptxWhat are the advantages and disadvantages of membrane structures.pptx
What are the advantages and disadvantages of membrane structures.pptxwendy cai
 
VIP Call Girls Service Kondapur Hyderabad Call +91-8250192130
VIP Call Girls Service Kondapur Hyderabad Call +91-8250192130VIP Call Girls Service Kondapur Hyderabad Call +91-8250192130
VIP Call Girls Service Kondapur Hyderabad Call +91-8250192130Suhani Kapoor
 
Call Girls Service Nagpur Tanvi Call 7001035870 Meet With Nagpur Escorts
Call Girls Service Nagpur Tanvi Call 7001035870 Meet With Nagpur EscortsCall Girls Service Nagpur Tanvi Call 7001035870 Meet With Nagpur Escorts
Call Girls Service Nagpur Tanvi Call 7001035870 Meet With Nagpur EscortsCall Girls in Nagpur High Profile
 
Processing & Properties of Floor and Wall Tiles.pptx
Processing & Properties of Floor and Wall Tiles.pptxProcessing & Properties of Floor and Wall Tiles.pptx
Processing & Properties of Floor and Wall Tiles.pptxpranjaldaimarysona
 
APPLICATIONS-AC/DC DRIVES-OPERATING CHARACTERISTICS
APPLICATIONS-AC/DC DRIVES-OPERATING CHARACTERISTICSAPPLICATIONS-AC/DC DRIVES-OPERATING CHARACTERISTICS
APPLICATIONS-AC/DC DRIVES-OPERATING CHARACTERISTICSKurinjimalarL3
 
main PPT.pptx of girls hostel security using rfid
main PPT.pptx of girls hostel security using rfidmain PPT.pptx of girls hostel security using rfid
main PPT.pptx of girls hostel security using rfidNikhilNagaraju
 
MANUFACTURING PROCESS-II UNIT-5 NC MACHINE TOOLS
MANUFACTURING PROCESS-II UNIT-5 NC MACHINE TOOLSMANUFACTURING PROCESS-II UNIT-5 NC MACHINE TOOLS
MANUFACTURING PROCESS-II UNIT-5 NC MACHINE TOOLSSIVASHANKAR N
 
the ladakh protest in leh ladakh 2024 sonam wangchuk.pptx
the ladakh protest in leh ladakh 2024 sonam wangchuk.pptxthe ladakh protest in leh ladakh 2024 sonam wangchuk.pptx
the ladakh protest in leh ladakh 2024 sonam wangchuk.pptxhumanexperienceaaa
 
(SHREYA) Chakan Call Girls Just Call 7001035870 [ Cash on Delivery ] Pune Esc...
(SHREYA) Chakan Call Girls Just Call 7001035870 [ Cash on Delivery ] Pune Esc...(SHREYA) Chakan Call Girls Just Call 7001035870 [ Cash on Delivery ] Pune Esc...
(SHREYA) Chakan Call Girls Just Call 7001035870 [ Cash on Delivery ] Pune Esc...ranjana rawat
 
(RIA) Call Girls Bhosari ( 7001035870 ) HI-Fi Pune Escorts Service
(RIA) Call Girls Bhosari ( 7001035870 ) HI-Fi Pune Escorts Service(RIA) Call Girls Bhosari ( 7001035870 ) HI-Fi Pune Escorts Service
(RIA) Call Girls Bhosari ( 7001035870 ) HI-Fi Pune Escorts Serviceranjana rawat
 
Call for Papers - African Journal of Biological Sciences, E-ISSN: 2663-2187, ...
Call for Papers - African Journal of Biological Sciences, E-ISSN: 2663-2187, ...Call for Papers - African Journal of Biological Sciences, E-ISSN: 2663-2187, ...
Call for Papers - African Journal of Biological Sciences, E-ISSN: 2663-2187, ...Christo Ananth
 

Recently uploaded (20)

(MEERA) Dapodi Call Girls Just Call 7001035870 [ Cash on Delivery ] Pune Escorts
(MEERA) Dapodi Call Girls Just Call 7001035870 [ Cash on Delivery ] Pune Escorts(MEERA) Dapodi Call Girls Just Call 7001035870 [ Cash on Delivery ] Pune Escorts
(MEERA) Dapodi Call Girls Just Call 7001035870 [ Cash on Delivery ] Pune Escorts
 
MANUFACTURING PROCESS-II UNIT-2 LATHE MACHINE
MANUFACTURING PROCESS-II UNIT-2 LATHE MACHINEMANUFACTURING PROCESS-II UNIT-2 LATHE MACHINE
MANUFACTURING PROCESS-II UNIT-2 LATHE MACHINE
 
(ANVI) Koregaon Park Call Girls Just Call 7001035870 [ Cash on Delivery ] Pun...
(ANVI) Koregaon Park Call Girls Just Call 7001035870 [ Cash on Delivery ] Pun...(ANVI) Koregaon Park Call Girls Just Call 7001035870 [ Cash on Delivery ] Pun...
(ANVI) Koregaon Park Call Girls Just Call 7001035870 [ Cash on Delivery ] Pun...
 
chaitra-1.pptx fake news detection using machine learning
chaitra-1.pptx  fake news detection using machine learningchaitra-1.pptx  fake news detection using machine learning
chaitra-1.pptx fake news detection using machine learning
 
Introduction to Multiple Access Protocol.pptx
Introduction to Multiple Access Protocol.pptxIntroduction to Multiple Access Protocol.pptx
Introduction to Multiple Access Protocol.pptx
 
High Profile Call Girls Nagpur Isha Call 7001035870 Meet With Nagpur Escorts
High Profile Call Girls Nagpur Isha Call 7001035870 Meet With Nagpur EscortsHigh Profile Call Girls Nagpur Isha Call 7001035870 Meet With Nagpur Escorts
High Profile Call Girls Nagpur Isha Call 7001035870 Meet With Nagpur Escorts
 
Architect Hassan Khalil Portfolio for 2024
Architect Hassan Khalil Portfolio for 2024Architect Hassan Khalil Portfolio for 2024
Architect Hassan Khalil Portfolio for 2024
 
9953056974 Call Girls In South Ex, Escorts (Delhi) NCR.pdf
9953056974 Call Girls In South Ex, Escorts (Delhi) NCR.pdf9953056974 Call Girls In South Ex, Escorts (Delhi) NCR.pdf
9953056974 Call Girls In South Ex, Escorts (Delhi) NCR.pdf
 
College Call Girls Nashik Nehal 7001305949 Independent Escort Service Nashik
College Call Girls Nashik Nehal 7001305949 Independent Escort Service NashikCollege Call Girls Nashik Nehal 7001305949 Independent Escort Service Nashik
College Call Girls Nashik Nehal 7001305949 Independent Escort Service Nashik
 
What are the advantages and disadvantages of membrane structures.pptx
What are the advantages and disadvantages of membrane structures.pptxWhat are the advantages and disadvantages of membrane structures.pptx
What are the advantages and disadvantages of membrane structures.pptx
 
VIP Call Girls Service Kondapur Hyderabad Call +91-8250192130
VIP Call Girls Service Kondapur Hyderabad Call +91-8250192130VIP Call Girls Service Kondapur Hyderabad Call +91-8250192130
VIP Call Girls Service Kondapur Hyderabad Call +91-8250192130
 
Call Girls Service Nagpur Tanvi Call 7001035870 Meet With Nagpur Escorts
Call Girls Service Nagpur Tanvi Call 7001035870 Meet With Nagpur EscortsCall Girls Service Nagpur Tanvi Call 7001035870 Meet With Nagpur Escorts
Call Girls Service Nagpur Tanvi Call 7001035870 Meet With Nagpur Escorts
 
Processing & Properties of Floor and Wall Tiles.pptx
Processing & Properties of Floor and Wall Tiles.pptxProcessing & Properties of Floor and Wall Tiles.pptx
Processing & Properties of Floor and Wall Tiles.pptx
 
APPLICATIONS-AC/DC DRIVES-OPERATING CHARACTERISTICS
APPLICATIONS-AC/DC DRIVES-OPERATING CHARACTERISTICSAPPLICATIONS-AC/DC DRIVES-OPERATING CHARACTERISTICS
APPLICATIONS-AC/DC DRIVES-OPERATING CHARACTERISTICS
 
main PPT.pptx of girls hostel security using rfid
main PPT.pptx of girls hostel security using rfidmain PPT.pptx of girls hostel security using rfid
main PPT.pptx of girls hostel security using rfid
 
MANUFACTURING PROCESS-II UNIT-5 NC MACHINE TOOLS
MANUFACTURING PROCESS-II UNIT-5 NC MACHINE TOOLSMANUFACTURING PROCESS-II UNIT-5 NC MACHINE TOOLS
MANUFACTURING PROCESS-II UNIT-5 NC MACHINE TOOLS
 
the ladakh protest in leh ladakh 2024 sonam wangchuk.pptx
the ladakh protest in leh ladakh 2024 sonam wangchuk.pptxthe ladakh protest in leh ladakh 2024 sonam wangchuk.pptx
the ladakh protest in leh ladakh 2024 sonam wangchuk.pptx
 
(SHREYA) Chakan Call Girls Just Call 7001035870 [ Cash on Delivery ] Pune Esc...
(SHREYA) Chakan Call Girls Just Call 7001035870 [ Cash on Delivery ] Pune Esc...(SHREYA) Chakan Call Girls Just Call 7001035870 [ Cash on Delivery ] Pune Esc...
(SHREYA) Chakan Call Girls Just Call 7001035870 [ Cash on Delivery ] Pune Esc...
 
(RIA) Call Girls Bhosari ( 7001035870 ) HI-Fi Pune Escorts Service
(RIA) Call Girls Bhosari ( 7001035870 ) HI-Fi Pune Escorts Service(RIA) Call Girls Bhosari ( 7001035870 ) HI-Fi Pune Escorts Service
(RIA) Call Girls Bhosari ( 7001035870 ) HI-Fi Pune Escorts Service
 
Call for Papers - African Journal of Biological Sciences, E-ISSN: 2663-2187, ...
Call for Papers - African Journal of Biological Sciences, E-ISSN: 2663-2187, ...Call for Papers - African Journal of Biological Sciences, E-ISSN: 2663-2187, ...
Call for Papers - African Journal of Biological Sciences, E-ISSN: 2663-2187, ...
 

WIPAC Monthly - July 2016

  • 1. Page 1 WIPAC MONTHLYThe Monthly Update from Water Industry Process Automation & Control www.wipac.org.uk Issue 7/2016 - July 2016
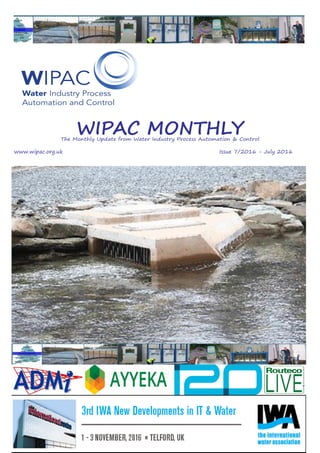
  • 2. Page 2 In this Issue From the Editor.................................................................................................................... 3 Industry News..................................................................................................................... 4 - 12 Highlights of the news of the month from the global water industry centred around the successes of a few of the companies in the global market. Smart Water Networks to become pervasive..................................................................... 13-14 In this month’s opinion article, Joel Hagan of i2O discusses the trend in the exploitation of Smart Water Networks in the potable water side of the industry and the need for the technology to become all pervasive across the industry in order to operate efficiently across the industry as a whole The Great Area Velocity Debate......................................................................................... 15-17 In the UK Water Industry at the current time the use of Area Velocity flow measurement for the regulated measurement of flow is being debated. In this article by Oliver Grievson the theory of area velocity measurement is discussed along with case studies of its accuracy from the field and how the validity of measurement is being demonstrated moving forwards. Smart Water Semantics: Meaningful Interoperability beyond data & syntax..................... 18-19 The subject of semantics within data in the Water Industry is a subject that has been discussed for many years. In this article by Shaun Howell of Cardiff University he discusses the need to bring together the work that has already been done by the international community in the development of semantics and the need to produce a single semantic model so that the Global Water Industry can realise the true benefit of the Smart Water Industry. Industrial IoT identifying the threat of field devices.............................................................. 20-22 In this article originally published on Water Online, Michelle Nadboy of Ayyeka discusses the threat that field devices pose to cyber security and what steps can be taken in the Industrial Internet of Things to ensure that potential points of risk that are created can be protected against/ Workshops, Conferences & Seminars................................................................................... 23-24 The highlights of the conferences and workshops in the coming months WIPAC Monthly is a publication of the Water Industry Process Automation & Control Group. It is produced by the group manager and WIPAC Monthly Editor, Oliver Grievson. This is a free publication for the benefit of the Water Industry and please feel free to distribute to any who you may feel benefit. All enquires about WIPAC Monthly, including those who want to publish news or articles within these pages, should be directed to the publications editor, Oliver Grievson The pictures on the front cover this month is a photo of the OTT Hydrometry’s phosphate monitor, the Cycle P, in place at Lake Windermere in the UK
  • 3. Page 3 From the Editor Each month I have a hope that I can finally have that Eureka moment with the Water Industry when I can say “I think they have gone and got it,” and each month I force myself to say “we’re close but no cigar,” as yet but as an industry I am forced to say “we’re getting there.” That is to say we are at least talking about getting there. But what am I talking about......of course one of my favourite subjects.....the subject of data, its use and its conversion to useful information. The guidance in the UK Water Industry has been that of moving away from the old ways of working and building are way out of trouble by constructing bigger and bigger structures in shiny concrete and moving towards actually being able to operate the structures that we built five, ten or even twenty years ago or the additional package plant that we added to the process. It is a step change for an industry that has been, until now, incentivised on building stuff. What of course we are finding is that some of the data that we gathered those five, ten or twenty years ago was of course fundamentally flawed as there was little quality control. If we’re really lucky the data errors resulted in things being oversized and inefficient but in the end of the day works. The unlucky minority which were undersized means a return to the drawing board and an extension of the design. Its amazing what situations bad data can lead to. So what is different now....why are we changing and how are we changing? Well firstly, the difficult step of admitting that there is a problem, taking off the glasses and noticing the elephant in the room is actually in the room and causing a problem has been, I think, acknowledged by the majority. Data Richness/Information Poverty exists!! Its not the stuff of myth & legend. This, for me, has been acknowledged by the majority of the global industry. The research is happening...you only have to look at the IWA Conference that WIPAC is involved in organising to see the popularity of the project. I have certainly been approached by I don’t know how many people at the moment to take part in the next big “ Data in the Water Industry project” and organisations around the world are arranging “meeting on the use of data and analytics” but in this we have to take care in what we are doing and where we are going so as to not clash with other things going on and other ways of working. Reading a press release this afternoon about the announcement of the formation of a discussion group on data and work that the group are planning the question that came to mind was whether the group were aware of and looking at the work that has already been done on semantics (see Shaun Howell’s article in this issue) or had even talked to their colleagues in telemetry who of course are the people who are going to be the one’s collecting all the data. All of this forces me to reflect on the situation and ask the question of • Have we got there; or • Are we getting there; or • Have we even started yet It is of course a question of where the Water Industry is in their maturity in using data. Where are we on the maturity scale in the management of data and the processes surrounding the management of data 1. Initial - the desirable processes are non-existent or ad hoc, with no organisational oversight. 2. Repeatable - processes are becoming refined and repeatable, but only within the scope of individual teams or projects. There are no organisational standards. 3. Defined - processes are standardised within the organisation based on best practices identified internally or from external sources. Knowledge and best practices start to be shared internally. However the processes may still not be widely adopted. 4. Managed - the organisation has widely adopted the standard processes and begins monitors them using defined metrics. 5. Optimising - the organisation is attempting to optimise and rene its process to increase efficiency within the organisation and, more widely, within its business sector. These are of course broad strokes but they do depend upon the global industry coming together to formulate the basics of the use of data and information in the water industry and then competing upon the steps beyond the basic level as to go forward and formulate the basics separately is bound to result in failure and this of course, when it comes to the use of data, is a terrible result for the Water Industry. So, let’s come together, under whatever banner we choose to unite under and openly discuss the standards around data, the semantics and the common language of data and establish the “vocabulary” between us all and then once we’ve done that move on from there. November is a natural place to start all of this , so whose coming? Have a good month Oliver
  • 4. Registration opens for Water Sector’s ‘Big Data’ Conference Big Data’ and the ‘Internet of Things are starting to affect every industry, and the water sector is no exception. The forthcoming International Water Association (IWA) Conference, entitled: ‘New Developments in IT & Water,’ will therefore provide an update on how data collection and processing is affecting the management of water and wastewater, and how it will develop in the future. The IWA Conference will run alongside WWEM 2016 in Telford (UK) 2-3rd November 2016, and registration for both events is now open at www.wwem.uk.com. With high profile speakers from 14 different countries, the IWA Conference will be a truly international event, attracting delegates from around the world. “IT has been a key factor in the development of the modern Water Industry and still offers exciting opportunities for the future,” says Oliver Grievson from Anglian Water, a member of the IWA Scientific Committee. “The nature of IT infrastructure is changing, and opportunities are being created in the drive for better envi- ronmental performance whilst lowering costs, becoming more sustainable and mitigating risk. As technological developments enable the collection of vast amounts of accurate, reliable data, the key challenges are to understand which data is important and to find ways to exploit the value in the data. Delegates will be provided with an insight into the sensors, controllers, dataloggers, telemetry, software and web-enabled control systems that make it all possible, and many of the speakers will explain how to optimise the value of the data. “The concept of a ’smarter’ Water Industry will be addressed through discussions on the value of Smart Systems, Network Protocols, Modelling & Control, and Decision Support Systems.” Fellow organiser Marcus Pattison believes that the IWA Conference is particularly well timed: “The Water Industry is a significant consumer of IT systems and a large producer of data, but it has infamously suffered from ‘Data Richness and Information Poverty, producing millions of pieces of data every day, and strug- gling to extract the value. However, the industry is changing rapidly and pressure is building from a number of directions: population growth is driving a need for greater efficiency; environmental and product quality requirements are becoming tighter and there is a constant desire to lower costs. As a result, the water sector needs to be ‘smarter’ in the way that it operates, with process and network monitoring systems working in tandem with modelling, communications and control technologies that are fast, intelligent and secure.” WWEM 2016, the co-located international Water, Wastewater and Environmental Monitoring conference and exhibition, will focus on all aspects of testing and monitoring, providing an update on the techniques, technologies, methods, standards and regulatory requirements that relate to monitoring both on-site and in the laboratory; covering sampling, field analysis, gas detection and continuous water and wastewater monitoring applications. Both WWEM and IWA visitors will benefit from free access to the WWEM Exhibition which will feature almost all of the world’s leading providers of water testing and monitoring equipment products and services, in addition to regulators, standards authorities and academia. Page 4 Industry News
  • 5. British Water puts focus on data and analytics British Water, which is the lead representative and business development organisation for the supply chain of the UK water industry has recently launched a new technical focus group covering data and analytics in the UK Water Industy. This group has become the latest addition to the British Water Technical Forum. The Data & Analytics Focus Group, which had its first meeting in June, will bring together experts on data capturing, processing and usage from across the industry. British Water recently set up focus groups specialising in extractive industries and innovation too, bringing the total number of expert technical platforms to six. Sharing knowledge Technical Director Marta Perez said: “Over the last 12 months British Water has doubled the number of technical forums, which are free and open to members. Becoming a part of these forums allows members from all aspects of the water industry to share knowledge, make new connections and to have a say in common standards and future regulation.” At its first meeting, members of Data & Analytics Focus Group vowed to work towards a code of practice to advise UK utilities and their supply chain. The data and analytics experts also propose to compile a glossary of technical terms to streamline the way language is used across the industry. The Innovation Focus Group had its first meeting in September 2015. Its aim is to share knowledge about the process by which new products can be developed and brought to a commercialisation stage, to improve information about grant funding and to build new links with academia. British Water set up the Extractive Industries Focus Group in June last year. Its objective is to explore the opportunities for the water industry’s supply chain presented by the development of hydraulic fracturing in the UK and to help regulators identify available technologies. The three new focus groups are in addition to the existing British Water groups, which address issues relating to package treatment plants, network management and sustainable water management. Opportunity Marta Perez, British Water’s Technical Director said: “Focus groups are a fantastic opportunity for British Water members to share their expertise, and develop new contacts across the industry. As well as setting common standards and codes of practice for different areas of the water industry, British Water focus groups help build knowledge of the challenges our members face. “The sort of detailed information provided by British Water focus groups can be tremendously useful when advising governments and regulatory bodies about new standards and legislation.” Marta Perez, Technical Director of British Water “the number of Focus Groups has doubled over the last year” Defra holds open flood data competition A new nationwide competition to consider the future of flood defences for the UK has been launched by the Department for the Environment, Food and Rural Affairs (DEFRA). Entrants have been given access to river catchment data, published as part of Defra’s open data programme, to consider how best to tackle flooding in Cumbria. The competition is focused on practical solutions and bold innovation. Government will consider how any of the creative ideas could be applied to real world flood management. Defra Chief Scientist Ian Boyd said: “We have now published more than 10,000 datasets in just one year with our Open Data programme. This competition is a fantastic opportunity for some of the best and brightest talent around the UK to use this vast resource to help us keep communities, families and homes safer from flooding. It will also help improve our understanding of the nation’s natural environment.” At the launch event, held at Defra’s Nobel House in London, sessions were held on river modelling research, the power of open data and latest technologies. Interest is expected from academic experts, insurance companies, water companies, technology and consultancy companies, as well as environmental NGOs. The competition follows the creation of the Cumbria Floods Partnership, and work on the government’s National Flood Resilience Review, which will highlight new ways to better protect the country from floods. Membership of British Water technical focus groups is free and open to all members. To find out more about becoming a member of British Water. British Water is an association which has a wide and varied membership covering all sectors of the water industry. From consultants, legal and financial partnerships, manufacturers of equipment and multi-disciplinary contractors to SMEs and independent consultants. We work to bring a coherent approach to delivering in partnership with the water companies, the best for the British water industry. We try to ensure each member company has access to services that will enhance their development potential and provide an added value factor to the way they do business. Page 5
  • 6. Optiqua to provide EventLab real time monitoring for drinking water network Shandong, China Optiqua Technologies and Shandong provincial water & waste water monitoring centre have entered into a collaboration for an integrated water quality moni- toring scheme for Shandong, based on Optiqua’s EventLab and MiniLab solutions. The Memorandum of Understanding (MoU) was signed by director Sun Shaohua at Shandong monitoring centre and managing director Melchior van Wijlen at Optiqua Technologies. The signing took place at the Singapore International Water Week on 12 July. It was attended by Hans Akerboom of the Dutch embassy in Singapore and Shao Yipeng of the Chinese embassy in Singapore. Optiqua Eventlabs are operational in the Netherlands, Singapore and USA. Shandong monitoring centre is the first deployment of the technology in China. Three stage programme The first phase of the collaboration, starting August 2016, will demonstrate Optiqua’s EventLab technology, a real time water quality monitoring solution, at a drinking water treatment plant in Jinan. The objective is to monitor the stability of the water quality before it is re- leased into the network. Full scale real time monitoring network In the second phase of the project, scheduled for January 2017, Shandong and Optiqua plan to deploy a medium scale network of EventLab sensors at multiple treatment plants as well as in the drinking water distribution grid. The final phase of the collaboration will see the deployment of a full-scale sensor network covering all treatment plants and the entire distribution grid. Fast response to unknown pollutants Director professor Jia Rui Bao at Shandong monitoring centre, said: “Our vision and strategy is to build a multi-level water quality monitoring system for the city, achieving fast responses to the sudden and unknown pollutants, on-site efficient identification, and qualitative and quantitative laboratory analysis of the pollutants.” According to Jia Rui Bao Optiqua’s technology provides a good match with that vision. Long-term collaboration on monitoring scheme In his response managing director Melchior van Wijlen at Optiqua Technologies said to be pleased to be able to demonstrate this for the first time in China. He emphasised the long-term collaboration. “It has a clear long-term vision and well-defined applications for the water supply and water distribution”, Van Wijlen added. As Optiqua is based in Singapore the development of the real time monitoring scheme is supported by Singapore’s national water agency PUB. Detection highest priority pollutants in rivers In addition to the use of Optiqua’s real time EventLab technology, the collaboration also includes the use of the MiniLab lab-on-chip technology which will be tested and researched by Shandong monitoring centre in pollution monitoring applications. The two partners agreed to develop tests for the highest priority pollutants in the Yellow River and Chang Jiang River About Shandong monitoring centre The Shandong provincial water & waste water monitoring Centre is responsible for supervising and monitoring the quality of water supply and drainage for Jinan and Shandong province, China. The centre is also responsible for the development of water treatment technology, application of research results and technical training across the province, as well as urban water supply and drainage industry monitoring for Shandong housing and urban-rural development department. Page 6
  • 7. Water industry dare to start and learn by doing “Dare to start, dare to learn. Find your way by doing”, that was the message by Dutch special water envoy Henk Ovink at the Water Leaders Summit in Singapore on 10 July. Ovink participated in the panel of the first of a series of meetings by global water industry leaders to share their ideas on pressing water issues together with government regulators and policy think-thanks. The kick off meeting of the Water Leaders Summit was part of the Singapore International Water Week 2016 that took place from 10th – 14tn July. No excuse to wait any longer “There is no lack of money for water projects to address the pressing water issue”, Ovink declined the outcome of an opinion poll amongst the summit’s attend- ance that had been asked for the largest threat to success in the water industry. By far the attendance choose for the lack of money. “The money is sitting out there. We need bankable water projects”, he riposted. “There is no golden bullet. The water issues are complex but that is no excuse to wait any longer. Find your way and learn by doing”, the Dutch special envoy advised the water industry present. Ovink emphasized the importance of a process that include the involvement of local communities. “Create a confidential setting for collaboration and don’t be afraid to fail.” Even more complex Cities are growing at staggering rates and in the developed world the water infrastructure is ageing. If the water industry does not move fast enough it will not be able to deliver its services. At the same time cities will become un-liveable if they fail to create more space for green-blue corridors. “And climate change makes it even more complex”, added Michel Jarraud, former chair on UN water, who also participated in the panel. “We are used to base our decisions on data from the past, but due to climate change this data is no longer good enough.” Jarraud also warned that the water industry cannot solve all water issues at once. “Try to achieve more and make reasonable steps forwards”, he recommended. Grants for innovative projects Good news came from panellist Amy Leung, deputy assistance at the water office of the Asian Development Bank. “We are providing special grants for project involving innovative water technology or innovative business models”. According to Leung the ADB focuses on the reduction of non-revenue water. “We calculated that water utilities in Asian countries loss 9 billion US dollar on the production of water that is not paid for. Proposals for water projects shall to address, for instance by concluding leak detection”, Leung said. The Asian Development Bank wants to allocated 25 percent of its future loans to water projects. Page 7
  • 8. Syrinix launch TrunkMinder, PipeMinder and RADAR onto FATHOM Store Syrinix, a leading provider of intelligent pipeline monitoring solutions has announced a new partnership with FATHOM Water Management, Inc. (“FATHOM”). Syrinix will offer its TrunkMinder, PipeMinder and RADAR solutions through the FATHOM Store, an online marketplace designed to enable simple, fast and risk- free adoption of new technologies for US water utilities. Syrinix TrunkMinder transforms the asset and risk management of critical and high consequence pipelines. It is a real-time network monitoring solution, always on and highly automated with immediate event alerts (any detected leaks or breaks) plus, high resolution pressure and flow data. Building on Syrinix’s established portfolio of solutions, PipeMinder is the next generation of monitoring hardware, transforming the way utility companies calm their networks and reduce leakage and breaks. Combining a 5 year battery life, automated alerts for transients and bursts plus high resolution data capture, it gives the clearest ever view with new levels of detail and accuracy, of where there is greatest risk of pipeline failure. Efficiently equipped with this view, PipeMinder allows utilities to address underlying causes and so actively and substantially reduce leaks and bursts in a way that has not been possible before. RADAR is a cloud based portal for device set-up and data analysis. Its single platform for multiple products provides detailed analytics, reporting and notifications. It comes accompanied with a range of service bundles for additional functionality. Cliff Jones SVP Syrinix said “We are delighted to have TrunkMinder, PipeMinder and RADAR on board for the launch of the Fathom Store, which we see as a great new opportunity to showcase our innovation to a direct audience.” The FATHOM Store is a simple, secure data integration platform that connects water utilities with technologies that help streamline business processes, recover revenue and better engage with customers. FATHOM’s expert team thoroughly vets each product submitted for consideration to the Store and selects only the top-performing tools, like TrunkMinder, PipeMinder and RADAR, for inclusion. Through open application program interfaces (APIs), technology companies can exchange data with FATHOM, as well as utilities, to deliver maximum value. Utilities can now easily access and acquire TrunkMinder, PipeMinder and RADAR without the risks common to technology adoption. “Nationwide, more than 56,000 water systems are searching for technologies that can help them make the most efficient use of ever-dwindling resources. Unfortunately, finding, vetting and integrating new technologies demands a level of investment most cannot afford to make – until now,” said Trevor Hill, CEO of FATHOM. “Through the FATHOM Store, we are connecting technology innovators, like Syrinix, directly to the utilities that need their support most. By mitigating the time and financial commitment required to modernize water utilities’ processes, we are propelling the Smart Grid for Water into reality.” The FATHOM Store is available at https://store.gwfathom.com. Water utilities gain new insight from network data New software offering improves network analysis, visualisation and maintenance i2O, the smart water network company, today launched a new software tool to help water companies monitor their networks and improve performance using data. i2O’s iNet software increases the ability of water companies to analyse and make automated decisions based on pressure and flow data and is the first software product available that diagnoses problems with Pressure Reducing Valves (PRVs) automatically. i2O’s new software features data visualisation tools that make it is possible to display water network data immediately through a range of flexible graphs, maps and dashboards. Multiple data sets can be combined in different ways to provide users with greater context, making it easier for engineers to identify and investigate potential anomalies. iNet uses an intelligent algorithm to automatically detect abnormal performance – including sudden changes of pressure, threshold breaches and other unusual patterns of operation – by monitoring data gathered from points of interest across the network. i2O completed an extensive diagnostic analysis of PRV failure modes when developing iNet, so it can now predict the underlying cause of PRV problems by analysing pressure data. Problem diagnosis enables water companies to improve the efficiency of maintenance operations and eliminate unnecessary network operation. i2O is currently working on a surge analytics programme to broaden the range of problems iNet is available to diagnose. Joel Hagan, Chief Executive Officer of i2O, comments: “iNet enables water companies to get maximum insight from their networks and improve the service they provide. Today the first most utilities know they have a problem is when a customer tells them about it. By monitoring and making sense of pressure and flow data it becomes possible to improve network operations, diagnose issues as they occur and fix them before they affect customers or create a cat- astrophic failure.” i2O’s smart water network technologies are already used by more than 100 utilities around the world to reduce leakage, burst frequency, energy use, operational costs and customer complaints. They include oNet, technologies providing water utilities with the ability to monitor and manage the pressure and flow of water across their networks, and dNet, a system of low-cost loggers that gather data about water demand, flow, pressure, asset condition and transients from points of interest on the network. Page 8
  • 9. Nivuflow NF750 awarded MCERTS certification The area velocity flow specialist company, Nivus, have been awarded MCERTS Class 2Certification for their Nivuflow NF750 transmitter in conjunction with their POA Wedge sensor this month. Field trials which form a part of the testing process were conducted at WWTP of Eppingen, Germany. The NivuFlow 750 including the Correlation Sensor is intended to be used for continuous flow measurement in slight to heavy polluted media with various compositions. The flowmeter can be operated in partly filled and full channels and pipes with various shapes and dimensions. It is a stationary measurement system for flow measurement and storage of the measurement data. The flowmeter simultaneously determines the velocity and level at a common measurement point. Depending on the level selected sensor type, the air-ultrasonic sensor or the pressure combi- sensor may contain two different built-in level measurements, an air-ultrasonic and hydrostatic level measurement. To ensure accurate level measurement, the fluid temperature is constantly monitored and fluctuations in atmospheric pressure are compensated for. A piezo crystal with a certain installation angle towards the flow direction operates as a flow velocity sensor. All the particles in the measurement path (air, dirt, suspended solids) reflect a part of the emitted ultrasonic signal pulse. This echo is received by the piezo crystal again and converted to electric signals. After a certain period the echoes of a second pulse are measured too. By correlation these echo the velocity and a velocity profile can be determined. Associated to the cross section, the discharge is evaluated. Municipal Utility Leaders Recognize Sensus With Best Smart Grid Solution Award For the third year in a row, municipal utility executives named the Sensus Advanced Metering Infrastructure (AMI) product portfolio the “Best Smart Grid Solution” during the Municipal Smart Grid Summit (MSGS). The solution features the FlexNet® communication system, which provides the basis for smart city infrastructure by wirelessly and securely transporting criti- cal data for public service providers including electric, water and gas utilities. “The FlexNet system is a reliable, two-way communication network that can grow for the future,” said David Stair, director of public power and cooperative markets at Sensus. “It supports all types of smart city sensors such as metering, distribution automation and IoT initiatives including outdoor lighting control. With FlexNet, utilities, municipalities and cities can manage multiple applications over a single network.” The sixth annual MSGS focused on executives at public power utilities seeking the latest industry research, regulatory news, standards and cutting edge tech- nology. The summit featured smart grid technology companies presenting to more than one hundred municipal utility executives from across the country. Sensus also received a best presentation award for its high-energy FlexNet session. South East Water has joined forces with behavioural science experts Advizzo to develop new innovative approaches that empower customers to better control the water they use and therefore the bill they pay. For several years South East Water has been utilising various information channels to encourage behaviour change and has seen good results through its customer metering programme. But the company is now looking ahead to find new innovative approaches using technology and behavioural science to encourage future savings. David Hinton, South East Water’s Asset and Regulation Director said: “Our customer metering programme has had great results with research showing average savings of around 16 per cent - the unknown though is how long will the savings last for and can we continue to encourage further savings in years to come. “When we met the team at Advizzo we felt their experience was just what we had been looking for and we are hoping to take the partnership on to run a series of experiments to really use engagement methods to maximise the impact behavioural science can have. “It’s a new way of thinking about how customers value their water supply and fits well with our vision for the future.” Julien Lancha, Chief Customer Officer and co-founder of Advizzo, added: “Where we believe we add value is we work closely with social scientists and be- haviour change experts to develop customer engagement tools that will make a difference. “It’s an exciting time and we can’t wait to see the results as we work together on innovative approaches to water efficiency and customer engagement.” South East Water partners with behavioural science experts Page 9
  • 10. Anglian Water today announced it has selected Arqiva, the communications infrastructure and media services company, to provide a smart water metering network trial as part of Anglian’s long term plans for a smart metering programme. The four-year contract will see Arqiva partner up with technology provider Sensus to create the relevant infrastructure to operate 7,500 new smart water meters in and around Newmarket, Suffolk. Anglian Water is using Newmarket as what it calls an ‘Innovation Shop Window.’, trialling technology which will help to achieve goals of 100 per cent custom- er satisfaction, zero bursts and leakage, and a reduction in water consumption to 80 litres per head, per day. Residential and non-residential properties during the trial period will be covered by the Sensus smart water meters. They will transmit hourly usage readings via the Arqiva network back to Anglian Water. These readings will give Anglian Water the knowledge to better comprehend customers water consumption, and allow the company to quickly identify bursts or leaks. The two-way communications capability of the fixed network will also enable Anglian Water to remotely reconfigure meters to deliver more frequent meter readings (every 15 minutes) for even more accurate identification of system leakage. It is intended that customers taking part in the trial will have online access to their consumption data, and will be given guidance and advice to minimise their water consumption. Paul Glass, Anglian Water’s Programme Manager for the smart metering initiative, said: “Long-term access to secure supplies of water is one of the most pressing environmental and economic challenges the world faces today, and that challenge is particularly acute in the east of England, which is the driest region in the UK. Getting to grips with it is not something that can wait until tomorrow. We want to lead the way in raising awareness about how essential water is to life, people and the environment, but also draw attention to the role technologies like this can have in helping address the challenges of a growing population and changing climate. “Smart metering has a key role to play in giving our customers access to information about their water use – helping them to understand how much water they are using, and therefore how to reduce their consumption and bills. In combination with our efforts on the wider network, this will help secure water supplies for the future. “We procured Arqiva (and Sensus as subcontractor) through an EU compliant tender process. We selected them because of the long-term commitment they made to the deployment and on-going monitoring of our fixed network trial, as well as their proven expertise in delivering large-scale network builds.” Sean Weir, Director Smart M2M at Arqiva, said: “Arqiva is committed to working with water companies to help them use smart metering to tackle the chal- lenge of water scarcity. Accurate monitoring enables consumers to better understand their usage and helps the water companies pinpoint and act quickly on leakages. We pride ourselves on the delivery of robust, reliable and comprehensive network solutions that aid this process, and are delighted that Anglian Water has recognised our reputation in this area by choosing us to support the progression of its smart metering programme.” Neil Adams, Director UK & Ireland at Sensus, said: “Anglian Water is taking an important step toward water conservation that will benefit its customers for years to come. Sensus technology enables Anglian to reduce non-revenue water, detect leaks and ensure reading accuracy from day one and into the future.” Routeco announce a special live event or two Routeco, the automation specialist has announced a new event in the industry calendar. Routeco LIVE will showcase the very latest in Industrial Control & Automation products and give attendees the opportunity to learn about the latest trends and hot topics within the industrial sector. The events will comprise of both a show floor, where people will find exhibits from Routeco’s manufacturing partners, and three break out rooms with presentations and discussions running throughout the day covering topics such as: • Industry 4.0, SMART Manufacturing, Enabling a Connected Enterprise • IT/OT Convergence, Network Infrastructure for the factories of the future • Machinery Safety, Legislation/Standards and Compliance • Accessing and expanding into global markets for UK Machine Builders • Enabling IoT technologies in the industrial sector • Cyber Security best practices and protection concepts and technologies • Migration of legacy control systems and managing obsolescence • Motion Control optimisation and introduction to new technologies In total there are two events that are taking place. The first is at the AJ Bell Stadium in Salford near Manchester in the north of the United Kingdom on 4th October 2016 and the second is at the MK Dons in Milton Keynes on 6th October 2016. The events are free of charge however, all attendees must pre-register for admittance on the day. People who want to attend can register by sending their full name and contact details and company name starting which day they want to attend to RoutecoLIVE@routeco.com Anglian selects Arqiva for smart metering fixed network trial Page 10
  • 11. Rapid, low cost water quality assessment for all Real-time water quality testing would be a significant step forward for water treatment and public health, both in the developed and developing world. Researchers at the University of Birmingham are developing an optical instrument which uses fluorescence to give a rapid, in-situ indicator of quality. A primary concern for water utilities worldwide is to ensure that drinking water does not pose an unacceptable health risk to consumers. The number and type of different pathogens present in waters is extensive, varied and dependent on a range of environmental factors. It is, therefore, not feasible to regularly isolate and identify each specific pathogen. Reliance has traditionally been placed on the measurement of total plate counts, as an overall indicator of microbial load and detection of faecal indicator bacteria and other coliform bacteria for contamination. Although precise, these tests can take more than 30 hours to produce results. In the natural environment, often only 1% or less of microbes can be cultured in this way, leading to what has become commonly known as the “great plate count anomaly”. In less developed countries, the length of time, expert analysis and relatively expensive reagents needed mean the use of such tests in community water management and disaster relief scenarios, such as refugee camps, is problematic and infrequent. Furthermore, these techniques are beyond the reach of those poorest communities in urgent need of drinking water and sanitation improvements. Situations like these demonstrate that rapid science and engineering-based indicators of safe drinking water are essential to reduce poverty and develop sustainable livelihoods. Such indicators are likely to be most widely adopted when delivered as part of a community-based drinking water solution. In more developed nations, the challenge to ensure microbial quality is addressed by water utilities through disinfection during treatment processes. Using chlorine, ozone, or chlorine dioxide as a disinfectant in water rich in organic matter, which also acts as a microbial food source, can generate potentially carcinogenic disinfection by-products. Consequently, utilities must manage the competing needs of biological and chemical compliance. It is, therefore, vital that companies monitor the microbial and chemical quality of drinking water at various stages of treated water supply systems, including trunk mains, service reservoirs and the distribution network. In-situ real time measurement is, therefore, highly desirable, as it would enable rapid assurance of water quality. For developed countries, this would facilitate optimisation of process control and overall proactive and preventative operation of water supply systems. In less developed nations it would provide first-level screening and safety assessment of an area’s water supply arrangements. There is a pressing need for novel technologies that enable real time, in-situ, low powered and, ideally, continuous analysis of drinking water quality. Focusing on these global challenges, researchers from the Department of Civil Engineering at the University of Birmingham have developed a novel optical instrument, based on fluorescence spectroscopy, to indicate water quality and suitability for consumption almost instantly. All water fluoresces, although the insensitivity of the human eye to the appropriate wavelengths renders fluorescence invisible to us. Research has demonstrated that water fluorescence is particularly good at identifying faecal contamination. The fluorescence emitted from humic and fulvic substances, fluorescent pollutants such as whitening agents, and microbially-derived intrinsic fluorescence from both cellular material and exudates can all be detected. The advantages of fluorescence include a rapid analysis time, no sample pre-treatment necessary, and a sample volume of only a few microlitres. We have developed a prototype dual-LED instrument, ‘Duo Fluor’. This can detect fluorescence at wavelengths that can be used as surrogates for both microbial and organic carbon presence. We have benchmarked prototype performance against research grade instruments and recorded excellent performance. Our initial work examined the feasibility of using the Duo Fluor as a proxy for organic matter. The instrument detected fulvic acid at 0.25 mg/l, and could differentiate between deionized water and tap water. Attempting to observe similar differences using standard TOC analysis was less successful, meaning that the Duo Fluor could detect lower levels of pollution than standard TOC analysis. The response of the Duo Fluor to deionized water, as a clean control, and local pond waters spiked with L-Tryptophan was subsequently assessed. Incremental dosing of Tryptophan into both types of water yielded a steady fluorescence signal response demonstrating the capability to detect a surrogate for microbial presence. Duo Fluor performance has also been assessed when continuously measuring the Peak T fluorescence (a surrogate for microbial presence) and Peak C fluorescence (a surrogate for humic and fulvic acids) of pond water spiked with quinine sulphate (QS). It was used to analyse water quality continuously over three distinct phases: 15 minutes of water flowing continuously with no addition of QS; 15 minutes of water spiked with 0.4 mg/L QS, and finally 15 minutes of water spiked with 0.8 mg/L QS. The results are shown in Figure 2 and demonstrate an appropriate and anticipated response in both Peak C and Peak. Unlike most commercially-available instruments, fluorescence responses can be enhanced by adjusting gain settings. This means it can be set up to provide an accurate comparison among samples as well as allowing the most appropriate sensitivity ranges to be identified for the quality of water being tested. The Duo Fluor represents a hugely significant advance for the management of water and wastewater systems in both developed and developing countries. It offers multiple potential uses within the global water industry for the rapid, cost-effective and robust indication of: • organics and microbial matter across a wide range of water qualities (from sewage to drinking water) • process efficiency at treatment works • identification of potential ingress into service reservoirs and distribution systems • disinfection byproduct formation potential • effluent quality at wastewater treatment works • river water quality at abstraction points and wastewater treatment works’ discharge points • identification of misconnected sewer discharges. The equipment is inexpensive and off-the-shelf; furthermore, it allows both expert interpretation of results and simplified pictorial interpretation for use by non-experts. Page 11
  • 12. Phosphate Monitor Protects Cumbrian Lake During Restoration Novel phosphate monitoring technology from OTT Hydrometry is helping the South Cumbria Rivers Trust (SCRT) to improve water quality during a project to restore a lake in the north of England. Funded by United Utilities, the Elterwater Remediation Project has been created to improve water quality by increasing water flow through the lake and dramatically lowering residency time. Background Situated 2 km North West of Lake Windermere, Elterwater is a high amenity value lake comprised of three basins measuring 930m long with variable widths up to 320m. The Lake is also a Site of Special Scientific Interest (SSSI). Between 1974 and 1999 United Utilities operated a wastewater treatment works serving the Elterwater village within the consents of the day. However this and other sources, left a legacy of phosphorus enriched sediments in the inner and middle basins of the lake. These in turn caused eutrophic and hyper-eutrophic conditions leading to algal blooms, anoxia and poor water quality. In the United Utilities asset management plan for April 2010 to March 2015 (AMP5) a study was commissioned that identified the key issues and options for resolution. These included improving the lake’s water quality by dredging to remove the phosphorus rich sediments or diverting two local becks to improve water turnover and prevent the conditions necessary for phosphorus release and the creation of algal blooms. Dredging would permanently remove the phosphorus rich sediments but could cause significant environmental damage particularly in the disposal of the enriched sediments. Consequently, the preferred solution is to divert the becks. Dr Mike Sturt SCRT’s Technical Officer explains: “Soluble Reactive Phosphate (SRP) released from the sediment accumulates over time and becomes bioavailable resulting in a proliferation of algae and bacteria, which causes a lowering of dissolved oxygen and pH, which in turn causes an increase in SRP desorption from the sediment. So there is a complex cycle in play which causes thermal stratification and anoxic/high turbidity conditions in the summer months. As a result, Elterwater is incapable of supporting natural, healthy populations of fauna and flora beyond benthic invertebrates.” Phosphate Monitoring Phosphate in the lake sediment is clearly the cause of the lake’s ongoing water quality problems, so the aim of the restoration project is to implement a sustainable solution that does not result in an increase in SRP within the water body. Background phosphate monitoring therefore commenced in August 2014 and samples have been taken at 2 week intervals for laboratory analysis. However, continuous monitoring is always preferable, when possible, because spot sampling risks missing pollution incidents. Traditional continuous phosphate monitors employ colorimetry and generally require mains power, which is often not available at remote sites. However, the ‘Cycle-P’ from OTT Hydrometry is battery powered and able to operate unattended in the field, running over 1,000 tests before a field service is necessary to change the reagents. When combined with telemetry, the instrument delivers almost real-time data at user-selectable intervals (typically 1 to 4 hours). “The Cycle-P is ideal for Elterwater,” Mike says. “The lake is an hour’s drive each way from our office, so the facility to leave it running, but with remote access, saves a great deal of time and money. “Initially, two Cycle-P units were installed at Elterwater; either side of the middle basin, but after 1 year of operation, it became clear that one unit was sufficient – at the outlet of the inner basin. “The performance of the Cycle-P has been excellent; it has proved to be accurate and reliable, producing good quality data that is consistent with laboratory analysis.” The Cycle-P is an in-water total reactive phosphate analyser that has been designed for operation by both chemists and non-chemists. The instrument has an onboard logger, and the quality of the data is underpinned by QA/QC processing in conjunction with an on-board NIST standard. The Cycle-P methodology is based on US EPA standard methods, employing pre-mixed onboard colour coded cartridges for simple reagent replacement in the field. With a detection limit equal to or less than 0.0023 mg/L PO4-P, and a range of 0-0.3 mg/L PO4-P the Cycle-P is able to measure down to extremely low levels, which makes it ideal for the Elterwater application. However, a higher range can be specified at the time of order (0 to 1.2 mg/L). Progress to-date The background monitoring undertaken by the Cycle-P (and lab samples) has not shown significant SRP in the water body because the release of phosphate from the sediment is quickly taken up by algae. However, the piped diversion of the Great Langdale Beck delivers around 122 litres/sec of very clean water, and the Cycle-P constantly checks that this is not causing a rise in SRP from the sediment. If alarm conditions arise, the system automatically sends a text message to Dr Sturt’s mobile phone. The Environment Agency has also installed a water quality monitor (DO, pH, EC, turbidity) at the same location and this also has a text alarm system. Mike says: “The clean water from Great Langdale Beck started to arrive in the inner basin during early February 2016 and at the time of writing no alarms have occurred, so we are cautiously optimistic!” Page 12
  • 13. Water utilities around the world face huge challenges. Population growth, urbanisation and more frequent extreme weather events make delivering adequate customer service through aging infrastructure increasingly difficult. Given the extent of these challenges, regulatory requirements and the reality that there is no more money available, water companies need to be smarter about what they do. Specifically, they need to extend the life of their existing assets and push out the significant investment required by large capital projects – new supply infrastructure and pipe replacement. So, what is a smart network? It has three key essential components: sensors, analytics and automation much like PLCs or SCADA for treatment works. Sensors enable accurate data on network status to be reliably gathered regularly without the need for anyone to physically collect readings. This can be done today with pressure and flow. It is likely in future that this will extend to water quality parameters possibly including turbidity, chlorine, etc. Analytics crunches the data. This can be anything from simple maths – adding, multiplying and averaging – to hugely complicated algorithms which combine diverse datasets. In each case, the aim is to turn the data into actionable insight, the ability to do something as a result. Software does the crunching relentlessly 24 hours a day, seven days a week and 365 days a year without bias or error. This is something that people just can’t do. Automation enables the network to be controlled remotely without human intervention. It is the transition from the analogue to the digital world. It will mean that an engineer visiting site to make manual adjustments is the exception rather than the rule. Each of these components has its particular challenges. Sensors first of all Sensors need to operate remotely without power. Few network locations have readily accessible mains power. The batteries that power them need to last a long time so low power designs are required. The sensors need to be robust. They are often located in harsh environments and operate in high and low temperatures and wildly variable temperatures; in humid environments and arid environments; in dry environments and submerged in water of all qualities. They also need to communicate from remote places through concrete chambers or from under heavy manhole covers. Analytics has a diverse range of challenges. The main requirement is for accurate, reliable and timely data. Without this, decisions made on the basis of the data can’t be trusted. Visualisation is a specialist field in itself. It’s not just about graphing data but making it possible for a person to assimilate it by putting it into its appropriate context, whether that’s a graph or a map or a schema. Data security is critical and although largely mitigated we have to accept that it can never be solved in full. Even if the technology is impregnable then the human operator is a significant weak point. How many people still have “password” as their password? The actual processing and storage of data is often considered by utilities as a big challenge but the data volumes and complexity of calculations is in the foothills of big data challenges that the business and scientific world has learnt to manage today. At CERN, for example, the raw data per event is around one million bytes (1 Mb), produced at a rate of about 600 million events per second. The total data flow is around 5 GB per second. In total CERN generates 25 petabytes of data a year. Compare that to a smart meter reading every half hour, communicating daily, clocking up a tiny 17,500 meter readings a year. The challenge of automation is two-fold Hardware that was designed for manual control needs to be remotely actuated. The more difficult thing is that people need to accept that machines can do the majority of what they used to do, probably more reliably. This is proving easier for the younger generation coming through than experienced engineers that may embrace new and better ways of doing things less willingly. Smart networks aren’t new. This is a well-trodden path in other industries including utilities. The electricity utility industry has been doing this for a decade. The communications industry has been down this path for 40 years starting with the digitisation of exchanges. Opinion: Smart water networks set to become pervasive Page 13
  • 14. But an interesting analogy comes from the aeroplane. At the beginnings of flight every control in an aeroplane was connected physically and operated manually by the pilot. In the 1930s the RAF chose a set of six essential flight instruments. Five of these, “the big five” as they are known, are still included in all cockpits. They have proved to be the enduringly critical visualisation tools. Today aeroplanes largely fly themselves. The role of the pilot is restricted to entering desired outcomes (destination, speed, rate of climb/descent) and intervening to deal with unexpected and unanticipated events. It’s interesting to note however that less than one per cent of landings are automatic in spite of the vast majority of jetliners being certified to land automatically. Hopefully they like to keep their hand in, but perhaps they still think they do it better! i2O has been delivering smart water network solutions to utilities for 10 years. Its clients number more than 100 in more than 25 countries around the world. i2O has three solutions that enable water networks to be smart: • dNet enables data to be returned from permanently deployed pressure/flow sensors at points of interest on the network • iNet takes that data and visualises it in ways that make it easier for engineers to interpret, identifies anomalies in the data which indicate events of interest on the network (parameter breaches, abnormal patterns), and enables maintenance to be scheduled on the basis of condition rather than time • oNet enables pressure to be remotely controlled and automatically optimised at PRVs and booster stations across the whole network. i2O’s solutions reduce leakage, bursts and operating costs, extend asset life, and improve customer service. Payback can be as short as seven months. Now that is smart. About the Author Joel Hagan has more than 20 years of business leadership and technology expertise. He has a deep understanding of the utilities sector and significant experience of building early stage companies and developing data analytics and control technologies. i2O provides a suite of smart network solutions to help water utilities respond to the challenges created by an increasing and urbanising population, more extreme weather events, ageing infrastructure and more demanding customers. More than 100 utilities in over 25 countries around the world have installed i2O technology since the company was founded in 2005; extending asset life, reducing operating costs, improving customer service and achieving return on investment within 12 months. Amey and VTOL form drone JV for asset management inspections A new joint venture between global asset management consultancy, Amey, and world leading drone technology experts, VTOL Technologies, will use precision, long-range drones to transform asset management inspections – making it safer, quicker and easier to assess vital infrastructure such as bridges and railways. Richard Butterfield, AmeyVTOL’s Service Development Director said: “Doing more with less is a challenge most businesses will understand. As asset managers, we’re often asked to deliver cost efficiencies for our clients while increasing inspections to meet the growing demands on the UK’s networks. Using this cutting-edge technology to inspect the vital infrastructure that we all rely on is a world first. It will change the way we inspect assets forever; allowing us to assess at the touch of a button, make real-time recommendations and potentially save millions of pounds for our clients.” AmeyVTOL’s unique patented unmanned autonomous drone, known as The Flying Wing, is at the forefront of long-range, beyond visual line of sight (BVLOS), remotely piloted aerial systems (RPAS) autonomous drone technology worldwide and offers a number of benefits that traditional drones fall short of. The Flying Wing will carry Ground Penetrating Radar, High Definition video and still, Infrared, thermal and Light Detection and Ranging sensors, amongst others. It can take off and land anywhere, travel up to 150km, at speeds of up to 60kph and change direction to precisely map the same route over and over, regardless of weather conditions. It also has the added benefit of capturing data in real time and streaming it live to a data processing engine. Mark Shaw, Director for AmeyVTOL said: “Our unique and patented Flying Wing outperforms existing drones and represents the future of aerial inspections. We’re really excited to be introducing this market-leading technology which will revolutionise the asset management industry to deliver repeatable, consistent and accurate inspections as early as 2018.” Page 14
  • 15. At the current time in England & Wales there is a debate going on as to the use of area-velocity flow meters for the measurement of wastewater flow. It is a subject that has been rumbling on for the past few years as to how to check whether or not the flow measurement technique is accurate and compares to more traditional techniques like open-channel level based techniques that use a primary device or how it compares to techniques such as closed-pipe electromagnetic flow measurement and the issue at the heart of the debate – how to check that they are recording accurately on a year on year basis. In the rest of this article I intend to touch on the principals of the technique, its beneficial use within the Water Industry, and its comparative accuracy compared to other techniques and a potential question as to potential validation techniques. The types and principals of area-velocity flow measurement Area velocity techniques for flow measurement have been around for a significant time within the water industry in a variety of different forms but the principal of the technique is that the height and velocity of a body of water is measured using two separate types of measurement. The depth of a fluid in a channel that fixes the width and the speed that the fluid is moving through the channel. The two multiplied together as in the following equation is used to calculate the flow rate. Flow (Q) in m3/s = Area (m2) x Velocity (m/s) Where the area is equal to Area (m2) = Depth of fluid (m) x width of channel (m) Where of course the width of the channel is a set parameter and only the depth is measured. This is demonstrated in figure 1 which has been borrowed from the Greyline website The development of this technique has brought many innovations in flow measurement that can be vaguely be split into: • Submerged area velocity flow meters (including Doppler) • In-pipe velocity measurement • Cross channel based area velocity flow measurement • Non-contact area velocity flow measurement The submerged techniques have been in existence for many years and under the UK MCERTS scheme there are currently two companies certified for regulated flow measurement including Nivus and Teledyne Isco both with traditional area-velocity measurement units. The in-pipe velocity measurement technique uses just the velocity measurement of a traditional area-velocity unit to measure the velocity of fluid through a pipe. The area part of the equation is not necessary as the pipe is a fixed dimension and, as long as the pipe remains full, is a fixed area. Although the measurement technique is very different the principle of calculation (i.e. the use of velocity as a measurement parameter) is similar to that used for electro-magnetic flow meters. Cross channel techniques have been used in the past with instruments such as slab-electromagentic flow meters or with sensors that measure the velocity across a channel by mounting the velocity sensors on the channel sides. These are uncommon in the wastewater industry and are generally not used. Non-contact area velocity flow measurement is a technique that started by the development of the Hach Flodar system and has continued with technologies such as the Raveneye & Laserflow flow meters. These instruments work by measuring the surface or near surface velocity of the flow of water and measure the height of water by taking away the measured ullage from a programmed empty distance of a channel (the height from the sensor face to the bottom of the channel. Of all the non-contact area velocity techniques only the ISCO Laserflow is currently accepted under the MCERTS measurement scheme. Feature Article: The Great Area Velocity Debate Figure 1 - Basic Area Velocity Flow Measurement (courtesy of Greyline - http://www.greyline.com/) Page 15
  • 16. The use of Area-Velocity flow measurement in the Water Industry By far the most common types of flow measurement in the UK Water Industry are ultra-sonic level based flow for open channel flow measurement techniques and electro-magnetic flow measurement in closed pipes. Between these two techniques over 90% of all flow measurement is accounted for. However, the remaining 10% of flow measurement (approximate guesstimate) pose a significant challenge for the measurement of flow and can result in either a significant investment or a significant risk to the environment when installing a measurement solution. It is in these applications that area-velocity flow measurement becomes an attractive alternative measurement solution as no primary measurement device (a flume or a weir) is necessary and civil costs are minimised. The impact on the process and thus the impact on the environment can either be minimised or in the case of non-contact area velocity measurement eliminated entirely. Examples of this include open channels where the spare head of water is limited to almost nothing and it is not possible to install a primary device. This is the case of the channel in figure 2. In this case the old measurement structure was a flat v which over time had developed a slope meaning that the existing ultrasonic flow measurement had, through the failure of the primary structure, become unreliable. The available head within the channel was in the order of 50-70 mm which precluded the use of a flume or a weir. The remaining choice was to either install an area-velocity flow measurement system or dig up a concrete car park and install an electro-magnetic flow meter. The former option was chosen. The second example was the measurement of flow within an inlet channel of a relatively large treatment works. The works in question did not have storm tanks as all flows were treated at the works or in n emergency could overflow to the nearby water course. However, it was necessary to install inlet flow measurement for control purposes. Isolation at the inlet pumping station was possible for a period of only two hours at the lowest of flows. In this particular case the installation of a flow meter was not an emergency, the time restrictions were too short for an electro-magnetic flow meter and pipe lengths were not suitable for time of flight measurement. The best alternative form of measurement was time of flight. So it can be seen that the use of Area-Velocity flow measurement has significant benefits within the water industry. Is area-velocity flow measurement accurate? Of course when you talk to the suppliers of these technologies the answer, most of the time, will be yes. The cannier within the industry will say “if installed correctly.” From the Water Company’s the typical answer is – “we’ll have to try it and see.” So here are two case-studies. In the first of these two area-velocity measurement techniques are compared. A within technology test. In this particular case study we have an inlet channel non-contact area velocity device mounted above the channel against an insertion velocity measurement which on occasion loses its pipe full profile and the measurement is lost. This is more to do with the installation and the particular pipe conditions rather than the measurement technique itself. Despite this limitation there was an average of a 7% uncertainty between the flow measurement techniques with 80 percentile of an uncertainty of around 6% once the errors had been taken into account. This shows that, despite the flow meters being opposite end of the treatment works that there is an agreement between the two different measurement techniques. Figure 2 - Channel where head limitations meant that area velocity flow measurement was the intelligent choice Figure 3 -Time of flight versus insertion flow measurement techniques Page 16
  • 17. About the Author Oliver Grievson is the Flow & Instrumentation Specialist for the Foundation for Water Research as well as being a Director of the Sensors for Water Interest Group and also Wastewater Education 501 (c)3 as well as being the group manager of the Water Industry Process Automation & Control Group (WIPAC). He has had many years experience in both the operation and engineering sides of the Water Industry and is currently a technical expert and manager in flow and instrumentation regularly consulting & lecturing on both a national and international basis. He is a Chartered Scientist, Environmentalist and Water & Environmental Manager as well as a Fellow of both CIWEM & the Institute of Environmental Sciences and a Member of the Institute of Measurement & Control. In our second case study a Time of Flight flow meter is compared to a insertion velocity measurement technique on a large bore pipe (see figure 3) Comparing the flow measurement reveals that in a 26 day period, on average the two different flow meter technologies were within 3% of each other and this rises to a 6% differential for 90% of the 2,402 readings are taken into account over the period. The results of this are shown in figure 4 Discussion Area-velocity flow measurement is a current and accurate flow measurement technique that is of a significant benefit to the operation of the current water industry. It is a proven and accurate technique that in a similar fashion to all measurement techniques must be applied to the right measurement conditions and correctly installed for the measurement to work. At the current time the technique is being called into question as to the standards and verification techniques to verify whether the measurement technique is operating as it should do. For the more traditional techniques these are well established. For example for level based flow measurement with a primary device the use of simple surveying techniques are used to ensure that the structure is bowed or warped beyond certain tolerances and what is acceptable and what is not acceptable is set out in both the Minimum Standards for MCERTS and additionally in British Standards. For electromagnetic flow meters each instrument is minutely inspected and calibrated within the factory environment to ensure that at the time of manufacture the instrument is working as it should be. The closeness of the electronics to the factory calibration is checked by the user of the device at a period of their own choice and this ensures that the flow meter is working correctly. The Big Debate of course is that these techniques don’t exist for Area Velocity devices and therefore the accuracy of the measurement technique as installed within a channel or pipe cannot necessarily be verified in a scientific or structured way and the user cannot independently ensure that the area velocity measurement technique is working as it should. The level/area part of the technique is relatively simple and checking this is a relatively simple job that any calibration engineer should be able to do as part of their daily routines. However when it comes to checking velocity readings the industry, at the current time, is at somewhat of a loss and the standards that have been so carefully prepared for other measurement techniques don’t exist for area- velocity techniques. Without any doubt, the measurement of flow within the Water Industry needs the area-velocity technique for flow measurement to address the more challenging of measurement techniques were installing traditional techniques become prohibitively expensive, dangerous or completely impractical. There is knowledge and evidence within the Water Industry as to the accuracy of the technique for the measurement of wastewater. However, at the current time the so-called “elephant in the room” with the technique is how to routinely prove via validation and calibration techniques that a flow measurement system is recording as it should be. The use of Area Velocity as a measurement technique will be openly discussed at this year’s WIPAC Flow Forum @WWEM on the 2nd November 2016 in Telford in the United Kingdom. The day long session on Flow is free to attend for all those who have registered for the Water, Wastewater & Environmental Monitoring Conference. For those interested please go to http://www.wwem.uk.com/ and select conference registration under the conference menu 80.00% 90.00% 100.00% 110.00% 120.00% 130.00% 140.00% 150.00% 160.00% 01/07/2016 00:00 07/07/2016 00:00 13/07/2016 00:00 19/07/2016 00:00 Comparative graph of measured flow differences between Time of Flight and an Insertion Meter Figure 4 - Graph comparing the two flow measurement techniques under test. A time of flight flow meter and an insertion flow meter Page 17
  • 18. Article: Smart Water Semantics: Meaningful Interoperability beyond Data and Syntax The water sector is being transformed through the use of smart systems, which aim to manage the assets and services they provide in a more sustainable and economic manner. Smart water networks have been noted to promote efficacy, efficiency, and resilience in water infrastructure 1, 2 . They are based on the use of data to make improved operational and investment decisions to lower risk, use of energy and financial resources. This is achieved through the use and integration of sensors, analytics software, and decision support software. In order to conduct research into Smart Water Networks, a European Commission cluster of projects, named ICT4Water 3 , is investigating the claims and technologies behind them. These projects started between 2012 and 2015, and are finishing between 2015 and 2018. They are exploring ICT applications across the water value chain, including clean water, wastewater, and consumer interventions. One ICT4Water project is building an Internet of Things (IoT) water platform, as well as exploring domestic and industrial business services built on the platform. This project is called WISDOM, or ‘Water analytics and Intelligent Sensing for Demand Optimised Management’. A big part of the project is integrating and contextualising data from sensors across the water value chain, using knowledge-based systems. A central challenge for the exploitation of smart water technologies is ensuring a shared meaning of the data between different pieces of software supplied by different vendors and researchers. This is termed semantic interoperability. In order for programs to properly use data, its meaning must be properly interpreted. One way of achieving this is by describing the meaning explicitly in a semantic model, such as in the form of an ‘ontology’. The terms ‘semantics’ and ‘ontology’ come from the philosophical study of meaning, but are now used by the semantic web field to refer to a specific type of knowledge model. These models assist interoperability by describing the objects in a domain in a machine-interpretable way, as well as the relationships between them. They also describe the objects’ properties, and restrictions on how the model should be used, such as only allowing a circular pipe to have one absolute diameter. It is true that common protocols and data communication methods are already being addressed, through initiatives such as the internet of things 4 . However, semantic interoperability remains a largely untouched issue, and especially in the field of water management. This challenge has been noted by the ICT4Water cluster as a critical obstacle 5 . The issue has already received significant attention in smart grids, given the precedent set by the Institute of Electrical and Electronics Engineers in their guide to interoperability 6 . The issue is also receiving attention in the Smart City field, after being highlighted in a seminal report on smart cities 7 . Given this growing body of evidence, WISDOM decided to manage water data using a detailed semantic model. This was then used to support powerful applications by offering integrated, coherent, and contextualised knowledge through a web interface. This semantic model took the form of a domain ontology for the water sector. It was developed over 2 years through close collaboration with industrial partners, and a variety of stakeholders. Page 18
  • 19. The work has been built on previous efforts such as controlled vocabularies [8,9], a format for hydrologic time-series data 10 , and a data model of geospatial utility networks 11 . The main advantages of the work are: • The use of greater semantic expressivity (more detailed and machine-interpretable descriptions of meaning). • Modelling the domain with more breadth and depth (including things like sensors, people and GIS descriptions). • Using techniques to allow alignment with other smart city systems (e.g. smart grids) so that interoperability can be achieved with them in the future. This process of building and using a domain ontology converts the raw data which comes from sensors. Specifically, the text and numbers, are converted into machine interpretable knowledge: detailed and contextualised statements about the network. This is a big advantage when trying to apply things like artificial intelligence, or advanced optimisation algorithms. By making the meaning of the data explicit, interoperability is achieved with more confidence, less cost, and in less time. Further, by using an open knowledge model, you avoid vendor tie-in, and can build or change the data models as smartness develops, requiring much less effort than traditional approaches. The WISDOM ontology viewed the water sector as 3 parallel systems; physical, social, and cyber. Firstly, the physical ontology includes tangible components of the network at two levels of detail. These were the network level and the asset level. The network level was based on a traditional GIS data schema. The asset level provided a way to extend the ontology to describe devices and schematics at specific assets, such as pumping stations. One extension which covers these details well is the Semantic Water Interoperability Model (SWIM) 12 . This captures 30+ years of water utility experience into semantic descriptions of water assets and devices. Secondly, the WISDOM social modelling used two further levels of detail: organisational and personnel. Examples of these are the relationships between utilities and regulators, and between functional managers within a utility. Finally, the cyber network modelling adapted a well-accepted sensor ontology 13 for the water domain. This described sensors, data, and ICT objects. From the detailed domain ontology, a comprehensive view of a utility’s network can be built. This can then be deployed as a web service with a standard application programming interface (API). This has been delivered in WISDOM, and advanced business services have been built on top of it, including pumping optimisation, combined sewer overflow spill predictions, and energy-water decision support. A lot of ground has been covered by organisations like the European Commission, NASA and the Open Geospatial Consortium, and by projects such as WatERP, SWIM and WISDOM. These have built a strong foundation for syntactic and semantic interoperability in the water sector, but there is a lot left to do. Critically, these largely separate efforts should be brought together in a coherent manner by the water industry. This will deliver a semantic model which is necessary for the next generation of truly smart water networks. The model will enable powerful interoperability across traditional silos in the water industry. The initiative has to be driven by industry, through a mechanism which echoes the transformation the construction industry has recently undergone with BIM. In the construction industry, BuildingSmart has standardised and driven the adoption of the industry foundation classes 14 . This has empowered stakeholders through previously unheard of interoperability and a knowledge-driven culture, through an open semantic model. The water sector needs a similar initiative, with the goal of developing, standardising, and driving the adoption of semantic models for the water sector. These models should use the latest advances in ICT, such as the semantic web, big data, and cybersecurity. This will greatly accelerate the growth of smart water markets and unlock their potential impact on the modernisation of the sector. References 1. “CTRL+SWAN - Cloud Technologies & ReaL time monitoring + Smart WAter Network (AG126) | EIP Water.” [Online]. Available: http://www.eip-water.eu/ CTRL_SWAN. [Accessed: 18-Feb-2016]. 2. SWAN, “What are smart water networks.” 2013. 3. ICT4Water Cluster. [Online]. Available: http://www.ict4water.eu/. [Accessed: 19-Jul-16]. 4. “Hypercat - Home.” [Online]. Available: http://www.hypercat.io/. [Accessed: 01-Jun-2016]. 5. ICT4Water, “ICT4Water standards report.” 2015. 6. IEEE Standards Committee, IEEE guide for smart grid interoperability of energy technology and information technology operation with the electric power system (EPS), end-use applications and loads. New York, N.Y.: Institute of Electrical and Electronics Engineers, 2011. 7. ISO/IEC JTC1, “Smart Cities Preliminary Report,” 2014. 8. CUAHSI, “CUAHSI Hydrologic Information System - Hydrologic Ontology for Discovery.” [Online]. Available: http://his.cuahsi.org/ontologyfiles.html. [Accessed: 23-Oct-2015]. 9. SWEET, “SWEET Overview.” [Online]. Available: https://sweet.jpl.nasa.gov/. [Accessed: 23-Oct-2015]. 10. OGC, “WaterML2 - A Global Standard for Hydrological Time Series.” [Online]. Available: http://www.waterml2.org/. [Accessed: 18-Jan-2016]. 11. INSPIRE Thematic Working Group Utility and Government Services, “D2.8.III.6 Data Specification on Utility and Government Services – Technical Guidelines,” European Commission Joint Research Centre, Dec. 2013. 12. Aquamatix. SWIM: a semantic ontology for interoperability. 2014. 13. M. Compton, et al., “The SSN ontology of the W3C semantic sensor network incubator group,” Web Semant. Sci. Serv. Agents World Wide Web, vol. 17, pp. 25–32, Dec. 2012. 14. buildingSMART, “Industry Foundation Classes Version 4.” 2013 About the Author Whilst conducting PhD research at Cardiff University for the past three years, Shaun Howell has assisted and led tasks across six research projects relating to ICT in the built environment, and extended existing BIM and smart city standards in line with UK agendas. This has resulted in the successful delivery of water and energy semantic models to the EC, a retrofit energy management system which has shown 25% energy savings, and input towards international OGC CityGML modelling standards. His PhD aims to contribute an open and extensible framework for knowledge based systems and interoperability in smart cities, with case studies in energy and water systems at both the building and city scales. Page 19
  • 20. Article: Industrial Internet Of Things (IIoT): Identifying The Vulnerabilities Of Field Devices The Industrial Internet of Things (IIoT) industry is growing at a rapid pace. By year-end 2015, an estimated 13.4 billion IoT connected devices had flooded the global market. The number of connected devices is forecast to reach 38.5 billion by 2020.1 But why are so many companies working to develop IIoT devices? Because most industrial processes are not fully automated, they are capital and labour intensive and need to find an effective way to identify network issues and improve performance. The main draw of IIoT devices is that they can improve safety, reliability, and energy efficiency. These devices integrate sensors that gather real-time or continuous data and connect to data analytics and control systems. Analyzing data trends is essential for delivering actionable insights in order for utilities to prioritize network upgrades or monitor supply-demand mismatch. The smartest solutions not only offer data analytics software, but also integrate with existing software and industrial control systems (ICS). For example, sewer water levels can be monitored and programmed to send real-time alerts when the water level has reached a predetermined threshold in order to prevent combined sewer overflow (CSO) events. Sensors can also be installed inside different types of equipment to monitor if measured parameters exceed predetermined thresholds. This enables predictive maintenance — maintenance that can be scheduled before an equipment failure occurs, which prevents expensive equipment replacements or repairs. Agriculture applications can monitor soil moisture levels, humidity, and pesticide usage. Farmers can use this data to implement optimal crop growing conditions.2 These examples are illustrative of how IIoT devices can optimize operations for the user. But connecting devices also creates a network vulnerable to attack and compromise. As the number of connected devices increases, so do potentially devastating cyber threats. Cyber threats on critical infrastructure can have far more damaging and widespread effects than individual terror attacks. A common method of attacking consumers using ransomware, a type of malware that infects a computer and limits users from accessing the system until they pay a ransom. The Internet Crime Complaint Centre reported that from April 2014 to June 2015, damages caused by ransomware alone cost companies $18 million.3 Ransomware attacks primarily target consumers and therefore result in individual and financial damages. However, attacks on critical infrastructure could cost billions and cause far greater damage. An intentional shutdown or tampering with critical infrastructure data could result in power outages, toxic water levels, along with a communication shutdown preventing emergency response. The rising concern is a twofold attack, while emergency workers are responding to a water main break, hackers can attack a power plant and leave an entire city in the dark. Security experts continue to implement cyber defence strategies. However, with the increasing risk of cyber wars no strategy is completely secure. The Cost Of Cyber Threats Three decades ago, malicious activity and cyberattacks were rarely an issue. But now threats have become a reality and cybersecurity has become an absolute necessity. A recent study published by the Atlantic Council and the Zurich Insurance group estimates that cyberattacks could cost up to $90 trillion by 2030 if cybersecurity fails to advance at a rapid pace.4 Therefore, every IIoT company should be aware that their device can serve as a backdoor to an industrial control system. ICS or Supervisory Control and Data Acquisition (SCADA) systems are extremely vulnerable, as they are the brain of critical infrastructure. Surprisingly, companies still create devices with insufficient security technology, lacking even basic features such as authentication and authorization. Without proper security, attackers can use these devices as an entry point into the SCADA system. Once the SCADA system is compromised, the attackers can leak critical information and even reconfigure the programmable logic controllers (PLCs) to cause significant damage. For example, in a water utility this could be executed by setting the water network to a very high pressure, resulting in network-wide pipe leaks and main breaks. False low sewer water level data could be transmitted, resulting in CSO events which would flood the streets and result in public health and safety risks and heavy regulatory fines. Even with cyber defense on the rise, there have been many more documented and undocumented attacks. There were over 160,000 reported attacks on SCADA systems worldwide during 2013 and over 675,000 attacks in 2014. Many of the attacks were carried out by exploiting simple buffer overflows (e.g., feeding more data than the system’s temporary memory storage could hold), which can result in corrupted data, a program crash, or cause the execution of malicious code. The number of unreported attacks is potentially significantly greater, as most companies are only required to report data breaches that compromise payment or personal information.5 The threats to critical infrastructure are increasing, especially on infrastructure controlled by ICS. As our world becomes more connected, the potential scale of damage to critical infrastructure begins to boggle the mind. In 2003, the infamous Northeast Blackout left 50 million people in eight states without power. It cost around $6 billion and resulted in 11 fatalities.6 The power outage was caused by a software bug. Imagine the severity and scale of damage that could have transpired had the blackout been caused intentionally by a hacker. Securing An IIoT Device As an IIoT company, Ayyeka developed a device that incorporates current best practices in cybersecurity. This paper will cover the key steps to securing an IIoT devices and understanding device vulnerabilities. These include: embedding cybersecurity into the IT architecture, securing communication protocols, and implementing additional security measures for delivering data to SCADA systems. Page 20
  • 21. The most basic security level is to install a firewall along with an intrusion detection system (IDS). Humans cannot be programmed to detect when a suspicious person is looming on their property, but firewalls can. A firewall is run by security rules that control the incoming and outgoing network traffic as protection from unauthorized attackers. The next step is to encrypt sensitive data. For utilities, it is a given that hackers will try to intercept the communication from field devices. Therefore, it is crucial to think like a hacker and identify the weakest link in the network and implement additional security measures. For example, encrypt all communications between field devices and the SCADA system. Investing In Cybersecurity Devices that communicate from the field to a SCADA system create an entry point into the SCADA system. The most notorious example of a digital weapon attacking a SCADA system was a malicious virus known as Stuxnet. The virus silently took over Iranian uranium enrichment plant for over a year without being detected. Stuxnet manipulated the SCADA system and damaged the centrifuges as well as the enrichment process. Many believe the attack was carried out via infected USB drives, clearly demonstrating the vulnerability of SCADA systems.7 After the attack made headlines, world leaders began to worry about their own critical infrastructure and started to implement cybersecurity task forces to regulate security requirements. Although these issues are under the radar for some private companies, the U.S. Federal Administration is investing in and enforcing stringent cybersecurity regulations which will quickly spillover into the private sector. In the U.S. alone, the 2016 proposed national cybersecurity budget has reached $19 billion. The budget includes a proposal for a National Centre for Cybersecurity Resilience where companies and organizations can test security measures by initiating a cyberattack on a replica power grid, investing in enhanced cybersecurity, and securing the personal data of its many citizens. While government is taking a more proactive approach, cyber-attackers continue to become increasingly sophisticated. Cyberattacks come in many forms. After an IIoT company secures all the endpoints, the next step is securing the data. For example, in a water treatment plant, attackers could inject false chlorine readings and then feed the false data to the SCADA system. It is very difficult to detect tampered data, which is why critical infrastructure operators need to implement preventative security measures. A useful tool for preventing false data injection is an automated system to detect suspicious activity. For example, when monitoring drinking water, if the pH level spikes, the chlorine levels are likely to drop. Machine learning algorithms can automatically learn such relationships between various parameters and warn if one parameter deviates from its expected behaviour. Cloud Storage And Reverse Entry Points While cloud storage is the most common data storage method in the consumer market, many industrial end users prefer to bypass third-party cloud storage and ensure the data is securely stored and delivered from field devices to their closed networks or SCADA systems. This can only be achieved by investing in cybersecurity and ensuring seamless SCADA integration for end-users. Some government offices worry about the security of cloud storage when considering the damage that could result if the data was accessed by someone intending to do harm. For this reason, companies should offer secure data transmission with on-premises servers in addition to cloud storage. Non-critical data can be viewed on the cloud and used as an auxiliary system, entirely outside a SCADA system. IIoT Devices: A Step-By-Step Security Strategy It is critical to develop multilayered cybersecurity solutions that reduce the risk to the ICS. IIoT devices that deliver data to ICS need to have a communication pathway that is secure and difficult to intercept. Ideally, devices should not be connected via a fixed IP address and wait for incoming connections — such devices are sitting ducks begging to be infiltrated. Instead, devices should use dynamic IP addresses and initiate the data sessions to the SCADA system only when needed. The logic is simple — it is easier to protect the SCADA side from malicious incoming connections than it is to protect the device side. Authentication is just as important; it guarantees that unidentified devices cannot intercept the communication. An additional level of security is restricting the device’s communication to short intervals and as soon as the data transmission is complete, the device shuts off the communication channel. Hackers looking to attack a field device would have a narrow window to do so. They would need to call into the private network at the right time, successfully proceed past authentication, and decipher the encryption, which is difficult to achieve. Endpoint Security For Cellular IIoT Devices Endpoint security is just as important for IIoT devices. The device must meet certain criteria before transmitting data to an internal server or cloud storage. Since many IIoT devices communicate over cellular networks, they use SIM cards. Many end users rely on cellular operators to provide them with a ‘secured’ Access Point Name (APN). They assume the information is secure and therefore do not encrypt their data. But how can one secure something one does not control? APNs lack full security monitoring capabilities, thus securing the endpoints and encrypting the data is vital. If an unauthorized user gains access to the SIM card, they could easily access all the devices under the same APN. IIoT is built upon a device to device communication, or Machine to Machine (M2M) communication. Sensors enable us to measure and monitor almost anything. Integrating sensors with IIoT devices enables equipment (like a water tank) to become a smart device and transmit data to an internal server or cloud based software. When considering reverse entry points to ICS, many overlook the vulnerability of sensors because they have yet to be reported in malicious attacks. A cyber- attacker can easily uninstall a sensor from an IIoT device and reinstall a malicious sensor to feed false data to the control system. Worse yet, an attacker could use the sensor as an entry point into the SCADA system and carry out an attack and damage critical infrastructure. The best way to protect the sensor is through sensor fingerprinting, which provides an additional layer of authentication. Moreover, sensors with built-in alarms can be programmed to send an alert anytime a sensor is tampered with. These two security features are designed to prevent unauthorized users from accessing or tampering with the sensor. Best Practices In Cybersecurity Cybersecurity is not a one-time investment. Each and every utility and critical infrastructure operator needs to take into account every device that has Page 21
  • 22. About the Author Michelle Nadboy is responsible for marketing and business development at Ayyeka, a technology company that develops end- to-end remote monitoring solutions for industrial and environmental applications. Prior to Ayyeka, Michelle worked in both the private and public sectors with a focus on environmental and sustainability issues. She holds an M.Sc. in Sustainability Management from Columbia University and a B.A. in Environmental Law and Policy from Binghamton University. Ayyeka provides cyber-secure, plug-and-play, remote monitoring solutions designed for various markets. Founded in 2011, Ayyeka has a successful installed base in challenging locations and earned a reputation for excellent sales and service. Bringing together a state-of-the-art hardware and cloud-based software package, Ayyeka’s solutions are leading the infrastructure monitoring sector into the future. communication capabilities. Cyber protections require a holistic approach; a customized solution should be designed for each utility and operator. It begins with assessing every component in the internal network and identifying the devices with communication capabilities supplied by external vendors. Ayyeka researches and invests in implementing best practices in the IIoT industry: this includes encrypting data, using a private network or subnet for field deployed devices, authentication, minimizing the usage of the device’s communication channel, restricting the communication between the device and the ICS, and securing the sensor. Security features should be designed to protect the SCADA system and to secure every connection point where data is being collected and delivered. Today, more advanced sensors are being developed and integrated with autonomous IIoT devices. Cybersecurity must evolve and anticipate more sophisticated and creative attacks. There are currently over 13 billion connected devices operating in the field; each device likely has at least one loophole or backdoor that could serve as an entry into critical infrastructure data. Therefore, we have a pressing need to secure all these devices before we continue to flood the market with additional IIoT devices. Advanced cybersecurity practices need to be implemented now; before we reach a point of no return, with the predicted 38.5 billion insecure IoT devices deployed in the field. References 1. “‘Internet of Things’ Connected Devices to Almost Triple to Over 38 Billion Units by 2020.” Juniper Research, 28 July 2015. Web. Retrieved 8 Mar. 2016. http://www. juniperresearch.com/press/press-releases/iot-connected-devices-to-triple-to-38-bn-by-2020 2. “Internet of Things: Example Applications.” Internet of Things. Postscapes, n.d. Web. 30 May 2016. http://postscapes.com/internet-of-things-examples/ 3. FBI, IC3. “Internet Crime Complaint Centre (IC3) Criminals Continue to Defraud and Extort Funds from Victims Using CryptoWall Ransomware Schemes.” Internet Crime Complaint Centre. 23 June 2015. Web. Retrieved 10 March 2016. http://www.ic3.gov/media/2015/150623.aspx 4. Morgan, Steven C. “Cyber Security Market Report.” Cyber-Security Ventures. People’s Communications Inc., 3 Aug. 2015. Web. 21 Mar. 2016. http:// cyber- securityventures.com/cybersecurity-market-report-q3-2015/ 5. “SCADA Vulnerability on the Rise | EE Times.” EETimes. Rich Quinnell, 24 Sept. 2015. Web. 26 Apr. 2016. http://www.eetimes.com/document.asp?doc_ id=1327785 6. Minkel, J. R. “The 2003 Northeast Blackout -Five Years Later.” Scientific American, 13 Aug. 2008. Retrieved 8 Mar. 2016. http://www.scientificamerican.com/ article/2003-blackout-five-years-later/ 7. Kushner, David. “The Real Story of Stuxnet.” IEEE Spectrum. N.p., 23 Feb. 2016. Web. 1 June 2016. http://spectrum.ieee.org/telecom/security/the-real- story-of- stuxnet 8. “FACT SHEET: Cybersecurity National Action Plan.” The White House. Office of the Press Secretary, 09 Feb. 2016. Web. 01 June 2016. https://www.white- house.gov/ the-press-office/2016/02/09/fact-sheet-cybersecurity-national-action-plan Page 22