Download to read offline


![Quantifying Non-Revenue Losses
Most utilities estimate that 10 to 30 percent of water pumped into distribution
systems is lost due to leaks before it even reaches customer meters. Utilities
conduct audits to determine how much water pumped into the distribution
system is actually metered. These audits are based on methods developed by
the American Water Works Association and International Water Association that
identify non-revenue water (NRW) loss from all sources, including consumption
that is metered, unmetered and unauthorized, and that often cost tens of
thousands of dollars.
AMI data can make these audits more accurate by helping utilities identify where
loss may be occurring. For example, AMI data can identify meters that are not
recording properly, either because they are broken or have been bypassed through
theft. Unmetered water usage, whether authorized or not, is a key source of NRW
loss.
In addition, a major NRW culprit is using the wrong-sized meter in an application,
such as when a high water use business (e.g., a laundromat) moves into a
commercial building originally developed for light industrial use. If the wrong
meter is used, it may not record all the water that is used, which results in lost
revenue.
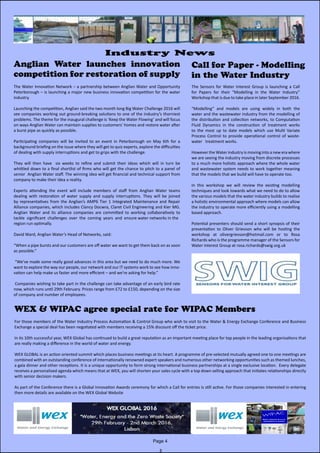
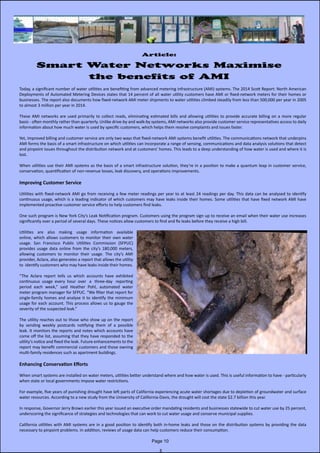
Acoustic loggers integrated into a fixed-network system can identify small, underground leaks before they become big problems.
Analysing AMI data over time can also provide a good indication of which meters are about to fail or go out of warranty. Most meter shops schedule meter
replacement at regular intervals (usually every 10 to 20 years). If analysis identifies one meter that is performing significantly worse than similar ones, the utility
can target the poorly performing meter for replacement immediately instead of waiting for an arbitrary time period to pass.
In addition, AMI systems offer time-stamped readings that give a clear picture of the true health of a system by allowing the utility to view an entire system’s
consumption at specific points in time.
“Time-stamped reads are great for production, helping us come up with accurate water-loss numbers,” said Josh Wedding, water system operator for
Redmond, Ore., which deploys an Aclara STAR network for AMI. “We use that monthly to do [a] water-loss audit. Our water loss annually is about 3.5 percent.”
Time-stamped reads also help keep costs down, according to Wedding. “Every gallon of water pumped that we don’t sell, we have to write off,” he said.
“Time-stamped data helps us provide more cost-effective service to customers.”
Discovering Distribution Leaks
Underground leaks in the distribution system are a primary cause of NRW loss but can be difficult to locate. Acoustic loggers integrated into a fixed-network
system can cost-effectively identify small, underground leaks before they become big problems.
The loggers associated with Aclara’s STAR ZoneScan system, for example, send data to the utility over the fixed network, where web-based application software
automatically correlates the data and identifies and locates high-probability leaks. This approach simplifies acoustic leak detection, eliminating the need to
send crews into the field and providing the means to manage the process from the utility.
Once the units are installed, operators can monitor the system and analyse results at the utility office. No manual or drive-by data collection is required.
The system can be deployed stand-alone or added on to an existing STAR network AMI system, and operates with minimal operator involvement. Aclara has
deployed the technology in a number of East Coast communities such as Sylacauga, Ala., which uses the system to find underground leaks that occur on
hundreds of miles of galvanized service lines and cast-iron pipes.
“This type of pipe, some of which was installed as early as 1906, is more likely than others to leak because of corrosion,” said Mike McGinnis, superintendent
of water in Sylacauga. “In a half-mile radius, we might find six leaks. Every place we have installed the system, we have found leaks that we can repair.”
The STAR ZoneScan system was one of the tools that helped Sylacauga reduce its NRW losses from about 34% to 23%.
Final Thoughts
When considering automation of meter reading, utilities should weigh the benefits of a fixed AMI network for a truly smart infrastructure. Improvements in
customer service, conservation efforts, quantification of non-revenue losses, leak discovery, and operations improvements provide long-term, 21st century
benefits over both drive-by and walk-by systems.
As water utilities are asked to quantify their costs and results, fixed-network communications networks that facilitate smart infrastructure solutions become a
critical component of their technology toolbox.
About the Author
Todd Stocker is the Director of Product Management at Aclara, he has an extensive background working in product marketing and business development in extremely technical
companies. He has a unique capability of understanding the technical aspects of a company’s products, combined with the ability to have commercial, and business discussions.
Page 11](https://image.slidesharecdn.com/wipacmonthly52ndedition-january2016-160128233555/85/WIPAC-Monthly-January-2016-11-320.jpg)


The WIPAC monthly update highlights various trends and innovations in the water industry for January 2016, including advancements in smart water networks and the impact of energy tariffs on operational costs. Articles discuss the benefits of advanced metering infrastructure, optimized wastewater treatment processes, and case studies of successful technology implementations. Additionally, the document features industry news, including competitions and workshops aimed at enhancing collaboration and innovation within the sector.