Why Microstrategy and why learn microstrategy training ,Business Analytics with Microstrategy,Microstrategy Business Intelligence, Why we are using Microstrategy,microstrategy business intelligence software
Harnessing the power of data for competitive advantage with MicroStrategy Enterprise Analytics. This presentation was given at the Florida MicroStrategy User Group Meeting on September 17th, 2015. To learn more about these meetings, join the user group on LinkedIn at https://www.linkedin.com/groups/MicroStrategy-Florida-User-Group-8393233/about
This document provides an overview of MicroStrategy, a business intelligence platform that allows organizations to analyze large datasets and create visualizations across devices. It discusses MicroStrategy's desktop, mobile, and web interfaces that enable report design and consumption. Key benefits of MicroStrategy include support for various data sources, in-memory analytics for performance, and reusable metadata. Large companies like Adobe, Netflix, eBay, and Wells Fargo are highlighted as MicroStrategy customers who praise its scalability, query performance, and ability to adapt to business needs.
This document provides an agenda and overview for a training on Microstrategy, a business intelligence tool. The agenda includes sessions on Microstrategy's organic architecture, metadata unified model, and hands-on experience with Microstrategy projects, OLAP, and visual insight. The document also discusses Microstrategy's architecture, modules, and development tools. It explains how Microstrategy provides interactive reporting, analysis, dashboards, alerting and other functions through a unified platform that accesses various data sources.
Microstrategy is a business intelligence software that allows reporting and analysis of data stored in relational databases, multidimensional databases, or flat files. It includes various components like the Intelligence Server for report serving, the Web Universal interface for interactive reports in a web browser, and the Narrowcast Server for automated delivery of business information to users. Microstrategy uses technologies like Java/J2EE and supports features such as real-time dashboards, detailed reports, and data analysis.
AWS Webcast - Sales Productivity Solutions with MicroStrategy and RedshiftAmazon Web Services
Sales Force Automation (SFA) and Customer Relationship Management (CRM) tools, such as Salesforce.com and Microsoft Dynamics CRM, are ubiquitous tools that provide all of the transactional capabilities required to manage a company's sales pipeline. SFA and CRM data alone, however, is limited and so combining it with information from other sources enables you to create unique and powerful insights. When combined with product and financial data, for example, get visibility into relationships between geographies, sales reps, product performance, and revenue to ultimately optimize profits. Layer on advanced analytic to make predictions about future product sales based on seasonality and other market conditions. To unleash the full power of the CRM and dramatically increase operational performance and top-line revenue, companies are leveraging advanced analytic and data visualization to deliver new insights to the entire sales organization. Moreover, delivering these sales enablement productivity solutions on mobile devices, ensures strong adoption across every sales team. Join us in this webinar to learn how to use MicroStrategy together with Amazon Redshift to build mobile sales productivity solutions for your business.
MicroStrategy BI Solutions for Retail IndustryBiBoard.Org
MicroStrategy provides business intelligence solutions for retail companies. It has over 20 years of experience in BI software and is the largest independent public BI vendor. MicroStrategy supports over 300 retail companies worldwide, including 8 of the top 10 global retailers. The document provides examples of how various well-known retailers like Ahold, Hallmark, GUESS, Netflix, METRO Group, Ross Stores, Whole Foods Market, and Lowe's use MicroStrategy's solutions for store operations, customer analytics, merchandising, and vendor collaboration. It also discusses how MicroStrategy helps retailers address trends in analytics, cloud, big data, and mobile technologies.
MicroStrategy 9 Release 2 is the latest software release from MicroStrategy that makes Business Intelligence faster, easier, and more user-friendly. Specific enhancements in Release 2 yield benefits including higher performance, faster deployment of new applications, and next generation dashboard applications with more data and larger scale distribution. The release also introduces the MicroStrategy Health Center and Jump-Start Project to enable rapid application development and automatic system maintenance.
This document introduces MicroStrategy 9.2 and its new capabilities for visualizing business data. It discusses [1] Visual Insight, which allows users to get insights from data in under 30 minutes; [2] Dashboard Applications, which publish information throughout enterprises; and [3] Mobile Intelligence, which unleashes information on mobile devices. The document demonstrates how MicroStrategy provides faster, more visual ways to access and share business insights.
MicroStrategy World 2014: Scaling MicroStrategy at eBayTim Case
eBay has one of the largest data warehouses in the world! See how the BI Platform team at eBay had to rethink and rebuild their system architecture and processes in order to support the ever-growing data volume and scalability needs of their developers and users.
MicroStrategy Business Intelligence Solutions for Financial ServicesRK Paleru
The document discusses MicroStrategy and its business intelligence solutions for the financial services industry. It states that MicroStrategy has over 1 million business users at over 3,000 organizations worldwide and that 12 of the 20 top global banks use MicroStrategy. It provides examples of several large banks and financial institutions that use MicroStrategy solutions to analyze transactions, enhance business performance, strengthen customer relationships, and monitor spending habits.
Self-service business intelligence (BI) is a new method that eliminates the need for IT involvement in data access, interpretation, and analytics. It provides simple tools for independent business users to analyze data, create reports, and visualize situations. The IT team still structures and curates the underlying database, big data, and BI systems. This empowers business users to generate better and more meaningful reports and interpretations using their own expertise, freeing up IT resources for other tasks. Benefits include faster business decisions, increased productivity and ROI.
The document describes how MicroStrategy 9 technology can consolidate multiple levels of business intelligence (BI) initiatives. It discusses how MicroStrategy 9 extends the performance, scalability, and efficiency of enterprise BI through features like in-memory processing and 64-bit architectures. It also explains how MicroStrategy 9 enables rapid deployment of departmental BI applications and provides a smooth migration path from departmental to enterprise BI.
Modern Business Intelligence - Design and ImplementationsDavid J Rosenthal
During the first two “waves” of business intelligence, IT professionals and business analysts were the keepers of BI. They made BI accessible and consumable for end users.
While this approach still applies to complex business intelligence needs, today there is a new “wave.” This third wave of BI makes BI available to every kind of user.
As customer strive to take advantage of the digital transformation that is occurring in virtually every industry, they need to re-evaluate how they engage with their customers/prospects, how they transform their products and operations, and how they empower and understand their employees.
In today’s world, doing each of these things is more and more reliant upon data…traditionally, everything you knew about your customers and prospects was available in your business application systems and in the heads of employees. You learned almost everything about your products BEFORE they left your warehouse. Employees used technology more to enter data than to learn from it.
In the data-driven world we live in today, leveraging intelligent insights from data across customers, products, and employees is critical to be able to stay competitive and keep up with or lead digital transformation in any industry. And this isn’t just a customer’s typical business application data – it’s also about augmenting the customer’s data with additional data (e.g. search, employee behavioral data, sentiment data, benchmark data, etc..) – and applying the right intelligence to drive meaningful insights.
Big data analytics is used to extract meaningful insights from data through identifying hidden patterns, correlations, trends, and customer preferences. It provides advantages like better decision making and preventing fraud. Business intelligence encompasses technologies, applications, and practices for collecting, integrating, analyzing, and presenting business information and is data-driven to support decision making. Business intelligence tools allow users to identify actionable information from raw data to facilitate data-driven decision making.
Instant Data Discovery with Dashboards and Visual AnalyticsMia Yuan Cao
Join us to learn how you can uncover deeper insights from your data through instant data discovery with JReport. Get a preview of our ad hoc analysis tool called Visual Analytics that enables self-service interactive data analysis powered by in-memory cube technology. With visual feedback and drag and drop actions, JReport let's you explore your data from different perspectives resulting in fast discovery of actionable information.
A global overview of the new Oracle business intelligence suite 11g by Oracle.
As the word's first specialized partner for the BI Foundation we would to share these slides with you.
From Business Intelligence to Big Data - hack/reduce Dec 2014Adam Ferrari
Talk given on Dec. 3, 2014 at MIT, sponsored by Hack/Reduce. This talk looks at the history of Business Intelligence from first generation OLAP tools through modern Data Discovery and visualization tools. And looking forward, what can we learn from that evolution as numerous new tools and architectures for analytics emerge in the Big Data era.
There are a variety of tools used to collect, organize and analyze business data for intelligence purposes. These include spreadsheets for visual data management, reporting and querying software to extract and summarize data, online analytical processing to quickly answer multi-dimensional queries, data mining to uncover patterns, data warehousing for comprehensive reporting, process mining to determine business processes from event logs, digital dashboards for real-time overviews, and performance management tools. Understanding these business intelligence tools is essential for companies to utilize data analytics and make better decisions.
1. The document provides instructions for navigating and using the MicroStrategy Web interface, including how to log in, access projects and reports, download purchase orders, and use the navigation toolbar.
2. It explains the different sections on the project home page and how to access shared, ordered, and confirmed reports. Instructions are provided on searching for objects and downloading orders by supplier, site, order number, or date.
3. Screenshots demonstrate the login page, project home page, report options, and a sample purchase order report. The navigation toolbar, menu bar, and action bar are described along with how to save and browse objects.
Intersection of Business Intelligence and CRM vsr12David J Rosenthal
The document discusses the intersection of business intelligence (BI) and customer relationship management (CRM). It notes that both BI and CRM solutions are increasingly in demand by clients as next-generation technologies that go beyond just software. The document outlines some of the key benefits that BI and CRM provide, such as driving higher sales efficiency, measuring sales pipeline trends, analyzing customers across data sources, and increasing opportunities for cross-selling and up-selling. It also discusses trends toward mobile access, social media integration, big data, and the cloud.
The initial scope of the WVFIMS Business Intelligence project was a pilot program using Microsoft BI tools on a small dataset of two years of expense data from two departments. The project was successful and expanded to a fully-functional data warehouse of six years of revenue and expense data totaling 14.5 million records. The project team implemented Microsoft SQL Server, Analysis Services, Reporting Services, SharePoint, and PerformancePoint to provide self-service reporting, advanced queries, and dashboards on expenditure and revenue data.
The document discusses the evolution of business intelligence from traditional to real-time and closed-loop systems. It describes moving from batch-based transactional data warehousing to analytical applications with real-time feeds and embedded business intelligence, enabled by technologies like BPM, EAI and decision rules. This creates a more intelligent and flexible solution.
GDPR Compliance Made Easy with Data VirtualizationDenodo
Companies should be gearing up for May 25, 2018 when the General Data Protection Regulation (GDPR) comes into effect. GPDR will affect how businesses that serve the European Union collect, use and transfer data, forcing them to provide specific reasons and need for the personal data they gather and prove their compliance with the principles established by the regulation.
The regulation is already creating many challenges for companies, including:
• Ensuring secure access to most current data, whether on or off-premise
• Consistent security across all data sources
• Data access audit
• Ability to provide data lineage
This webinar aims to demonstrate how data virtualization has surfaced as a straight-forward solution to many of the challenges and questions brought on by the GDPR. It will also include a case study of how Asurion already achieved the desired level of security with data virtualization.
Watch the webinar in full to learn more about the benefits of using data virtualization to smoothly comply with the GDPR: http://ow.ly/1kzk30bRw3i
This document discusses a presentation on developing powerful and quick sales analytics solutions with Power BI for Office 365. It introduces Netwoven as a consulting firm and the speaker, Murali Madhusudana. Key topics covered include self-service BI, common BI challenges, BI maturity levels, challenges faced by power users, the definition and benefits of self-service BI, and how Power BI for Office 365 addresses self-service BI needs.
Finally, you don’t have to choose between aging legacy BI or limited data discovery tools because Birst is now available on SAP HANA. The combination of Birst’s agile Business Intelligence and the lightning fast performance of HANA enables you to analyze more data, more quickly than ever before leading to new insights on how to improve the performance of your organization.
Miss the Webinar launch of Yellowfin 7.3 – the latest version of our Business Intelligence (BI) and analytics platform? Don’t sweat it.
We thoughtfully recorded the session for your on-demand viewing pleasure.
Discover how to set your data free with Yellowfin 7.3: http://www.yellowfinbi.com/YFCommunityNews-Yellowfin-7-3-Launch-Webinar-Recording-and-Slides-245644
Yellowfin 7.3 will be generally available Friday 25 November. If you’d like to get your hands on a copy, or want a personalized demonstration of Yellowfin 7.3, simply contact sales@yellowfin.bi
Why watch?
Watch the launch of Yellowfin 7.3 and discover how to conduct deeper, faster data analysis and create more compelling BI content in less time. Be among the first to see how we’re adding Data Preparation, Set Analysis and new charting features to substantiate Yellowfin’s position as the broadest end-to-end modern BI and analytics platform on the market.
Yellowfin 7.3 contains major additions and improvements, including:
¥ Data preparation: Quickly and independently prepare trustworthy data for reporting and analysis, without waiting for IT. Be empowered to integrate, access and act on more data sources in less time with Yellowfin’s new Data Preparation Module.
¥ Set Analysis: Enjoy the flexibility to answer complex business questions faster, and with greater ease. Build sophisticated charts, to create comparative analysis, in a few simple steps.
¥ New Content Creation Canvas: Create a culture of data-based decision-making and engage users throughout your organization with BI content built specifically for their particular needs. Experience the freedom and flexibility to quickly create customized analytic content and infographics to suit any user type or situation – no coding required.
¥ Connectors: See how Yellowfin’s latest range of connectors and pre-built dashboards for third-party Web applications are connecting people and their data.
MicroStrategy 10.2 includes several new features to improve the user experience and analytics capabilities. Key updates include making it easier to integrate custom visualizations, adding dashboard annotation tools, improving map labels, and streamlining the installation process. The release also features enhanced reuse of document themes, replacing datasets without needing to rebuild documents, and auto-partitioning of cubes for faster processing. Customizable home screens, viewing dataset connectivity status, and new security features for Usher badges are also highlighted in the summary.
Where is microstrategy used and job trendsBigClasses Com
Where is microstrategy used,microstrategy job trends,using microstrategy business intelligence,why we use microstrategy,microstrategy visual dashboard,microstrategy easy to use,microstrategy supports interactive dashboards
The document discusses the Catholic tradition of praying the rosary during the month of October. It describes one of the mysteries of light, the Transfiguration of Jesus, and includes the prayers said during each decade of the rosary, including repetitions of the Hail Mary prayer focusing on events in the life of Jesus and praising Mary.
The document discusses the production of a music video for the song "Skeletons & Spirits" by Allison Crowe. In creating the video, the producer drew inspiration from Tim Burton's style and movies like Nightmare Before Christmas. Storyboards were created during pre-production that told a story matching the lyrics through animated characters in Burton's quirky style. Unlike Andrew Goodwin's conventions, the final video did not include the artist and was fully animated rather than including live-action footage.
The document summarizes feedback received from various sources on different projects:
1) The majority of feedback on an advertisement was positive, finding the design effective and appealing.
2) Feedback on a CD digipack was mixed, with some finding the font too florid while others thought it fit the band's style.
3) Feedback on a music video was also mixed, with some feeling the animation did not match the lyrics well enough while others appreciated the effort involved.
Jon Ritchie, superintendent of Orrville City Schools presentation to Orrville High School Alumni Association at the Red Rider Revenue Roundup kickoff on Sept 10, 2009.
The document outlines photo shoot designs for a gothic band's album. The front cover will feature the lead singer sitting and looking up with clasped hands beneath his chin, taking a high and threatening pose. Interior pages will show screenshots of music platforms and the model striking gothic and threatening poses in front of backdrops. Double page spreads will depict the model sitting in a chair with relaxed or threatening expressions, with some images in black and white or sepia and smaller than the main close-up image of the model with dominating gothic makeup and stance.
The document provides analyses of several club music CD covers. It notes design elements like bright colors, bold text, and strobe lights that help the covers stand out. It also discusses the use of sexuality to appeal to audiences, with several covers featuring scantily-clad or provocatively posed women to draw the interest of male buyers. Overall, the covers are described as using visual cues to imply an exciting club experience and promote a sense of sexiness.
Dokumen ini membahas tentang sembelihan binatang menurut Islam. Sembelihan adalah menghilangkan nyawa binatang halal dengan benda tajam untuk dimakan. Semua binatang halal harus disembelih kecuali ikan dan belalang. Sembelihan wajib kecuali untuk ikan dan belalang, dan ada syarat-syarat sah seperti putusnya urat pernafasan dan makanan.
- The document provides tips for creating effective PowerPoint slides, including using outlines, limiting text per slide, font size and type, color, backgrounds, graphs, and proofreading.
- Key recommendations are to use bullet points instead of paragraphs, 18pt font or larger, high contrast colors, simple backgrounds, properly formatted graphs, and checking for spelling and grammar errors.
- The conclusion recommends ending with a slide summarizing main points and inviting questions.
Se ha popularizado la Florecilla de san Francisco sobre la Perfecta Alegría. Pero quizá sea bueno compararla con la exposición que el mismo Santo hace en los Avisos espirituales. Puede que nos parezca un poco más dura, menos poética.
This document provides guidance on conducting research to support the evangelizing mission of parishes. It discusses the aims of applying lessons from previous modules to analyze parish work and conduct an original research project, such as a survey. Examples of research methods like statistical analysis and qualitative reflection are provided. The document also explores the concepts of mission, parish, and evangelization in order to help students articulate a concise mission statement for their own ministry.
MicroStrategy Mobile allows organizations to build a variety of essential mobile apps that deliver workflows, transactions, mobile operations systems access, multimedia, and business intelligence in compelling custom native apps. It brings capabilities around performance, scalability, security, internationalization, and monitoring to enterprise apps on day one. MicroStrategy Usher replaces traditional forms of ID with a secure mobile digital "badge" making authentication convenient, seamless, and secure across the entire enterprise.
Universal Music Group is one of the largest music conglomerates in the world. It owns and distributes the work of many popular artists like Lady Gaga, Timbaland, and Bon Jovi. The company's CEO, Doug Morris, is planning to step down in 2010 and will likely be replaced by Lucian Grainge. UMG distributes music in both physical and digital formats through various online retailers and streaming services. This allows the company to market its artists and music to a massive online audience.
Universal Music Group (UMG) is a major music label that owns and distributes music from various artists. UMG uses a variety of marketing techniques like YouTube channels and music festivals to promote its artists. The rise of digital music distribution through iTunes and streaming services has benefited UMG by providing new ways to distribute music, but has also harmed CD sales. UMG adapts to changing media technologies to find new artists and reach music fans.
Tel It to the People: Technology Enhanced Learning and the Making and Hacking...Brock Craft
This document discusses using small programmable technologies and robotics to support embodied and kinesthetic learning, especially in mathematics education. It describes a 2-month exploratory project that designed hardware and software prototypes involving virtual angles, spherical geometry, and maps/journeys. These were tested in classrooms to engage students physically with mathematical concepts like non-Euclidean geometry. The results suggest students and teachers were engaged and interested in hacking new learning designs using programmable objects.
Learn how to create interactive sap businessobjects dashboards. sap bo dashboards charts, graphs, and buttons.SAP Crystal (BusinessObjects Xcelsius) dashboards.
Watch SAP BO Dashboards video
The document summarizes and compares two magazine double page spreads. For the first spread from Q magazine, the large central picture draws the viewer in and the bold black title stands out against the pale background. The second spread from mixmag effectively uses blue tones that make the white text pop and features varied pictures that break up the text. Both spreads employ striking mastheads in high-contrast colors and layouts that balance text and images across the two pages.
This document discusses reducing the total cost of ownership for enterprise business intelligence systems. It finds that staffing costs make up the majority (63%) of total ownership costs. As business intelligence applications expand over time to meet changing business needs, staffing needs and costs also increase. The document argues that the MicroStrategy platform is designed to minimize staffing costs and deliver scalable business intelligence through features like end user self-service and ease of administration. This helps control total ownership costs and increase return on investment compared to other business intelligence platforms.
Delivering scalable and high performance BI with least IT effortBiBoard.Org
This document presents an overview of the technical results of a joint-MicroStrategy and HP
performance benchmark. The tests show how MicroStrategy Business Intelligence (BI) Platform and
HP Integrity Servers provide a scalable and cost-effective solution for organizations looking to deploy
mission critical Enterprise BI applications
The document provides an overview of the GoodData analytics platform. It discusses how the platform aims to democratize analytics and empower more business users, beyond just analysts. The platform is designed to distribute analytics to business networks to drive revenue, efficiency and other benefits. It achieves this through its distribution, analytics and insights services which allow customers to define, distribute and improve analytic products for their networks.
Unifying the big data analytics stack by enabling ETL, OLAP, visualization, and collaboration via a single interface. Get an End To End implementation of The Modern Analytics Architecture.
Zy Vision Visualizations For Real Time Datatresag71
This document describes a solution that integrates Panopticon's real-time data visualization software with MicroStrategy's reporting capabilities. This combined solution delivers effective monitoring, fast analysis, and accurate reporting of real-time data to help users make better decisions faster. It allows users to directly access and analyze real-time operational data from various sources. Panopticon's in-memory data model powers the real-time capabilities and can connect to different data sources. The combined solution provides interactive data visualizations critical for operational decision making.
At iStream, our vision is to empower businesses and organizations by harnessing the intelligence of data analytics using open source technologies and platforms.
Our i360 intelligence suite will enable businesses to enhance their organization’s strategies based on data-driven deployments, effectively turning data into business decisions and smarter strategies.
Dedicated to our client’s success, we are driven by innovation that matters and our solutions are developed to enable organisations to focus their efforts on more pertinent issues, to gain a sustainable edge in driving business and organisational innovations.
i360 @ Kuala Lumpur, Malaysia
Big Data Solutions, Big Data Services | V2SoftV2Soft
V2Soft provides advanced integrated customized Big Data Infrastructure Management Solutions, Application Development, Analytics services across domains which help customers maximize revenue and increase operational efficiency.
This document provides a summary of a candidate's professional profile. The candidate has over 6 years of experience designing, developing, and implementing solutions using Microsoft Business Intelligence tools. He is skilled in data migration, quality analysis, and cleansing. The candidate has experience leading teams and managing all phases of software development projects. His educational background includes a master's degree and certifications in Microsoft technologies.
Simhachalam Mutyala has over 6 years of experience as a MicroStrategy consultant focusing on business analysis, requirements, development, testing, administration, and implementation of BI solutions. He has extensive experience using MicroStrategy products like Desktop, Architect, Object Manager, and Web. He has experience designing schemas, creating reports and dashboards, administering security roles and user privileges, and performance tuning MicroStrategy projects. His experience includes projects for clients such as Saudi Telecom, Vodafone India, BSNL, SABMiller, and Tatasky.
MAIA is a large Indian business intelligence product company with over 50,000 licensed users and 300 customers in India, the Middle East, and Africa. Some of its key products include 1KEY Agile BI Suite for reporting and analysis, 1KEY FCM for financial consolidation, and postXBRL for business reporting. MAIA has received several awards and recognition for its product innovation leadership in business intelligence. It offers solutions like 1KEY Cube for multi-dimensional analysis and 1KEY Touch Dashboard for rich interactive dashboards. MAIA's hybrid BI architecture provides an easy to deploy platform for online and offline reporting and analytics.
Micro Strategies is a privately owned technology solutions and consulting firm established in 1983 with locations in New Jersey and Pennsylvania. They leverage their business process and IT expertise to deliver innovative technology solutions across a range of industries. Their solutions include infrastructure, cloud, big data and analytics, security and mobility, enterprise content management, and managed support services. They have strategic partnerships with IBM, Microsoft, and other technology leaders.
Vivantek is a consulting company that has been helping customers with data analytics since 2009. They have over 50 customers and have developed over 10,000 reports. Their team of certified consultants have over 15 years of experience working with technologies like IBM Cognos Analytics, IBM Planning Analytics, Microsoft Power BI, SSIS, SSRS, and SSAS to help customers with tasks such as reporting, visualization, data integration, loading and extracting data. They provide services like software implementation, training, consulting, and support.
PsiberTech is a customer focused technology company Head Quartered at Singapore that designs, develop and deploy Business Intelligence, Data warehouse and customized software solutions.
MetricEdge is a business intelligence tool that provides analytics and visualizations to help CIOs and IT executives make more informed decisions. It extracts, transforms and loads data from sources like Oracle and SQL Server into a data warehouse. The data is then analyzed and presented through predefined reports, dashboards, and visualizations to provide insights at different levels of granularity. MetricEdge comes pre-built with templates and data models for common ITSM modules to provide analytics on incidents, problems, changes and other IT processes. It offers a single platform for reporting and self-service analytics across different ITSM tools.
Corporate-training-for-msbi-course-in-mumbaiUnmesh Baile
Vibrant Technologies is headquarted in Mumbai,India.We are the best MSBI training provider in Navi Mumbai who provides Live Projects to students.We provide Corporate Training also.We are Best Microsoft Business Intelligence classes in Mumbai according to our students and corporators
Microsoft sql server 2008 r2 business intelligenceKlaudiia Jacome
Microsoft SQL Server 2008 R2 expands on SQL Server 2008 to make business intelligence more accessible and useful. It helps organizations empower employees to gain insight into business data and share findings securely. SQL Server 2008 R2 also aims to improve IT and developer efficiency. Key new technologies include tools for intuitive data analysis, interactive data visualization, and seamless collaboration on self-service BI solutions.
Microsoft sql server 2008 r2 business intelligenceKlaudiia Jacome
SQL Server 2008 R2 expands on capabilities introduced in SQL Server 2008 to make business intelligence more accessible and useful. It allows all employees to gain deeper insights into business data and share findings easily. For IT, it improves efficiency through tools that help oversee data quality and usage of self-service BI applications. Key technologies empower users through familiar tools while also providing management capabilities for IT.
The document provides an overview of the speaker's experience and qualifications. It lists the speaker's 7+ years of experience working with Microsoft's BI stack, current role as a MS BI Solution Architect, consulting experience, certifications including MCSA and MCTS in SQL Server, education including a BE in Computer Science and an MBA. It also provides links to the speaker's blogs and details on various SQL and BI articles authored.
Rolta OneViewTM 6.0 is a comprehensive analytics solution tailored for asset-intensive industries. It provides role-based insights and operational and business intelligence across functions like operations, assets, maintenance, and supply chain. This helps drive strategic decision making. The solution breaks down silos, provides a 360-degree enterprise view, and accelerates process improvement. It simplifies information complexity with integrated analytics across operational and business systems.
Why Java Professionals Should Learn HadoopBigClasses Com
Why java professionals should learn hadoop. Reasons to learn hadoop,job roles with hadoop,domains looking for hadoop developer,job responsibilities of hadoop,skills requires for hadoop,hadoop trends,java trends
This document outlines the content of a course on BIG DATA & HADOOP. The course is intended for developers and data warehouse professionals and will provide both lectures and hands-on experience working with Hadoop. It will cover key concepts like HDFS, MapReduce, YARN, and popular Hadoop ecosystems including Hive, Pig, HBase, Spark, and Impala. Lectures will be complemented by assignments and exercises working directly in a local virtual Hadoop cluster to gain experience administering, configuring, and troubleshooting Hadoop systems.
Why HADOOP ?
Oen-Source Implementaion Software
Massive Storage
Processing Large Amounts of Data
Fast Results
Fastest Growing Technology
Better Managemant & Analytical Applications
Simple Frame Work
Benefits of HADOOP
Quick Data Processing
Friendly Database
Low Cost
Scalability
More Data Leads to Better Insights
capturing and storing of data from every touch point in an organization
Scalable Map- MapReduce NextGeneration
Pluggable Shuffle and Pluggable Sort
Capacity Scheduler and Fair Scheduler
Hadoop Distributed File System (HDFS) snapshots
Distributed job life cycle management
Security Improvements
REST interface for communication
Universal jar
Memory and I/O efficient
Cascading support
The document discusses Informatica and provides an overview of its benefits and uses. It also outlines some common job roles in Informatica, example projects, prerequisites, and the modules covered in an Informatica training course, including data warehousing concepts, administration concepts, and developer concepts.
Informatica products and usage, informatica developer,informatica analyst,informatica powerexchange,informatica powercenter,informatica data quality,master data management,data masking,data visualization,informatica products list
Informatica PowerCenter is an ETL tool used to extract data from source systems like OLTP databases, transform it to meet business needs, and load it into data warehouses like OLAP systems. It provides capabilities for understanding, cleaning, and modifying source data as well as assigning keys and loading data into the target. Mappings in PowerCenter define the ETL process. PowerCenter has been released in multiple versions since 2002 and is used by companies to integrate and move data between different systems.
This document outlines an 8-session training course on Teradata that covers topics such as the Teradata architecture and logical design, space management, data distribution, indexing, SQL functions, join strategies, utilities, best practices, and includes hands-on exercises and a case study. The total training duration is 20 hours.
Introduction to Teradata And How Teradata WorksBigClasses Com
Watch How Teradata works with Introduction to teradata ,How Teradata Visual Explain Works,teradata database and tools,teradata database model,teradata hardware and software architecture,teradata database security,teradata storage based on primary index
Learn SAP BusinessObjects BI platform 4.1 Architecture with a neat diagram and overview, And also watch sap bo architecture business intelligence Architecture video tutorial
Watch Full Tutorial On SAP BusinessObjects BI Launch Pad,SAP BI Launch pad is a standard web Application easy to access the Crystal reports & Web Intelligence Docs
Learn How SAP BO Crystal Reports Accessing Off-line and Online From Your Portal ,Applications and Devices. Crystal Reports help to create flexible and powerful reports .watch video tutorial
SAP Business Objects Universe Designer & Introduction to Business Intelligenc...BigClasses Com
Universe is a middle layer between the database and reports that includes only required table structures to avoid burdening the database. It can generate multiple reports from a single universe. Changes to the database will impact the universe and reports, while changes to the universe only impact reports, not the database. The new release of SAP Business Objects BI 4.0 introduces native connectivity to SAP BW and SAP HANA via BICS connections for Web Intelligence reporting.
Thinking of getting a dog? Be aware that breeds like Pit Bulls, Rottweilers, and German Shepherds can be loyal and dangerous. Proper training and socialization are crucial to preventing aggressive behaviors. Ensure safety by understanding their needs and always supervising interactions. Stay safe, and enjoy your furry friends!
How to Build a Module in Odoo 17 Using the Scaffold MethodCeline George
Odoo provides an option for creating a module by using a single line command. By using this command the user can make a whole structure of a module. It is very easy for a beginner to make a module. There is no need to make each file manually. This slide will show how to create a module using the scaffold method.
How to Manage Your Lost Opportunities in Odoo 17 CRMCeline George
Odoo 17 CRM allows us to track why we lose sales opportunities with "Lost Reasons." This helps analyze our sales process and identify areas for improvement. Here's how to configure lost reasons in Odoo 17 CRM
A Strategic Approach: GenAI in EducationPeter Windle
Artificial Intelligence (AI) technologies such as Generative AI, Image Generators and Large Language Models have had a dramatic impact on teaching, learning and assessment over the past 18 months. The most immediate threat AI posed was to Academic Integrity with Higher Education Institutes (HEIs) focusing their efforts on combating the use of GenAI in assessment. Guidelines were developed for staff and students, policies put in place too. Innovative educators have forged paths in the use of Generative AI for teaching, learning and assessments leading to pockets of transformation springing up across HEIs, often with little or no top-down guidance, support or direction.
This Gasta posits a strategic approach to integrating AI into HEIs to prepare staff, students and the curriculum for an evolving world and workplace. We will highlight the advantages of working with these technologies beyond the realm of teaching, learning and assessment by considering prompt engineering skills, industry impact, curriculum changes, and the need for staff upskilling. In contrast, not engaging strategically with Generative AI poses risks, including falling behind peers, missed opportunities and failing to ensure our graduates remain employable. The rapid evolution of AI technologies necessitates a proactive and strategic approach if we are to remain relevant.
Strategies for Effective Upskilling is a presentation by Chinwendu Peace in a Your Skill Boost Masterclass organisation by the Excellence Foundation for South Sudan on 08th and 09th June 2024 from 1 PM to 3 PM on each day.
Main Java[All of the Base Concepts}.docxadhitya5119
This is part 1 of my Java Learning Journey. This Contains Custom methods, classes, constructors, packages, multithreading , try- catch block, finally block and more.
How to Fix the Import Error in the Odoo 17Celine George
An import error occurs when a program fails to import a module or library, disrupting its execution. In languages like Python, this issue arises when the specified module cannot be found or accessed, hindering the program's functionality. Resolving import errors is crucial for maintaining smooth software operation and uninterrupted development processes.
हिंदी वर्णमाला पीपीटी, hindi alphabet PPT presentation, hindi varnamala PPT, Hindi Varnamala pdf, हिंदी स्वर, हिंदी व्यंजन, sikhiye hindi varnmala, dr. mulla adam ali, hindi language and literature, hindi alphabet with drawing, hindi alphabet pdf, hindi varnamala for childrens, hindi language, hindi varnamala practice for kids, https://www.drmullaadamali.com
it describes the bony anatomy including the femoral head , acetabulum, labrum . also discusses the capsule , ligaments . muscle that act on the hip joint and the range of motion are outlined. factors affecting hip joint stability and weight transmission through the joint are summarized.
This slide is special for master students (MIBS & MIFB) in UUM. Also useful for readers who are interested in the topic of contemporary Islamic banking.
2. 2
Why MicroStrategy?
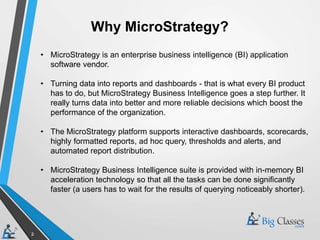
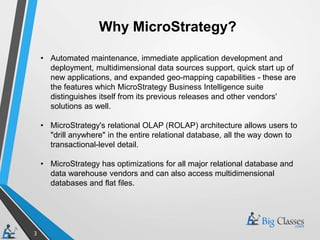
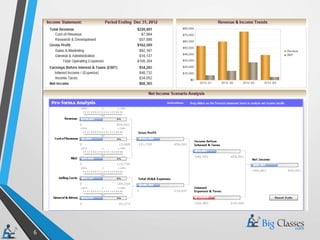
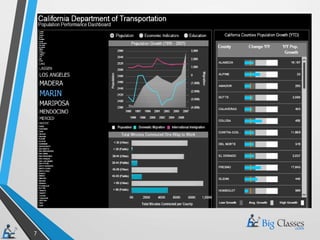
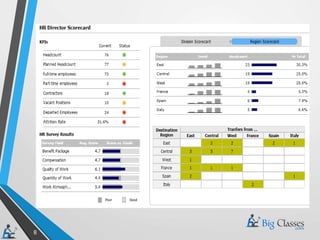
• MicroStrategy is an enterprise business intelligence (BI) application
software vendor.
• Turning data into reports and dashboards - that is what every BI product
has to do, but MicroStrategy Business Intelligence goes a step further. It
really turns data into better and more reliable decisions which boost the
performance of the organization.
• The MicroStrategy platform supports interactive dashboards, scorecards,
highly formatted reports, ad hoc query, thresholds and alerts, and
automated report distribution.
• MicroStrategy Business Intelligence suite is provided with in-memory BI
acceleration technology so that all the tasks can be done significantly
faster (a users has to wait for the results of querying noticeably shorter).
3. 3
Why MicroStrategy?
• Automated maintenance, immediate application development and
deployment, multidimensional data sources support, quick start up of
new applications, and expanded geo-mapping capabilities - these are
the features which MicroStrategy Business Intelligence suite
distinguishes itself from its previous releases and other vendors'
solutions as well.
• MicroStrategy's relational OLAP (ROLAP) architecture allows users to
"drill anywhere" in the entire relational database, all the way down to
transactional-level detail.
• MicroStrategy has optimizations for all major relational database and
data warehouse vendors and can also access multidimensional
databases and flat files.