1. What is probability?
Probability is a numerical measure of the likelihood that an event will occur. Thus, probabilities can be used as
measures of the degree of uncertainty associated with the events.If probabilities are available, we can determine the
likelihood of each event occurring.
Probability values are always assigned on a scale from 0 to 1. A probability near zero indicates an event is unlikely to
occur; a probability near 1 indicates an event is almost certain to occur. Other probabilities between 0 and 1 represent
degrees of likelihood that an event will occur.
The probability of any event E is represented by the symbol P(E) and the symbol is read as “P of E” or as “the
probability of event E.” P(E) is a real number between zero and one as indicated in the following inequality:
The sum of the probabilities for all the simple events ofan experiment must equal one. That is, if E1 , E2 , . . . , E,are
the simple events for an experiment, then the following equality must be true:
P(E1) + P(E2) + . . . + P(En) = 1
P(S) = 1 It states that the probability that some outcome in the sample space will occur is one.
EXPERIMENT, OUTCOMES, AND SAMPLE SPACE
An experiment is any operation or procedure whose outcomes cannot be predicted with certainty. The set of all
possible outconies for an experiment is called the sample space for the experiment.
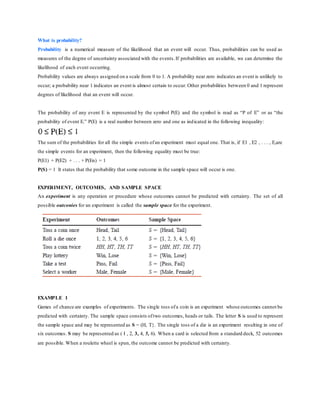
EXAMPLE 1
Games of chance are examples of experiments. The single toss ofa coin is an experiment whose outcomes cannot be
predicted with certainty. The sample space consists oftwo outcomes, heads or tails. The letter S is used to represent
the sample space and may be represented as S = (H, T}. The single toss of a die is an experiment resulting in one of
six outcomes. S may be represented as ( I , 2, 3, 4, 5, 6). When a card is selected from a standard deck, 52 outcomes
are possible. When a roulette wheel is spun, the outcome cannot be predicted with certainty.
2. EXAMPLE 2
When a quality control technician selects an item for inspection from a production line, it may be classified as defective
or nondefective.The sample space may be represented by S = (D, N}. When the blood type of a patient is determined,
the sample space may be represented as S = (A, AB, B, 0) .
EVENTS, SIMPLE EVENTS, AND COMPOUND EVENTS
An event is a subset ofthe sample space consisting ofat least one outcome from the sample space.If the event consists
of exactly one outcome, it is called a simple event. If an event consists of more than one outcome, it is called a
compound event.
EXAMPLE 3
A quality controltechnician selects two computer mother boards and classifies each as defective ornondefective. The
sample space may be represented as S = {NN, ND, DN, DO], where D represents a defective unit and N represents a
nondefective unit. Let A represent the event that neither unit is defective and let B represent the event that at least one
of the units is defective. A = { NN} is a simple event and B = {ND, DN, DD) is a compound event. Figure 4-3 is a
Venn Diagram representation of the sample space S and the events A and B. In a Venn diagram, the sample space is
usually represented by a rectangle and events are represented by circles within the rectangle.
CLASSICAL, RELATIVE FREQUENCY, AND SUBJECTIVE PROBABILITY
DEFINITIONS
The classical definition of probability is appropriate when all outcomes of an experiment are equally likely. For an
experiment consisting ofn outcomes, the classical definition of probability assigns probability 1/n to each outcome or
simple event. For an event E consisting of k outcomes, the probability of event E is given by formula
EXAMPLE 4
The experiment of selecting one card randomly from a standard deck of cards has 52 equally likely outcomes. The
event A1 = (club) has probability 13/52, since A1, consists of13 outcomes. The event A2 = {red card) has probability
3. 26/52, since A2 consists of 26 outcomes. The event A3 = { face card (Jack, Queen, King)} has probability 12/52,
since A3 consists of 12 outcomes.
The classical definition of probability is not always appropriate in computing probabilities of events. If a
coin is bent, heads and tails are not equally likely outcomes. If a die has been loaded, each of the six faces
do not have probability of occurrence equalto 1/6.For experiments not having equally likely outcomes, the
relative frequertcy definition of probability is appropriate. The relative frequency definition of probability
states that if an experiment is performed n times, and if event E occurs f times, then the probability of event
E is given by formula 𝑃( 𝐸) =
𝑓
𝑛
EXAMPLE
A bent coin is tossed 50 times and a head appears on 35 of the tosses. The relative frequency definition of probability
assigns the probability 35/50 = .70 to the event that a head occurs when this coin is tossed.
A loaded die is tossed 75 times and the face “6” appears 15 times in the 75 tosses.The relative frequency definition
of probability assigns the probability 15/75= .20 to the event that the face “6” will appear when this die is tossed.
EXAMPLE
A study by the state of Province 1 found that when 750 drivers were randomly stopped 471 were found to be wearing
seat belts. The relative frequency probability that a driver wears a seat belt in Province 1 is 471/750I = 0.63.
There are many circumstances where neither the classical definition nor the relative frequency definition of probability
is applicable. The subjective definition of probability utilizes intuition, experience, and collective wisdom to assign a
degree of belief that an event will occur. This method of assigning probabilities allows for several different
assignments of probability to a given event.
EXAMPLE
A medical doctor tells a patient with a newly diagnosed cancerthat the probahility of successfully treating the cancer
is 90%. The doctoris assigning a subjective probability of .90 to the event that the cancer can be successfully treated.
The probability for this event cannot be determined by eitherthe classical definition or the relative frequency definition
of probability.
MUTUALLY EXCLUSIVE EVENTS
Two or more events are said to be mutually exclusive if the events do not have any outcomes in common. They are
events that cannot occurtogether.If A and B are mutually exclusive events then the joint probability of A and B equals
zero, that is, P(A and B) = 0. A Venn diagram representation of two mutually exclusive events is shown in figure.
4. EXAMPLE
An experiment consists in observing the gender of two randomly selected individuals. The event, A, that both
individuals are male and the event, B, that both individuals are female are mutually exclusive since if both are male,
then both cannot be female and P(A and B) = 0.
EXAMPLE
Let event A be the event that an employee at a large company is a white collar worker and let B be the event that an
employee is a blue collar worker. Then A and B are mutually exclusive since an employee cannot be both a blue collar
worker and a white collar worker and P(A and B) = 0.
![EXAMPLE 2
When a quality control technician selects an item for inspection from a production line, it may be classified as defective
or nondefective.The sample space may be represented by S = (D, N}. When the blood type of a patient is determined,
the sample space may be represented as S = (A, AB, B, 0) .
EVENTS, SIMPLE EVENTS, AND COMPOUND EVENTS
An event is a subset ofthe sample space consisting ofat least one outcome from the sample space.If the event consists
of exactly one outcome, it is called a simple event. If an event consists of more than one outcome, it is called a
compound event.
EXAMPLE 3
A quality controltechnician selects two computer mother boards and classifies each as defective ornondefective. The
sample space may be represented as S = {NN, ND, DN, DO], where D represents a defective unit and N represents a
nondefective unit. Let A represent the event that neither unit is defective and let B represent the event that at least one
of the units is defective. A = { NN} is a simple event and B = {ND, DN, DD) is a compound event. Figure 4-3 is a
Venn Diagram representation of the sample space S and the events A and B. In a Venn diagram, the sample space is
usually represented by a rectangle and events are represented by circles within the rectangle.
CLASSICAL, RELATIVE FREQUENCY, AND SUBJECTIVE PROBABILITY
DEFINITIONS
The classical definition of probability is appropriate when all outcomes of an experiment are equally likely. For an
experiment consisting ofn outcomes, the classical definition of probability assigns probability 1/n to each outcome or
simple event. For an event E consisting of k outcomes, the probability of event E is given by formula
EXAMPLE 4
The experiment of selecting one card randomly from a standard deck of cards has 52 equally likely outcomes. The
event A1 = (club) has probability 13/52, since A1, consists of13 outcomes. The event A2 = {red card) has probability](data:image/gif;base64,R0lGODlhAQABAIAAAAAAAP///yH5BAEAAAAALAAAAAABAAEAAAIBRAA7)