What are we missing out in standard Analytics Practice? - By Novoniel Deb
•
0 likes•30 views
We believe in Analytics but why don't we get complete analytics? This article gives a simple overview on why and how of this. View my other documents in my profile.
Report
Share
Report
Share
Download to read offline

Recommended
FACTis-Business Intelligence Presentation
BI is all about making dry figures accessible & useful to the right audience within an Enterprise
Euthenics IT Services Pvt. Ltd.
306-B, Super Plaza, Sandesh Press Road, Bodakdev, Ahmedabad-380 054, Gujarat, INDIA
Tel: +91 (79) 26769094 & 40036094
Web: www.euthenicsit.com/ www.factisbi.com
Data as a Service (DaaS): The What, Why, How, Who, and When
Data as a Service (DaaS) is one of the most ambiguous offerings in the "as a service" family. Yet, in today's world, data and analytics are key to building a competitive advantage. We're clearing up the confusion around DaaS and helping your company understand when and how to tap into this service.
Key Success Factors for a Performance Dashboard
The key success factors for an effective performance dashboard include proper definition of target audiences and relevant metrics, simplicity and manageability of the dashboard, and sustained leadership through a "dashboard champion." A study of over 30 organizations found that dashboards are most effective when they have a few clearly defined metrics aligned with business objectives, support from executive leadership, and maintain a simple design that is easy to implement and use. Microsoft Excel was the most commonly used tool for dashboard development due to its accessibility, low cost, and ability to produce quick results.
TRED International - Revenue Performance Improvement
TRED is a company focused on improving revenue productivity and margins through analytics. Their platform combines internal performance data with customer experience data. The platform provides a single view of customers, analyzes resource activity and performance, provides revenue insights and analytics including forecasts and pipelines, and analyzes customer trust and advocacy. The platform is designed to help organizations improve the productivity and effectiveness of their revenue generation functions by providing data-driven insights. It captures data automatically from any source and provides customizable reports and apps to analyze performance, focus efforts, and coach teams. The goal is to help users do things right and do the right things to optimize business practices, resource utilization, and revenue growth.
Business intelligence and data warehousing at yash
Advanced enterprises compete differently. Business Intelligence and Data Warehousing technologies form the foundation that support and enable this differentiation. It’s more than just getting reports and analytics, it’s about scalability, security, robustness and enterprise grade information delivery that enable an insightful organization.
When data overwhelms e book-df
Sales operations teams help sales and marketing organizations manage large amounts of customer data and turn it into useful insights. They analyze data from key accounts to spot opportunities for value creation and share intelligence with stakeholders to enable strategic decision making. However, managing vast amounts of complex data from key accounts can be overwhelming. New technologies are needed to help operationalize key account management processes, leverage existing CRM data, and deliver the right customer-centric insights that sales teams need to strategically grow key relationships.
Proven Strategies to Leverage Your Customer Community to Grow Your Business
Find out how businesses are leveraging stronger relationship with customers to identify revenue opportunities within their customer base and create more products that their markets love. During this presentation, you’ll learn:
Why peer-to-peer communities keep more customers engaged than other channels
How to ensure your customer community serves both your customers and your business
Actionable strategies for turning the social data in your community platform into profit
Metrics to Maturity, Intelligence for Innovation: Your Value Proposition
Managing the perception of value is a key strategic initiative that solidifies the business case for further investment in an organization’s service desk. However, metrics are the key to achieving this difficult and challenging proposition. Taking a segmented approach to metrics can bring speed and relevancy to reports and dashboards by empowering the user’s data literacy and the organization’s overall strategic goals. This session will explain how correctly managing metrics for maturity can go hand-in-hand with innovation and value. Status quo BI initiatives will no longer be good enough for IT to maintain its value proposition. The IT organization should manage the user’s perception of value with business intelligence and metrics.
Business inteligence
What is Business intelligence
Core Capabilities of Business Intelligence
Elements of Business Intelligence
Why Companies opt for Business Intelligence
Benefits of Business Intelligence
User of Business Intelligence
Reports of Business Intelligence
Business Application in Extended Enterprise
Business Analytics
Golden Rules for Business Intelligence
5 Stages of Business Intelligence
Batog
What is the Business Context? What Applications are required to support the business? What Technology infrastructure is required to support the applications? What Organization structure and skills are required to implement the technology and applications? What funding and Governance are necessary to support the transformation?
Bridging the Gap from Strategy to Execution
Improving Strategy Execution through Capability Definition and Assessment. Have you even spent time and money developing a bright shiny new strategy and then just put it on the shelf because you had no plan to execute it? In this point of view, Slalom explains how Business Architecture can be used to bridge the gap from strategy to execution using capabilities based road maps that align your business and technology and point it to your strategy.
5 Steps To Measure ROI On Your Data Science Initiatives - Webinar
1. Measuring ROI from data science initiatives is challenging for many organizations as the outcomes are often not clearly defined, quantified, or attributed to the initiatives. Breaking the chain from data to insights to actions to outcomes is common.
2. A framework is presented for quantifying the value of data science initiatives using 5 steps - define success metrics, measure the metrics, attribute outcomes to causal factors, calculate net costs and benefits to determine breakeven, and benchmark results.
3. The framework is applied to a case study of a beverage manufacturer that used analytics to optimize plant costs. Key metrics like cost savings, employee productivity, and process efficiency were defined and attribution methods like A/B testing were used
Business intelligence strategy and roadmap 2018
Get Ready for 2018 with this Business Intelligence Training & Consulting . Learn more about Visual Analytics. Interactive Dashboards. Data Discovery. Mobile Analytics. Self-Service-BI. Business Analytics. Business Intelligence. Drag & Drop Reporting. Data Visualisation. Big Data Analytics.
Register for this Inhouse Training info@mr-data.nl or contact our Sr Business Intelligence Consultant Mondy Holten today mondy.holten@mr-data.nl
A marketers guide to data analytics marketing finder webinar 17 july 2013
The document discusses using data analytics to gain insights for marketing. It describes how predictive analytics can provide a competitive advantage by analyzing customer, product, transaction, and other data to predict customer behavior and optimize marketing strategies. The presentation outlines building a complete view of the customer to personalize interactions through segmentation, predictive modeling, and integrating insights into marketing decisions and interactions with customers.
Finance
PwC offers finance transformation solutions to help companies improve processes, access real-time data for decision making, and maintain compliance. Their solutions provide speed and efficiency through improved reporting, analytics for smarter decisions, financial reporting alignment, and secure access across devices. PwC's rapid deployment approach lowers costs and resource needs.
How to Leverage the Power of Data Analytics in Sales?
Data is the DNA behind the robust analytics and insights supporting modern organizations to recognize new products, determine how to serve customers better, and enhance operational efficiencies.
Implementing & Managing The Demand Signal Managment Process
Most companies have data in various sources. Often, they do nothing but store the data because it takes too much time to make sense of it all. Taking control of the data is a process, but once the building blocks are in place a true Demand Signal Management Process will support an enterprise with reliable business insights.
Solid Route Accounting For Warehouse Clients
Solid Route Accounting is a software that provides end-to-end integration for distribution companies, allowing sales reps to move through orders twice as fast, reducing administrative costs by up to 50%, and providing improved management reporting and ROI within 3 months of implementation. It addresses issues around customer site operations, warehouse management, administration, and insights. The software aims to increase productivity, reduce costs and errors, and improve profitability through features like mobile order entry, automatic pricing, inventory tracking, and comprehensive reporting.
Customer Insight Powerpoint Presentation Slides
“You can download this product from SlideTeam.net”
Analyse the human behavior trend to increase the effectiveness of products and services for the consumers. Use professionally designed content-ready Customer Insight PowerPoint Presentation Slides for the better understanding of consumer buying behavior to increase sales. Collect the required information about the customers to acquire, develop and retain customers. Incorporate ready-made customer insight PPT presentation slideshow to comprehend the customer’s choice for their favourite brand, their mindsets, motivations, moods, desires, aspirations, etc. This deck comprises of templates such as research methodology, consumer insight assumptions, need for consumer insights, key statistics, data collection and processing, consumer insight capabilities, consumer insight components, consumer insight characteristics, consumer insight key elements, YouTube analytics, google audience retention tool, google trends, google analytics, consumer insight maturity matrix, consumer engagement principles, etc. These templates are editable. Change color, text, icon, and font size as per your need. Add or remove content, if needed. Get access to the ready-made customer insight PowerPoint templates to connect the interests of the consumer with features of the brand. Advise folks on how to decide correctly with our Customer Insight Powerpoint Presentation Slides. Be able to guide the injudicious. https://bit.ly/3Bo87wP
Increase Cash Flow with Automation
What stops an order from being paid at your company?
For most, ineffecient operations that lack automation and integration for order-to-cash management are the major blockage point. In this webinar, you will learn how companies are addressing these challenges.Companies of all sizes are using an integrated approach that embeds policy, automates processes, and drives workflow with online portals for internal and external collaboration.
This new operations approach results in:
Increased Productivity of Credit Operation
Collaboration Between Credit, Sales, Customers, A/P and Treasury
Reduced Dispute Cycle Time and Volume
Mitigated Corporate Credit Risk
Improved Customer Relationships
Customer analytics. Turn big data into big value
BIRT Analytics is a customer analytics solution that allows companies to gain valuable insights from big data. It integrates data from multiple sources, analyzes large volumes of data, and provides clear and granular customer information. Tools allow users to explore data, identify patterns, profile customers, and forecast trends. Advanced analytics help optimize marketing, identify cross-sell opportunities, and understand customer behavior. The solution aims to help companies understand customer needs and adapt strategies based on real customer data.
Building your IT strategy (Housing Technology Conference 2014)
Building your IT strategy - a look at what goes into a successful IT strategy. Delivered at the Housing Technology Conference, February 27th 2014
CFO Asia Forum - July 2011, Singapore
The challenges and opportunities faced today by CFOs and Finance professionals are echoed across all industries. This presentation will help you make the most of Dynamic Analysis by showing easy-to-interpret, visually powerful KPI's in one dashboard view that includes Revenues, Profitability, Cost of Revenues, Net Revenue, SGA, Operating Income, ROI, Gross Profit %, Current Ratio, Inventory Turn, Leverage and more. All in a single view.
Break through the Analytics Barrier
The six-step guide outlines how to break through the analytics barrier and fully realize the benefits of analytics programs. The six steps are: 1) define customer experience outcomes, 2) integrate a big data infrastructure, 3) rethink the customer journey, 4) enhance insights with digital data and processes, 5) construct solutions from the customer perspective, and 6) test and measure for outcomes. Following these steps helps move analytics initiatives beyond operational reporting to enabling predictive insights that improve the customer experience.
Data Driven Transformation for Sales - SMART Territory Management
This document discusses implementing a data-driven territory management strategy to improve client engagement and sales effectiveness. It proposes identifying client needs through data analytics, creating "Client on a Page" profiles, and selecting optimal clients to contact using a "SMART" system. An initial pilot showed increased lead conversion rates, win rates, and revenue from the SMART-selected clients compared to rep-selected clients. The document recommends fully integrating the approach into systems and processes to maximize adoption and business benefits.
Building AI strategy in organizations
How to start the journey of Data science in your organizations. Find how to understand the business objectives, AI Frameworks, Methodologies and canvas models to help you depict business potential scenarios for justification.
Kickstart a Data Quality Strategy to Build Trust in Your Data
The success or failure of your data-driven business initiatives relies on your ability to trust your data. But as data volumes grow, it becomes a major challenge to understand, measure, monitor, cleanse, and govern all that data. Join this on-demand session to learn key metrics and steps you can take to kickstart a data quality strategy.
Business Intelligence Industry Perspective Session I
The document discusses business intelligence and the evolution from early manual management systems to modern performance management systems. It describes how businesses now require real-time analytics to optimize operations and gain competitive advantages. Modern business intelligence systems integrate data from various sources and use dashboards and reports to provide insights across different levels of the organization for improved decision making.
CRM Presentation - NBMDA Annual Conference
The NBMDA (North American Building Material Distributor Association) is made up of high quality distributors serving the building community. I was asked to speak about how CRM systems can be used to enhance their business and provide some advisement on how to best approach
Blueprint for CRM
The document discusses implementing a successful customer relationship management (CRM) system and outlines several key steps:
1) Establish a project team to drive specification and promote buy-in from stakeholders across the organization.
2) Analyze customer data to understand purchasing behaviors and quantify business opportunities to build a strong business case for investment.
3) Implement CRM as a business strategy supported by processes, culture, and technology to provide a unified view of customers and measure ROI.
More Related Content
What's hot
Business inteligence
What is Business intelligence
Core Capabilities of Business Intelligence
Elements of Business Intelligence
Why Companies opt for Business Intelligence
Benefits of Business Intelligence
User of Business Intelligence
Reports of Business Intelligence
Business Application in Extended Enterprise
Business Analytics
Golden Rules for Business Intelligence
5 Stages of Business Intelligence
Batog
What is the Business Context? What Applications are required to support the business? What Technology infrastructure is required to support the applications? What Organization structure and skills are required to implement the technology and applications? What funding and Governance are necessary to support the transformation?
Bridging the Gap from Strategy to Execution
Improving Strategy Execution through Capability Definition and Assessment. Have you even spent time and money developing a bright shiny new strategy and then just put it on the shelf because you had no plan to execute it? In this point of view, Slalom explains how Business Architecture can be used to bridge the gap from strategy to execution using capabilities based road maps that align your business and technology and point it to your strategy.
5 Steps To Measure ROI On Your Data Science Initiatives - Webinar
1. Measuring ROI from data science initiatives is challenging for many organizations as the outcomes are often not clearly defined, quantified, or attributed to the initiatives. Breaking the chain from data to insights to actions to outcomes is common.
2. A framework is presented for quantifying the value of data science initiatives using 5 steps - define success metrics, measure the metrics, attribute outcomes to causal factors, calculate net costs and benefits to determine breakeven, and benchmark results.
3. The framework is applied to a case study of a beverage manufacturer that used analytics to optimize plant costs. Key metrics like cost savings, employee productivity, and process efficiency were defined and attribution methods like A/B testing were used
Business intelligence strategy and roadmap 2018
Get Ready for 2018 with this Business Intelligence Training & Consulting . Learn more about Visual Analytics. Interactive Dashboards. Data Discovery. Mobile Analytics. Self-Service-BI. Business Analytics. Business Intelligence. Drag & Drop Reporting. Data Visualisation. Big Data Analytics.
Register for this Inhouse Training info@mr-data.nl or contact our Sr Business Intelligence Consultant Mondy Holten today mondy.holten@mr-data.nl
A marketers guide to data analytics marketing finder webinar 17 july 2013
The document discusses using data analytics to gain insights for marketing. It describes how predictive analytics can provide a competitive advantage by analyzing customer, product, transaction, and other data to predict customer behavior and optimize marketing strategies. The presentation outlines building a complete view of the customer to personalize interactions through segmentation, predictive modeling, and integrating insights into marketing decisions and interactions with customers.
Finance
PwC offers finance transformation solutions to help companies improve processes, access real-time data for decision making, and maintain compliance. Their solutions provide speed and efficiency through improved reporting, analytics for smarter decisions, financial reporting alignment, and secure access across devices. PwC's rapid deployment approach lowers costs and resource needs.
How to Leverage the Power of Data Analytics in Sales?
Data is the DNA behind the robust analytics and insights supporting modern organizations to recognize new products, determine how to serve customers better, and enhance operational efficiencies.
Implementing & Managing The Demand Signal Managment Process
Most companies have data in various sources. Often, they do nothing but store the data because it takes too much time to make sense of it all. Taking control of the data is a process, but once the building blocks are in place a true Demand Signal Management Process will support an enterprise with reliable business insights.
Solid Route Accounting For Warehouse Clients
Solid Route Accounting is a software that provides end-to-end integration for distribution companies, allowing sales reps to move through orders twice as fast, reducing administrative costs by up to 50%, and providing improved management reporting and ROI within 3 months of implementation. It addresses issues around customer site operations, warehouse management, administration, and insights. The software aims to increase productivity, reduce costs and errors, and improve profitability through features like mobile order entry, automatic pricing, inventory tracking, and comprehensive reporting.
Customer Insight Powerpoint Presentation Slides
“You can download this product from SlideTeam.net”
Analyse the human behavior trend to increase the effectiveness of products and services for the consumers. Use professionally designed content-ready Customer Insight PowerPoint Presentation Slides for the better understanding of consumer buying behavior to increase sales. Collect the required information about the customers to acquire, develop and retain customers. Incorporate ready-made customer insight PPT presentation slideshow to comprehend the customer’s choice for their favourite brand, their mindsets, motivations, moods, desires, aspirations, etc. This deck comprises of templates such as research methodology, consumer insight assumptions, need for consumer insights, key statistics, data collection and processing, consumer insight capabilities, consumer insight components, consumer insight characteristics, consumer insight key elements, YouTube analytics, google audience retention tool, google trends, google analytics, consumer insight maturity matrix, consumer engagement principles, etc. These templates are editable. Change color, text, icon, and font size as per your need. Add or remove content, if needed. Get access to the ready-made customer insight PowerPoint templates to connect the interests of the consumer with features of the brand. Advise folks on how to decide correctly with our Customer Insight Powerpoint Presentation Slides. Be able to guide the injudicious. https://bit.ly/3Bo87wP
Increase Cash Flow with Automation
What stops an order from being paid at your company?
For most, ineffecient operations that lack automation and integration for order-to-cash management are the major blockage point. In this webinar, you will learn how companies are addressing these challenges.Companies of all sizes are using an integrated approach that embeds policy, automates processes, and drives workflow with online portals for internal and external collaboration.
This new operations approach results in:
Increased Productivity of Credit Operation
Collaboration Between Credit, Sales, Customers, A/P and Treasury
Reduced Dispute Cycle Time and Volume
Mitigated Corporate Credit Risk
Improved Customer Relationships
Customer analytics. Turn big data into big value
BIRT Analytics is a customer analytics solution that allows companies to gain valuable insights from big data. It integrates data from multiple sources, analyzes large volumes of data, and provides clear and granular customer information. Tools allow users to explore data, identify patterns, profile customers, and forecast trends. Advanced analytics help optimize marketing, identify cross-sell opportunities, and understand customer behavior. The solution aims to help companies understand customer needs and adapt strategies based on real customer data.
Building your IT strategy (Housing Technology Conference 2014)
Building your IT strategy - a look at what goes into a successful IT strategy. Delivered at the Housing Technology Conference, February 27th 2014
CFO Asia Forum - July 2011, Singapore
The challenges and opportunities faced today by CFOs and Finance professionals are echoed across all industries. This presentation will help you make the most of Dynamic Analysis by showing easy-to-interpret, visually powerful KPI's in one dashboard view that includes Revenues, Profitability, Cost of Revenues, Net Revenue, SGA, Operating Income, ROI, Gross Profit %, Current Ratio, Inventory Turn, Leverage and more. All in a single view.
Break through the Analytics Barrier
The six-step guide outlines how to break through the analytics barrier and fully realize the benefits of analytics programs. The six steps are: 1) define customer experience outcomes, 2) integrate a big data infrastructure, 3) rethink the customer journey, 4) enhance insights with digital data and processes, 5) construct solutions from the customer perspective, and 6) test and measure for outcomes. Following these steps helps move analytics initiatives beyond operational reporting to enabling predictive insights that improve the customer experience.
Data Driven Transformation for Sales - SMART Territory Management
This document discusses implementing a data-driven territory management strategy to improve client engagement and sales effectiveness. It proposes identifying client needs through data analytics, creating "Client on a Page" profiles, and selecting optimal clients to contact using a "SMART" system. An initial pilot showed increased lead conversion rates, win rates, and revenue from the SMART-selected clients compared to rep-selected clients. The document recommends fully integrating the approach into systems and processes to maximize adoption and business benefits.
Building AI strategy in organizations
How to start the journey of Data science in your organizations. Find how to understand the business objectives, AI Frameworks, Methodologies and canvas models to help you depict business potential scenarios for justification.
Kickstart a Data Quality Strategy to Build Trust in Your Data
The success or failure of your data-driven business initiatives relies on your ability to trust your data. But as data volumes grow, it becomes a major challenge to understand, measure, monitor, cleanse, and govern all that data. Join this on-demand session to learn key metrics and steps you can take to kickstart a data quality strategy.
What's hot (19)
5 Steps To Measure ROI On Your Data Science Initiatives - Webinar
5 Steps To Measure ROI On Your Data Science Initiatives - Webinar
A marketers guide to data analytics marketing finder webinar 17 july 2013
A marketers guide to data analytics marketing finder webinar 17 july 2013
How to Leverage the Power of Data Analytics in Sales?
How to Leverage the Power of Data Analytics in Sales?
Implementing & Managing The Demand Signal Managment Process
Implementing & Managing The Demand Signal Managment Process
Building your IT strategy (Housing Technology Conference 2014)
Building your IT strategy (Housing Technology Conference 2014)
Data Driven Transformation for Sales - SMART Territory Management
Data Driven Transformation for Sales - SMART Territory Management
Kickstart a Data Quality Strategy to Build Trust in Your Data
Kickstart a Data Quality Strategy to Build Trust in Your Data
Similar to What are we missing out in standard Analytics Practice? - By Novoniel Deb
Business Intelligence Industry Perspective Session I
The document discusses business intelligence and the evolution from early manual management systems to modern performance management systems. It describes how businesses now require real-time analytics to optimize operations and gain competitive advantages. Modern business intelligence systems integrate data from various sources and use dashboards and reports to provide insights across different levels of the organization for improved decision making.
CRM Presentation - NBMDA Annual Conference
The NBMDA (North American Building Material Distributor Association) is made up of high quality distributors serving the building community. I was asked to speak about how CRM systems can be used to enhance their business and provide some advisement on how to best approach
Blueprint for CRM
The document discusses implementing a successful customer relationship management (CRM) system and outlines several key steps:
1) Establish a project team to drive specification and promote buy-in from stakeholders across the organization.
2) Analyze customer data to understand purchasing behaviors and quantify business opportunities to build a strong business case for investment.
3) Implement CRM as a business strategy supported by processes, culture, and technology to provide a unified view of customers and measure ROI.
Data Analysis.pdf
Data analysts and data scientists are becoming commonplace in most businesses nowadays and employing them on a full-time basis creates a severe financial burden to the management; this is where HLB HAMT and their data analysis professionals step in.
The Dream Team - Getting Involvement Above and Beyond Sales
The document discusses how two companies, Spherion and Ryder, implemented Salesforce to improve collaboration beyond their sales teams. Both started with a small implementation focused on data quality and key processes before expanding use. This approach drove adoption by showing tangible benefits. It resulted in greater visibility, faster processes, and improved coordination across departments for both companies.
Business Plan Webinar for Veterans
Business Plan Webinar for VeteransArkansas State University Small Business & Technology Development Center
This document provides an overview of how to write an effective business plan in 3 pages or less. It discusses the key elements that should be included such as an executive summary, company description, market analysis, management plan, and financial projections. The document emphasizes that a business plan is an organized way to evaluate all aspects of a business and can be used as a management tool and to seek financing. It provides guidance on how to address each section and examples of the type of information that should be presented.The Power of a Proper North Star Metric
The document discusses finding and leveraging a North Star Metric, which is a single metric or set of metrics that a company uses to focus on sustainable growth. It recommends that the North Star Metric be easy to understand, reflect customer value, lead to correlated growth, and be measurable. It also discusses frameworks for identifying potential North Star Metrics, such as looking at customer and business experiences, as well as reconciling brand and customer experiences to identify a metric. Finally, it notes that the North Star Metric should start with retention and the back of the funnel in mind.
Data Analysis.pptx
Most of the businesses are sitting on various types of data, which they are assessing during their business operations. But most of the time, the available data is not effectively organized or consolidated to analyze and interpret.
CRM Blueprint For NFPs
This document discusses implementing a customer relationship management (CRM) system for nonprofit organizations. It addresses key concerns around CRM implementation like data quality and buy-in. It compares CRM to legacy membership systems and outlines a customer management framework. It also provides questions to assess an organization's readiness for CRM and discusses promoting buy-in, creating a business plan, and how a consultant can help with implementation.
Business intellegence
This document discusses business intelligence (BI), including its definition as IT-enabled business decision making based on data analysis, why BI is important for making informed decisions and gaining competitive advantages, the advantages it provides organizations, key technologies that support BI like data warehousing and analytics tools, the common components of BI systems, how BI can be applied in management, stakeholders in BI systems, and an overview of data mining and the tools used.
Data analysis in uae
Data discovery, channeling data, data visualization, and problem-solving; our experts are ready to help any businesses who need assistance on big data.
Marcus Baker: People Analytics at Scale
Marcus Baker: People Analytics at Scale
People Analytics Conference 2022 Winter
Website: https://pacamp.org
Youtube: https://www.youtube.com/channel/UCeHtPZ_ZLZ-nHFMUCXY81RQ
FB: https://www.facebook.com/pacamporg
Data Analysis.pdf
Most of the businesses are sitting on various types of data, which they are assessing during their business operations.
Developing a cult of analytics
The document outlines an 8-step process for organizations to build a data-driven culture centered around web analytics. It discusses establishing urgency, gaining executive buy-in, developing a vision with analytics at the core, internal communication strategies, identifying quick wins, continuous improvement processes, and routinely using data to drive insights. Organizations should assess where they are along a 5 stage path from just starting to use analytics tools to having fully integrated data systems that continuously deliver insights.
IT Ready - DW: 1st Day
This document provides an agenda and overview for a data warehousing training session. The agenda covers topics such as data warehouse introductions, reviewing relational database management systems and SQL commands, and includes a case study discussion with Q&A. Background information is also provided on the project manager leading the training.
How A Good Customer Data Management Can Get You Better Results
Customer data management has evolved from paper records and software installed on individual computers to cloud-based systems that are easier to use and maintain. Effective customer data management provides insights into customer behavior that allow companies to better target their marketing, improve customer service, and innovate to meet customer needs. By collecting, organizing and analyzing customer data, companies can segment customers into groups with similar characteristics and develop a deeper understanding of each segment to improve business performance.
Delivering an effective customer experience dashboard
A presentation discussing the benefits of developing a customer experience dashboard to measure customer happiness and to help drive business planning and efficiency. Includes top tips when scoping and planning a dashboard project.
Power Of Data Analytics - Natasa Jukic
Presented during Data Science Conference 3.0, track Data Analytics on the second day. The conference was held in Belgrade on 20th & 21st November.
水晶易表Dashboard Webinar 20 May 2009 Print
The document discusses dashboards and how they can empower users with critical business information. It describes different types of dashboards including operational, tactical, and strategic dashboards. It also outlines key considerations for designing effective dashboards such as user requirements, visualization, and interactivity. The presentation demonstrates how Xcelsius can be used to create interactive dashboards and concludes with next steps for evaluating dashboards.
Business Intelligence-v1.pptx
Business intelligence is a tool that transforms raw data into meaningful information to help businesses make better decisions. It helps managers and executives cut costs, identify opportunities, and improve processes. While the term was coined in 1865, business intelligence has grown more powerful due to increased data collection, storage capacity, and lower storage costs. Companies now use data from various digital sources for business intelligence. It provides benefits like accelerating decision making, optimizing processes, increasing efficiency, and gaining competitive advantages. Common business intelligence software tools are used to analyze historical, current, and predictive data for purposes like performance management and benchmarking against competitors. For successful implementation, companies must have clean data, effective training, clear ROI definitions, and focus on business objectives rather than
Similar to What are we missing out in standard Analytics Practice? - By Novoniel Deb (20)
Business Intelligence Industry Perspective Session I
Business Intelligence Industry Perspective Session I
The Dream Team - Getting Involvement Above and Beyond Sales
The Dream Team - Getting Involvement Above and Beyond Sales
How A Good Customer Data Management Can Get You Better Results
How A Good Customer Data Management Can Get You Better Results
Delivering an effective customer experience dashboard
Delivering an effective customer experience dashboard
Recently uploaded
Predictably Improve Your B2B Tech Company's Performance by Leveraging Data
Harness the power of AI-backed reports, benchmarking and data analysis to predict trends and detect anomalies in your marketing efforts.
Peter Caputa, CEO at Databox, reveals how you can discover the strategies and tools to increase your growth rate (and margins!).
From metrics to track to data habits to pick up, enhance your reporting for powerful insights to improve your B2B tech company's marketing.
- - -
This is the webinar recording from the June 2024 HubSpot User Group (HUG) for B2B Technology USA.
Watch the video recording at https://youtu.be/5vjwGfPN9lw
Sign up for future HUG events at https://events.hubspot.com/b2b-technology-usa/
06-04-2024 - NYC Tech Week - Discussion on Vector Databases, Unstructured Dat...
06-04-2024 - NYC Tech Week - Discussion on Vector Databases, Unstructured Data and AI
Round table discussion of vector databases, unstructured data, ai, big data, real-time, robots and Milvus.
A lively discussion with NJ Gen AI Meetup Lead, Prasad and Procure.FYI's Co-Found
一比一原版(Dalhousie毕业证书)达尔豪斯大学毕业证如何办理
原版定制【微信:41543339】【(Dalhousie毕业证书)达尔豪斯大学毕业证】【微信:41543339】成绩单、外壳、offer、留信学历认证(永久存档真实可查)采用学校原版纸张、特殊工艺完全按照原版一比一制作(包括:隐形水印,阴影底纹,钢印LOGO烫金烫银,LOGO烫金烫银复合重叠,文字图案浮雕,激光镭射,紫外荧光,温感,复印防伪)行业标杆!精益求精,诚心合作,真诚制作!多年品质 ,按需精细制作,24小时接单,全套进口原装设备,十五年致力于帮助留学生解决难题,业务范围有加拿大、英国、澳洲、韩国、美国、新加坡,新西兰等学历材料,包您满意。
【我们承诺采用的是学校原版纸张(纸质、底色、纹路),我们拥有全套进口原装设备,特殊工艺都是采用不同机器制作,仿真度基本可以达到100%,所有工艺效果都可提前给客户展示,不满意可以根据客户要求进行调整,直到满意为止!】
【业务选择办理准则】
一、工作未确定,回国需先给父母、亲戚朋友看下文凭的情况,办理一份就读学校的毕业证【微信41543339】文凭即可
二、回国进私企、外企、自己做生意的情况,这些单位是不查询毕业证真伪的,而且国内没有渠道去查询国外文凭的真假,也不需要提供真实教育部认证。鉴于此,办理一份毕业证【微信41543339】即可
三、进国企,银行,事业单位,考公务员等等,这些单位是必需要提供真实教育部认证的,办理教育部认证所需资料众多且烦琐,所有材料您都必须提供原件,我们凭借丰富的经验,快捷的绿色通道帮您快速整合材料,让您少走弯路。
留信网认证的作用:
1:该专业认证可证明留学生真实身份
2:同时对留学生所学专业登记给予评定
3:国家专业人才认证中心颁发入库证书
4:这个认证书并且可以归档倒地方
5:凡事获得留信网入网的信息将会逐步更新到个人身份内,将在公安局网内查询个人身份证信息后,同步读取人才网入库信息
6:个人职称评审加20分
7:个人信誉贷款加10分
8:在国家人才网主办的国家网络招聘大会中纳入资料,供国家高端企业选择人才
留信网服务项目:
1、留学生专业人才库服务(留信分析)
2、国(境)学习人员提供就业推荐信服务
3、留学人员区块链存储服务
→ 【关于价格问题(保证一手价格)】
我们所定的价格是非常合理的,而且我们现在做得单子大多数都是代理和回头客户介绍的所以一般现在有新的单子 我给客户的都是第一手的代理价格,因为我想坦诚对待大家 不想跟大家在价格方面浪费时间
对于老客户或者被老客户介绍过来的朋友,我们都会适当给一些优惠。
选择实体注册公司办理,更放心,更安全!我们的承诺:客户在留信官方认证查询网站查询到认证通过结果后付款,不成功不收费!
The Building Blocks of QuestDB, a Time Series Database
Talk Delivered at Valencia Codes Meetup 2024-06.
Traditionally, databases have treated timestamps just as another data type. However, when performing real-time analytics, timestamps should be first class citizens and we need rich time semantics to get the most out of our data. We also need to deal with ever growing datasets while keeping performant, which is as fun as it sounds.
It is no wonder time-series databases are now more popular than ever before. Join me in this session to learn about the internal architecture and building blocks of QuestDB, an open source time-series database designed for speed. We will also review a history of some of the changes we have gone over the past two years to deal with late and unordered data, non-blocking writes, read-replicas, or faster batch ingestion.
一比一原版(UCSB文凭证书)圣芭芭拉分校毕业证如何办理
毕业原版【微信:176555708】【(UCSB毕业证书)圣芭芭拉分校毕业证】【微信:176555708】成绩单、外壳、offer、留信学历认证(永久存档真实可查)采用学校原版纸张、特殊工艺完全按照原版一比一制作(包括:隐形水印,阴影底纹,钢印LOGO烫金烫银,LOGO烫金烫银复合重叠,文字图案浮雕,激光镭射,紫外荧光,温感,复印防伪)行业标杆!精益求精,诚心合作,真诚制作!多年品质 ,按需精细制作,24小时接单,全套进口原装设备,十五年致力于帮助留学生解决难题,业务范围有加拿大、英国、澳洲、韩国、美国、新加坡,新西兰等学历材料,包您满意。
【我们承诺采用的是学校原版纸张(纸质、底色、纹路),我们拥有全套进口原装设备,特殊工艺都是采用不同机器制作,仿真度基本可以达到100%,所有工艺效果都可提前给客户展示,不满意可以根据客户要求进行调整,直到满意为止!】
【业务选择办理准则】
一、工作未确定,回国需先给父母、亲戚朋友看下文凭的情况,办理一份就读学校的毕业证【微信176555708】文凭即可
二、回国进私企、外企、自己做生意的情况,这些单位是不查询毕业证真伪的,而且国内没有渠道去查询国外文凭的真假,也不需要提供真实教育部认证。鉴于此,办理一份毕业证【微信176555708】即可
三、进国企,银行,事业单位,考公务员等等,这些单位是必需要提供真实教育部认证的,办理教育部认证所需资料众多且烦琐,所有材料您都必须提供原件,我们凭借丰富的经验,快捷的绿色通道帮您快速整合材料,让您少走弯路。
留信网认证的作用:
1:该专业认证可证明留学生真实身份
2:同时对留学生所学专业登记给予评定
3:国家专业人才认证中心颁发入库证书
4:这个认证书并且可以归档倒地方
5:凡事获得留信网入网的信息将会逐步更新到个人身份内,将在公安局网内查询个人身份证信息后,同步读取人才网入库信息
6:个人职称评审加20分
7:个人信誉贷款加10分
8:在国家人才网主办的国家网络招聘大会中纳入资料,供国家高端企业选择人才
留信网服务项目:
1、留学生专业人才库服务(留信分析)
2、国(境)学习人员提供就业推荐信服务
3、留学人员区块链存储服务
→ 【关于价格问题(保证一手价格)】
我们所定的价格是非常合理的,而且我们现在做得单子大多数都是代理和回头客户介绍的所以一般现在有新的单子 我给客户的都是第一手的代理价格,因为我想坦诚对待大家 不想跟大家在价格方面浪费时间
对于老客户或者被老客户介绍过来的朋友,我们都会适当给一些优惠。
选择实体注册公司办理,更放心,更安全!我们的承诺:客户在留信官方认证查询网站查询到认证通过结果后付款,不成功不收费!
End-to-end pipeline agility - Berlin Buzzwords 2024
We describe how we achieve high change agility in data engineering by eliminating the fear of breaking downstream data pipelines through end-to-end pipeline testing, and by using schema metaprogramming to safely eliminate boilerplate involved in changes that affect whole pipelines.
A quick poll on agility in changing pipelines from end to end indicated a huge span in capabilities. For the question "How long time does it take for all downstream pipelines to be adapted to an upstream change," the median response was 6 months, but some respondents could do it in less than a day. When quantitative data engineering differences between the best and worst are measured, the span is often 100x-1000x, sometimes even more.
A long time ago, we suffered at Spotify from fear of changing pipelines due to not knowing what the impact might be downstream. We made plans for a technical solution to test pipelines end-to-end to mitigate that fear, but the effort failed for cultural reasons. We eventually solved this challenge, but in a different context. In this presentation we will describe how we test full pipelines effectively by manipulating workflow orchestration, which enables us to make changes in pipelines without fear of breaking downstream.
Making schema changes that affect many jobs also involves a lot of toil and boilerplate. Using schema-on-read mitigates some of it, but has drawbacks since it makes it more difficult to detect errors early. We will describe how we have rejected this tradeoff by applying schema metaprogramming, eliminating boilerplate but keeping the protection of static typing, thereby further improving agility to quickly modify data pipelines without fear.
一比一原版(CBU毕业证)卡普顿大学毕业证如何办理
CBU毕业证offer【微信95270640】《卡普顿大学毕业证书》《QQ微信95270640》学位证书电子版:在线制作卡普顿大学毕业证成绩单GPA修改(制作CBU毕业证成绩单CBU文凭证书样本)、卡普顿大学毕业证书与成绩单样本图片、《CBU学历证书学位证书》、卡普顿大学毕业证案例毕业证书制作軟體、在线制作加拿大硕士学历证书真实可查.
如果您是以下情况,我们都能竭诚为您解决实际问题:【公司采用定金+余款的付款流程,以最大化保障您的利益,让您放心无忧】
1、在校期间,因各种原因未能顺利毕业,拿不到官方毕业证+微信95270640
2、面对父母的压力,希望尽快拿到卡普顿大学卡普顿大学毕业证成绩单;
3、不清楚流程以及材料该如何准备卡普顿大学卡普顿大学毕业证成绩单;
4、回国时间很长,忘记办理;
5、回国马上就要找工作,办给用人单位看;
6、企事业单位必须要求办理的;
面向美国乔治城大学毕业留学生提供以下服务:
【★卡普顿大学卡普顿大学毕业证成绩单毕业证、成绩单等全套材料,从防伪到印刷,从水印到钢印烫金,与学校100%相同】
【★真实使馆认证(留学人员回国证明),使馆存档可通过大使馆查询确认】
【★真实教育部认证,教育部存档,教育部留服网站可查】
【★真实留信认证,留信网入库存档,可查卡普顿大学卡普顿大学毕业证成绩单】
我们从事工作十余年的有着丰富经验的业务顾问,熟悉海外各国大学的学制及教育体系,并且以挂科生解决毕业材料不全问题为基础,为客户量身定制1对1方案,未能毕业的回国留学生成功搭建回国顺利发展所需的桥梁。我们一直努力以高品质的教育为起点,以诚信、专业、高效、创新作为一切的行动宗旨,始终把“诚信为主、质量为本、客户第一”作为我们全部工作的出发点和归宿点。同时为海内外留学生提供大学毕业证购买、补办成绩单及各类分数修改等服务;归国认证方面,提供《留信网入库》申请、《国外学历学位认证》申请以及真实学籍办理等服务,帮助众多莘莘学子实现了一个又一个梦想。
专业服务,请勿犹豫联系我
如果您真实毕业回国,对于学历认证无从下手,请联系我,我们免费帮您递交
诚招代理:本公司诚聘当地代理人员,如果你有业余时间,或者你有同学朋友需要,有兴趣就请联系我
你赢我赢,共创双赢
你做代理,可以帮助卡普顿大学同学朋友
你做代理,可以拯救卡普顿大学失足青年
你做代理,可以挽救卡普顿大学一个个人才
你做代理,你将是别人人生卡普顿大学的转折点
你做代理,可以改变自己,改变他人,给他人和自己一个机会道银边山娃摸索着扯了扯灯绳小屋顿时一片刺眼的亮瞅瞅床头的诺基亚山娃苦笑着摇了摇头连他自己都感到奇怪居然又睡到上午点半掐指算算随父亲进城已一个多星期了山娃几乎天天起得这么迟在乡下老家暑假五点多山娃就醒来在爷爷奶奶嘁嘁喳喳的忙碌声中一骨碌爬起把牛驱到后龙山再从莲塘里采回一蛇皮袋湿漉漉的莲蓬也才点多点半早就吃过早餐玩耍去了山娃的家在闽西山区依山傍水山清水秀门前潺潺流淌的蜿蜒小溪一直都是山娃和小伙伴们盛试
一比一原版(UO毕业证)渥太华大学毕业证如何办理
UO毕业证录取书【微信95270640】购买(渥太华大学毕业证成绩单硕士学历)Q微信95270640代办UO学历认证留信网伪造渥太华大学学位证书精仿渥太华大学本科/硕士文凭证书补办渥太华大学 diplomaoffer,Transcript购买渥太华大学毕业证成绩单购买UO假毕业证学位证书购买伪造渥太华大学文凭证书学位证书,专业办理雅思、托福成绩单,学生ID卡,在读证明,海外各大学offer录取通知书,毕业证书,成绩单,文凭等材料:1:1完美还原毕业证、offer录取通知书、学生卡等各种在读或毕业材料的防伪工艺(包括 烫金、烫银、钢印、底纹、凹凸版、水印、防伪光标、热敏防伪、文字图案浮雕,激光镭射,紫外荧光,温感光标)学校原版上有的工艺我们一样不会少,不论是老版本还是最新版本,都能保证最高程度还原,力争完美以求让所有同学都能享受到完美的品质服务。
文凭办理流程:
1客户提供办理信息:姓名生日专业学位毕业时间等(如信息不确定可以咨询顾问:微信95270640我们有专业老师帮你查询);
2开始安排制作毕业证成绩单电子图;
3毕业证成绩单电子版做好以后发送给您确认;
4毕业证成绩单电子版您确认信息无误之后安排制作成品;
5成品做好拍照或者视频给您确认;
6快递给客户(国内顺丰国外DHLUPS等快读邮寄)。
7完成交易删除客户资料
高精端提供以下服务:
一:渥太华大学渥太华大学毕业证文凭证书全套材料从防伪到印刷水印底纹到钢印烫金
二:真实使馆认证(留学人员回国证明)使馆存档
三:真实教育部认证教育部存档教育部留服网站可查
四:留信认证留学生信息网站可查
五:与学校颁发的相关证件1:1纸质尺寸制定(定期向各大院校毕业生购买最新版本毕,业证成绩单保证您拿到的是鲁昂大学内部最新版本毕业证成绩单微信95270640)
A.为什么留学生需要操作留信认证?
留信认证全称全国留学生信息服务网认证,隶属于北京中科院。①留信认证门槛条件更低,费用更美丽,并且包过,完单周期短,效率高②留信认证虽然不能去国企,但是一般的公司都没有问题,因为国内很多公司连基本的留学生学历认证都不了解。这对于留学生来说,这就比自己光拿一个证书更有说服力,因为留学学历可以在留信网站上进行查询!
B.为什么我们提供的毕业证成绩单具有使用价值?
查询留服认证是国内鉴别留学生海外学历的唯一途径但认证只是个体行为不是所有留学生都操作所以没有办理认证的留学生的学历在国内也是查询不到的他们也仅仅只有一张文凭。所以这时候我们提供的和学校颁发的一模一样的毕业证成绩单就有了使用价值。只硕大的蛇皮袋手里拎着长铁钩正站在门口朝黑色的屋内张望不好坏人小偷山娃一怔却也灵机一动立马仰起头双手拢在嘴边朝楼上大喊:“爸爸爸——有人找——那人一听朝山娃尴尬地笑笑悻悻地走了山娃立马“嘭的一声将铁门锁死心却咚咚地乱跳当山娃跟父亲说起这事时父亲很吃惊抚摸着山娃的头说还好醒得及时要不家早被人掏空了到时连电视也没得看啰不过父亲还是夸山娃能临危不乱随机应变有胆有谋山娃笑笑说那都是书上学的看童话和小说时多
My burning issue is homelessness K.C.M.O.
My burning issue is homelessness in Kansas City, MO
To: Tom Tresser
From: Roger Warren
Analysis insight about a Flyball dog competition team's performance
Insight of my analysis about a Flyball dog competition team's last year performance. Find more: https://github.com/rolandnagy-ds/flyball_race_analysis/tree/main
Natural Language Processing (NLP), RAG and its applications .pptx
1. In the realm of Natural Language Processing (NLP), knowledge-intensive tasks such as question answering, fact verification, and open-domain dialogue generation require the integration of vast and up-to-date information. Traditional neural models, though powerful, struggle with encoding all necessary knowledge within their parameters, leading to limitations in generalization and scalability. The paper "Retrieval-Augmented Generation for Knowledge-Intensive NLP Tasks" introduces RAG (Retrieval-Augmented Generation), a novel framework that synergizes retrieval mechanisms with generative models, enhancing performance by dynamically incorporating external knowledge during inference.
STATATHON: Unleashing the Power of Statistics in a 48-Hour Knowledge Extravag...
"Join us for STATATHON, a dynamic 2-day event dedicated to exploring statistical knowledge and its real-world applications. From theory to practice, participants engage in intensive learning sessions, workshops, and challenges, fostering a deeper understanding of statistical methodologies and their significance in various fields."
原版制作(swinburne毕业证书)斯威本科技大学毕业证毕业完成信一模一样
学校原件一模一样【微信:741003700 】《(swinburne毕业证书)斯威本科技大学毕业证》【微信:741003700 】学位证,留信认证(真实可查,永久存档)原件一模一样纸张工艺/offer、雅思、外壳等材料/诚信可靠,可直接看成品样本,帮您解决无法毕业带来的各种难题!外壳,原版制作,诚信可靠,可直接看成品样本。行业标杆!精益求精,诚心合作,真诚制作!多年品质 ,按需精细制作,24小时接单,全套进口原装设备。十五年致力于帮助留学生解决难题,包您满意。
本公司拥有海外各大学样板无数,能完美还原。
1:1完美还原海外各大学毕业材料上的工艺:水印,阴影底纹,钢印LOGO烫金烫银,LOGO烫金烫银复合重叠。文字图案浮雕、激光镭射、紫外荧光、温感、复印防伪等防伪工艺。材料咨询办理、认证咨询办理请加学历顾问Q/微741003700
【主营项目】
一.毕业证【q微741003700】成绩单、使馆认证、教育部认证、雅思托福成绩单、学生卡等!
二.真实使馆公证(即留学回国人员证明,不成功不收费)
三.真实教育部学历学位认证(教育部存档!教育部留服网站永久可查)
四.办理各国各大学文凭(一对一专业服务,可全程监控跟踪进度)
如果您处于以下几种情况:
◇在校期间,因各种原因未能顺利毕业……拿不到官方毕业证【q/微741003700】
◇面对父母的压力,希望尽快拿到;
◇不清楚认证流程以及材料该如何准备;
◇回国时间很长,忘记办理;
◇回国马上就要找工作,办给用人单位看;
◇企事业单位必须要求办理的
◇需要报考公务员、购买免税车、落转户口
◇申请留学生创业基金
留信网认证的作用:
1:该专业认证可证明留学生真实身份
2:同时对留学生所学专业登记给予评定
3:国家专业人才认证中心颁发入库证书
4:这个认证书并且可以归档倒地方
5:凡事获得留信网入网的信息将会逐步更新到个人身份内,将在公安局网内查询个人身份证信息后,同步读取人才网入库信息
6:个人职称评审加20分
7:个人信誉贷款加10分
8:在国家人才网主办的国家网络招聘大会中纳入资料,供国家高端企业选择人才
Learn SQL from basic queries to Advance queries
Dive into the world of data analysis with our comprehensive guide on mastering SQL! This presentation offers a practical approach to learning SQL, focusing on real-world applications and hands-on practice. Whether you're a beginner or looking to sharpen your skills, this guide provides the tools you need to extract, analyze, and interpret data effectively.
Key Highlights:
Foundations of SQL: Understand the basics of SQL, including data retrieval, filtering, and aggregation.
Advanced Queries: Learn to craft complex queries to uncover deep insights from your data.
Data Trends and Patterns: Discover how to identify and interpret trends and patterns in your datasets.
Practical Examples: Follow step-by-step examples to apply SQL techniques in real-world scenarios.
Actionable Insights: Gain the skills to derive actionable insights that drive informed decision-making.
Join us on this journey to enhance your data analysis capabilities and unlock the full potential of SQL. Perfect for data enthusiasts, analysts, and anyone eager to harness the power of data!
#DataAnalysis #SQL #LearningSQL #DataInsights #DataScience #Analytics
一比一原版(BCU毕业证书)伯明翰城市大学毕业证如何办理
原版定制【微信:41543339】【(BCU毕业证书)伯明翰城市大学毕业证】【微信:41543339】成绩单、外壳、offer、留信学历认证(永久存档真实可查)采用学校原版纸张、特殊工艺完全按照原版一比一制作(包括:隐形水印,阴影底纹,钢印LOGO烫金烫银,LOGO烫金烫银复合重叠,文字图案浮雕,激光镭射,紫外荧光,温感,复印防伪)行业标杆!精益求精,诚心合作,真诚制作!多年品质 ,按需精细制作,24小时接单,全套进口原装设备,十五年致力于帮助留学生解决难题,业务范围有加拿大、英国、澳洲、韩国、美国、新加坡,新西兰等学历材料,包您满意。
【我们承诺采用的是学校原版纸张(纸质、底色、纹路),我们拥有全套进口原装设备,特殊工艺都是采用不同机器制作,仿真度基本可以达到100%,所有工艺效果都可提前给客户展示,不满意可以根据客户要求进行调整,直到满意为止!】
【业务选择办理准则】
一、工作未确定,回国需先给父母、亲戚朋友看下文凭的情况,办理一份就读学校的毕业证【微信41543339】文凭即可
二、回国进私企、外企、自己做生意的情况,这些单位是不查询毕业证真伪的,而且国内没有渠道去查询国外文凭的真假,也不需要提供真实教育部认证。鉴于此,办理一份毕业证【微信41543339】即可
三、进国企,银行,事业单位,考公务员等等,这些单位是必需要提供真实教育部认证的,办理教育部认证所需资料众多且烦琐,所有材料您都必须提供原件,我们凭借丰富的经验,快捷的绿色通道帮您快速整合材料,让您少走弯路。
留信网认证的作用:
1:该专业认证可证明留学生真实身份
2:同时对留学生所学专业登记给予评定
3:国家专业人才认证中心颁发入库证书
4:这个认证书并且可以归档倒地方
5:凡事获得留信网入网的信息将会逐步更新到个人身份内,将在公安局网内查询个人身份证信息后,同步读取人才网入库信息
6:个人职称评审加20分
7:个人信誉贷款加10分
8:在国家人才网主办的国家网络招聘大会中纳入资料,供国家高端企业选择人才
留信网服务项目:
1、留学生专业人才库服务(留信分析)
2、国(境)学习人员提供就业推荐信服务
3、留学人员区块链存储服务
→ 【关于价格问题(保证一手价格)】
我们所定的价格是非常合理的,而且我们现在做得单子大多数都是代理和回头客户介绍的所以一般现在有新的单子 我给客户的都是第一手的代理价格,因为我想坦诚对待大家 不想跟大家在价格方面浪费时间
对于老客户或者被老客户介绍过来的朋友,我们都会适当给一些优惠。
选择实体注册公司办理,更放心,更安全!我们的承诺:客户在留信官方认证查询网站查询到认证通过结果后付款,不成功不收费!
Global Situational Awareness of A.I. and where its headed
You can see the future first in San Francisco.
Over the past year, the talk of the town has shifted from $10 billion compute clusters to $100 billion clusters to trillion-dollar clusters. Every six months another zero is added to the boardroom plans. Behind the scenes, there’s a fierce scramble to secure every power contract still available for the rest of the decade, every voltage transformer that can possibly be procured. American big business is gearing up to pour trillions of dollars into a long-unseen mobilization of American industrial might. By the end of the decade, American electricity production will have grown tens of percent; from the shale fields of Pennsylvania to the solar farms of Nevada, hundreds of millions of GPUs will hum.
The AGI race has begun. We are building machines that can think and reason. By 2025/26, these machines will outpace college graduates. By the end of the decade, they will be smarter than you or I; we will have superintelligence, in the true sense of the word. Along the way, national security forces not seen in half a century will be un-leashed, and before long, The Project will be on. If we’re lucky, we’ll be in an all-out race with the CCP; if we’re unlucky, an all-out war.
Everyone is now talking about AI, but few have the faintest glimmer of what is about to hit them. Nvidia analysts still think 2024 might be close to the peak. Mainstream pundits are stuck on the wilful blindness of “it’s just predicting the next word”. They see only hype and business-as-usual; at most they entertain another internet-scale technological change.
Before long, the world will wake up. But right now, there are perhaps a few hundred people, most of them in San Francisco and the AI labs, that have situational awareness. Through whatever peculiar forces of fate, I have found myself amongst them. A few years ago, these people were derided as crazy—but they trusted the trendlines, which allowed them to correctly predict the AI advances of the past few years. Whether these people are also right about the next few years remains to be seen. But these are very smart people—the smartest people I have ever met—and they are the ones building this technology. Perhaps they will be an odd footnote in history, or perhaps they will go down in history like Szilard and Oppenheimer and Teller. If they are seeing the future even close to correctly, we are in for a wild ride.
Let me tell you what we see.
一比一原版(Bradford毕业证书)布拉德福德大学毕业证如何办理
原版定制【微信:41543339】【(Bradford毕业证书)布拉德福德大学毕业证】【微信:41543339】成绩单、外壳、offer、留信学历认证(永久存档真实可查)采用学校原版纸张、特殊工艺完全按照原版一比一制作(包括:隐形水印,阴影底纹,钢印LOGO烫金烫银,LOGO烫金烫银复合重叠,文字图案浮雕,激光镭射,紫外荧光,温感,复印防伪)行业标杆!精益求精,诚心合作,真诚制作!多年品质 ,按需精细制作,24小时接单,全套进口原装设备,十五年致力于帮助留学生解决难题,业务范围有加拿大、英国、澳洲、韩国、美国、新加坡,新西兰等学历材料,包您满意。
【我们承诺采用的是学校原版纸张(纸质、底色、纹路),我们拥有全套进口原装设备,特殊工艺都是采用不同机器制作,仿真度基本可以达到100%,所有工艺效果都可提前给客户展示,不满意可以根据客户要求进行调整,直到满意为止!】
【业务选择办理准则】
一、工作未确定,回国需先给父母、亲戚朋友看下文凭的情况,办理一份就读学校的毕业证【微信41543339】文凭即可
二、回国进私企、外企、自己做生意的情况,这些单位是不查询毕业证真伪的,而且国内没有渠道去查询国外文凭的真假,也不需要提供真实教育部认证。鉴于此,办理一份毕业证【微信41543339】即可
三、进国企,银行,事业单位,考公务员等等,这些单位是必需要提供真实教育部认证的,办理教育部认证所需资料众多且烦琐,所有材料您都必须提供原件,我们凭借丰富的经验,快捷的绿色通道帮您快速整合材料,让您少走弯路。
留信网认证的作用:
1:该专业认证可证明留学生真实身份
2:同时对留学生所学专业登记给予评定
3:国家专业人才认证中心颁发入库证书
4:这个认证书并且可以归档倒地方
5:凡事获得留信网入网的信息将会逐步更新到个人身份内,将在公安局网内查询个人身份证信息后,同步读取人才网入库信息
6:个人职称评审加20分
7:个人信誉贷款加10分
8:在国家人才网主办的国家网络招聘大会中纳入资料,供国家高端企业选择人才
留信网服务项目:
1、留学生专业人才库服务(留信分析)
2、国(境)学习人员提供就业推荐信服务
3、留学人员区块链存储服务
→ 【关于价格问题(保证一手价格)】
我们所定的价格是非常合理的,而且我们现在做得单子大多数都是代理和回头客户介绍的所以一般现在有新的单子 我给客户的都是第一手的代理价格,因为我想坦诚对待大家 不想跟大家在价格方面浪费时间
对于老客户或者被老客户介绍过来的朋友,我们都会适当给一些优惠。
选择实体注册公司办理,更放心,更安全!我们的承诺:客户在留信官方认证查询网站查询到认证通过结果后付款,不成功不收费!
ViewShift: Hassle-free Dynamic Policy Enforcement for Every Data Lake
Dynamic policy enforcement is becoming an increasingly important topic in today’s world where data privacy and compliance is a top priority for companies, individuals, and regulators alike. In these slides, we discuss how LinkedIn implements a powerful dynamic policy enforcement engine, called ViewShift, and integrates it within its data lake. We show the query engine architecture and how catalog implementations can automatically route table resolutions to compliance-enforcing SQL views. Such views have a set of very interesting properties: (1) They are auto-generated from declarative data annotations. (2) They respect user-level consent and preferences (3) They are context-aware, encoding a different set of transformations for different use cases (4) They are portable; while the SQL logic is only implemented in one SQL dialect, it is accessible in all engines.
#SQL #Views #Privacy #Compliance #DataLake
一比一原版(UofS毕业证书)萨省大学毕业证如何办理
原版定制【微信:41543339】【(UofS毕业证书)萨省大学毕业证】【微信:41543339】成绩单、外壳、offer、留信学历认证(永久存档真实可查)采用学校原版纸张、特殊工艺完全按照原版一比一制作(包括:隐形水印,阴影底纹,钢印LOGO烫金烫银,LOGO烫金烫银复合重叠,文字图案浮雕,激光镭射,紫外荧光,温感,复印防伪)行业标杆!精益求精,诚心合作,真诚制作!多年品质 ,按需精细制作,24小时接单,全套进口原装设备,十五年致力于帮助留学生解决难题,业务范围有加拿大、英国、澳洲、韩国、美国、新加坡,新西兰等学历材料,包您满意。
【我们承诺采用的是学校原版纸张(纸质、底色、纹路),我们拥有全套进口原装设备,特殊工艺都是采用不同机器制作,仿真度基本可以达到100%,所有工艺效果都可提前给客户展示,不满意可以根据客户要求进行调整,直到满意为止!】
【业务选择办理准则】
一、工作未确定,回国需先给父母、亲戚朋友看下文凭的情况,办理一份就读学校的毕业证【微信41543339】文凭即可
二、回国进私企、外企、自己做生意的情况,这些单位是不查询毕业证真伪的,而且国内没有渠道去查询国外文凭的真假,也不需要提供真实教育部认证。鉴于此,办理一份毕业证【微信41543339】即可
三、进国企,银行,事业单位,考公务员等等,这些单位是必需要提供真实教育部认证的,办理教育部认证所需资料众多且烦琐,所有材料您都必须提供原件,我们凭借丰富的经验,快捷的绿色通道帮您快速整合材料,让您少走弯路。
留信网认证的作用:
1:该专业认证可证明留学生真实身份
2:同时对留学生所学专业登记给予评定
3:国家专业人才认证中心颁发入库证书
4:这个认证书并且可以归档倒地方
5:凡事获得留信网入网的信息将会逐步更新到个人身份内,将在公安局网内查询个人身份证信息后,同步读取人才网入库信息
6:个人职称评审加20分
7:个人信誉贷款加10分
8:在国家人才网主办的国家网络招聘大会中纳入资料,供国家高端企业选择人才
留信网服务项目:
1、留学生专业人才库服务(留信分析)
2、国(境)学习人员提供就业推荐信服务
3、留学人员区块链存储服务
→ 【关于价格问题(保证一手价格)】
我们所定的价格是非常合理的,而且我们现在做得单子大多数都是代理和回头客户介绍的所以一般现在有新的单子 我给客户的都是第一手的代理价格,因为我想坦诚对待大家 不想跟大家在价格方面浪费时间
对于老客户或者被老客户介绍过来的朋友,我们都会适当给一些优惠。
选择实体注册公司办理,更放心,更安全!我们的承诺:客户在留信官方认证查询网站查询到认证通过结果后付款,不成功不收费!
Recently uploaded (20)
Predictably Improve Your B2B Tech Company's Performance by Leveraging Data
Predictably Improve Your B2B Tech Company's Performance by Leveraging Data
06-04-2024 - NYC Tech Week - Discussion on Vector Databases, Unstructured Dat...
06-04-2024 - NYC Tech Week - Discussion on Vector Databases, Unstructured Dat...
The Building Blocks of QuestDB, a Time Series Database
The Building Blocks of QuestDB, a Time Series Database
End-to-end pipeline agility - Berlin Buzzwords 2024
End-to-end pipeline agility - Berlin Buzzwords 2024
Analysis insight about a Flyball dog competition team's performance
Analysis insight about a Flyball dog competition team's performance
Natural Language Processing (NLP), RAG and its applications .pptx
Natural Language Processing (NLP), RAG and its applications .pptx
STATATHON: Unleashing the Power of Statistics in a 48-Hour Knowledge Extravag...
STATATHON: Unleashing the Power of Statistics in a 48-Hour Knowledge Extravag...
Global Situational Awareness of A.I. and where its headed
Global Situational Awareness of A.I. and where its headed
ViewShift: Hassle-free Dynamic Policy Enforcement for Every Data Lake
ViewShift: Hassle-free Dynamic Policy Enforcement for Every Data Lake
What are we missing out in standard Analytics Practice? - By Novoniel Deb
- 1. What are we missing out in standard Analytics Practice? By: Novoniel Deb
- 2. Data and business transactions Products/ Services Employees Cash FlowCustomers A huge potential of business data Marketing Support Feedback Sales Expertise HR Skills Rewards Rewards Work Management Resource ManagementDelivery Billing Payables Receivables Stock Logistics Retail Social Media Over Draft Interest Project CRMMarketing SCM HRMS Finance / Accounting Projects RetailCustomer Feedback and Support Admin Admin Stores / Delivery Purchase So what we see here?So what we see here?So what we see here?So what we see here? Isolated applications / tools managing their own data Limited correlated data between separate platforms And of course separate heads and owners of those sections focusing only on their transactions
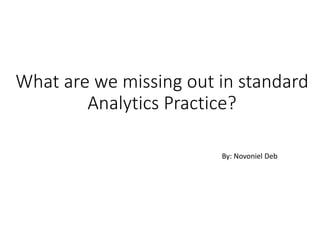
- 3. Standard Analytics Practise Focusing on onlyFocusing on onlyFocusing on onlyFocusing on only certain datacertain datacertain datacertain data points and factorspoints and factorspoints and factorspoints and factors and statistics overand statistics overand statistics overand statistics over themthemthemthem So what’sSo what’sSo what’sSo what’s missing?missing?missing?missing? Many of the missed out fields has the potential to give insight on the impact and affect that they can make on the Independent data points Business and department owners are too busy with making sales and management. For them the insight on key information is sufficient So how do we help the business into making them believe and make the missing information part of their daily insights and actions?....see the next slide Insight of business data through KPIs and reports related to Key Focus Areas corresponding to pain areas and control points In this we start with one business process/departmen t/area and deploy the Analytics based on the exact need stated by users Starts with One per department/b iz section Grows to multiple dashboard per department / biz section Sone day we build and deliver some consolidated dashboards, tagging them with words like 360 degree view This seems to be a perfect way ofThis seems to be a perfect way ofThis seems to be a perfect way ofThis seems to be a perfect way of Analytics practise where we keep onAnalytics practise where we keep onAnalytics practise where we keep onAnalytics practise where we keep on collecting requirement as per businesscollecting requirement as per businesscollecting requirement as per businesscollecting requirement as per business pain / focus areas and keep deployingpain / focus areas and keep deployingpain / focus areas and keep deployingpain / focus areas and keep deploying dashboards to help management takedashboards to help management takedashboards to help management takedashboards to help management take corrective and better decisioncorrective and better decisioncorrective and better decisioncorrective and better decision We miss out many data points while the data flows from on transaction system to the another (at many points they don’t even flow)
- 4. How? Gather requirements of business users whenever they ask for Mine the data related to the requirements Collect more insights on the data sets with other impacting data points and share with the business users Build and deploy the analytics dashboards for the business users containing additional insights Do study and research for including other potential data points and inform the management to get them captured Analyse the impact of the dashboards on business Mine other data sets Collect the potential insights which are missed out. Share with the business users to make them use those Make this aMake this aMake this aMake this a practicepracticepracticepractice,,,, iiiinnnnssssttttiiiittttuuuuttttiiiioooonnnnaaaalllliiiizzzzeeee tttthhhheeeemmmm Here I am not even talking about forecasting, Big Data etc. Those are required but first we need to standardize few things